molecular docking and 3d-qsar studies of yersinia protein tyrosine phosphatase yoph inhibitors
TRANSCRIPT

Bioorganic & Medicinal Chemistry 13 (2005) 1101–1109
Molecular docking and 3D-QSAR studies of Yersiniaprotein tyrosine phosphatase YopH inhibitors
Xin Hu and C. Erec Stebbins*
Laboratory of Structural Microbiology, The Rockefeller University, 1230 York Avenue, New York, NY 10021, USA
Received 7 September 2004; revised 9 November 2004; accepted 15 November 2004
Available online 8 December 2004
Abstract—Three-dimensional quantitative structure–activity relationship (QSAR) studies were conducted on two classes of recentlyexplored compounds with known YopH inhibitory activities. Docking studies were employed to position the inhibitors into theYopH active site to determine the probable binding conformation. Good correlations between the predicated binding free energiesand the inhibitory activities were found for two subsets of phosphate mimetics: a-ketocarboxylic acid and squaric acid (R2 = 0.70and 0.68, respectively). The docking results also provided a reliable conformational alignment scheme for 3D-QSAR modeling.Comparative molecular field analysis (CoMFA) and comparative molecular similarity indices analysis (CoMSIA) were performedbased on the docking conformations, giving q2 of 0.734 and 0.754 for CoMFA and CoMSIA models, respectively. The 3D-QSARmodels were significantly improved after removal of an outlier (q2 = 0.829 for CoMFA and q2 = 0.837 for CoMSIA). The predictiveability of the models was validated using a set of compounds that were not included in the training set. Mapping the 3D-QSARmodels to the active site of YopH provides new insight into the protein–inhibitor interactions for this enzyme. These results shouldbe applicable to the prediction of the activities of new YopH inhibitors, as well as providing structural implications for designingpotent and selective YopH inhibitors as antiplague agents.� 2004 Elsevier Ltd. All rights reserved.
1. Introduction
Yersinia spp. are causative agents of human bacterialdiseases ranging from gastrointestinal syndromes tothe plague.1 The Yersinia genus utilizes a type III secre-tion machinery to translocate virulence proteins, re-ferred to as Yops (Yersinia Outer Proteins), into thecytosol of the host cell.2,3 One of these virulence factors,YopH, is an essential determinant for Yersinia pathoge-nicity.4,5 YopH belongs to the family of protein tyrosinephosphatases (PTPs). Two of the major cellular targetsof YopH have been identified as the focal adhesion ki-nase (FAK) and the focal adhesion protein p130Cas.6
Upon translocation into host cell, YopH acts on thepTyr-containing protein targets to disrupt the normalcytoskeletal structure and regulate numerous cellularfunctions.7,8
PTPs represent an important class of drug targets for awide variety of diseases including cancer, diabetes,immune-related diseases, and infection.9,10 YopH has
0968-0896/$ - see front matter � 2004 Elsevier Ltd. All rights reserved.
doi:10.1016/j.bmc.2004.11.026
Keywords: YopH inhibitors; Docking; 3D-QSAR; CoMFA; CoMSIA.* Corresponding author. Tel.: +1 212 327 7190; fax: +1 212 327
7191; e-mail: [email protected]
recently emerged as a therapeutic target of interestdue to its status as an essential virulence determinantin a weaponized organism.11–13 A number of com-pounds have been discovered to inhibit the activity ofYopH.14–16 Progress has recently made on the develop-ment of highly potent and specific YopH inhibitors,offering promise in finding effective drug candidates thatmay serve as a novel class of antibacterial agents thattarget virulence.17–20
We previously reported a comparative docking study ofYersinia PTP YopH and Salmonella PTP SptP with re-spect to the eukaryotic PTP1B, aimed at identifyingstructural features in bacterial PTPs that can be usedfor structure-based drug design.21 In this paper, we re-port a 3D-QSAR analysis on YopH inhibitors in orderto seek new insights into the relationship between thestructural information and the inhibitory potency. Theprobable binding conformations of YopH inhibitorswere determined using a flexible docking approach.Highly reliable comparative molecular field analysis(CoMFA) and comparative molecular similarity indicesanalysis (CoMSIA) models were derived based on thebinding conformations in the active site of YopH. Thecomparisons of 3D-QSAR models with the 3D topologyof YopH structure provide insight into the molecular

1102 X. Hu, C. E. Stebbins / Bioorg. Med. Chem. 13 (2005) 1101–1109
basis of protein–inhibitor interactions, and are therebyuseful in the development of novel and selective inhibi-tors for YopH.
2. Results and discussion
2.1. Molecular docking
2.1.1. Binding conformations of YopH inhibitors. Thirty-nine YopH inhibitors were selected from Seto�s group(Table 1).14,15,19,20 The compounds belong to two differ-ent chemical classes of phosphate mimetics: a-ketocarb-oxylic acid and squaric acid.10 In order to determine theprobable binding conformations of these YopH inhibi-tors, the program AutoDock 3.022 was used to dockall compounds into the active site of the target protein.The docking reliability was validated using the knownX-ray structure of YopH in complex with a small mole-cular ligand (PDB entry 1PA9, Fig. 1A).18 The ligand p-nitrocatechol (pCNS) was re-docked to the binding siteof protein employing the LGA algorithm,22 and thedocked conformation corresponding to the lowest freeenergies was selected as the most probable binding con-formation. The root-mean-square deviation (RMSD) ofthe docked conformation to the experimental conforma-tion was 0.45A, suggesting a high docking reliability ofAutoDock in reproducing the experimentally observedbinding mode for YopH inhibitors.
All selected compounds were docked into the active siteof YopH using the same protocol. Figure 1B shows the39 compounds docked into the binding site, providing awell-defined binding mode of YopH inhibitors, as weobserved in a previous study.21 Firstly, all inhibitorsare characterized with a phosphate mimetic (a-ketocarb-oxylic acid or squaric acid) that is inserted into the pTyrcatalytic binding pocket. Figure 1C and D depict thetwo different phosphate mimetics interacting with theresidues of P-loop and WPD loop in the catalytic bind-ing pocket. These interactions are well conserved andplay a crucial role in ligand binding. Secondly, all inhib-itors share a common aromatic structure that partici-pates in a p–p stacking interaction with residuePhe229. Residues Arg230 and Asp231 form a chargedregion that contributes to inhibitory potency as well asselectivity. Thirdly, as observed in PTP1B, YopH pos-sesses a second phosphate binding site that allows simul-taneous interactions of an inhibitor at both the activesite and an adjacent peripheral site to achieve high po-tency and selectivity of inhibition.21
2.1.2. The prediction of binding free energies. An impor-tant application of AutoDock in structure-based drugdesign is to predict the binding free energies while deter-mining the binding conformation of an inhibitor in theactive site. The scoring reliability of AutoDock was eval-uated by correlating the predicted binding free energieswith the experimental inhibitory activities for the 39YopH inhibitors. The squared correlation coefficient (R2)is 0.41 with a standard error (SE) of 1.34 (Eq. 1). Thisvalue is generally lower than that observed in othersimilar studies.21,23 Since the phosphate mimetics of
YopH inhibitors dominate the binding at the catalyticbinding pocket, it could be argued that the predictedbinding free energies for the compounds bearing thesame phosphate mimetic would be more correlated withthe experimental data than that of combined data set.We therefore evaluated the correlations of the two clas-ses of YopH inhibitors separately. As expected, the cor-relations within the subset were improved remarkably.The R2 was increased to 0.70 for the a-ketocarboxylicacid and 0.68 for the squaric acid (Eqs. 2 and 3).
� log IC50 ¼ �0:6635� 0:4855� DG
ðn ¼ 39; R2 ¼ 0:409; SE ¼ 1:335Þð1Þ
a-ketocarboxylic acid:
� log IC50 ¼ �5:8573� 0:9624� DG
ðn ¼ 25; R2 ¼ 0:703; SE ¼ 0:759Þð2Þ
squaric acid:
� log IC50 ¼ �6:7618� 1:38� DG
ðn ¼ 14; R2 ¼ 0:683; SE ¼ 0:202Þð3Þ
In addition, as shown in Figure 2, compound C17 obvi-ously deviates from other members of the a-ketocarb-oxylic acid compounds. In fact, compared to otherstructurally similar compounds in the a-ketocarboxylicacid group, C17 appears to have a higher activity thanexpected. Omission of this outlier increased the R2 to0.82 for the series of a-ketocarboxylates. The better cor-relations within the two classes of YopH inhibitors sug-gest that the binding of a-ketocarboxylic acid andsquaric acid in the conserved catalytic binding pocketof YopH is likely different. The predicted binding freeenergies of the a-ketocarboxylic acid are �1.0kcal/mollower than that of the squaric acid in general (Fig. 2).This is most probably because the electrostatic interac-tions of the negatively charged a-ketocarboxylic acidin the catalytic pocket, especially with the positivecharged residue Arg409, appear much stronger than thatof the neutral phosphate mimetic squaric acid.
2.2. 3D-QSAR studies
2.2.1. CoMFA analysis. CoMFA analysis was performedbased on the conformational alignment obtained fromthe docking of 35 compounds (four compounds were se-lected as test set for model validation). To derive a pre-dictive relationship model, analysis was conducted bycorrelating variations in the biological activities of thedifferent inhibitors with variations in their CoMFAfields using the partial least squares (PLS) method.The results of CoMFA analysis are summarized inTable 2. PLS analysis yielded a high cross-validatedcorrelation coefficient q2 of 0.734 with standard errorof prediction SEP of 0.693. The non-cross-validatedPLS analysis gave a conventional r2 of 0.914 with SEof 0.414. These values indicate a good statistical correla-tion and reasonable predictability of the CoMFAmodel. The steric field descriptors explain 60% of thevariance, while the electrostatic descriptors explain40%. Analysis on the two classes of a-ketocarboxylicacid and squaric acid separately did not show any

Table 1. Structures and inhibitory activities of 39 YopH inhibitors
ID Structure pIC50a
C1
OOH
O
2.57
C2
O
N+O
O
O
OH2.57
C3
O
O
OH
O
MeO2.64
C4
O
CO2HO
OH2.82
C5
O
O
OHMeO
MeO
2.77
C6
OOH
OOH
3.70
C7b
O
O
OHF
F
FFF
3.10
C8
NH
O
O
OH
3.41
C9
O
O
OH 3.72
C10
O
O
OH
MeO
3.82
C11O
HO
OH
2.26
C12O
HO
OH
2.31
C13
OH
O
OH 2.48
Table 1 (continued)
ID Structure pIC50a
C14O
OH2.46
C15O
HO
OHMeO
2.44
C16 S
O
O
OH 3.02
C17 O
OH
O
OH 4.57
OOH
OR=
C18
OROR
5.07
C19
OROR
5.39
C20
OR
RO
6.15
C21
OROR
OR
5.77
C22
OR
RO
O
NH 6.298
C23
OR
RO
O
NH
O
6.628
C24b
OR
RO
O
NH
O
6.178
C25
OR
RO
O
NH 6.57
(continued on next page)
X. Hu, C. E. Stebbins / Bioorg. Med. Chem. 13 (2005) 1101–1109 1103

Table 1 (continued)
O
OH
O
Ar
ID Structure pIC50a
C26 4.33
C27b
O2N4.25
C28
CN4.17
C29Me2N
4.00
C30
MeO3.72
C31H2NOC
3.64
C32CH3
3.62
C33
N
O
O Me
3.59
O
OH
O
NH
Ar
C34
O2N3.92
C35 3.46
C36 3.11
C37
CH32.92
C38b
F2.85
C39
MeO2.38
a The IC50 values were converted to ‘‘molar’’ quantities before
expressing in logarithm units.b Test set.
1104 X. Hu, C. E. Stebbins / Bioorg. Med. Chem. 13 (2005) 1101–1109
improvement with the CoMFA models, most probablybecause the samples in each data set are insufficientfor QSAR analysis. For compound C17, the CoMFA
model cannot explain the sharp increase in activity ob-served when simply replacing the phenyl ring with furan.Omission of this outlier increased q2 of the CoMFAmodel to 0.829 (SEP = 0.592) and r2 to 0.968(SE = 0.257).
The 3D-CoMFA steric contour plot is shown in Figure3A. Compound C1 is displayed in the map to assist inillustration. The CoMFA steric contours indicate thatareas in which steric bulk substituents might have afavorable (green) or disfavorable (yellow) effect on theactivity of an inhibitor. Sterically favorable green con-tours appear around the phenyl ring of compound C1,suggesting that bulky groups in this region are favoredfor higher activity. This also can be seen with com-pounds C6 and C9, in which introducing the bulkygroup of 4-methoxy, or replacing the phenyl ring withnaphthyl ring, result in a 10-fold increase of activity ascompared to C1. In contrast, there is not much of an in-crease in activity for compound C5, which bears anadditional methoxy group at the 3-position and overlapswith the sterically disfavorable yellow region. In fact,most of sterically disfavorable regions are found sur-rounding the phosphate mimetics of a-ketocarboxylicacid and squaric acid groups, which define a ratherrestricted pocket of the active site of YopH. It is note-worthy that there is an additional sterically favorablegreen region in the cavity of active site, indicating apossibility of further structural modification of thefunctional phosphate mimetics to improve the inhibitoryactivity.
Figure 3B shows the electrostatic contour map of theCoMFA model in combination with compound C21.The blue contours represent the regions where positivelycharged groups enhance the activity and red contoursindicate regions where the negatively charged groups in-crease the activity. An important feature of the CoMFAmodel is that the electrostatic contour map is dominatedby regions favorable to negative charges. Such a regionis mostly observed surrounding the a-ketocarboxylicacid and squaric acid functional mimetics in the catalyticbinding cavity, indicating that compounds with highelectron density are preferred in the active binding pock-et. This is consistent with the fact that most of mimeticsused in PTP inhibitors are negatively charged. In addi-tion, there is another red contour region contributedto the proximal a-ketocarboxylate group of compoundC21. The only blue contour region favorable to positivecharges is found in the vicinity of the phosphate mimet-ics a-ketocarboxylate and squaric group, located at thebottom of the active binding pocket.
2.2.2. CoMSIA analysis. CoMSIA analysis using steric,electrostatic, and lipophilic fields as descriptors gave amodel with q2 of 0.721 and r2 of 0.922. Omission of out-lier C17 resulted in a more robust model with q2 of 0.837and r2 of 0.973 (Table 3). The CoMSIA steric, electro-static and lipophilic fields explain variance of 29%,37%, 34%, respectively. This indicates that the hydro-phobic interaction is necessary to fully describe the fieldproperties of YopH inhibitors. Further attempts tocombine the hydrogen bond fields with the standard

Figure 1. (A) the X-ray structure of YopH in complex with ligand pCNS (PDB entry 1PA9). (B) binding conformations of docked compounds at the
active site of YopH. The molecular surface was mapped by lipophility. (C) interactions of a-ketocarboxylic acid (magenta) at the active site of YopH.
(D) interactions of squaric acid (magenta) at the active site of YopH.
Figure 2. Correlations between the experimental inhibitory activities
(�logIC50) and the predicted binding free energies (kcal/mol) by
AutoDock.
X. Hu, C. E. Stebbins / Bioorg. Med. Chem. 13 (2005) 1101–1109 1105
steric, electrostatic, and lipophilic fields did not lead toany significant improvement (q2 = 0.836, r2 = 0.978). In-deed, since hydrophobic and electrostatic interactionsdominate the inhibitor binding in YopH, the numberof correlations between the activity and the hydrogenbond field is expected to be low.
Figure 4 illustrates the CoMSIA contour maps of steric,electrostatic, and hydrophobic fields. The steric field dis-tribution of the CoMSIA model is in agreement with thefield distribution of the CoMFA model. The hydropho-bic contours show a large cyan region around the a-ketocarboxy phenyl ring of compound C22, indicatingthat hydrophobic substituents in this area are likely tolead to compounds with enhanced activity (Fig. 4A).The hydrophobic favorable region overlaps the steric re-gion. Indeed, many bulky groups in YopH inhibitors arehydrophobic. Hydrophobic disfavored white regions areembedded in the sterically disfavorable yellow regions.The electrostatic field distribution of the CoMSIA mod-el is also consistent with the CoMFA model. Negativecharge favored regions are dominant at the site of thecatalytic binding pocket and the proximal site of FDRmotif that contribute to the a-ketocarboxylate groupsof compound C21. Interestingly, a red contour region(favorable to negative charges) is present in the CoM-SIA model, mapping to the second phosphate bindingsite of YopH (Fig. 4B).
The CoMSIA model was therefore superimposed withthe 3D topology of YopH structure to gain further in-sight into the properties of the different fields. As shownin Figure 5, the field contour maps correlate well withthe environmental characteristics of the active site ofYopH. The steric and hydrophobic favored regions lie
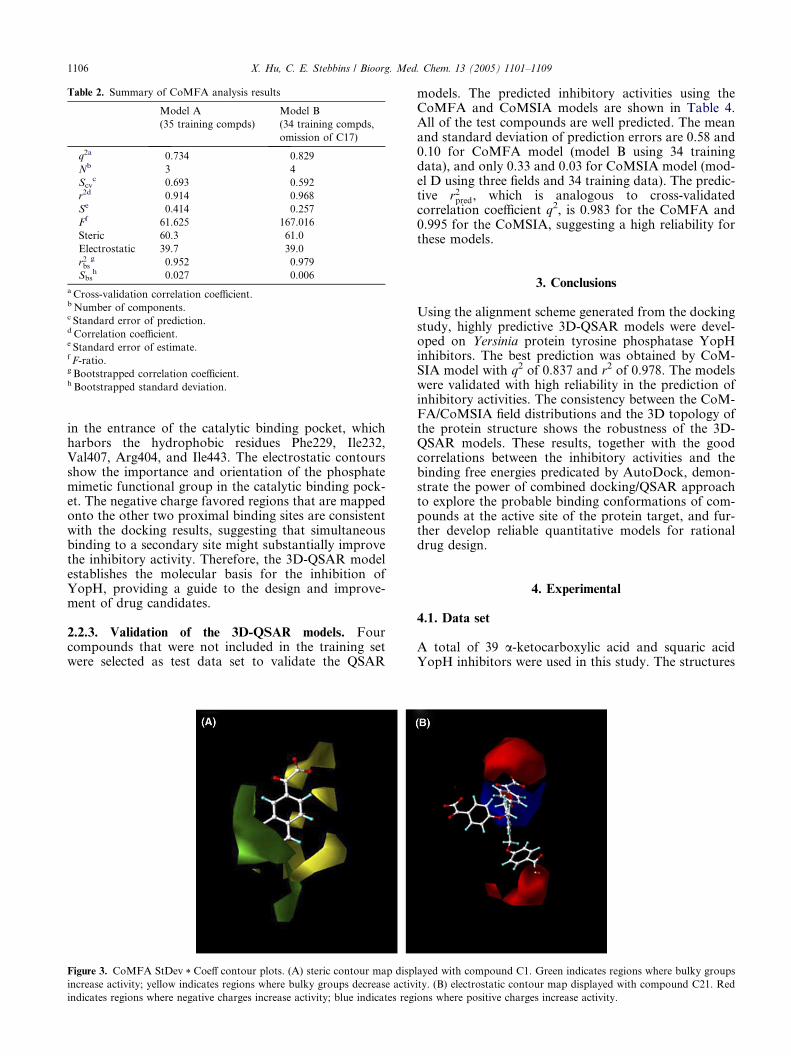
Table 2. Summary of CoMFA analysis results
Model A
(35 training compds)
Model B
(34 training compds,
omission of C17)
q2a 0.734 0.829
Nb 3 4
Scvc 0.693 0.592
r2d 0.914 0.968
Se 0.414 0.257
Ff 61.625 167.016
Steric 60.3 61.0
Electrostatic 39.7 39.0
r2bsg 0.952 0.979
Sbsh 0.027 0.006
a Cross-validation correlation coefficient.b Number of components.c Standard error of prediction.d Correlation coefficient.e Standard error of estimate.f F-ratio.g Bootstrapped correlation coefficient.h Bootstrapped standard deviation.
1106 X. Hu, C. E. Stebbins / Bioorg. Med. Chem. 13 (2005) 1101–1109
in the entrance of the catalytic binding pocket, whichharbors the hydrophobic residues Phe229, Ile232,Val407, Arg404, and Ile443. The electrostatic contoursshow the importance and orientation of the phosphatemimetic functional group in the catalytic binding pock-et. The negative charge favored regions that are mappedonto the other two proximal binding sites are consistentwith the docking results, suggesting that simultaneousbinding to a secondary site might substantially improvethe inhibitory activity. Therefore, the 3D-QSAR modelestablishes the molecular basis for the inhibition ofYopH, providing a guide to the design and improve-ment of drug candidates.
2.2.3. Validation of the 3D-QSAR models. Fourcompounds that were not included in the training setwere selected as test data set to validate the QSAR
Figure 3. CoMFA StDev * Coeff contour plots. (A) steric contour map disp
increase activity; yellow indicates regions where bulky groups decrease activ
indicates regions where negative charges increase activity; blue indicates reg
models. The predicted inhibitory activities using theCoMFA and CoMSIA models are shown in Table 4.All of the test compounds are well predicted. The meanand standard deviation of prediction errors are 0.58 and0.10 for CoMFA model (model B using 34 trainingdata), and only 0.33 and 0.03 for CoMSIA model (mod-el D using three fields and 34 training data). The predic-tive r2pred, which is analogous to cross-validatedcorrelation coefficient q2, is 0.983 for the CoMFA and0.995 for the CoMSIA, suggesting a high reliability forthese models.
3. Conclusions
Using the alignment scheme generated from the dockingstudy, highly predictive 3D-QSAR models were devel-oped on Yersinia protein tyrosine phosphatase YopHinhibitors. The best prediction was obtained by CoM-SIA model with q2 of 0.837 and r2 of 0.978. The modelswere validated with high reliability in the prediction ofinhibitory activities. The consistency between the CoM-FA/CoMSIA field distributions and the 3D topology ofthe protein structure shows the robustness of the 3D-QSAR models. These results, together with the goodcorrelations between the inhibitory activities and thebinding free energies predicated by AutoDock, demon-strate the power of combined docking/QSAR approachto explore the probable binding conformations of com-pounds at the active site of the protein target, and fur-ther develop reliable quantitative models for rationaldrug design.
4. Experimental
4.1. Data set
A total of 39 a-ketocarboxylic acid and squaric acidYopH inhibitors were used in this study. The structures
layed with compound C1. Green indicates regions where bulky groups
ity. (B) electrostatic contour map displayed with compound C21. Red
ions where positive charges increase activity.

Table 3. Summary of CoMSIA analysis results
Three fields Five fields
Model C (35 compds) Model D (34 compds) Model E (35 compds) Model F (34 compds)
q2a 0.721 0.837 0.754 0.836
Nb 3 4 3 4
Scvc 0.720 0.572 0.677 0.575
r2d 0.922 0.973 0.950 0.978
Se 0.394 0.236 0.317 0.213
Ff 68.656 199.841 109.428 246.995
Steric 29.0 30.2 17.5 20.6
Electrostatic 36.8 35.2 20.7 22.1
Hydrophobic 34.2 34.6 19.4 21.2
Donor / / 25.3 21.5
Acceptor / / 17.1 14.7
r2bsg 0.955 0.983 0.979 0.986
Sbsh 0.026 0.008 0.013 0.009
a Cross-validation correlation coefficient.b Number of components.c Standard error of prediction.d Correlation coefficient.e Standard error of estimate.f F-ratio.g Bootstrapped correlation coefficient.h Bootstrapped standard deviation.
Figure 4. CoMSIA StDev * Coeff contour plots. (A) steric (green/yellow) and hydrophobic (cyan/white) contour map combined with compound
C22. Green indicates regions where bulky groups increase activity; yellow indicates regions where bulky groups decrease activity. Cyan indicates
regions where hydrophobic substituents enhance activity; white indicates regions where hydrophobic substituents decrease activity. (B) electrostatic
contour map (red/blue) in combination with compound C21. Red indicates regions where negative charges increase activity; blue indicates regions
where positive charges increase activity.
X. Hu, C. E. Stebbins / Bioorg. Med. Chem. 13 (2005) 1101–1109 1107
and their inhibitory activities are shown in Table 1. Theinhibitory activities for YopH were measured under sim-ilar experimental conditions.14 The IC50 values wereconverted to the corresponding pIC50 (�logIC50) andused as dependent variables in the CoMFA and CoM-SIA analysis. The pIC50 values span a range of 4-logunits, providing a broad and homogeneous data setfor 3D-QSAR study. Thirty-five compounds were usedas training set and four compounds were used as testset. The test compounds were selected manually suchthat the structural diversity and wide range of activityin the data set were included.
4.2. Molecular docking
The initial structures of the 39 YopH inhibitors wereconstructed using the SYBYL 6.9SYBYL 6.9 software.24 The geome-
tries of these compounds were subsequently optimizedusing the Tripos force field. The Powell method wasused for energy minimization with an energy conver-gence gradient value of 0.001kcal/(mol A). The structureof YopH protein (PDB code 1PA9)18 was obtained fromthe Protein Data Bank.26 The hetero atoms (cofactors,water molecules, and ligands) were removed and polarhydrogens were added. The Kollman unit-atom chargeswere assigned to protein atoms using SYBYL 6.9SYBYL 6.9.
The automated molecular docking calculations werecarried out using AutoDock 3.0.22 AM1-BCC chargeswere calculated on the inhibitors employing the ante-chamber module of Amber 8.0.25 The AUTOTORSmodule of AutoDock defined the active torsions foreach docked compound. The active site of the proteinwas defined using AutoGrid. The grid size was set to

Figure 5. CoMSIA steric (green/yellow), electrostatic (red/blue), and
hydrophobic (cyan/white) fields projected in the active site of YopH.
Table 4. Observed versus predicted activities of test compounds using
CoMFA and CoMSIA models
Compounds Observed CoMFA
(model B)
CoMSIA
(model D)
C7 3.10 3.32 3.05
C24 6.17 6.26 6.29
C27 4.25 4.01 4.31
C38 2.92 2.95 2.82
Meana / 0.58 0.33
SDa / 0.10 0.03
r2predb / 0.983 0.995
aMean and standard deviation (SD) of prediction standard error
pICpred50 � pICobsd
50
� �.
b r2pred ¼ 1�P
pICobsd50 � pIC
pred50
� �2
=P
pICobsd50 � pICmean
50
� �2.
1108 X. Hu, C. E. Stebbins / Bioorg. Med. Chem. 13 (2005) 1101–1109
70 · 70 · 70 points with a grid spacing of 0.375A cen-tered at the center of mass of the ligand. The Lamarck-ian Genetic Algorithm (LGA) was used as searchmethod. Each LGA job consisted of 50 runs, and thenumber of generation in each run was 27,000 with aninitial population of 50 individuals. The maximum num-ber of energy evaluations was set to 1,000,000. Operatorweights for cross-over, mutation, and elitism were 0.80,0.02, and 1, respectively. The docking results were clus-tered by less than 1.5A in positional root-mean-squaredeviation (RMSD), and the most favorable binding con-formation with the lowest free energies was selectedwithin the top-ranked cluster.
After docking, the complexes were energetically mini-mized permitting only the inhibitor and the side-chainatoms of the protein to relax. Energy minimizationswere carried out employing SYBYL 6.9SYBYL 6.9. In each step,MMFF94 force field was applied with 0.05kcal/A con-
vergence and 5000 steps using the Powell method. Therefined binding conformations of compounds were usedfor the 3D-QSAR studies.
4.3. CoMFA analysis
The CoMFA steric and electrostatic fields werecalculated at grid lattice points with grid spacing(2.0 A) using the Lennard–Jones and the Coulomb po-tential functions of the Tripos force field. The defaultsp3 carbon atom was used as the steric probe atomand a +1.00 charge for the electrostatic probe. The en-ergy cutoff of 30kcal/mol was adopted and the stericand electrostatic fields were scaled by the CoMFA stan-dard method in SYBYLSYBYL. The regression analysis was car-ried out using the full cross-validated partial leastsquares (PLS) method (leave-one-out). The minimumcolumn filtering value was set to 3.0kcal/mol to improvethe signal-to-noise ratio by omitting those lattice pointswhose energy variation was below this threshold. Theoptimal number of components was selected to yieldthe highest cross-validated coefficient (q2) values andwas set to 5. The cross-validated coefficient q2 was calcu-lated using formula:
q2 ¼ 1�X
pICobsd50 � pIC
pred50
� �2
=X
pICobsd50 � pICmean
50
� �2
where obsd, pred, and mean refer to the observed, pre-dicted, and mean values of the pIC50, respectively.
4.4. CoMSIA analysis
As defined in SYBYLSYBYL, the five CoMSIA similarity indexfields (steric, electrostatic, lipophilic, hydrogen bonddonor, and hydrogen bond acceptor) were evaluatedat grid lattice point using a common probe atom of1A radius, as well as the charge, hydrophobicity, andhydrogen bond properties of +1. The partial leastsquares (PLS) method was used to derive a linear rela-tionship, and cross-validation was preformed using theleave-one-out method with a 3.0kcal/mol column filter.CoMSIA similarity indices (AF,K) for a molecule j withatoms i at a grid point q were computed as follow,
AqF;KðjÞ ¼ �
Xn
i¼1
W probe;kW ike�ar2iq
where Wik is the actual value of the physicochemicalproperty k of atom i, and Wprobe,k is the value of theprobe atom. A Gaussian type distance dependence wasused between the grid point q and each atom i of themolecule, where r represents the distance. The defaultvalue of 0.3 was used as the attenuation factor (a).
Acknowledgements
We thank R. Bennett, C. Pepper, A. Gazes, and G. Lat-ter of the Rockefeller University Information Technol-ogy Resource Center for computational facilities. Thiswork was funded in part by program grant1U19AI056510-01 from the National Institute of Al-lergy and Infectious Disease.

X. Hu, C. E. Stebbins / Bioorg. Med. Chem. 13 (2005) 1101–1109 1109
References and notes
1. Brubaker, R. R. Clin. Microbiol. Rev. 1991, 4, 309.2. Cornelis, G. R. Nat. Rev. Mol. Cell Biol. 2002, 3, 742.3. Ramamurthi, K. S.; Schneewind, O. Annu. Rev. Cell Dev.Biol. 2002, 18, 107.
4. Guan, K. L.; Dixon, J. E. Science 1990, 249, 553.5. Bliska, J. B.; Guan, K. L.; Dixon, J. E.; Falkow, S. Proc.Natl. Acad. Sci. U.S.A. 1991, 88, 1187.
6. Black, D. S.; Bliska, J. B. Embo J. 1997, 16, 2730.7. Juris, S. J.; Shao, F.; Dixon, J. E.Cell Microbiol. 2002, 4, 201.8. Bliska, J. B. Trends Microbiol. 2000, 8, 205.9. Harley, E. A.; Levens, N. Curr. Opin. Invest. Drugs 2003,4, 1179.
10. Zhang, Z. Y. Curr. Opin. Chem. Biol. 2001, 5, 416.11. Inglesby, T. V.; Dennis, D. T.; Henderson, D. A.; Bartlett,
J. G.; Ascher, M. S. Jama 2000, 283, 2281.12. Cohen, M. L. Nature 2000, 406, 762.13. Hawley, R. J.; Eitzen, E. M., Jr. Annu. Rev. Microbiol.
2001, 55, 235.14. Chen, Y. T.; Onaran, M. B.; Doss, C. J.; Seto, C. T.
Bioorg. Med. Chem. Lett. 2001, 11, 1935.15. Chen, Y. T.; Seto, C. T. J. Med. Chem. 2002, 45, 3946.
16. Lee, K.; Gao, Y.; Yao, Z. J.; Phan, J.; Wu, L., et al.Bioorg. Med. Chem. Lett. 2003, 13, 2577.
17. Liang, F.; Huang, Z.; Lee, S. Y.; Liang, J.; Ivanov, M. I.,et al. J. Biol. Chem. 2003, 278, 41734.
18. Sun, J. P.; Wu, L.; Fedorov, A. A.; Almo, S. C.; Zhang,Z. Y. J. Biol. Chem. 2003, 278, 33392.
19. Chen, Y. T.; Seto, C. T. Bioorg. Med. Chem. 2004, 12,3289.
20. Xie, J.; Comeau, A. B.; Seto, C. T. Org. Lett. 2004, 6, 83.21. Hu, X.; Vujanac, M.; Stebbins, C. E. J. Mol. Graph. Model
2004, 23, 175.22. Morris, G. M.; Goodsell, D. S.; Halliday, R. S.; Huey, R.;
Hart, W. E.; Belew, R. K.; Olson, A. J. J. Comput. Chem.1998, 19, 1639.
23. Hu, X.; Balaz, S.; Shelver, W. H. J. Mol. Graph. Model2004, 22, 293.
24. SYBYLSYBYL Molecular Modeling Software, v6.9; Tripos Asso-ciates, St. Louis, MO.
25. Wang, J.; Wolf, R. M.; Caldwell, J. W.; Kollman, P. A.;Case, D. A. J. Comput. Chem. 2004, 25, 1157.
26. Berman, H. M.; Westbrook, J.; Feng, Z.; Gilliland, G.;Bhat, T. N.; Weissig, H.; Shindyalov, I. N.; Bourne, P. E.Nucleic Acids Res. 2000, 28, 235.