molecular compositions and optical properties of dissolved
TRANSCRIPT

Atmos. Chem. Phys., 20, 2513–2532, 2020https://doi.org/10.5194/acp-20-2513-2020© Author(s) 2020. This work is distributed underthe Creative Commons Attribution 4.0 License.
Molecular compositions and optical properties of dissolved browncarbon in biomass burning, coal combustion, and vehicle emissionaerosols illuminated by excitation–emission matrix spectroscopyand Fourier transform ion cyclotron resonance mass spectrometryanalysisJiao Tang1,4, Jun Li1, Tao Su1,4, Yong Han2, Yangzhi Mo1, Hongxing Jiang1,4, Min Cui2,a, Bin Jiang1, Yingjun Chen2,Jianhui Tang3, Jianzhong Song1, Ping’an Peng1, and Gan Zhang1
1State Key Laboratory of Organic Geochemistry and Guangdong Key Laboratory of Environmental Protection and ResourcesUtilization, Guangzhou Institute of Geochemistry, Chinese Academy of Sciences, Guangzhou 510640, China2Department of Environmental Science and Engineering, Fudan University, Shanghai 200092, China3Key Laboratory of Coastal Environmental Processes and Ecological Remediation, Yantai Institute of Coastal Zone Research,Chinese Academy of Sciences, Yantai 264003, China4University of Chinese Academy of Sciences, Beijing 100049, Chinaanow at: School of Environmental Science and Engineering, Yangzhou University, Yangzhou 225127, China
Correspondence: Jun Li ([email protected]) and Gan Zhang ([email protected])
Received: 19 June 2019 – Discussion started: 7 August 2019Revised: 14 November 2019 – Accepted: 9 January 2020 – Published: 2 March 2020
Abstract. Brown carbon (BrC) plays an essential impacton radiative forcing due to its ability to absorb sunlight.In this study, the optical properties and molecular charac-teristics of water-soluble and methanol-soluble organic car-bon (OC; MSOC) emitted from the simulated combustionof biomass and coal fuels and vehicle emissions were in-vestigated using ultraviolet–visible (UV–vis) spectroscopy,excitation–emission matrix (EEM) spectroscopy, and Fouriertransform ion cyclotron resonance mass spectrometry (FT-ICR MS) coupled with electrospray ionization (ESI). The re-sults showed that these smoke aerosol samples from biomassburning (BB) and coal combustion (CC) had a higher massabsorption efficiency at 365 nm (MAE365) than vehicle emis-sion samples. A stronger MAE365 value was also found inMSOC than water-soluble organic carbon (WSOC), indicat-ing low polar compounds would possess a higher light ab-sorption capacity. Parallel factor (PARAFAC) analysis iden-tified six types of fluorophores (P1–6) in WSOC includingtwo humic-like substances (HULIS-1) (P1 and P6), threeprotein-like substances (PLOM) (P2, P3, and P5), and oneundefined substance (P4). HULIS-1 was mainly from ag-
ing vehicle exhaust particles; P2 was only abundant in BBaerosols; P3 was ubiquitous in all tested aerosols; P4 wasabundant in fossil burning aerosols; and P5 was more intensein fresh vehicle exhaust particles. The MSOC chromophores(six components; C1–6) exhibited consistent characteristicswith WSOC, suggesting the method could be used to indicatethe origins of chromophores. FT-ICR mass spectra showedthat CHO and CHON were the most abundant componentsof WSOC, but S-containing compounds appeared in a higherabundance in CC aerosols and vehicle emissions than BBaerosols, while considerably fewer S-containing compoundslargely with CHO and CHON were detected in MSOC. Theunique formulas of different sources in the van Krevelen(VK) diagram presented different molecular distributions. Tobe specific, BB aerosols with largely CHO and CHON had amedium H/C and low O/C ratio, while CC aerosols andvehicle emissions largely with S-containing compounds hadan opposite H/C and O/C ratio. Moreover, the light ab-sorption capacity of WSOC and MSOC was positively as-sociated with the unsaturation degree and molecular weightin the source aerosols. The above results are potentially ap-
Published by Copernicus Publications on behalf of the European Geosciences Union.
2514 J. Tang et al.: Molecular compositions and optical properties
plicable to further studies on the EEM-based or molecular-characteristic-based source apportionment of chromophoresin atmospheric aerosols.
1 Introduction
Carbonaceous aerosols play an important role in the Earth’sradiative balance. One such aerosol, black carbon (BC), ab-sorbs significant amounts of light and exerts a warming ef-fect, while organic carbon (OC) was initially thought to onlyscatter solar radiation (Wong et al., 2017; Mo et al., 2017;Saleh et al., 2014). However, recent studies show that thereare certain types of OC that absorb radiation efficiently inthe near-ultraviolet (UV) (300–400 nm) and visible ranges,which are called brown carbon (BrC). They can positivelyshift the net direct radiation forcing (DRF) (Saleh et al.,2014; Laskin et al., 2015; Kirchstetter and Thatcher, 2012).According to a simulation model, the inclusion of BrC mayenhance total aerosol absorption by 7 %–19 % (Feng et al.,2013). According to previous studies, BrC in atmosphericaerosols mainly originates from emissions from biomassburning (BB) and coal combustion (CC), vehicle exhaust,and the formation of secondary organic aerosol (SOA) (Zhuet al., 2018; Laskin et al., 2015; Xie et al., 2017; Kumar etal., 2018). Among them, primary emissions contribute sig-nificantly to BrC absorption (Fan et al., 2012; Yan et al.,2015; Zhang et al., 2011). Recently, many studies have inves-tigated the optical properties and molecular characteristicsof BrC in laboratory-simulated combustion (Budisulistioriniet al., 2017; Lin et al., 2018, 2016; Song et al., 2019) andtheir light absorption in controlled vehicle emissions (Xie etal., 2017). However, there were no available studies on thecomprehensive characteristics of BrC in various sources andtheir variations in optical and chemical information impactedby these sources. Therefore, investigating BrC in differentsources would improve our understanding of the evolution ofBrC absorption.
Excitation–emission matrix (EEM) spectroscopy can pro-vide structural information of chromophores and thus hasbeen widely applied to identify the sources and chemicalnature of chromophoric dissolved organic matter (CDOM)in aquatic environments since the 1990s (Shimabuku et al.,2017; Wells et al., 2017; Bhattacharya and Osburn, 2017;Coble, 1996). As the optical properties of chromophoricwater-soluble organic carbon (WSOC) in the atmospherewere similar to CDOM in aquatic environments (Qin et al.,2018; Fu et al., 2015; Graber and Rudich, 2006), this tech-nique could extend to atmospheric research. It has to be men-tioned that fluorescence is a radiative process that occurs be-tween two energy levels of the same multiplicity (Andrade-Eiroa et al., 2013). Generally, compounds with rigid pla-nar structures and highly conjugated systems have intrinsicfluorescence emission characteristics and are important BrC
chromophores, such as aromatic acids, phenols, nitroaro-matics, polycyclic aromatic hydrocarbons (PAHs), quinones,and so on (Lin et al., 2018; Zhang et al., 2013). In addi-tion, chromophores in fluorescence spectra could be consid-ered as a “fingerprinting” tool, especially when combiningit with parallel factor (PARAFAC) analysis, which can de-compose EEM signals into their underlying chemical compo-nents (Murphy et al., 2013). For instance, Chen et al. (2016b)observed that the water-extracted chromophores identified byPARAFAC from the urban, forest, and marine aerosols werevaried with the sampling sites and periods and were affectedby oxidative and functional groups. Lee et al. (2013) illus-trated that SOA derived from the oxidation of limonene anddecene with O3 and OH had different fluorescence spectra.Therefore, BrC characteristics from various sources may dif-fer. However, when analyzing chromophoric BrC using flu-orescence spectra, the challenges are the lack of a classifi-cation system for fluorescence spectra, to distinguish chro-mophores from most non-absorbing constituents, and to de-termine the chemical structures of the chromophores.
Fourier transform ion cyclotron resonance mass spectrom-etry (FT-ICR MS) coupled with electrospray ionization (ESI)is a powerful platform for investigating the detailed char-acteristics of organic material at the molecular level. Withthe advantage of ultrahigh resolution, the accuracy of massmeasurements, and high sensitivity (Feng et al., 2016), FT-ICR MS has been successfully used to characterize organicaerosols (Jiang et al., 2016; Song et al., 2018; Mo et al.,2018), cloud water (Zhao et al., 2013), and natural organicmatter (Sleighter et al., 2012; Feng et al., 2016). For example,a previous study has determined their molecular families ofdissolved organic matter (DOM) associated with fluorescentcomponents by using FT-ICR MS (Stubbins et al., 2014),which could provide more chemical information about chro-mophores.
Residential CC and BB emissions and motor vehicle emis-sions are significant anthropogenic sources of air pollutants,especially fine particulate matter (PM) on urban and regionalscales (Gentner et al., 2017; Yan et al., 2015; Zhang et al.,2018; Chen et al., 2015). In this study, to obtain a com-prehensive understanding of BrC originating from varioussources, ultraviolet–visible (UV–vis), EEM, and FT-ICR MSanalyses were performed for WSOC and methanol-solubleorganic carbon (MSOC) from the smoke particles of sim-ulated combustion of biomass fuels and coals and vehicleemission aerosols. Statistical analysis of PARAFAC was ap-plied to EEM spectra to resolve the fluorescent compounds.All of these and unique molecular characteristics of WSOCand MSOC were analyzed and discussed on the basis of FT-ICR MS. Relationships between optical properties and chem-ical structures were discussed by using a linear regressioncoefficient.
Atmos. Chem. Phys., 20, 2513–2532, 2020 www.atmos-chem-phys.net/20/2513/2020/

J. Tang et al.: Molecular compositions and optical properties 2515
2 Experimental methods
2.1 Sample collection and preparation
The smoke particles were collected by the instrument cou-pled with a dilution channel which was designed to simulatefire emissions representative of “real-world” open BB andhousehold CC activities (Fig. S1 in the Supplement). In thepresent study, a total of 27 BB samples (IDs1–27) were col-lected at Xishuangbanna, Yunnan, from 20 May to 3 June2016, and the detailed sampling process was described in ourprevious article (Cui et al., 2018). Briefly, raw fuels (rough20×3×2 cm3) were air-dried for several days and ignited in astainless-steel bowl, and then the rising smoke was collectedthrough a dilution system. The sampling system mainly con-sists of a dilution tunnel, a residence time chamber, three PMsamplers, and so on. Every biomass was burned three timesat about 1–2 kg of fuel per burn. Every combustion processlasted for 20 min. The collection of smoke particles startedwhen the fuel ignited, and it ended when the concentrationof CO2 was down to atmospheric CO2 level. Dilution ratiosof each experimental process were calculated using the CO2concentrations before and after dilution. The collection flowrate and average dilution ratio were 180 L min−1 and 2.1, re-spectively. And the other six BB samples (IDs 28–33) werecollected in Guangzhou, Guangdong.
The smoke particles of CC (IDs 34–50) were collected inthe same way as that of the BB experiment, but they used astove in Guangzhou, Guangdong, from 18 November 2017 to23 January 2018. The tested stove is a technically improvedstove (named Jin-Yin stove). Due to the difficulty of ignitionof coal, we used smokeless charcoal to ignite one third (about300 g) of the raw-coal chunk (2–5 cm in size) in the stove,removed the charcoal after ignition, and then added the re-maining raw-coal chunk (about 700 g) to start to collect thesmoke particles. Every coal was also burned three times atabout 1 kg of fuel per burn. Every combustion process lastedfor about 40–150 min. The collection flow rate and averagedilution ratio were 150 L min−1 and 1.5, respectively. Addi-tionally, the modified combustion efficiency (MCE) was cal-culated to characterize the relative amount of smoldering andflaming combustion phase (Lin et al., 2016; Cui et al., 2018).The average MCE value was 0.73±0.08 for CC experiments,but it was unavailable for the BB experiments because theCO sensor did not work in the field work, which was men-tioned in our previous paper (Cui et al., 2018).
Tunnel aerosols (total eight samples; IDs 51–58) were col-lected at the Siping tunnel from 1 to 2 November 2017 andthe Xiaoyang Shan tunnel from 1 to 2 December 2017, inShanghai and two vehicle exhaust particles (IDs 59–60) werecollected from the direct emission of two different trucks(more fresh aerosols). With no other instructions, we used“vehicle emissions” to represent all tunnel aerosols and ve-hicle exhaust particle samples. These filters were wrappedin aluminum foil and pre-baked at 450 ◦C for 5 h before sam-
pling and stored at−20 ◦C after sampling. Overall, there wasa total of 60 total suspended particulate (TSP) matter sam-ples on source emissions in this study, and blank samplesthat were collected at different times and locations were usedfor correcting filter samples.
WSOC for UV–vis absorption and EEM analysis were ex-tracted with purified water (resistivity of > 18.2�) via theultra sonication of quartz filter punches for 30 min. Becausewater cannot effectively extract the BrC (Liu et al., 2013;Shetty et al., 2019), the remaining filter was further freeze-dried and extracted with methanol (high-performance liquidchromatography grade; HLPC) to obtain the MSOC con-stituent for a better understanding of the optical propertiesand molecular compositions of BrC. It is worth noting thatthe MSOC in this study is not necessarily like that of thesame name in other studies. All the extracts were filteredthrough a 0.22 µm polytetrafluoroethylene membrane intoamber colored-glass vials to remove the insoluble material.
2.2 Carbon analysis
We measured both OC and elemental carbon (EC) using anaerosol carbon analyzer (Sunset Laboratory, Inc., USA), fol-lowing the National Institute for Occupational Safety andHealth (NIOSH) thermal–optical transmittance (TOT) stan-dard method (Mo et al., 2017), and the emission factors (EFs)of PM, OC, and EC were calculated, and detailed informa-tion was presented in the Supplement. We also analyzed theelements of biomass (C, H, O, and N) and coal (C, H, O,N, and S) using an elemental analyzer (Vario EL cube, El-ementar, Germany), and the results were listed in Tables S1and S2. The carbon content of WSOC was measured usingtotal organic carbon analysis (Vario TOC cube, Elementar,Germany) before acidification with phosphoric acid to re-move inorganic carbon, while the concentration of MSOCwas assessed using the method developed by a previous study(Chen et al., 2017b). Briefly, the extracted MSOC was driedgently under nitrogen and then re-dissolved in 500 µL ofmethanol. Subsequently, 50 µL of the solution was added tothe clear quartz filter (area of 1.5 cm2) until dry and analyzedusing the TOT standard method.
2.3 UV–vis absorption spectra and EEM fluorescencespectra
The UV–vis absorption and EEM spectra of WSOC andMSOC were analyzed using a UV–vis spectrophotome-ter (UV-4802, Unico, China) and an Aqualog fluorometer(HORIBA Scientific, USA), respectively. The wavelengthsused to characterize the UV–vis spectra were between 200to 800 nm at a step size of 2 nm. Purified water and methanolwere used as a baseline correction for WSOC and MSOC be-fore measurement, respectively. Mass absorption efficiency(MAE; m2 g−1C) was obtained from the following equation
www.atmos-chem-phys.net/20/2513/2020/ Atmos. Chem. Phys., 20, 2513–2532, 2020

2516 J. Tang et al.: Molecular compositions and optical properties
Figure 1. Comparison of MAE365 in the WSOC fraction of source emission aerosols with the other studies. The references were listed asfollows: Liu et al., 2018; Mo et al., 2018; Yan et al., 2015; Cheng et al., 2011; Cheng et al., 2016; Xie et al., 2019; Hecobian et al., 2010;Zhang et al., 2013; Park et al., 2018; Wu et al., 2019; Fan et al., 2016; Park and Yu, 2016; Chen et al., 2018.
(Li et al., 2018):
MAEλ = Aλ× ln(10)/(C×L), (1)
where Aλ is the value of light absorption at the given wave-length of the spectrophotometer, C (µg C mL−1) is the con-centration of WSOC and MSOC, and L is the optical pathlength (in this study, 0.01 m). Moreover, the pH of WSOCwas measured for all samples within the ranges of 5.5–6.5,which generally did not affect the absorbance according tothe prior study (Chen et al., 2016a).
The emission and excitation wavelengths of the fluores-cence spectra were from 245 to 580 nm and 240 to 500 nm,respectively. The wavelength increments of the emission andexcitation scans were 4.66 and 3 nm, respectively. Further,the contributions of solvents to the fluorescence spectra weresubtracted.
2.4 Ultrahigh-resolution ESI FT-ICR MS analysis
The WSOC and MSOC of six selected samples includingtwo BB aerosols (Musa and Hevea), two CC aerosols (a an-thracite and a bituminous coal), 1 d of tunnel aerosol (com-bining the aerosols in the inlet and outlet of the tunnelin the same day), and one vehicle exhaust particle sample
were analyzed using FT-ICR MS. To remove inorganic ionsbefore instrumental analysis, WSOC was further adjustedto a pH of 2 by the addition of hydrochloric acid (HCl)and then passed through a solid-phase extraction (SPE) car-tridge (Oasis HLB – hydrophilic-lipophilic balance, 30 µm,60 mg/cartridge, Waters Corporation, USA). The constituentretained on the SPE cartridge was eluted with methanol con-taining 2 % ammonia (v/v). Eluants were evaporated untildry under a gentle nitrogen gas stream. The solutions ex-tracted by methanol were evaporated under a gentle nitrogengas stream for preparation.
We used the analysis method of FT-ICR MS describedin detail in our previous study (Mo et al., 2018). Briefly,ultrahigh-resolution mass spectra were obtained using a so-lariX XR FT-ICR MS (Bruker Daltonics GmbH, Bremen,Germany) equipped with a 9.4 T superconducting magnetand an ESI ion source. The system was operated in negative-ionization mode. The ion accumulation time was set to 0.6 s.The lower and upper mass limit was set to a mass-to-chargeratio (m/z) of 150 and 800 Da, respectively. The mass spec-tra were externally calibrated with arginine clusters using alinear calibration and then internally recalibrated with typicalO6S1 class species peaks using quadratic calibration in Data-Analysis version 4.4 (Bruker Daltonics). A typical mass-
Atmos. Chem. Phys., 20, 2513–2532, 2020 www.atmos-chem-phys.net/20/2513/2020/

J. Tang et al.: Molecular compositions and optical properties 2517
resolving power of > 450 000 at m/z 319 with < 0.2 ppmabsolute mass error was achieved. The mass spectra of fieldblank filters was analyzed to detect possible contaminationfollowing the same procedures. More data processing waspresented in Sect. S1 of the Supplement.
2.5 PARAFAC analysis for EEM spectra
PARAFAC analysis with non-negativity constraints was usedto explore the fluorescent components in dissolved BrCbased on the method established by the previous studies(Murphy et al., 2013; Andersson and Bro, 2000), whichwas performed using the decomposition routines for Exci-tation Emission Matrices (drEEM) toolbox version 2.0 us-ing MATLAB (http://models.life.ku.dk/drEEM, last access:June 2014). This method had been widely used in the analy-sis of fluorescence spectra in aerosols (Chen et al., 2016a, b;Matos et al., 2015; Wu et al., 2019). Absorbance measure-ments were used to correct the EEM for inner-filter effects(IFEs) according to the previous studies (Luciani et al., 2009;Gu and Kenny, 2009; Fu et al., 2015). The highest light ab-sorbance in the calibrated wavelength range of WSOC andMSOC was not greater than 2 (mostly below 1 at 254 nm),which was appropriate for the inner-filter corrections of theEEMs (Gu and Kenny, 2009; Murphy et al., 2013). EachEEM was normalized to the Raman peak area of purifiedwater collected on the same day to correct fluorescence inRaman units (RUs) at an excitation of 350 nm and correctedfor the dilution factor (Murphy et al., 2013, 2010). Addition-ally, the signals of the first-order and second-order Rayleighand Raman scattering in the EEM were removed by an in-terpolation method (Bahram et al., 2006). Repeated conver-gence of the model was examined based on the iteration ofthe minimum square principle. The exploration phases oftwo- to seven-component PARAFAC models contained anevaluation of the shape of spectral loading, leverage analy-sis, an examination of the core consistency, residual analy-sis, and split-half analysis (Figs. S2–S7). A six-componentPARAFAC model was identified and successfully passed thesplit-half validation with the split style of S4C6T3 for theWSOC and MSOC in 60 samples, respectively.
3 Results and discussions
3.1 Emission characteristics and light absorption ofextracts
The PM, OC, and EC EFs of 27 biomass and 17 coal com-bustion experiments were summarized in Table S3. The rel-evant EFs of some biomass species have been previouslyreported (Cui et al., 2018). In this experiment, the EFs ofPM, OC, and EC from 27 types of biomass burning were15± 11 g kg−1 fuel, 8.0± 6.4 g kg−1 fuel, and 7.7× 10⁻¹
±
3.4× 10⁻¹ g kg−1 fuel, respectively. The EFs emitted frombituminous CC (PM= 9.1× 10⁻¹
± 6.5× 10⁻¹ g kg−1 fuel,
OC= 4.2× 10⁻¹± 3.3× 10⁻¹ g kg−1 fuel, and EC= 9.4×
10−2± 1.9× 10⁻¹ g kg−1 fuel) were much higher than
those of anthracite combustion (PM= 1.5× 10⁻¹± 8.9×
10−2 g kg−1 fuel, OC= 1.2×10⁻²±4.5×10⁻³ g kg−1 fuel,
and EC= 1.6× 10⁻⁴± 1.4× 10⁻⁴ g kg−1 fuel) in the same
stove. These differences could be attributed to the highvolatile matter content of bituminous coal (Tian et al., 2017;Chen et al., 2005). Note that the CC smoke collection beganwhen the flame had been ignited with one third of the ma-terial, and the rest was added. Therefore, the results of ourstudy would be lower than the real values.
MAE can be used to characterize the efficiency of solar en-ergy absorption, which is represented by the degree of conju-gation and the amount of electron delocalization in molecules(Chen et al., 2016a). As shown in Fig. 1 and Table S4, MAEat 365 nm (MAE365) was significantly higher in the case ofBB and CC aerosols than in vehicle emissions in this study,consistent with the previous findings (Xie et al., 2017; Fanet al., 2016). Bituminous CC aerosols had higher MAE365values than anthracite combustion aerosols. Here, we intro-duced the EC /OC ratios, which could be used as an indi-cator of fire conditions (Xie et al., 2017). Figure S8 showedthe MAE365 of WSOC vs. EC /OC relationships for all BBand CC aerosols. The data clearly showed that the WSOClight absorption of BB aerosols was dependent on combus-tion conditions. However, a weak relationship (p > 0.05) inCC aerosols suggested another factor might influence thelight absorption, such as maturity (Li et al., 2018). Com-pared to WSOC, higher MAE365 values were observed in theMSOC collected from BB (2.3± 1.1 m2 g−1C) and bitumi-nous CC (3.2± 1.1 m2 g−1C) aerosols. This could be due tothe fact that these strongly light-absorbing fat-soluble com-ponents are likely to be PAHs of a large molecular weightand quinones from BB and fossil fuel combustion (Sun et al.,2007; Chen and Bond, 2010), which were more soluble in alow-polarity solution, but we obtained the opposite results inthe case of anthracite combustion and vehicle emissions.
The MAE365 of WSOC in this study was compared withthe other studies (Fig. 1). The BB aerosols in this study hada higher MAE365 value than those in other controlled BBexperiments, while it was comparable to corn straw burningemissions (Park and Yu, 2016; Fan et al., 2016). Further, thesimulated BB aerosols exhibited a higher MAE365 value thanthose in highly BB-impacted areas (Hecobian et al., 2010),indicating that the aging in the transport process could reducethe light absorption (Dasari et al., 2019). The CC aerosolsshowed a higher MAE365 value than the other coal experi-ments (Li et al., 2018; Fan et al., 2016), while comparablevalues to water-soluble BrC were observed in winter of Bei-jing (Cheng et al., 2011; Yan et al., 2015). The result indi-cated the strong influence of BrC in this season in this region.In addition, the simulated combustion aerosols in this studyexhibited higher MAE365 values than the other areas (such asGuangzhou, Nanjing, Los Angeles, South Korea, Nepal, andso on) (see Fig. 1).
www.atmos-chem-phys.net/20/2513/2020/ Atmos. Chem. Phys., 20, 2513–2532, 2020

2518 J. Tang et al.: Molecular compositions and optical properties
Methanol has a lower polarity than water and can ex-tract the water-insoluble compounds that are generallystronger chromophores. Chen et al. (2017b) extracted or-ganic matters in aerosols using different polar solutions,and they found water-insoluble organic matter (WIOM) hada higher MAE value than the water-soluble organic mat-ter (WSOM), consistent with our result for the BB andbituminous CC aerosols. Vehicle emission aerosols gener-ally had a lower MAE value such as methanol-soluble BrC(0.62±0.76 m2 g−1C) in the controlled emission experiment(Xie et al., 2017), which was comparable to WSOC (0.71±0.30 m2 g−1C) but higher than MSOC (0.26±0.09 m2 g−1C)in this study.
3.2 EEM spectra of WSOC and MSOC
Fluorescence spectra was used to characterize the or-ganic chromophores of different sources. We applied thePARAFAC model (Murphy et al., 2013) to determine the un-derlying chromophore components of the 60 source samples.Six typically independent components (abbreviated P1–6) inWSOC were resolved, as shown in the top of Fig. 2 and Table1. Compared to the previous studies, the fluorescence of P1and P6 were similar to those of 7CM–C1 (the C1 componentof a seven-component model) and 7CM–C3, named humic-like substances (HULIS-1) (Chen et al., 2016b). Further,there were peaks in the emission wavelengths (> 400 nm) ofP1 and P6, which were probably derived from conjugatedsystems (Chen et al., 2016b). The peak of the P3 compo-nent was mostly located in the region categorized as protein-like (cytidine) or tryptophan-like fluorophore (Qin et al.,2018; Fan et al., 2016). Generally, peaks at shorter excitationwavelengths (< 250 nm) and shorter emission wavelengths(< 350 nm) were associated with simple aromatic proteinssuch as tyrosine (Cory and Mcknight, 2005), which was sim-ilar to the fluorescence of the P2 component observed inthis study. The P5 component was similar to tryptophan- andtyrosine-like components (Chen et al., 2017a). Therefore, theP2, P3, and P5 components were named protein-like sub-stances (PLOM). The P4 component was reported relativelyrarely but was similar to previously observed peaks that wereconsidered to arise mainly in surface water and algal secre-tions (Yu et al., 2015). It is worth noting that the origins andchemical structures of the chromophores studied are not nec-essarily like those of chromophores with the same name inother types of organic matter.
The results from the six-component model (abbreviatedC1–6) of MSOC identified by PARAFAC, as described in thebottom of Table 1 and Fig. 2, were different from those ob-served in WSOC, indicating MSOC contained different com-pound types from WSOC after water extraction. The peak ofthe C1 component was similar to that of the P3 componentof WSOC, but the excitation wavelength was higher than thatof the P3 component. The higher excitation wavelength indi-cated the presence of conjugated unsaturated bond systems
shifting towards the high wavelengths of the C1 component(Matos et al., 2015). Moreover, as reported, the C3 compo-nent was similar to component 2 of urban alkaline-solubleorganic matter (ASOM) collected from the city of Aveiro,Portugal (Matos et al., 2015).
The maximum fluorescence intensity (Fmax) was calcu-lated by multiplying the maximum excitation loading andmaximum emission loading for each component by its score(Murphy et al., 2013). Generally, changes in the relativeabundance of a component (Fmax/
∑Fmax) could indicate
changes in its overall importance, which had been success-fully applied to study the origins of chromophores (Yan andKim, 2017; Chen et al., 2017a, b; Wu et al., 2019). In thisstudy, the relative abundances of fluorescent components indifferent types of samples were highly variable, dependingon the sources (Fig. 3a). The P1 component accounted foran average of 34± 4.7 % of the total fluorescence intensi-ties in the case of tunnel aerosols, which was higher than BBaerosols (mean±SD: 19±4.8 %), CC aerosols (14±3.8 %),and vehicle exhaust particles (17± 1.0 %). The difference ofthe P1 component between tunnel aerosols and vehicle ex-haust particles indicated that the P1 component had an agedvehicle exhaust origin. In contrast, the fluorescence of the P6component was weak in all the samples, but higher in ve-hicle emissions (9.4± 2.3 %) than in BB and CC aerosols(both 2.5 %). The P5 component was more intense in vehicleexhaust particles (30± 1.6 %) than in other sources. The P2component was abundant only in BB aerosols (33± 11 %),but not in vehicle emissions, which suggested that somestructures responsible for this chromophore could not ex-ist in vehicle emissions. The P4 component was the moreabundant chromophore in CC aerosols (34± 7.7 %) and ve-hicle emissions (29± 5.9 %), especially in vehicle exhaustparticles (38± 1.1 %). In contrast, the P4 component in BBaerosols was weak (11± 7.9 %), indicating a fossil origin.The P3 component was almost equal across all samples. Thepossible reason was that the P3 component was similar to thepeak of tryptophan-like compounds which were common inpractically all published models and were likely to be foundin almost all sources (Yu et al., 2015).
The relative intensities of fluorescent components inMSOC exhibited similar characteristics to WSOC (Fig. 3b).The C1 component was the most intense substance in thecase of BB aerosols (38± 14 %) compared to the othersources. The C2 component was enriched in BB aerosols(21± 6.9 %) and tunnel aerosols (17± 6.9 %) compared tothose in CC aerosols and vehicle exhaust particles. In addi-tion, C2 exhibited a difference between bituminous CC andanthracite combustion aerosols, as well as tunnel aerosolsand vehicle exhaust particles, indicating that the C2 compo-nent could be used to identify these sources. The C4 com-ponent was intense in CC aerosols (41± 6.0 %) and vehicleemissions (26±4.4 %). The C3 component was not abundantamong the three sources and not observed in the vehicle ex-haust particles, not suggesting a fresh vehicle exhaust emis-
Atmos. Chem. Phys., 20, 2513–2532, 2020 www.atmos-chem-phys.net/20/2513/2020/

J. Tang et al.: Molecular compositions and optical properties 2519
Table 1. The maximum excitation and emission wavelengths of the PARAFAC components in WSOC and MSOC extracted from the threeorigins.
PARAFAC Excitation Emission Assignment according to Referencescomponent maxima (nm) maxima (nm) published papers
WSOC P1 251, 314 415 HULIS-1, terrestrial Chen et al. (2016b);humic-like component Sgroi et al. (2017);
Fu et al. (2015)
P2 254 337 Tyrosine-like Cory and Mcknight (2005)
P3 287 360 Protein-like (cytidine) or Qin et al. (2018);tryptophan-like Fan et al. (2016)
P4 251 374 – –
P5 278 319 Protein-like fluorophores Fu et al. (2015)
P6 254, 371 485 HULIS-1, conjugated systems, Chen et al. (2016b)a terrestrial humic-like orfulvic-acid-like component
MSOC C1 308 356 – –
C2 < 250, 272 388 – –
C3 < 250 434 Component 2 for the urban Matos et al. (2015)ASOM samples
C4 257 360 – –
C5 284 328 – –
C6 269 310 – –
sion origin. The C5 and C6 components were more intensein vehicle exhaust particles (25± 6.8 % and 50± 6.8 %, re-spectively), suggesting they were the primary vehicle emis-sion chromophores. The last study observed that the rela-tive abundances of various chromophores in aerosols withdifferent particle sizes were different (Chen et al., 2019).Therefore, the fluorescence technique is sensitive for chro-mophores with different sources, sizes, and chemical struc-tures, and so on. In summary, the variation of the fluores-cent components from different sources obtained by EEM–PARAFAC method could be helpful to the source apportion-ment of BrC in environmental applications.
3.3 Molecular composition detected by FT-ICR MS
The molecular compositions of WSOC and MSOC extractedfrom BB and CC aerosols and vehicle emissions were deter-mined by negative ESI-FT-ICR MS. ESI is a soft ionizationmethod, and it can only ionize polar organic compounds andhydrophilic molecules (Wozniak et al., 2008), but nonpolaror less polar compounds such as polycyclic aromatic hydro-carbons and saturated hydrocarbons are not easily ionized byESI (Lin et al., 2018). In addition, ESI- cannot detect the N-heterocyclic alkaloid compounds (Laskin et al., 2009). Thus,this study mainly discussed these readily ionizable polar or-ganic compounds by ESI-.
Figure 4 showed the reconstructed negative-ion ESIFT-ICR mass spectra of WSOC for the six selected sam-ples. Lots of peaks with intensive mass ranges betweenm/z 150 and 600 were showed in the mass spectra, withthe most massive numbers of ions within the ranges ofm/z 200–400. Additionally, more formulas were detectedin BB aerosols (total of 7708) than CC aerosols (5305) andvehicle emissions (4047) (Table 2), suggesting a higherobserved chemical complexity (i.e., the observed peaks).According to the intensity of each ion, the average molec-ular formulas of WSOC in the six aerosol samples werecalculated and listed as follows: C18.7H23.5O6.99N0.73S0.09,C19.9H21.5O7.65N0.34S0.03, C16.1H13.3O5.37N0.68S0.23,C15.2H13.7O4.24N0.45S0.41, C13.4H18.0O7.52N0.45S0.40, andC17.3H21.1O5.65N0.53S0.08 for Musa, Hevea, anthracite,bituminous coal, tunnel, and vehicle exhaust, respectively.The BB aerosols had higher contents of C and H, while theCC aerosols and tunnel aerosol had higher contents of S.
In this study, these identified molecular formulas wereclassified into four main compound groups based on theircompositions: CHO, CHON, CHOS, and CHONS. CHOcompounds refer to the compounds that contain carbon, hy-drogen, oxygen, and the other compound groups that are de-fined analogously. The relative abundances of the four com-pound groups were calculated by the magnitude of each peak
www.atmos-chem-phys.net/20/2513/2020/ Atmos. Chem. Phys., 20, 2513–2532, 2020

2520 J. Tang et al.: Molecular compositions and optical properties
Figure 2. The EEM components identified by PARAFAC of WSOC (P1–6) and MSOC (C1–6) from the three origins. Em.: emissionwavelength. Ex.: excitation wavelength.
divided by the sum of magnitudes of all identified peaks andshowed in Fig. 4. CHO was the most abundant componentin WSOC, accounting for 43 %–69 % of the total intensi-ties of BB aerosols, 36 %–37 % of CC aerosols, and 36 %–47 % of vehicle emissions, respectively. CHO values in BBand CC aerosols were lower than those of mass spectra fromsimulated combustion experiments (BB of 53 %–72 % andCC of 43 %; Song et al., 2018). Generally, CHO formulaswere consistent with species reported previously as lignin-pyrolysis products (Fleming et al., 2017), and they detectedthis fraction with 43.1± 14.6 % in brushwood chulha cook
firers. CHON was abundant in the three sources. This re-sult was different from the findings that CHON species had ahigher percentage in BB smoke and were not abundant in CCsmoke (Song et al., 2018). The high fraction of CHON in CCaerosols could be due to that the N-containing compoundsin the BB smoke PM2.5 coming from the nitrogen contentin the fuels (Coggon et al., 2016), and the contents in coalfuels were comparable to biomass fuels (See Tables S1 andS2). However, S-containing compounds were more abun-dant in CC aerosols (9.2 %–21 % for CHOS and 13 %–20 % for CHONS, respectively) and tunnel aerosol (24 %
Atmos. Chem. Phys., 20, 2513–2532, 2020 www.atmos-chem-phys.net/20/2513/2020/

J. Tang et al.: Molecular compositions and optical properties 2521
Figure 3. The relative contributions of each PARAFAC component of WSOC (a) and MSOC (b) from the three sources.
for CHOS and 16 % for CHONS, respectively) than those inBB aerosols (2.0 %–5.6 % for CHOS and 0.62 %–3.7 % forCHONS, respectively) and vehicle exhaust particle (7.5 %for CHOS and 0.25 % for CHONS, respectively), consistentwith the previous studies (Song et al., 2018; Wang et al.,2017). ESI was more efficient in ionizing S-containing com-pounds and most of them were selectively ionized by ESI-,suggesting that they were polar species such as organosul-fates (Lin et al., 2018). Our study reported that S-containingcompounds in WSOC were associated with CC emissions bycombining with carbon isotope data (14C) (Mo et al., 2018).Furthermore, the relative abundances of group species in CCaerosols and tunnel aerosol were similar to those of waterextracts in the hazy day (Jiang et al., 2016), indicating bothsources could be important contributors of haze. However,differences between tunnel aerosol and vehicle exhaust par-ticles were observed, indicating S-containing compounds inthe tunnel aerosol were more secondary formation.
Van Krevelen (VK) diagrams are a useful tool that pro-vides a visual graphic display of compound distribution, andto some extent, are used to qualitatively identify differentcomposition domains in organic mixtures (Song et al., 2018;Lv et al., 2016; Smith et al., 2009). In this study, each sourceshowed similar VK patterns. As shown in Fig. S9, Musa andHevea burning had a VK diagram similar to that of WSOCin straw burning and fog water (Schmitt-Kopplin et al., 2010;Mazzoleni et al., 2010). S-containing compounds in tun-nel aerosol with high O/C and H/C ratios were similar tothe aerosol-derived WSOC in New York and Virginia (Woz-niak et al., 2008). Six dominate domains were identified inWSOC, including lignins, carbohydrates, tannins, proteins,condensed aromatic, and unsaturated hydrocarbons. In addi-tion, results showed that compounds observed in CC aerosols
had lower H/C and O/C ratios than those in BB aerosolsand vehicle emissions, indicating a higher unsaturated degreeand lower oxidation level. There were compounds outside thespecified regions, which had a high H/C ratio (≥ 2.2) andDBE of 0, corresponding to saturated oxygenated species,and there could be some long-chain polyalcohols (Lin et al.,2012a).
The mass spectra of MSOC exhibited differences fromWSOC (Fig. S10), especially in BB aerosols and vehicleemissions that exhibited larger m/z values in the rangeof 350–600. The detected formulas in MSOC were muchlower than those in WSOC, with the total number of 4502,3628, and 1069 for BB, CC, and vehicle emission aerosols,respectively (Table S5). The reason could be that ESI- canefficiently ionize the polar compounds, and the methanol ex-tracts after water-extracted may contain more moderate- andlow-polarity compounds that were not easily ionized. Theaverage molecular formulas were C26.9H46.2O4.27N0.24S0.02,C23.3H34.9O5.18N0.20S0.02, C18.2H19.2O4.24N0.92S0.03,C22.4H20.7O3.01N0.38S0.05, C22.6H44.1O5.70N0.74S0.11, andC25.2H48.5O4.86N0.58S0.08 of MSOC in the six aerosolsamples, respectively, showing higher C and H content thantheir corresponding formulas of WSOC but a decreasingtrend in O content.
CHO and CHON were the main components in MSOC,accounting for about 90 % of the total intensities (CHO plusCHON). CHO was the most abundant category observed inBB aerosols (78 %–80 %). The elemental compositions ob-served in CC aerosols were different between bituminouscoal and anthracite combustion. The abundance of CHON inanthracite combustion was higher (73 %), while the CHO inbituminous combustion was higher (60 %), which was con-sistent with the corresponding WSOC. It might be due to a
www.atmos-chem-phys.net/20/2513/2020/ Atmos. Chem. Phys., 20, 2513–2532, 2020
2522 J. Tang et al.: Molecular compositions and optical properties
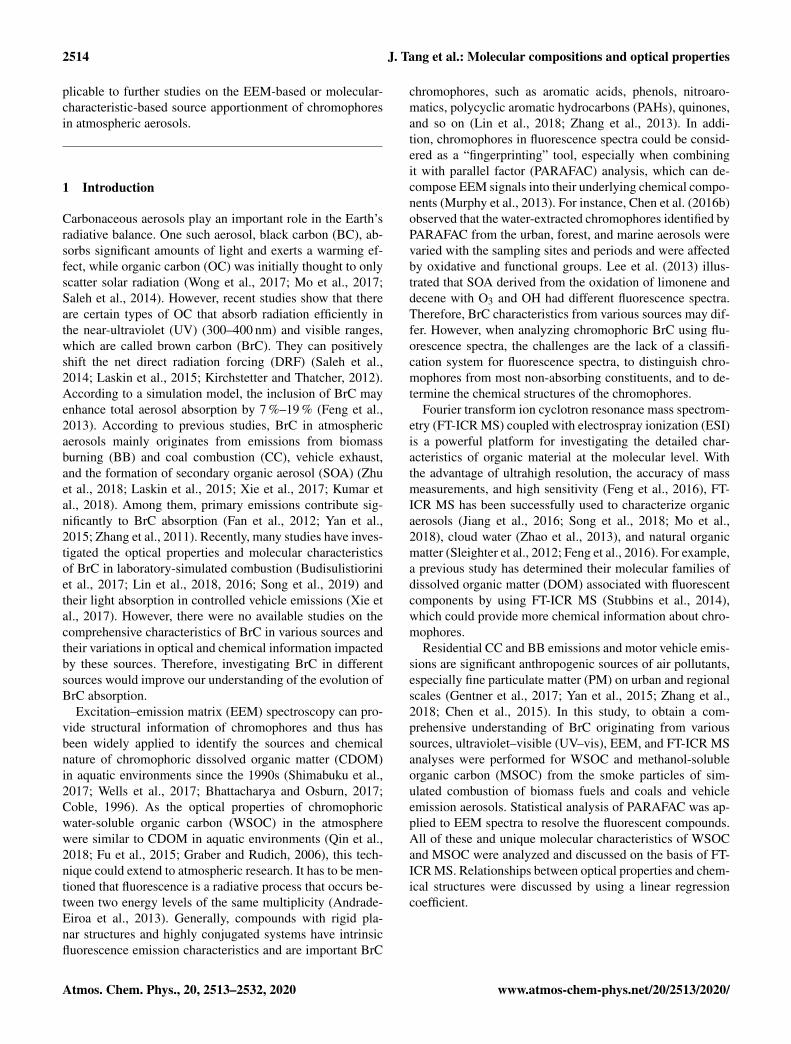
Table 2. Number of formulas in each compound category and the average values of elemental ratios, molecular weight (MW), double-bondequivalents (DBE), and modified aromaticity index (AImod) in WSOC from the six aerosol samples.
Samples Elemental Number of MWw DBEw AImod,w O /Cw H /Cw DBE /Cwcomposition formulas
Musa Total 4534 372.55 8.36 0.33 0.37 1.25 0.45CHO 1504 367.73 8.08 0.32 0.38 1.25 0.43CHON 2375 384.06 9.31 0.39 0.34 1.22 0.48CHOS 329 320.06 4.59 0.15 0.51 1.46 0.34CHONS 323 358.24 5.04 0.12 0.51 1.51 0.35
Hevea Total 3174 387.05 10.32 0.42 0.38 1.08 0.52CHO 1610 377.86 10.06 0.42 0.38 1.08 0.51CHON 1408 409.40 11.29 0.46 0.39 1.05 0.55CHOS 108 376.68 7.00 0.23 0.38 1.32 0.39CHONS 48 410.33 5.08 0.09 0.47 1.60 0.30
Anthracite Total 3930 308.65 10.82 0.65 0.33 0.83 0.67CHO 990 283.07 11.06 0.67 0.28 0.77 0.67CHON 1808 323.71 11.67 0.71 0.34 0.81 0.69CHOS 464 308.97 8.73 0.49 0.36 0.95 0.59CHONS 668 332.83 8.99 0.52 0.46 0.95 0.63
Bituminous coal Total 1375 282.91 9.63 0.61 0.28 0.90 0.63CHO 399 259.21 10.40 0.66 0.22 0.82 0.65CHON 411 267.68 9.92 0.69 0.27 0.86 0.67CHOS 302 324.65 9.51 0.49 0.28 0.99 0.57CHONS 263 299.28 7.98 0.56 0.43 0.98 0.63
Tunnel Total 2746 317.68 5.68 0.35 0.56 1.34 0.42CHO 803 298.29 7.69 0.49 0.50 1.06 0.54CHON 1049 340.18 7.50 0.38 0.51 1.22 0.49CHOS 508 310.74 2.73 0.03 0.59 1.71 0.23CHONS 386 337.90 2.78 0.46 0.81 1.77 0.25
Vehicle exhaust Total 1301 327.71 7.96 0.41 0.33 1.22 0.46CHO 561 311.62 8.02 0.43 0.30 1.19 0.46CHON 673 320.62 7.28 0.41 0.40 1.27 0.47CHOS 63 467.88 11.88 0.36 0.19 1.19 0.44CHONS 4 438.78 2.21 0 0.46 1.97 0.12
higher N content and lower O content of anthracite than thatof bituminous coal (see Table S2). However, CHON in BBaerosols (18 %–20 %) exhibited lower abundances than thosein CC aerosols and vehicle emissions. S-containing com-pounds were not abundant in MSOC. It may be due to thecombination of an S element and an O atom showing higherpolarity.
Figure S11 showed the VK diagram of MSOC in thesix aerosol samples. More formulas in BB aerosols exhib-ited two distinct groups with H/C of 1.4–2.2 and 0.6–1.4vs. O/C of 0.1–0.5 in three domains (lignins, proteins, andlipids). Compounds in CC aerosols with lower H/C andO/C ratios were dominant in the domains of lignins andcondensed aromatic, especially in bituminous CC aerosolwith more unsaturated hydrocarbon. Tunnel aerosol showeda wide range of O/C in S-containing compounds and a widerange of H/C in non-S-containing compounds. In contrast,
compounds in vehicle exhaust particles had a wide range ofH/C but a narrow O/C ratio. The VK diagram with fewer S-containing compounds in vehicle exhaust particle showed asimilar characteristic to the distribution of non-S-containingcompounds in tunnel aerosol, indicating the difference wasmainly due to the S-containing compounds.
Tables 2 and S5 presented the relative abundance ofweighted molecular weight (MWw), double-bond equiva-lence (DBEw), and modified aromaticity index (AImod,w) ofWSOC and MSOC, respectively. DBE was used as a measureof the unsaturated level in a molecule, and AImod could beused to estimate the fraction of aromatic and condensed aro-matic structures (Song et al., 2018; Lv et al., 2016; Koch andDittmar, 2006). BB aerosols had higher MWw values thanCC and vehicle emissions in WSOC. Further, higher DBEwand AImod,w values were observed in CC aerosols than theothers. MSOC had higher MWw but lower AImod values than
Atmos. Chem. Phys., 20, 2513–2532, 2020 www.atmos-chem-phys.net/20/2513/2020/

J. Tang et al.: Molecular compositions and optical properties 2523
Figure 4. Negative ESI FT-ICR mass spectra of WSOC from the six aerosol samples. Different formula groups were color-coded. The sixpie charts showed the relative intensities of different formula groups.
the corresponding WSOC. Furthermore, CHO and CHONcompounds had higher DBEw and AImod,w values than S-containing substances, consistent with the earlier results (Linet al., 2012a, b).
Figure S12 showed the fraction of AImod values of WSOCin the six aerosol samples, where the formulas were classi-fied according to their AImod (aliphatic – AImod = 0, olefinic– 0< AImod ≤ 0.5, and aromatic – AImod > 0.5). The resultsillustrated that the fraction of the aromatic structure in non-S-containing compounds was higher than those in S-containingcompounds. CC aerosols had a higher aromatic fraction than
BB aerosols and vehicle emissions, especially in CHO andCHON (up to 89 % of total ion intensities). In BB aerosols,the non-S-containing compounds had a high fraction of theolefinic structure, followed by the aromatic structure, but theS-containing compounds had a higher aliphatic and olefinicstructure than the aromatic structure. A higher fraction ofthe aliphatic structure in vehicle emissions was observed inthe S-containing compounds (especially in tunnel aerosol;exceeding 81 %). These aliphatic S-containing compoundsmight form by the precursors (long-chain alkanes) from vehi-cle emissions (Tao et al., 2014), which had higher H/C and
www.atmos-chem-phys.net/20/2513/2020/ Atmos. Chem. Phys., 20, 2513–2532, 2020

2524 J. Tang et al.: Molecular compositions and optical properties
lower DBE values (see Table 2). However, the previous studyshowed that AI must be regarded as the most conservativeapproach and may result in an underestimate of the aromaticstructures (Koch and Dittmar, 2006), which was observed inBeijing aerosols (Mo et al., 2018). Although AImod identifiedmore compounds as aromatic and condensed aromatic com-ponents than AI, the AImod may introduce uncertainties forindividual molecules, which was demonstrated by Koch andDittmar (2006).
For MSOC, the aromatic structure fractions in non-S-containing compounds were higher than those in S-containing compounds, and the aromatic structure fractionsin CC aerosols were higher than those in BB aerosols andvehicle emissions (Fig. S13), which was consistent withWSOC. Furthermore, we found that the fraction of thealiphatic structure in MSOC was higher than that in WSOC,indicating more fat-like compounds.
3.3.1 Different chemical characteristics of BB, CC, andvehicle emissions
Figure S14 shows the plotted Venn diagram of formulasin WSOC in the six aerosol samples for determining theunique elements in the mass spectra. The previous studyidentified the unique elements of water-soluble HULIS insimulated BB and CC smokes, which presented differentmolecular characteristics between biomasses, as well as be-tween biomass and coal (Song et al., 2018). In this study,we combined more formulas of different sources to deter-mine the unique molecules, and more limitations were set,which would provide more identified characteristics for eachsource. A total of 212 molecular formulas were detected si-multaneously in the six aerosol samples. It is worth notingthat without any further information, it is not possible todecide whether these common formulas represent the samecompounds. Of 212, there were 112 unique molecules ofCHO and 98 of CHON but only 2 of CHOS. CHO com-pounds were relatively small aromatic compounds with 8–20 C atoms and 3–8 O atoms with DBE values of 5–13 andmultiple acidic polar functional groups (Fig. S15). It is not-ing that lines in Fig. S15 indicate DBE reference values oflinear conjugated polyenes CxHx+2 with a DBE value of0.5×C and fullerene-like hydrocarbons with a DBE value of0.9×C, where the data points inside this region are potentialBrC chromophores (Lin et al., 2018). For example, organicacids (C8H6O5; DBE of 6) were detected in urban PM2.5(Yassine et al., 2012), as well as C9H8O5 (6), C14H14O4 (8),and C13H14O5 (7), which allowed them to ionize in the ESImode and were identified as potential BrC chromophores.In total, all of the CHON compounds had O/N of > 2(5.3± 1.28, 2.5–8) (Fig. S15), allowing for the assignmentof at least one nitro (-NO2) or nitrooxy (-ONO2) group andother oxygen-containing groups (i.e., -OH and -COOH). Ex-cept for C19H41O7N (DBE of 0), the remaining compoundswith DBE≥ 5 were suggested as nitro-aromatic and nitro-
phenol derivatives (Mo et al., 2018; Lin et al., 2018). CHOSspecies only had two formulas including C18H38O7S (0) andC20H38O7S (2). It was reported that O7S groups were themost abundant species class in CHOS identified in water ex-tracts of PM2.5 (Jiang et al., 2016).
There were more observed unique peaks of WSOC in BBaerosols (total of 1947) compared to CC aerosols (1583) andvehicle emissions (813). However, only 143 and 83 molecu-lar were identified in bituminous CC and vehicle exhaust par-ticles, respectively. Among the observed compounds, 1353and 1440 unique molecular formulas were detected in thecombustion of Musa and anthracite, respectively, implying asignificant difference from the others. Figure 5a showed theVK diagram of these unique formulas of WSOC for eachsample, where four regions were circled for representing dif-ferent sources. The results indicated that these unique com-pounds in different sources had a distinctive chemical char-acteristic. That may be the reason that resulted in variable flu-orescent spectra in different sources (discussed above). Ad-ditionally, the diagram showed that the unique molecules inCC aerosols were located in the region with lower H/C andO/C values, and vehicle emissions containing tunnel aerosoland vehicle exhaust particles were located in two distinct re-gions.
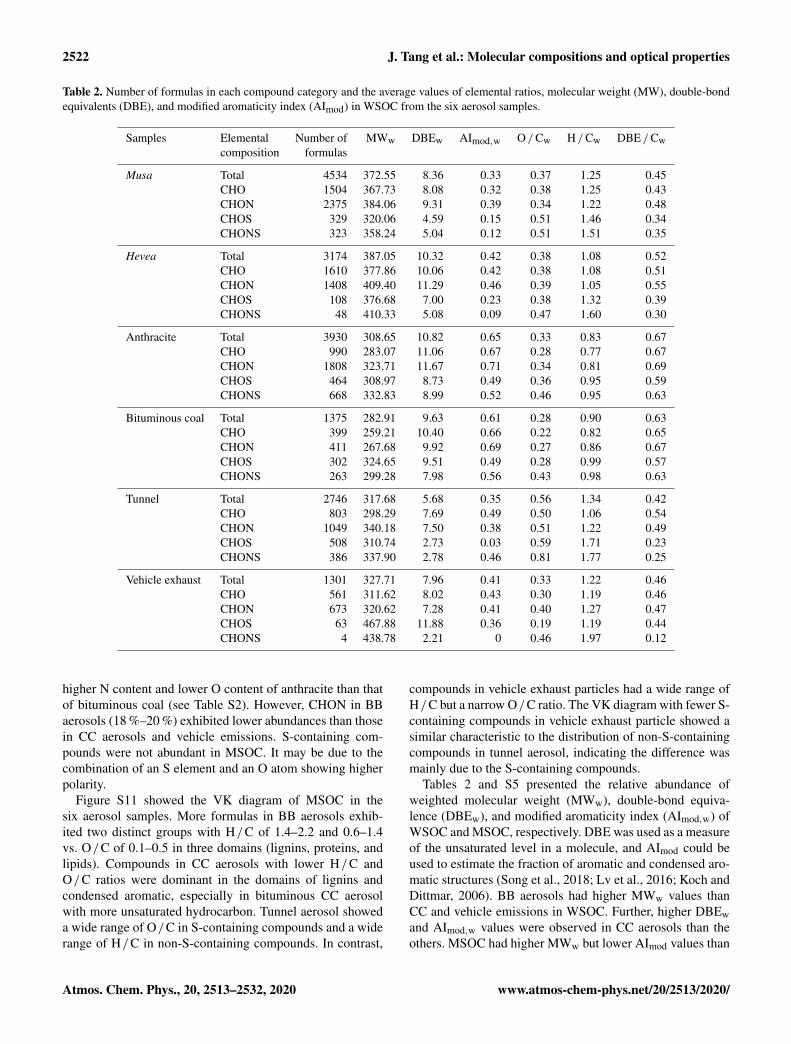
Figure 6 showed plots of the DBE vs. the number of car-bon atoms in the unique molecular formulas of all aerosolsamples. These compounds observed in BB aerosols werelargely CHO and CHON (CHO and CHON of 88 %–93 %)with C numbers ranging from 6 to 40 and DBE rangingfrom 0 to 31, with no regular distribution. S-containing com-pounds were the important components in the unique molec-ular formulas of CC aerosols (CHOS and CHONS of 38 %–75 %) and vehicle emissions (CHOS and CHONS of 41 %–66 %). However, only 7 %–12 % of the total unique molec-ular formulas were observed in BB aerosols. As shown inFig. 6, the region marked by a blue box denote the highintensities of compounds in unique formulas of each sam-ple. The high-intensity compounds detected in Musa-burningaerosol mainly had a C number from 14 to 24, DBE from 7 to13, and 2 N atoms, such as C20H26O7N2 (9), C18H24O5N2(8), C22H28O6N2 (10), C19H26O7N2 (8), C21H28O6N2 (9),C14H18O3N2 (7), C24H30O8N2 (11), and C21H24O5N2 (11),and so on. Instead of Musa, the abundant compounds in He-vea burning were mainly C24H22O9 (14), C28H28O11 (15),and C28H26O11 (16), and so on. Although the differencebetween burning of Musa and Hevea appeared, the VK di-agram (Fig. 5) did not show distinct changes. The high-intensity compounds in anthracite combustion with lowerC atoms than in bituminous CC were mainly C14H8O5N2(12), C12H11O4NS (8), and C12H10O8N2 (9), while in bitu-minous CC was mainly C28H28O4S (15) and its homolog ofC27H26O4S (15) and C19H16O3S (12). The abundant com-pounds in tunnel aerosol had a lower unsaturation degree,such as C4H9O7NS (1), C5H11O7NS (1), or C7H14O5S (1).In vehicle exhaust particles, the high intensity of compounds
Atmos. Chem. Phys., 20, 2513–2532, 2020 www.atmos-chem-phys.net/20/2513/2020/

J. Tang et al.: Molecular compositions and optical properties 2525
Figure 5. A van Krevelen diagram of WSOC (a) and MSOC(b) from the six aerosol samples. Different color indicates uniqueformulas detected in each sample.
was one fraction with few C atoms and a low DBE value(C21H40O8N2S (3) and C26H46O3S (4)) and the other frac-tion with many C atoms and a high DBE value (C32H34O8S(16), C30H34O5S (14)). These findings are essential becausethese unique molecular formulas in different sources mayhave specific chemical composition, which would help thesource apportionment of aerosols.
Compared to WSOC, Fig. S16 showed fewer compoundsin common in MSOC for the six aerosol samples. There wereonly 44 compounds common to the six aerosol samples. Atotal of 26 and 14 of the 44 formulas were CHO and CHON,respectively, but only 4 of the 44 formulas were S-containingcompounds. As shown in Fig. S17, there were only threecompounds (C17H10O2 (13), C18H14O (12), and C18H12O2(13)) in the CHO group and one compound (C14H11O4N(10)) in the CHON group inside the potential BrC region.The remaining compounds had a high C number (18–35),few O atoms (1–7), and low DBE (0–2), suggesting that theymostly had fatty acid structures.
These unique molecules in the VK diagram also showedsimilar results compared to WSOC (Fig. 5b), further con-firming the special characters in different sources. Ex-pect for tunnel aerosol (about 50 %), these unique formu-las in the BB aerosols, CC aerosols, and vehicle exhaustparticle were dominated by the CHO and CHON groups(Fig. S18). The high-intensity compounds were C35H69O5N(2) and C38H76O4 (1) for Musa burning; C26H22O7 (16)and C28H26O7 (16) for Hevea burning; C14H12O6N2 (10)and C17H14O5N2 (12) for anthracite combustion; C23H16O(16), C24H18O (16), and C24H14O (18) for bituminous CC;C4H9O7NS (1), C24H42O3S (4), and C8H16O5S (1) for tun-nel aerosol; and C26H37O5NS (7) and C22H46O7 (0) for ve-hicle exhaust particles, respectively.
3.4 Link of molecular compositions and opticalproperties
In the above statements, we discussed the light absorptionand fluorescence properties from aerosols in the three dif-ferent sources. The light absorption capacity of WSOC andMSOC was essential to assess the evolution of BrC, andfluorescence spectra were sensitive to different sources andcould help for the source apportionment of BrC. In addi-tion, we evaluated the molecular compositions of the threesources. Therefore, understanding the factors affecting theoptical properties of BrC is important. It was reported thatthe MAE value in the BB experiments depended largely onburning conditions (Chen and Bond., 2010), and in the CCexperiments it depended on coal maturity (Li et al., 2018).Chen et al. (2017b) illustrated that the higher light absorptioncapacity was associated with the low- and medium-polarityfractions that contained aromatic and polar functional groups(O or both O and N atoms). Sources play an important rolein light absorption capacity, consistent with our current study.The MAE365 values of WSOC in highly BB-impacted areaswere 2 times higher than in lowly BB-impacted areas in thesoutheastern United States (Hecobian et al., 2010). Atmo-spheric aging has a significant effect on the light absorptioncapacity of BrC (Li et al., 2019), but the mechanism involvedis very complex. The response of the light absorption capac-ity of different types of BrC to aging is highly variable, andenhancement or reduction in the light absorption capacity ofBrC is possible (Li et al., 2019). These results indicated thatlight absorption capacity might be affected by various fac-tors. In this study, the higher MAE365 values were observedin BB and CC aerosols than vehicle emissions, and the chem-ical structures and unsaturation degree of different sourceswere discussed. Next, we further discussed the relationshipbetween optical properties and chemical structures below.
Before discussing their relationship, we firstly determinedthe compounds that were potentially able to absorb light ra-diation based on the above statement to reduce the influ-ence of non-absorbing substances (Lin et al., 2018). Mo etal. (2018) reported that MAE365 of HULIS in aerosols was
www.atmos-chem-phys.net/20/2513/2020/ Atmos. Chem. Phys., 20, 2513–2532, 2020
2526 J. Tang et al.: Molecular compositions and optical properties
Figure 6. DBE vs. C number for unique molecular compounds of WSOC from the six aerosol samples. Lines indicate DBE reference valuesof linear conjugated polyenes CxHx+2 with DBE= 0.5×C and fullerene-like hydrocarbons with DBE= 0.9×C. The regions marked by ablue box denote the high intensities of compounds.
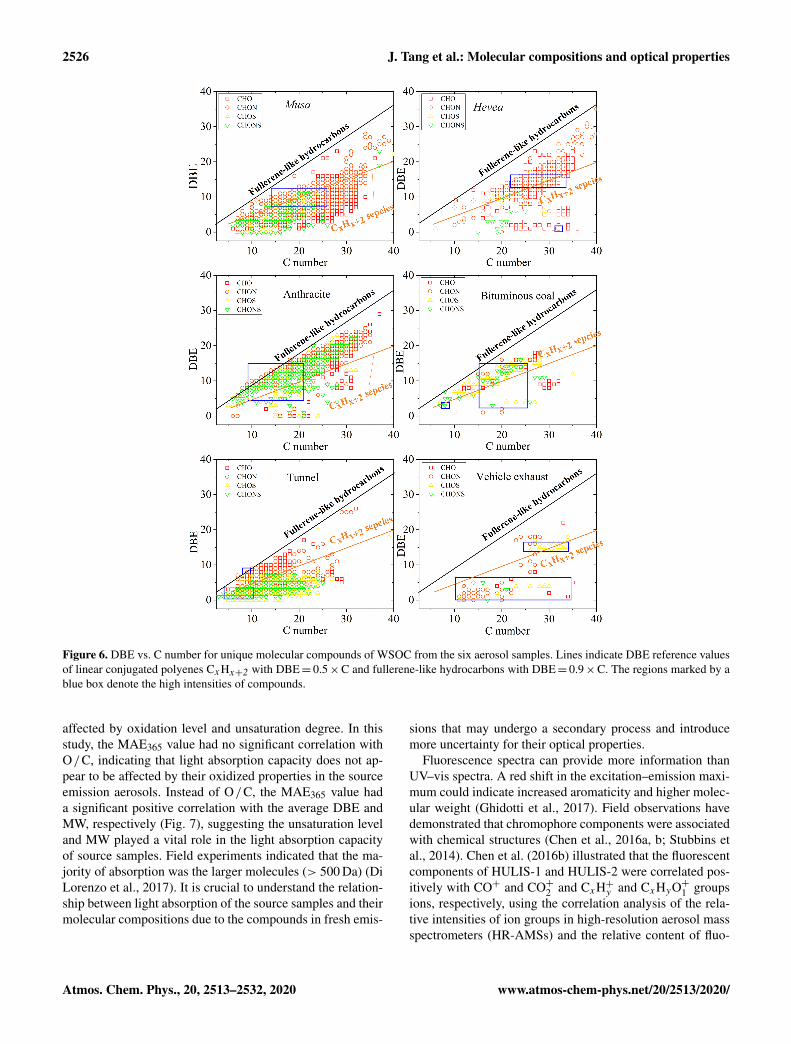
affected by oxidation level and unsaturation degree. In thisstudy, the MAE365 value had no significant correlation withO/C, indicating that light absorption capacity does not ap-pear to be affected by their oxidized properties in the sourceemission aerosols. Instead of O/C, the MAE365 value hada significant positive correlation with the average DBE andMW, respectively (Fig. 7), suggesting the unsaturation leveland MW played a vital role in the light absorption capacityof source samples. Field experiments indicated that the ma-jority of absorption was the larger molecules (> 500 Da) (DiLorenzo et al., 2017). It is crucial to understand the relation-ship between light absorption of the source samples and theirmolecular compositions due to the compounds in fresh emis-
sions that may undergo a secondary process and introducemore uncertainty for their optical properties.
Fluorescence spectra can provide more information thanUV–vis spectra. A red shift in the excitation–emission maxi-mum could indicate increased aromaticity and higher molec-ular weight (Ghidotti et al., 2017). Field observations havedemonstrated that chromophore components were associatedwith chemical structures (Chen et al., 2016a, b; Stubbins etal., 2014). Chen et al. (2016b) illustrated that the fluorescentcomponents of HULIS-1 and HULIS-2 were correlated pos-itively with CO+ and CO+2 and CxH+y and CxHyO+1 groupsions, respectively, using the correlation analysis of the rela-tive intensities of ion groups in high-resolution aerosol massspectrometers (HR-AMSs) and the relative content of fluo-
Atmos. Chem. Phys., 20, 2513–2532, 2020 www.atmos-chem-phys.net/20/2513/2020/
J. Tang et al.: Molecular compositions and optical properties 2527
Figure 7. Relationships between DBE and MW of the potential BrC molecules and the MAE365 of WSOC (a, c) and MSOC (b, d) from thesix aerosol samples, respectively.
rescence components. In another study, Chen et al. (2016a)demonstrated that fluorescent components had strong linkswith chemical groups in the Fourier transform infrared (FT-IR) spectra, including the oxygenated functional groups(nonacidic carbonyl C=O and carboxylic COOH groups),aliphatic C-H group, amine C-NH2, and alcohol C-OHgroups. The chromophores are sensitive to sources, and itis very important to understand the molecular compositionof chromophores for the classification and source apportion-ment of atmospheric BrC. However, the ESI- cannot ionizethe most typical BrC chromophores such as O-heterocyclicPAHs (O-PAHs) or N-heterocyclic PAHs (N-PAHs) (Lin etal., 2018), which was not enough to discuss the relation-ship between the fluorescence spectra and molecular compo-sition. The combination of atmospheric pressure photoion-ization (APPI+ and APPI-) and ESI (+ and −) may providemore ionizable compounds, but these techniques were notwithin the scope of our study.
4 Conclusions
We conducted comprehensive measurements on light absorp-tion, fluorescence, and molecular compositions of dissolvedBrC derived from smoke particles during the simulated com-bustion of biomass and coal as well as vehicle emissionaerosols. We observed that BB and CC aerosols had higherMAE365 values than vehicle emissions, on average, 1.6±0.55, 1.3±0.34, 2.0±0.75, and 0.71±0.30 m2 g−1 C for BB,anthracite combustion, bituminous CC, and vehicle emis-
sion aerosols, respectively. In addition, BrC emitted from BB(2.3±1.1 m2 g−1 C) and bituminous CC (3.2±1.1 m2 g−1 C)in MSOC exhibited stronger light absorption capacity thanthose in WSOC, but opposite results were found in an-thracite combustion aerosols (0.88± 0.74 m2 g−1 C) and ve-hicle emissions (0.26±0.09 m2 g−1 C). EEM combining withPARAFAC analysis determined six types of fluorescent com-ponents that were categorized as two HULIS-1 substances(P1 and P6), three PLOM substances (P2, P3, and P5),and one undefined (P4) substance in WSOC from the threesources. The relative intensities of the fluorescent compo-nents mainly depended on the different types of sources. Forexample, HULIS-1 was abundant in tunnel aerosols; P2 wasmore intense in BB aerosols but not observed in vehicle emis-sions; P4 was intense in CC aerosols and vehicle emissions;P5 was more abundant in fresh vehicle exhaust particles; al-though P3 was not abundant, it was ubiquitous in all testedaerosols. Similar to WSOC, six fluorescent components wereidentified in MSOC. Although the methanol-soluble chro-mophores were poorly understood, different characteristicswere observed in different sources.
FT-ICR mass spectra showed the m/z values of the com-pounds with an m/z value of 200–400 in WSOC and an m/zvalue of 350–600 in MSOC (except for CC aerosols), respec-tively. CHO and CHON were the main components in thesix aerosol samples, but S-containing compounds were moreabundant in CC and tunnel aerosols than BB aerosols and ve-hicle exhaust particles in WSOC. Similarly, MSOC mainlycontained CHO and CHON species but fewer S-containing
www.atmos-chem-phys.net/20/2513/2020/ Atmos. Chem. Phys., 20, 2513–2532, 2020

2528 J. Tang et al.: Molecular compositions and optical properties
compounds. BB aerosols had higher CHO species in MSOCbut showed lower CHON than CC aerosols and vehicle emis-sions. The VK diagram showed that CC aerosols had a higherunsaturation degree and lower oxidation level than the othertwo sources. This finding was further confirmed by a higherfraction of aromatics in CC aerosols. Unique formulas deter-mined by the Venn diagram showed certain specific chem-ical characteristics in the VK diagram. BB aerosols emit-ted unique formulas with more CHO and CHON (88 %–93 %), while CC aerosols and vehicle emissions containedmore S-containing compounds (38 %–75 % and 41 %–46 %,respectively). The relationship between optical propertiesand chemical structures showed the light absorption capac-ity was positively associated with an unsaturation degree andMW in the source emission samples. Our study illustratedthe important roles of sources in light-absorbing BrC andmolecular compositions and the EEMs-based and molecular-characteristic-based method for the classification and sourceapportionment of chromophores in atmospheric aerosols.
Data availability. The data used in this study are available uponrequest. Please contact Gan Zhang ([email protected]) and JunLi ([email protected]).
Supplement. The supplement related to this article is available on-line at: https://doi.org/10.5194/acp-20-2513-2020-supplement.
Author contributions. JT, GZ, JL, and YC designed the experiment.JT and MC carried out the measurements and analyzed the data.JT, TS, YH, and HJ organized and performed the samplings. JT(Jianhui Tang) and BJ supported the fluorescence and FT-ICR MSinstruments. JT wrote the paper. JL, YM, JS, PP, and GZ reviewedand commented on the paper.
Competing interests. The authors declare that they have no conflictof interest.
Acknowledgements. This is contribution no. IS-2811 from GIG-CAS.
Financial support. This research has been supported by the Na-tional Natural Science Foundation of China (grant nos. 41430645and 41773120), the National Key R&D Program of China (grant no.2017YFC0212000), the International Partnership Program of Chi-nese Academy of Sciences (grant no. 132744KYSB20170002), andthe Guangdong Foundation for Program of Science and TechnologyResearch (grant no. 2017B030314057).
Review statement. This paper was edited by Alex Lee and reviewedby two anonymous referees.
References
Andersson, C. A. and Bro, R.: The N-way Toolboxfor MATLAB, Chemom. Intell. Lab. Syst., 52, 1–4,https://doi.org/10.1016/s0169-7439(00)00071-x, 2000.
Andrade-Eiroa, Á., Canle, M., and Cerdá, V.: Environmen-tal Applications of Excitation-Emission Spectrofluorimetry:An In-Depth Review I, Appl. Spectrosc. Rev., 48, 1–49,https://doi.org/10.1080/05704928.2012.692104, 2013.
Bahram, M., Bro, R., Stedmon, C., and Afkhami, A.: Handlingof Rayleigh and Raman scatter for PARAFAC modeling of flu-orescence data using interpolation, J. Chemom., 20, 99–105,https://doi.org/10.1002/cem.978, 2006.
Bhattacharya, R. and Osburn, C. L.: Multivariate Analysesof Phytoplankton Pigment Fluorescence from a Freshwa-ter River Network, Environ. Sci. Technol., 51, 6683–6690,https://doi.org/10.1021/acs.est.6b05880, 2017.
Budisulistiorini, S. H., Riva, M., Williams, M., Chen, J., Itoh,M., Surratt, J. D., and Kuwata, M.: Light-Absorbing BrownCarbon Aerosol Constituents from Combustion of IndonesianPeat and Biomass, Environ. Sci. Technol., 51, 4415–4423,https://doi.org/10.1021/acs.est.7b00397, 2017.
Chen, H., Liao, Z. L., Gu, X. Y., Xie, J. Q., Li, H. Z., andZhang, J.: Anthropogenic Influences of Paved Runoff and San-itary Sewage on the Dissolved Organic Matter Quality of WetWeather Overflows: An Excitation-Emission Matrix ParallelFactor Analysis Assessment, Environ. Sci. Technol., 51, 1157–1167, https://doi.org/10.1021/acs.est.6b03727, 2017a.
Chen, Q., Ikemori, F., and Mochida, M.: Light Absorp-tion and Excitation-Emission Fluorescence of Urban Or-ganic Aerosol Components and Their Relationship to Chem-ical Structure, Environ. Sci. Technol., 50, 10859–10868,https://doi.org/10.1021/acs.est.6b02541, 2016a.
Chen, Q., Miyazaki, Y., Kawamura, K., Matsumoto, K., Coburn,S., Volkamer, R., Iwamoto, Y., Kagami, S., Deng, Y.,Ogawa, S., Ramasamy, S., Kato, S., Ida, A., Kajii, Y.,and Mochida, M.: Characterization of Chromophoric Water-Soluble Organic Matter in Urban, Forest, and Marine Aerosolsby HR-ToF-AMS Analysis and Excitation-Emission Ma-trix Spectroscopy, Environ. Sci. Technol., 50, 10351–10360,https://doi.org/10.1021/acs.est.6b01643, 2016b.
Chen, Q., Ikemori, F., Nakamura, Y., Vodicka, P., Kawamura,K., and Mochida, M.: Structural and Light-Absorption Charac-teristics of Complex Water-Insoluble Organic Mixtures in Ur-ban Submicrometer Aerosols, Environ. Sci. Technol., 51, 8293–8303, https://doi.org/10.1021/acs.est.7b01630., 2017b.
Chen, Q., Mu, Z., Song, W., Wang, Y., Yang, Z., Zhang,L., and Zhang, Y. L.: Size Characterization of the Chro-mophores in Atmospheric Particulate Matter From a TypicalCoal City in China, J. Geophys. Res.-Atmos, 124, 10546–10563,https://doi.org/10.1029/2019jd031149, 2019.
Chen, Y., Sheng, G., Bi, X., Feng, Y., Bixian Mai, A., andFu, J.: Emission Factors for Carbonaceous Particles and Poly-cyclic Aromatic Hydrocarbons from Residential Coal Com-bustion in China, Environ. Sci. Technol., 39, 1861–1687,https://doi.org/10.1021/es0493650, 2005.
Chen, Y. and Bond, T. C.: Light absorption by organic carbonfrom wood combustion, Atmos. Chem. Phys., 10, 1773–1787,https://doi.org/10.5194/acp-10-1773-2010, 2010.
Atmos. Chem. Phys., 20, 2513–2532, 2020 www.atmos-chem-phys.net/20/2513/2020/

J. Tang et al.: Molecular compositions and optical properties 2529
Chen, Y., Tian, C., Feng, Y., Zhi, G., Li, J., and Zhang, G.: Measure-ments of emission factors of PM2.5, OC, EC, and BC for house-hold stoves of coal combustion in China, Atmos. Environ., 109,190–196, https://doi.org/10.1016/j.atmosenv.2015.03.023, 2015.
Chen, Y., Ge, X., Chen, H., Xie, X., Chen, Y., Wang, J., Ye, Z.,Bao, M., Zhang, Y., and Chen, M.: Seasonal light absorptionproperties of water-soluble brown carbon in atmospheric fineparticles in Nanjing, China, Atmos. Environ., 187, 230–240,https://doi.org/10.1016/j.atmosenv.2018.06.002, 2018.
Cheng, Y., He, K.-B., Zheng, M., Duan, F.-K., Du, Z.-Y., Ma,Y.-L., Tan, J.-H., Yang, F.-M., Liu, J.-M., Zhang, X.-L., We-ber, R. J., Bergin, M. H., and Russell, A. G.: Mass absorptionefficiency of elemental carbon and water-soluble organic car-bon in Beijing, China, Atmos. Chem. Phys., 11, 11497–11510,https://doi.org/10.5194/acp-11-11497-2011, 2011.
Cheng, Y., He, K.-B., Du, Z.-Y., Engling, G., Liu, J.-M., Ma, Y.-L.,Zheng, M., and Weber, R. J.: The characteristics of brown carbonaerosol during winter in Beijing, Atmos. Environ., 127, 355–364,https://doi.org/10.1016/j.atmosenv.2015.12.035, 2016.
Coble, P. G.: Characterization of marine and terrestrial DOMin seawater using excitation-emission matrix spectroscopy,Mar. Chem., 51, 325–346, https://doi.org/10.1016/0304-4203(95)00062-3, 1996.
Coggon, M. M., Veres, P. R., Yuan, B., Koss, A., Warneke, C.,Gilman, J. B., Lerner, B. M., Peischl, J., Aikin, K. C., Stock-well, C. E., Hatch, L. E., Ryerson, T. B., Roberts, J. M., Yokel-son, R. J., and de Gouw, J. A.: Emissions of nitrogen-containingorganic compounds from the burning of herbaceous and arbora-ceous biomass: Fuel composition dependence and the variabilityof commonly used nitrile tracers, Geophys. Res. Lett., 43, 9903–9912, https//doi.org/10.1002/2016gl070562, 2016.
Cory, R. M. and Mcknight, D. M.: Fluorescence Spectroscopy Re-veals Ubiquitous Presence of Oxidized and Reduced Quinonesin Dissolved Organic Matter, Environ. Sci. Technol., 39, 8142–8149, https://doi.org/10.1021/es0506962, 2005.
Cui, M., Chen, Y., Zheng, M., Li, J., Tang, J., Han, Y., Song,D., Yan, C., Zhang, F., Tian, C., and Zhang, G.: Emissionsand characteristics of particulate matter from rainforest burn-ing in the Southeast Asia, Atmos. Environ., 191, 194–204,https://doi.org/10.1016/j.atmosenv.2018.07.062, 2018.
Dasari, S., Andersson, A., Bikkina, S., Holmstrand, H., Budha-vant, K., Satheesh, S. K., Asmi, E., Kesti, J., Backman, J., andSalam, A.: Photochemical degradation affects the light absorp-tion of water-soluble brown carbon in the South Asian outflow,Sci. Adv., 5, https://doi.org/10.1126/sciadv.aau8066, 2019.
Di Lorenzo, R. A., Washenfelder, R. A., Attwood, A. R., Guo,H., Xu, L., Ng, N. L., Weber, R. J., Baumann, K., Edger-ton, E., and Young, C. J.: Molecular-Size-Separated BrownCarbon Absorption for Biomass-Burning Aerosol at Mul-tiple Field Sites, Environ. Sci. Technol., 51, 3128–3137,https://doi.org/10.1021/acs.est.6b06160, 2017.
Fan, X., Song, J., and Peng, P. A.: Comparison of isolationand quantification methods to measure humic-like substances(HULIS) in atmospheric particles, Atmos. Environ., 60, 366–374, https://doi.org/10.1016/j.atmosenv.2012.06.063, 2012.
Fan, X., Wei, S., Zhu, M., Song, J., and Peng, P.: Compre-hensive characterization of humic-like substances in smokePM2.5 emitted from the combustion of biomass materials
and fossil fuels, Atmos. Chem. Phys., 16, 13321–13340,https://doi.org/10.5194/acp-16-13321-2016, 2016.
Feng, S., Zhang, L., Wang, S., Nadykto, A. B., Xu, Y., Shi, Q., Jiang,B., and Qian, W.: Characterization of dissolved organic nitrogenin wet deposition from Lake Erhai basin by using ultrahigh reso-lution FT-ICR mass spectrometry, Chemosphere, 156, 438–445,https://doi.org/10.1016/j.chemosphere.2016.04.039, 2016.
Feng, Y., Ramanathan, V., and Kotamarthi, V. R.: Brown car-bon: a significant atmospheric absorber of solar radiation?, At-mos. Chem. Phys., 13, 8607–8621, https://doi.org/10.5194/acp-13-8607-2013, 2013.
Fleming, L. T., Lin, P., Laskin, A., Laskin, J., Weltman, R., Ed-wards, R. D., Arora, N. K., Yadav, A., Meinardi, S., Blake, D.R., Pillarisetti, A., Smith, K. R., and Nizkorodov, S. A.: Molec-ular composition of particulate matter emissions from dung andbrushwood burning household cookstoves in Haryana, India, At-mos. Chem. Phys., 18, 2461–2480, https://doi.org/10.5194/acp-18-2461-2018, 2018.
Fu, P., Kawamura, K., Chen, J., Qin, M., Ren, L., Sun, Y., Wang,Z., Barrie, L. A., Tachibana, E., Ding, A., and Yamashita, Y.:Fluorescent water-soluble organic aerosols in the High Arctic at-mosphere, Sci. Rep., 5, 9845, https://doi.org/10.1038/srep09845,2015.
Gentner, D. R., Jathar, S. H., Gordon, T. D., Bahreini, R., Day,D. A., El Haddad, I., Hayes, P. L., Pieber, S. M., Platt, S.M., de Gouw, J., Goldstein, A. H., Harley, R. A., Jimenez, J.L., Prevot, A. S., and Robinson, A. L.: Review of Urban Sec-ondary Organic Aerosol Formation from Gasoline and DieselMotor Vehicle Emissions, Environ. Sci. Technol., 51, 1074–1093, https://doi.org/10.1021/acs.est.6b04509, 2017.
Ghidotti, M., Fabbri, D., Masek, O., Mackay, C. L., Mon-talti, M., and Hornung, A.: Source and Biological Re-sponse of Biochar Organic Compounds Released intoWater; Relationships with Bio-Oil Composition and Car-bonization Degree, Environ. Sci. Technol., 51, 6580–6589,https://doi.org/10.1021/acs.est.7b00520, 2017.
Graber, E. R. and Rudich, Y.: Atmospheric HULIS: How humic-like are they? A comprehensive and critical review, Atmos.Chem. Phys., 6, 729–753, https://doi.org/10.5194/acp-6-729-2006, 2006.
Gu, Q. and Kenny, J. E.: Improvement of Inner Filter Effect Correc-tion Based on Determination of Effective Geometric ParametersUsing a Conventional Fluorimeter, Anal. Chem., 81, 420–426,https://doi.org/10.1021/ac801676j, 2009.
Hecobian, A., Zhang, X., Zheng, M., Frank, N., Edgerton, E. S.,and Weber, R. J.: Water-Soluble Organic Aerosol material andthe light-absorption characteristics of aqueous extracts measuredover the Southeastern United States, Atmos. Chem. Phys., 10,5965–5977, https://doi.org/10.5194/acp-10-5965-2010, 2010.
Jiang, B., Kuang, B. Y., Liang, Y., Zhang, J., Huang, X. H. H.,Xu, C., Yu, J. Z., and Shi, Q.: Molecular composition of ur-ban organic aerosols on clear and hazy days in Beijing: a com-parative study using FT-ICR MS, Environ. Chem., 13, 888–901,https://doi.org/10.1071/en15230, 2016.
Kirchstetter, T. W. and Thatcher, T. L.: Contribution of or-ganic carbon to wood smoke particulate matter absorptionof solar radiation, Atmos. Chem. Phys., 12, 6067–6072,https://doi.org/10.5194/acp-12-6067-2012, 2012.
www.atmos-chem-phys.net/20/2513/2020/ Atmos. Chem. Phys., 20, 2513–2532, 2020

2530 J. Tang et al.: Molecular compositions and optical properties
Koch, B. and Dittmar, T.: From mass to structure: An aro-maticity index for high-resolution mass data of natural or-ganic matter, Rapid Commun. Mass Spectrom., 20, 926–932,https://doi.org/10.1002/rcm.2386, 2006.
Kumar, N. K., Corbin, J. C., Bruns, E. A., Massabó, D., Slowik,J. G., Drinovec, L., Mocnik, G., Prati, P., Vlachou, A., Bal-tensperger, U., Gysel, M., El-Haddad, I., and Prévôt, A. S.H.: Production of particulate brown carbon during atmosphericaging of residential wood-burning emissions, Atmos. Chem.Phys., 18, 17843–17861, https://doi.org/10.5194/acp-18-17843-2018, 2018.
Laskin, A., Laskin, J., and Nizkorodov, S. A.: Chemistry ofatmospheric brown carbon, Chem. Rev., 115, 4335–4382,https://doi.org/10.1021/cr5006167, 2015.
Laskin, A., Smith, J. S., and Laskin, J.: Molecular Charac-terization of Nitrogen-Containing Organic Compounds inBiomass Burning Aerosols Using High-Resolution MassSpectrometry, Environ. Sci. Technol., 43, 3764–3771,https://doi.org/10.1021/es803456n, 2009.
Lee, H. J., Laskin, A., Laskin, J., and Nizkorodov, S. A.: Excitation-emission spectra and fluorescence quantum yields for fresh andaged biogenic secondary organic aerosols, Environ. Sci. Tech-nol., 47, 5763–5770, https://doi.org/10.1021/es400644c, 2013.
Li, C., He, Q., Schade, J., Passig, J., Zimmermann, R., Mei-dan, D., Laskin, A., and Rudich, Y.: Dynamic changes in op-tical and chemical properties of tar ball aerosols by atmo-spheric photochemical aging, Atmos. Chem. Phys., 19, 139–163,https://doi.org/10.5194/acp-19-139-2019, 2019.
Li, M., Fan, X., Zhu, M., Zou, C., Song, J., Wei, S., Jia,W., and Peng, P.: Abundances and light absorption prop-erties of brown carbon emitted from residential coal com-bustion in China, Environ. Sci. Technol., 53, 595–603,https://doi.org/10.1021/acs.est.8b05630, 2018.
Lin, P., Rincon, A. G., Kalberer, M., and Yu, J. Z.: Elemental com-position of HULIS in the Pearl River Delta Region, China: resultsinferred from positive and negative electrospray high resolutionmass spectrometric data, Environ. Sci. Technol., 46, 7454–7462,https://doi.org/10.1021/es300285d, 2012a.
Lin, P., Yu, J. Z., Engling, G., and Kalberer, M.: Organosul-fates in humic-like substance fraction isolated from aerosols atseven locations in East Asia: a study by ultra-high-resolutionmass spectrometry, Environ. Sci. Technol., 46, 13118–13127,https://doi.org/10.1021/es303570v, 2012b.
Lin, P., Aiona, P. K., Li, Y., Shiraiwa, M., Laskin, J., Nizkorodov,S. A., and Laskin, A.: Molecular Characterization of Brown Car-bon in Biomass Burning Aerosol Particles, Environ. Sci. Tech-nol., 50, 11815–11824, https://doi.org/10.1021/acs.est.6b03024,2016.
Lin, P., Fleming, L. T., Nizkorodov, S. A., Laskin, J., andLaskin, A.: Comprehensive Molecular Characterizationof Atmospheric Brown Carbon by High Resolution MassSpectrometry with Electrospray and Atmospheric Pres-sure Photoionization, Anal. Chem., 90, 12493–12502,https://doi.org/10.1021/acs.analchem.8b02177, 2018.
Liu, J., Bergin, M., Guo, H., King, L., Kotra, N., Edgerton, E.,and Weber, R. J.: Size-resolved measurements of brown carbonin water and methanol extracts and estimates of their contri-bution to ambient fine-particle light absorption, Atmos. Chem.
Phys., 13, 12389–12404, https://doi.org/10.5194/acp-13-12389-2013, 2013.
Liu, J., Mo, Y., Ding, P., Li, J., Shen, C., and Zhang,G.: Dual carbon isotopes (14C and 13C) and opticalproperties of WSOC and HULIS-C during winter inGuangzhou, China, Sci. Total Environ., 633, 1571–1578,https://doi.org/10.1016/j.scitotenv.2018.03.293, 2018.
Luciani, X., Mounier, S., Redon, R., and Bois, A.: Asimple correction method of inner filter effects affect-ing FEEM and its application to the PARAFAC de-composition, Chemom. Intell. Lab. Syst., 96, 227–238,https://doi.org/10.1016/j.chemolab.2009.02.008, 2009.
Lv, J., Zhang, S., Wang, S., Luo, L., Cao, D., and Christie, P.:Molecular-Scale Investigation with ESI-FT-ICR-MS on Frac-tionation of Dissolved Organic Matter Induced by Adsorptionon Iron Oxyhydroxides, Environ. Sci. Technol., 50, 2328–2336,https://doi.org/10.1021/acs.est.5b04996, 2016.
Matos, J. T. V., Freire, S. M. S. C., Duarte, R. M. B. O.,and Duarte, A. C.: Natural organic matter in urban aerosols:Comparison between water and alkaline soluble componentsusing excitation–emission matrix fluorescence spectroscopyand multiway data analysis, Atmos. Environ., 102, 1–10,https://doi.org/10.1016/j.atmosenv.2014.11.042, 2015.
Mazzoleni, L. R., Ehrmann, B. M., Shen, X. H., Marshall, A.G., and Collett, J. L.: Water-Soluble Atmospheric Organic Mat-ter in Fog: Exact Masses and Chemical Formula Identificationby Ultrahigh-Resolution Fourier Transform Ion Cyclotron Res-onance Mass Spectrometry, Environ. Sci. Technol., 44, 3690–3697, https://doi.org/10.1021/es903409k, 2010.
Mo, Y., Li, J., Jiang, B., Su, T., Geng, X., Liu, J., Jiang,H., Shen, C., Ding, P., Zhong, G., Cheng, Z., Liao, Y.,Tian, C., Chen, Y., and Zhang, G.: Sources, compositions,and optical properties of humic-like substances in Beijingduring the 2014 APEC summit: Results from dual car-bon isotope and Fourier-transform ion cyclotron resonancemass spectrometry analyses, Environ. Pollut., 239, 322–331,https://doi.org/10.1016/j.envpol.2018.04.041, 2018.
Mo, Y. Z., Li, J., Liu, J. W., Zhong, G. C., Cheng, Z. N., Tian,C. G., Chen, Y. J., and Zhang, G.: The influence of solventand pH on determination of the light absorption propertiesof water-soluble brown carbon, Atmos. Environ., 161, 90–98,https://doi.org/10.1016/j.atmosenv.2017.04.037, 2017.
Murphy, K. R., Butler, K. D., Spencer, R. G., Stedmon, C. A.,Boehme, J. R., and Aiken, G. R.: Measurement of dissolvedorganic matter fluorescence in aquatic environments: an inter-laboratory comparison, Environ. Sci. Technol., 44, 9405–9412,https://doi.org/10.1021/es102362t, 2010.
Murphy, K. R., Stedmon, C. A., Graeber, D., and Bro, R.: Fluores-cence spectroscopy and multi-way techniques, PARAFAC, Anal.Methods, 5, 6557–6566, https://doi.org/10.1039/c3ay41160e,2013.
Park, S., Yu, G.-H., and Lee, S.: Optical absorption char-acteristics of brown carbon aerosols during the KORUS-AQ campaign at an urban site, Atmos. Res., 203, 16–27,https://doi.org/10.1016/j.atmosres.2017.12.002, 2018.
Park, S. S. and Yu, J.: Chemical and light absorption propertiesof humic-like substances from biomass burning emissions undercontrolled combustion experiments, Atmos. Environ., 136, 114–122, https://doi.org/10.1016/j.atmosenv.2016.04.022, 2016.
Atmos. Chem. Phys., 20, 2513–2532, 2020 www.atmos-chem-phys.net/20/2513/2020/

J. Tang et al.: Molecular compositions and optical properties 2531
Qin, J., Zhang, L., Zhou, X., Duan, J., Mu, S., Xiao, K., Hu, J.,and Tan, J.: Fluorescence fingerprinting properties for explor-ing water-soluble organic compounds in PM2.5 in an indus-trial city of northwest China, Atmos. Environ., 184, 203–211,https://doi.org/10.1016/j.atmosenv.2018.04.049, 2018.
Saleh, R., Robinson, E. S., Tkacik, D. S., Ahern, A. T., Liu,S., Aiken, A. C., Sullivan, R. C., Presto, A. A., Dubey,M. K., Yokelson, R. J., Donahue, N. M., and Robinson, A.L.: Brownness of organics in aerosols from biomass burninglinked to their black carbon content, Nat. Geosci., 7, 647–650,https://doi.org/10.1038/ngeo2220, 2014.
Schmitt-Kopplin, P., Gelencser, A., Dabek-Zlotorzynska, E., Kiss,G., Hertkorn, N., Harir, M., Hong, Y., and Gebefugi, I.:Analysis of the Unresolved Organic Fraction in AtmosphericAerosols with Ultrahigh-Resolution Mass Spectrometry and Nu-clear Magnetic Resonance Spectroscopy: Organosulfates AsPhotochemical Smog Constituents, Anal. Chem., 82, 8017–8026,https://doi.org/10.1021/ac101444r, 2010.
Sgroi, M., Roccaro, P., Korshin, G. V., and Vagliasindi, F. G.A.: Monitoring the Behavior of Emerging Contaminants inWastewater-Impacted Rivers Based on the Use of FluorescenceExcitation Emission Matrixes (EEM), Environ. Sci. Technol., 51,4306–4316, https://doi.org/10.1021/acs.est.6b05785, 2017.
Shetty, N. J., Pandey, A., Baker, S., Hao, W. M., andChakrabarty, R. K.: Measuring light absorption by freshly emit-ted organic aerosols: optical artifacts in traditional solvent-extraction-based methods, Atmos. Chem. Phys., 19, 8817–8830,https://doi.org/10.5194/acp-19-8817-2019, 2019.
Shimabuku, K. K., Kennedy, A. M., Mulhern, R. E., and Sum-mers, R. S.: Evaluating Activated Carbon Adsorption of Dis-solved Organic Matter and Micropollutants Using Fluores-cence Spectroscopy, Environ. Sci. Technol., 51, 2676–2684,https://doi.org/10.1021/acs.est.6b04911, 2017.
Sleighter, R. L., Chen, H., Wozniak, A. S., Willoughby, A. S., Car-icasole, P., and Hatcher, P. G.: Establishing a measure of repro-ducibility of ultrahigh-resolution mass spectra for complex mix-tures of natural organic matter, Anal. Chem., 84, 9184–9191,https://doi.org/10.1021/ac3018026, 2012.
Smith, J. S., Laskin, A., and Laskin, J.: Molecular Char-acterization of Biomass Burning Aerosols Using High-Resolution Mass Spectrometry, Anal. Chem., 81, 1512–1521,https://doi.org/10.1021/ac8020664, 2009.
Song, J., Li, M., Jiang, B., Wei, S., Fan, X., and Peng, P.:Molecular Characterization of Water-Soluble Humic like Sub-stances in Smoke Particles Emitted from Combustion ofBiomass Materials and Coal Using Ultrahigh-Resolution Elec-trospray Ionization Fourier Transform Ion Cyclotron ResonanceMass Spectrometry, Environ. Sci. Technol., 52, 2575–2585,https://doi.org/10.1021/acs.est.7b06126, 2018.
Song, J., Li, M., Fan, X., Zou, C., Zhu, M., Jiang, B., Yu, Z.,Jia, W., Liao, Y., and Peng, P. A.: Molecular characteriza-tion of water- and methanol-soluble organic compounds emittedfrom residential coal combustion using ultrahigh-resolution elec-trospray ionization Fourier transform ion cyclotron resonancemass spectrometry, Environ. Sci. Technol., 53, 13607–13617,https://doi.org/10.1021/acs.est.9b04331, 2019.
Stubbins, A., Lapierre, J. F., Berggren, M., Prairie, Y. T., Dittmar,T., and del Giorgio, P. A.: What’s in an EEM? Molecu-lar signatures associated with dissolved organic fluorescence
in boreal Canada, Environ. Sci. Technol., 48, 10598–10606,https://doi.org/10.1021/es502086e, 2014.
Sun, H., Biedermann, L., and Bond, T. C.: Color of browncarbon: A model for ultraviolet and visible light absorptionby organic carbon aerosol, Geophys. Res. Lett., 34, L17813,https://doi.org/10.1029/2007gl029797, 2007.
Tao, S., Lu, X., Levac, N., Bateman, A. P., Nguyen, T. B., Bones,D. L., Nizkorodov, S. A., Laskin, J., Laskin, A., and Yang,X.: Molecular Characterization of Organosulfates in OrganicAerosols from Shanghai and Los Angeles Urban Areas byNanospray-Desorption Electrospray Ionization High-ResolutionMass Spectrometry, Environ. Sci. Technol., 48, 10993–11001,https://doi.org/10.1021/es5024674, 2014.
Tian, J., Ni, H., Cao, J., Han, Y., Wang, Q., Wang, X., Chen,L. W. A., Chow, J. C., Watson, J. G., Wei, C., Sun, J.,Zhang, T., and Huang, R.: Characteristics of carbonaceousparticles from residential coal combustion and agriculturalbiomass burning in China, Atmos. Pollut. Res., 8, 521–527,https://doi.org/10.1016/j.apr.2016.12.006, 2017.
Wang, Y., Hu, M., Lin, P., Guo, Q., Wu, Z., Li, M., Zeng,L., Song, Y., Zeng, L., Wu, Y., Guo, S., Huang, X., andHe, L.: Molecular Characterization of Nitrogen-Containing Or-ganic Compounds in Humic-like Substances Emitted fromStraw Residue Burning, Environ. Sci. Technol., 51, 5951–5961,https://doi.org/10.1021/acs.est.7b00248, 2017.
Wells, M. J. M., Mullins, G. A., Bell, K. Y., Da Silva, A. K.,and Navarrete, E. M.: Fluorescence and Quenching Assess-ment (EEM-PARAFAC) of de Facto Potable Reuse in the NeuseRiver, North Carolina, United States, Environ. Sci. Technol., 51,13592–13602, https://doi.org/10.1021/acs.est.7b03766, 2017.
Wong, J. P. S., Nenes, A., and Weber, R. J.: Changes in Light Ab-sorptivity of Molecular Weight Separated Brown Carbon Dueto Photolytic Aging, Environ. Sci. Technol., 51, 8414–8421,https://doi.org/10.1021/acs.est.7b01739, 2017.
Wozniak, A. S., Bauer, J. E., Sleighter, R. L., Dickhut, R. M., andHatcher, P. G.: Technical Note: Molecular characterization ofaerosol-derived water soluble organic carbon using ultrahigh res-olution electrospray ionization Fourier transform ion cyclotronresonance mass spectrometry, Atmos. Chem. Phys., 8, 5099–5111, https://doi.org/10.5194/acp-8-5099-2008, 2008.
Wu, G., Ram, K., Fu, P., Wang, W., Zhang, Y., Liu, X., Stone, E. A.,Pradhan, B. B., Dangol, P. M., Panday, A. K., Wan, X., Bai, Z.,Kang, S., Zhang, Q., and Cong, Z.: Water-Soluble Brown Car-bon in Atmospheric Aerosols from Godavari (Nepal), a RegionalRepresentative of South Asia, Environ. Sci. Technol., 53, 3471–3479, https://doi.org/10.1021/acs.est.9b00596, 2019.
Xie, M., Hays, M. D., and Holder, A. L.: Light-absorbing or-ganic carbon from prescribed and laboratory biomass burn-ing and gasoline vehicle emissions, Sci. Rep., 7, 7318,https://doi.org/10.1038/s41598-017-06981-8, 2017.
Xie, M., Chen, X., Holder, A. L., Hays, M. D., Lewandowski, M.,Offenberg, J. H., Kleindienst, T. E., Jaoui, M., and Hannigan,M. P.: Light absorption of organic carbon and its sources at asoutheastern U.S. location in summer, Environ. Pollut., 244, 38–46, https://doi.org/10.1016/j.envpol.2018.09.125, 2019.
Yan, C., Zheng, M., Sullivan, A. P., Bosch, C., Desyaterik,Y., Andersson, A., Li, X., Guo, X., Zhou, T., Gustafsson,Ö., and Collett, J. L.: Chemical characteristics and light-absorbing property of water-soluble organic carbon in Beijing:
www.atmos-chem-phys.net/20/2513/2020/ Atmos. Chem. Phys., 20, 2513–2532, 2020

2532 J. Tang et al.: Molecular compositions and optical properties
Biomass burning contributions, Atmos. Environ., 121, 4–12,https://doi.org/10.1016/j.atmosenv.2015.05.005, 2015.
Yan, G. and Kim, G.: Speciation and Sources of BrownCarbon in Precipitation at Seoul, Korea: Insights fromExcitation-Emission Matrix Spectroscopy and Carbon Iso-topic Analysis, Environ. Sci. Technol., 51, 11580–11587,https://doi.org/10.1021/acs.est.7b02892, 2017.
Yassine, M. M., Dabek-Zlotorzynska, E., Harir, M., and Schmitt-Kopplin, P.: Identification of weak and strong organic acids in at-mospheric aerosols by capillary electrophoresis/mass spectrom-etry and ultra-high-resolution Fourier transform ion cyclotronresonance mass spectrometry, Anal. Chem., 84, 6586–6594,https://doi.org/10.1021/ac300798g, 2012.
Yu, H., Liang, H., Qu, F., Han, Z. S., Shao, S., Chang, H., andLi, G.: Impact of dataset diversity on accuracy and sensitiv-ity of parallel factor analysis model of dissolved organic mat-ter fluorescence excitation-emission matrix, Sci. Rep., 5, 10207,https://doi.org/10.1038/srep10207, 2015.
Zhang, X., Lin, Y. H., Surratt, J. D., Zotter, P., Prevot, A. S. H.,and Weber, R. J.: Light soluble organic aerosol in Los Angelesand Atlanta: A contrast in secondary organic aerosol, Geophys.Res. Lett., 38, L21810, https://doi.org/10.1029/2011GL049385,2011.
Zhang, X., Lin, Y. H., Surratt, J. D., and Weber, R. J.:Sources, composition and absorption Angstrom exponent oflight-absorbing organic components in aerosol extracts fromthe Los Angeles Basin, Environ. Sci. Technol., 47, 3685–3693,https://doi.org/10.1021/es305047b, 2013.
Zhang, Y., Yuan, Q., Huang, D., Kong, S., Zhang, J., Wang, X., Lu,C., Shi, Z., Zhang, X., Sun, Y., Wang, Z., Shao, L., Zhu, J., andLi, W.: Direct Observations of Fine Primary Particles From Resi-dential Coal Burning: Insights Into Their Morphology, Composi-tion, and Hygroscopicity, J. Geophys. Res.-Atmos, 123, 12964–12979, https://doi.org/10.1029/2018jd028988, 2018.
Zhao, Y., Hallar, A. G., and Mazzoleni, L. R.: Atmo-spheric organic matter in clouds: exact masses and molec-ular formula identification using ultrahigh-resolution FT-ICRmass spectrometry, Atmos. Chem. Phys., 13, 12343–12362,https://doi.org/10.5194/acp-13-12343-2013, 2013.
Zhu, C. S., Cao, J. J., Huang, R. J., Shen, Z. X., Wang, Q. Y., andZhang, N. N.: Light absorption properties of brown carbon overthe southeastern Tibetan Plateau, Sci. Total Environ., 625, 246–251, https://doi.org/10.1016/j.scitotenv.2017.12.183, 2018.
Atmos. Chem. Phys., 20, 2513–2532, 2020 www.atmos-chem-phys.net/20/2513/2020/