molecular communications in four dimensions · molecular communications in four dimensions founded...
TRANSCRIPT
Boris N. Kholodenko
Systems Biology Ireland, University College Dublin
Dublin, Ireland
Molecular communications in four
dimensions

Founded 2009 by a CSET award from Science Foundation Ireland
~60 staff from >20 different nations wet and dry under one roof
- highly integrated research capacity - attractive for clinical collaborations
SBI – Who we are

Signal transduction networks provide the communication within
and between cells. 15% of our genes are dedicated to communication.
Why focus on signal transduction networks?
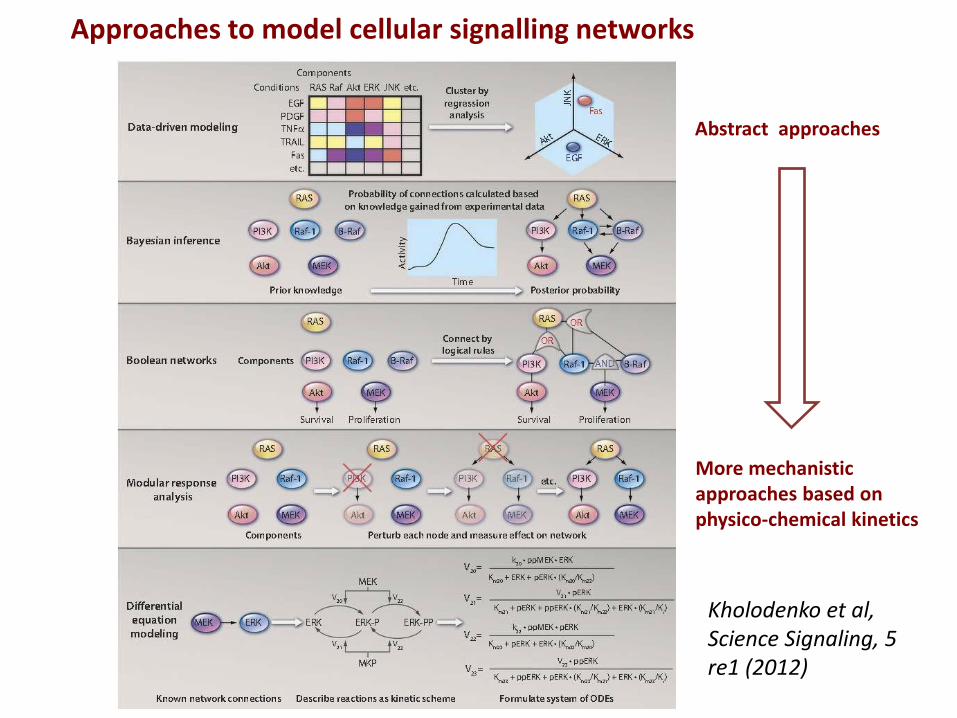
Approaches to model cellular signalling networks
Kholodenko et al, Science Signaling, 5 re1 (2012)
Abstract approaches
More mechanistic approaches based on physico-chemical kinetics
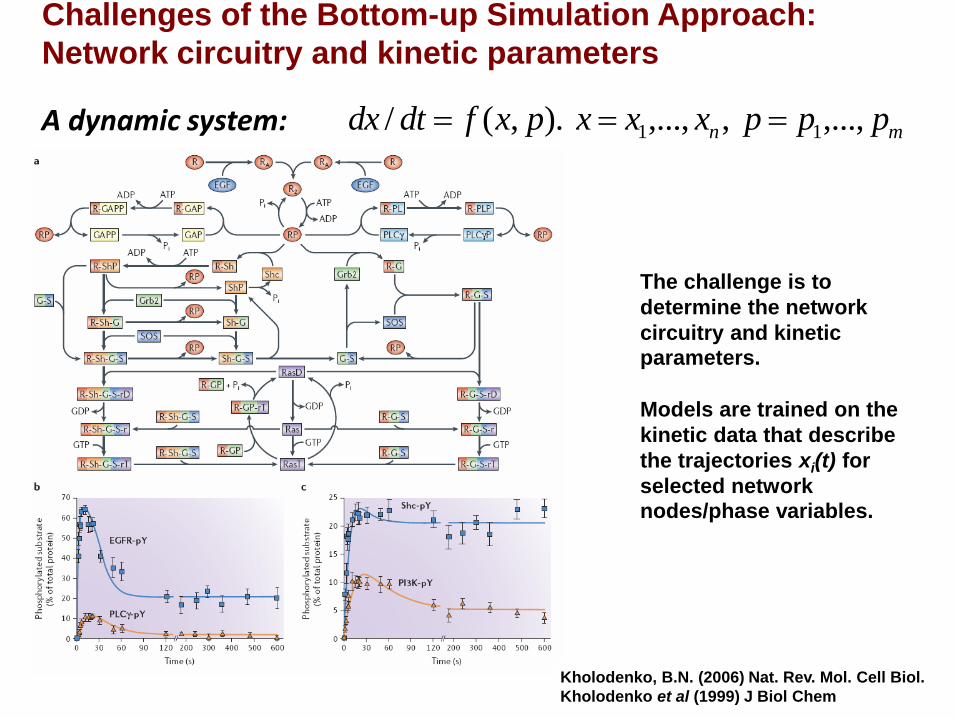
Kholodenko, B.N. (2006) Nat. Rev. Mol. Cell Biol.
Kholodenko et al (1999) J Biol Chem
The challenge is to
determine the network
circuitry and kinetic
parameters.
Models are trained on the
kinetic data that describe
the trajectories xi(t) for
selected network
nodes/phase variables.
A dynamic system: mn pppxxxpxfdtdx ,...,,,...,).,(/ 11
Challenges of the Bottom-up Simulation Approach:
Network circuitry and kinetic parameters
S
E n - 1
1 E 1 E
T T
2 E 2 E
I
I
I
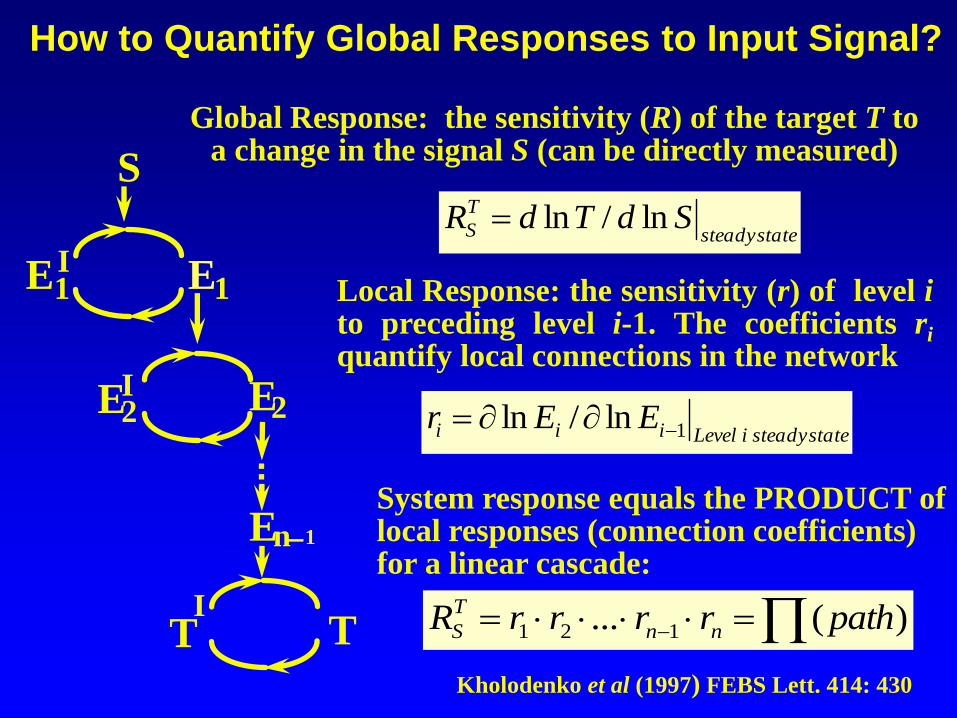
How to Quantify Global Responses to Input Signal?
Global Response: the sensitivity (R) of the target T to a change in the signal S (can be directly measured)
System response equals the PRODUCT of local responses (connection coefficients) for a linear cascade:
- )(... 121 pathrrrrR nn
T
S
statesteady
T
S SdTdR ln/ln
Local Response: the sensitivity (r) of level i to preceding level i-1. The coefficients ri quantify local connections in the network
statesteadyiLeveliii EEr 1ln/ln -
Kholodenko et al (1997) FEBS Lett. 414: 430
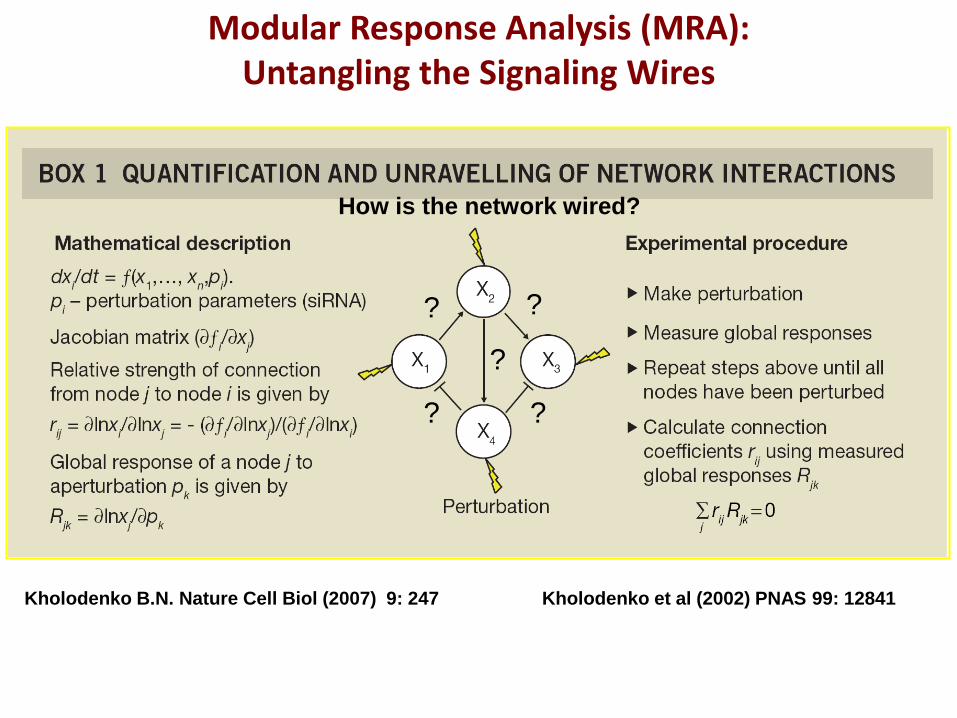
Modular Response Analysis (MRA): Untangling the Signaling Wires
Kholodenko B.N. Nature Cell Biol (2007) 9: 247 Kholodenko et al (2002) PNAS 99: 12841
?
?
? ?
?
How is the network wired?

Step 1: Determining Global Ras/MAPK Cascade Responses to Three Independent Perturbations
a) Measurement of the differences in steady-state variables following
perturbations:
4.33.67.12
9.81.32.6
7.39.64.7
---
--
-
8.214.397.85
8.563.208.44
0.253.465.55
-
--
---
b) Generation of the system response matrix
10% change in parameters 50% change in parameters
(1) (0) (1) (0)ln 2( ) /( )X X X X X -
1
1
1
ln
ln
ln
Raf P
MEK PP
ERK PP
-
- -
1
2
2
2
ln
ln
ln
Raf P
MEK PP
ERK PP
-
- -
2
3
3
3
ln
ln
ln
Raf P
MEK PP
ERK PP
-
- -
3
Kholodenko et al (2002) PNAS 99: 12841
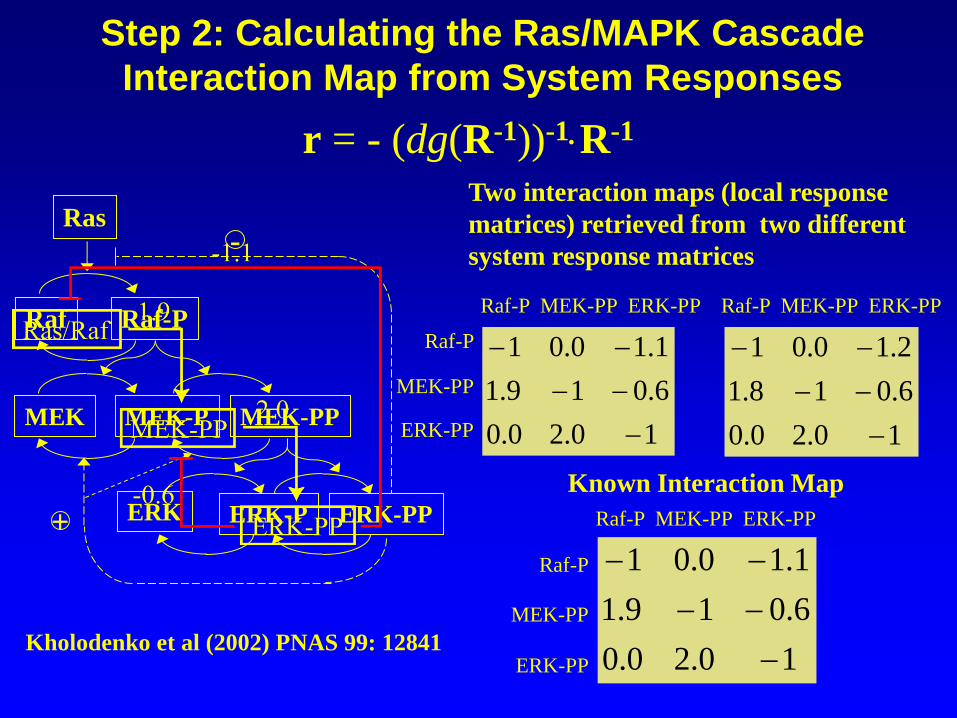
Step 2: Calculating the Ras/MAPK Cascade
Interaction Map from System Responses
r = - (dg(R-1))-1R-1
Raf-P Raf
MEK-PP MEK-P MEK
ERK-PP ERK-P ERK
Ras -
+
Kholodenko et al (2002) PNAS 99: 12841
10.20.0
6.018.1
2.10.01
-
--
--
10.20.0
6.019.1
1.10.01
-
--
--
10.20.0
6.019.1
1.10.01
-
--
--
Known Interaction Map
Two interaction maps (local response
matrices) retrieved from two different
system response matrices
Raf-P MEK-PP ERK-PP
Raf-P
MEK-PP
ERK-PP
Raf-P MEK-PP ERK-PP
Raf-P
MEK-PP
ERK-PP
Raf-P MEK-PP ERK-PP
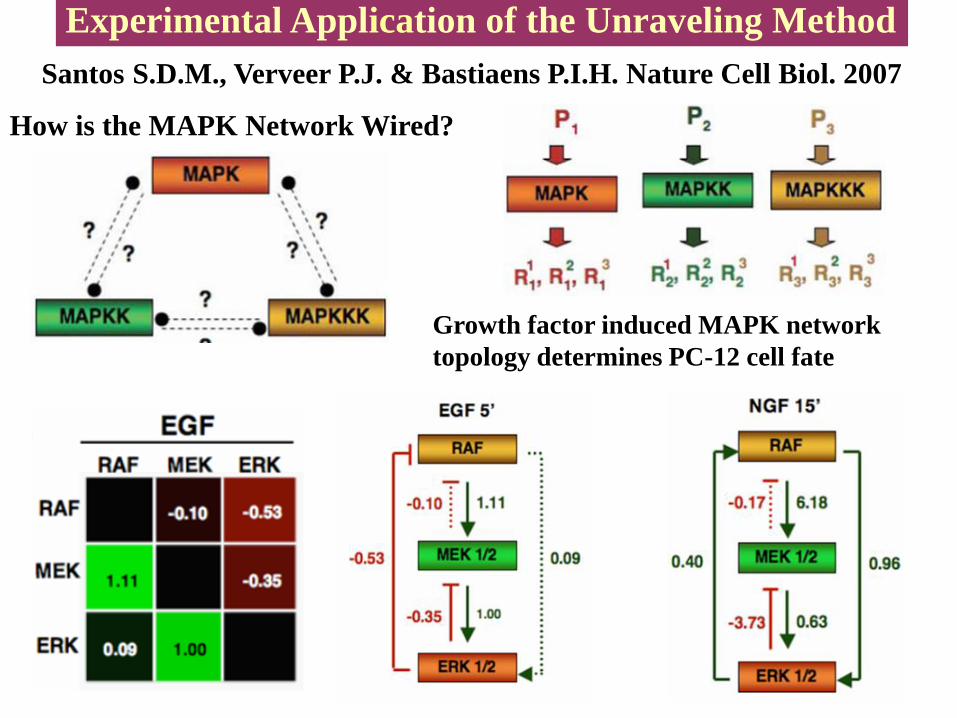
Experimental Application of the Unraveling Method
How is the MAPK Network Wired?
Santos S.D.M., Verveer P.J. & Bastiaens P.I.H. Nature Cell Biol. 2007
Growth factor induced MAPK network
topology determines PC-12 cell fate
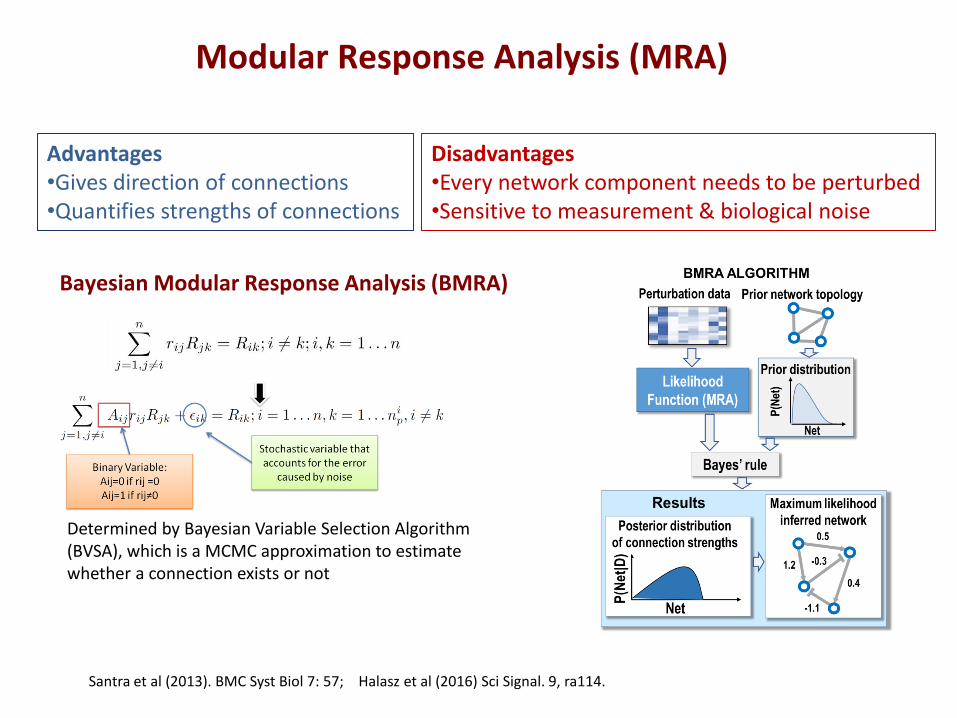
Advantages •Gives direction of connections •Quantifies strengths of connections
Disadvantages •Every network component needs to be perturbed •Sensitive to measurement & biological noise
Santra et al (2013). BMC Syst Biol 7: 57; Halasz et al (2016) Sci Signal. 9, ra114.
Bayesian Modular Response Analysis (BMRA)
Determined by Bayesian Variable Selection Algorithm (BVSA), which is a MCMC approximation to estimate whether a connection exists or not
Modular Response Analysis (MRA)
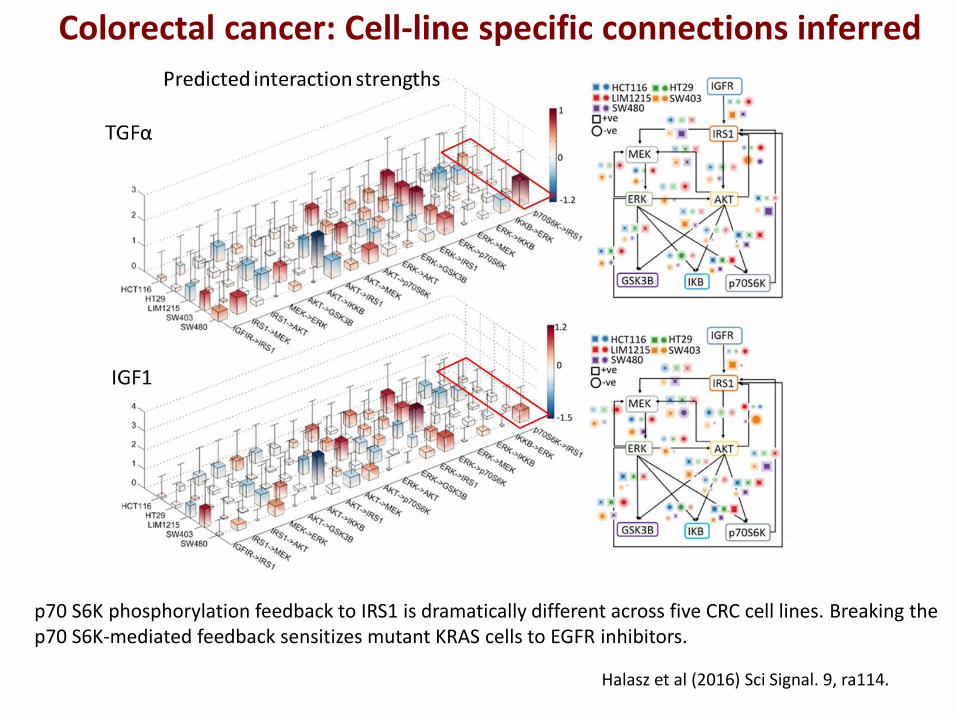
Colorectal cancer: Cell-line specific connections inferred
p70 S6K phosphorylation feedback to IRS1 is dramatically different across five CRC cell lines. Breaking the p70 S6K-mediated feedback sensitizes mutant KRAS cells to EGFR inhibitors.
Halasz et al (2016) Sci Signal. 9, ra114.
NGF
EGF
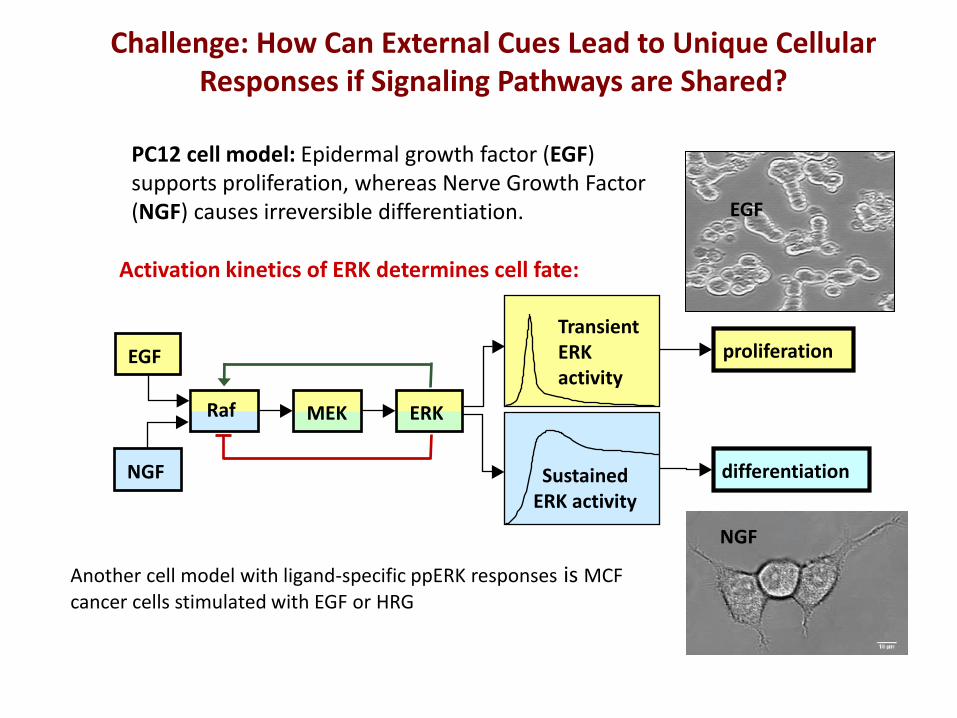
Activation kinetics of ERK determines cell fate:
differentiation
proliferation Transient ERK activity
Sustained ERK activity
NGF
EGF
MEK ERK Raf
PC12 cell model: Epidermal growth factor (EGF) supports proliferation, whereas Nerve Growth Factor (NGF) causes irreversible differentiation.
Challenge: How Can External Cues Lead to Unique Cellular Responses if Signaling Pathways are Shared?
Another cell model with ligand-specific ppERK responses is MCF cancer cells stimulated with EGF or HRG
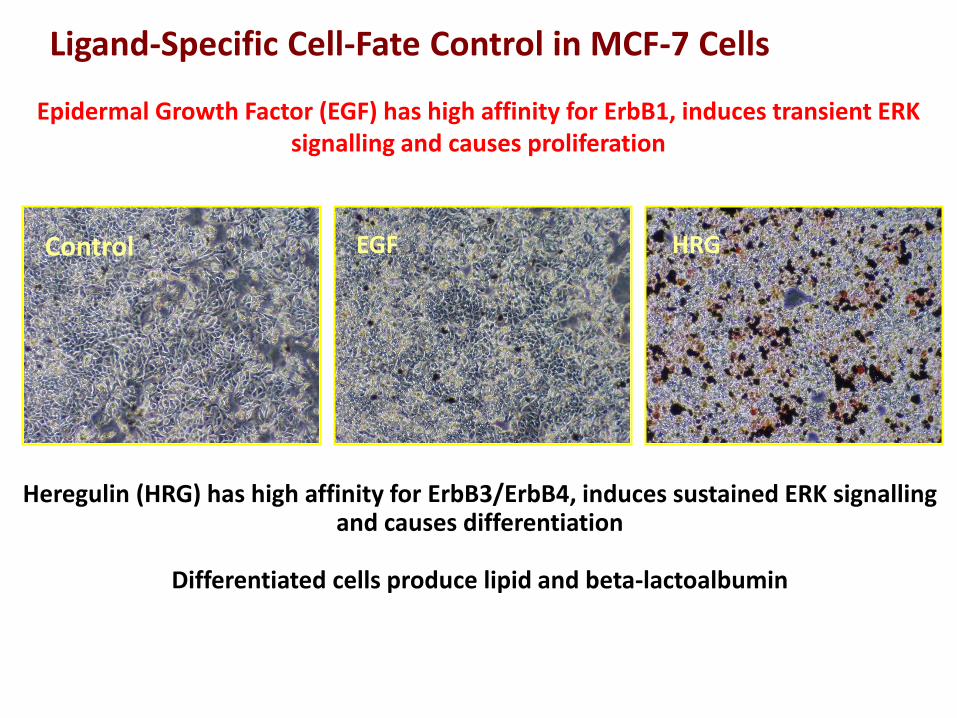
Ligand-Specific Cell-Fate Control in MCF-7 Cells
Epidermal Growth Factor (EGF) has high affinity for ErbB1, induces transient ERK signalling and causes proliferation
Heregulin (HRG) has high affinity for ErbB3/ErbB4, induces sustained ERK signalling and causes differentiation
Differentiated cells produce lipid and beta-lactoalbumin
Control EGF HRG
EGF/HRG
Transient
Sustained
Transient
Transient All
Nothing
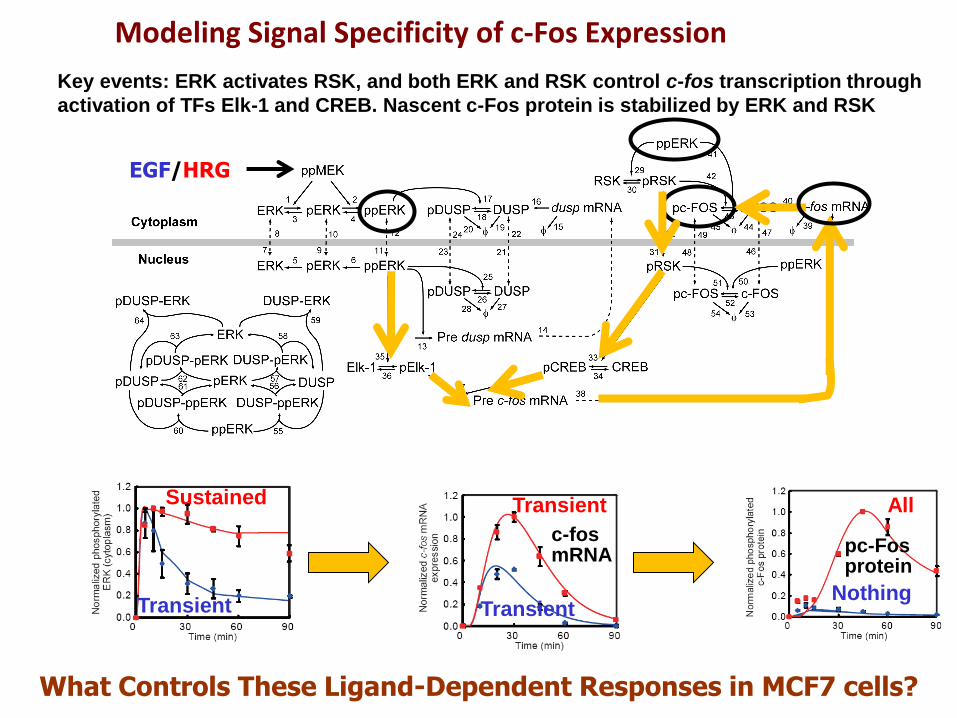
What Controls These Ligand-Dependent Responses in MCF7 cells?
Modeling Signal Specificity of c-Fos Expression
c-fos mRNA pc-Fos
protein
Key events: ERK activates RSK, and both ERK and RSK control c-fos transcription through
activation of TFs Elk-1 and CREB. Nascent c-Fos protein is stabilized by ERK and RSK
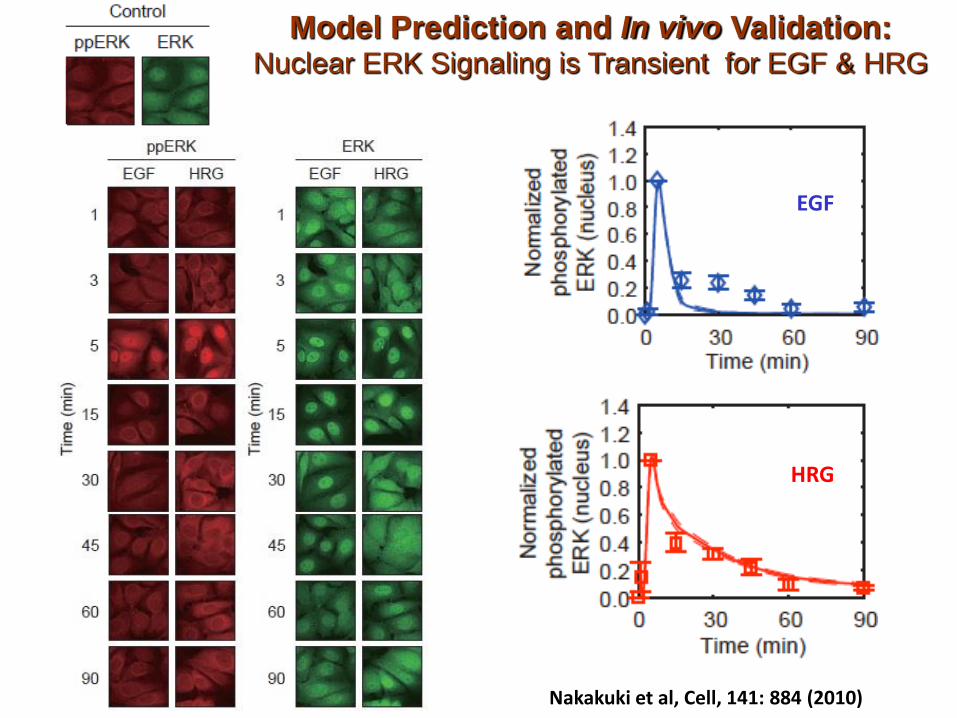
Model Prediction and In vivo Validation: Nuclear ERK Signaling is Transient for EGF & HRG
Nakakuki et al, Cell, 141: 884 (2010)
HRG
EGF
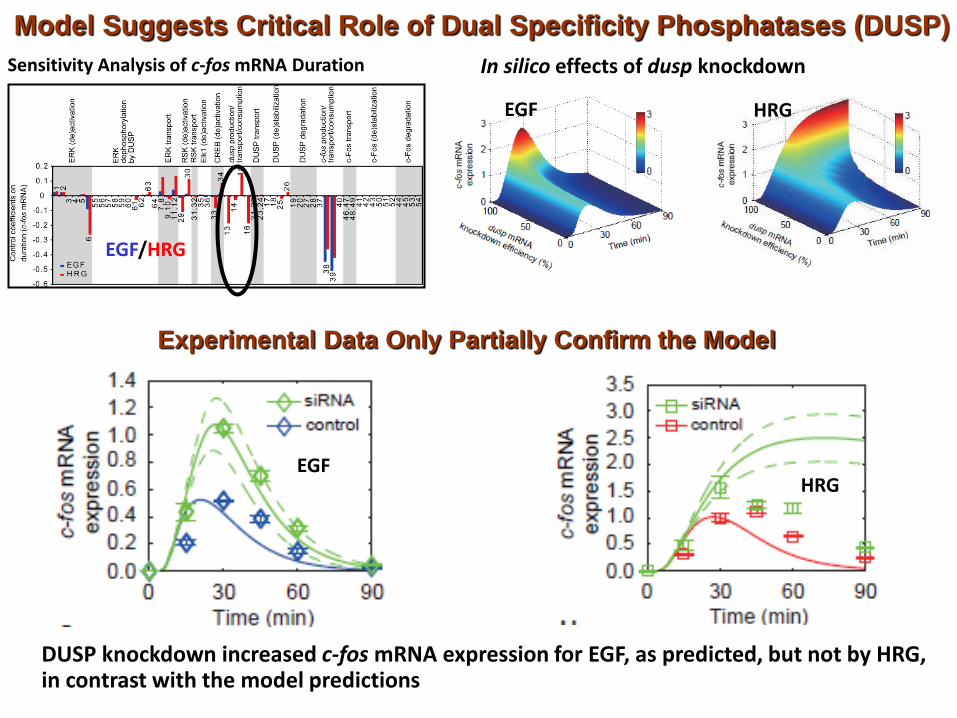
Sensitivity Analysis of c-fos mRNA Duration
Model Suggests Critical Role of Dual Specificity Phosphatases (DUSP)
In silico effects of dusp knockdown
EGF
EGF/HRG
HRG
Experimental Data Only Partially Confirm the Model
EGF HRG
DUSP knockdown increased c-fos mRNA expression for EGF, as predicted, but not by HRG, in contrast with the model predictions

Refined Model
Double-pulse and cycloheximide experiments demonstrate that there is a novel transcriptional repressor of c-fos expression that is induced by HRG, but not by EGF.
Pivotal Role of Transcriptional Negative Feedback Loops
Nakakuki et al, Cell 141: 884 (2010)
EGF HRG
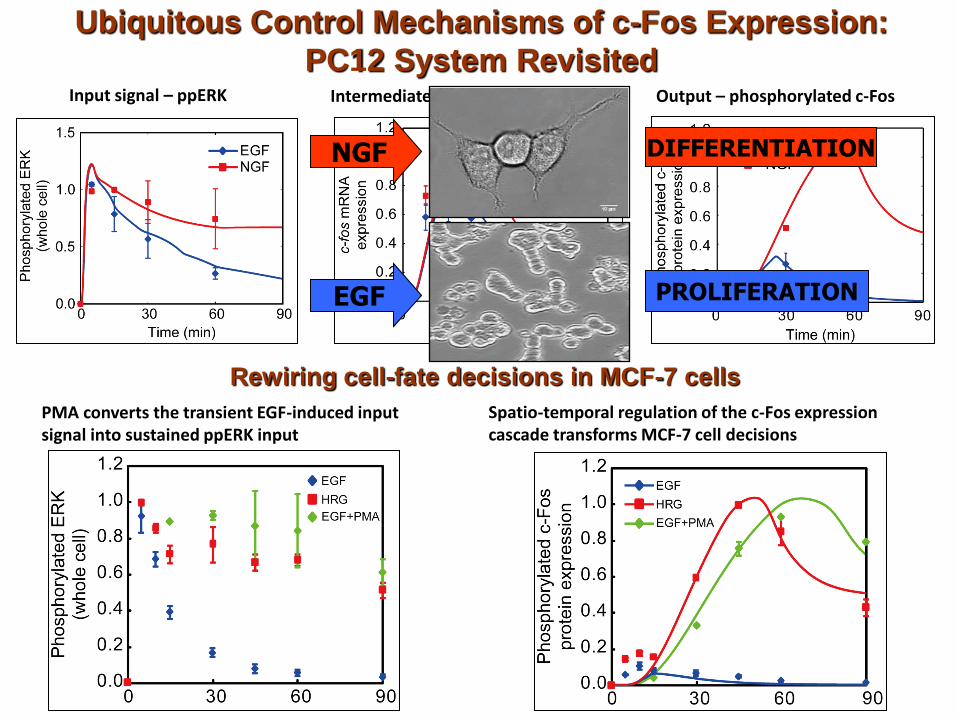
Ubiquitous Control Mechanisms of c-Fos Expression:
PC12 System Revisited Input signal – ppERK Intermediate signal – c-fos mRNA Output – phosphorylated c-Fos
Rewiring cell-fate decisions in MCF-7 cells
PMA converts the transient EGF-induced input signal into sustained ppERK input
Spatio-temporal regulation of the c-Fos expression cascade transforms MCF-7 cell decisions
NGF
EGF
DIFFERENTIATION
PROLIFERATION
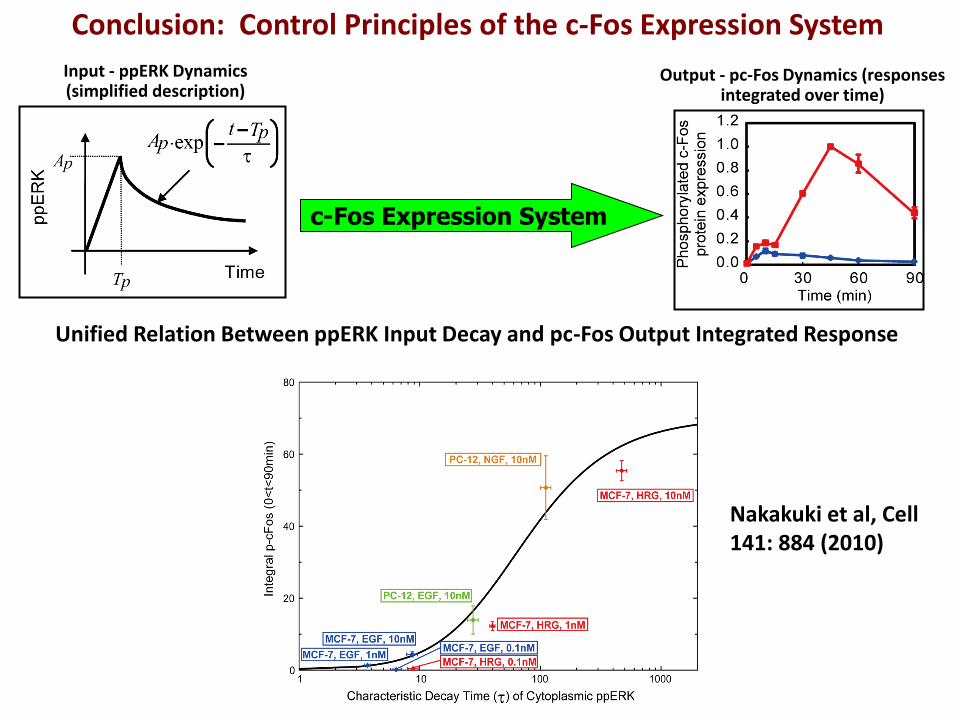
Conclusion: Control Principles of the c-Fos Expression System
Input - ppERK Dynamics (simplified description)
Output - pc-Fos Dynamics (responses integrated over time)
c-Fos Expression System
Unified Relation Between ppERK Input Decay and pc-Fos Output Integrated Response
Nakakuki et al, Cell 141: 884 (2010)
Catching 4-D Dynamics Surfing the Net
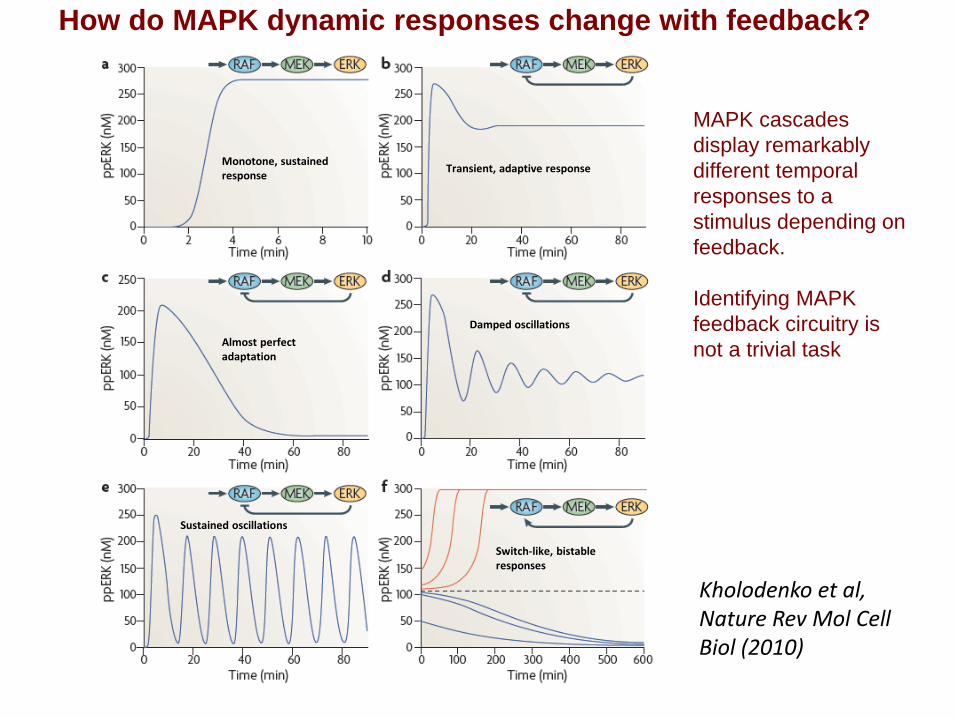
How do MAPK dynamic responses change with feedback?
Monotone, sustained response
Transient, adaptive response
Almost perfect adaptation
Damped oscillations
Sustained oscillations
Switch-like, bistable responses
MAPK cascades
display remarkably
different temporal
responses to a
stimulus depending on
feedback.
Identifying MAPK
feedback circuitry is
not a trivial task
Kholodenko et al, Nature Rev Mol Cell Biol (2010)
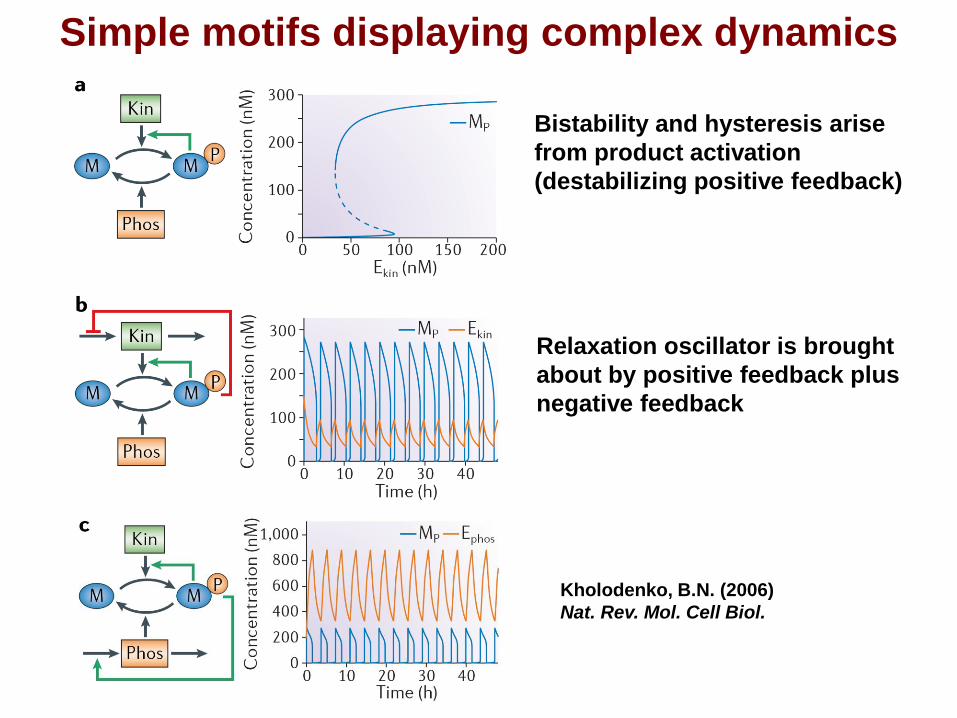
Simple motifs displaying complex dynamics
Bistability and hysteresis arise
from product activation
(destabilizing positive feedback)
Relaxation oscillator is brought
about by positive feedback plus
negative feedback
Kholodenko, B.N. (2006)
Nat. Rev. Mol. Cell Biol.
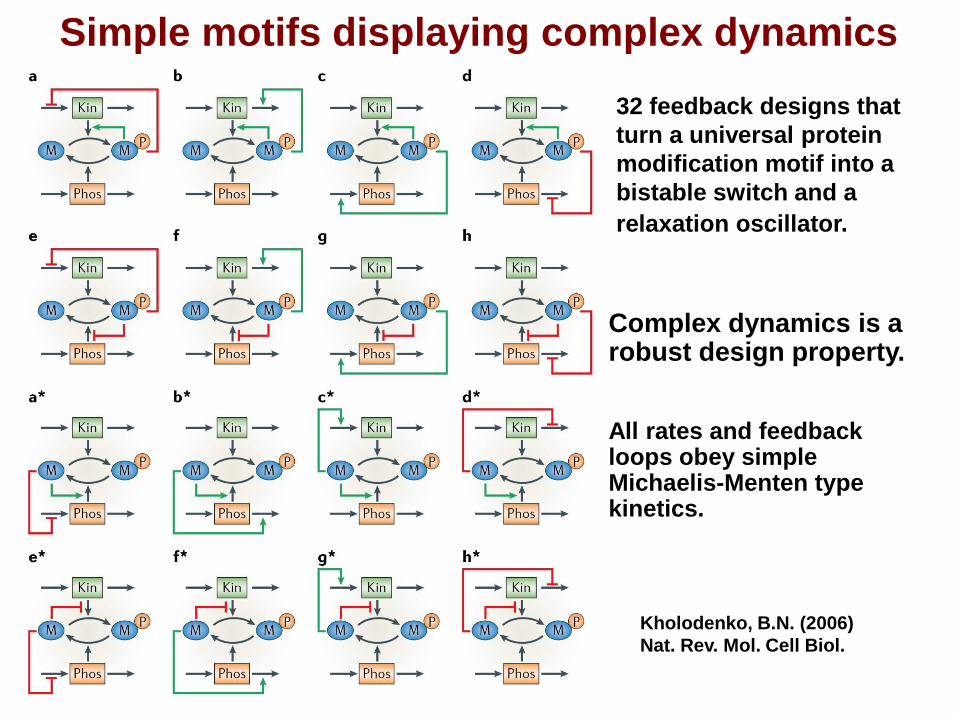
32 feedback designs that
turn a universal protein
modification motif into a
bistable switch and a
relaxation oscillator.
Complex dynamics is a robust design property. All rates and feedback loops obey simple Michaelis-Menten type kinetics.
Kholodenko, B.N. (2006)
Nat. Rev. Mol. Cell Biol.
Simple motifs displaying complex dynamics
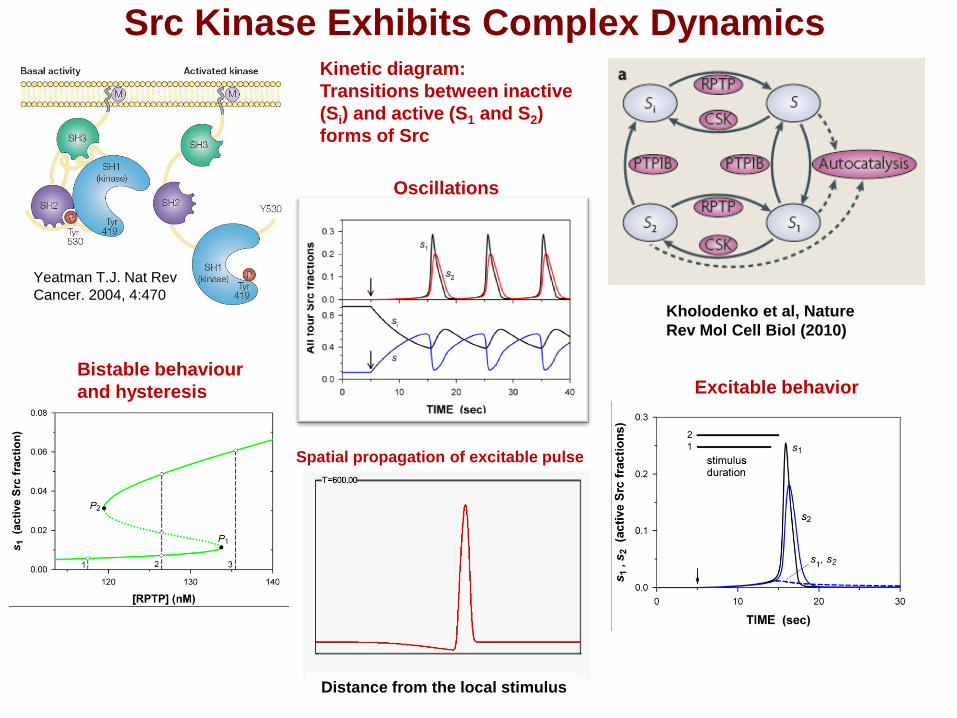
Src Kinase Exhibits Complex Dynamics
Yeatman T.J. Nat Rev
Cancer. 2004, 4:470
Kinetic diagram:
Transitions between inactive
(Si) and active (S1 and S2)
forms of Src
Bistable behaviour
and hysteresis
Oscillations
Excitable behavior
Spatial propagation of excitable pulse
Distance from the local stimulus
Kholodenko et al, Nature
Rev Mol Cell Biol (2010)
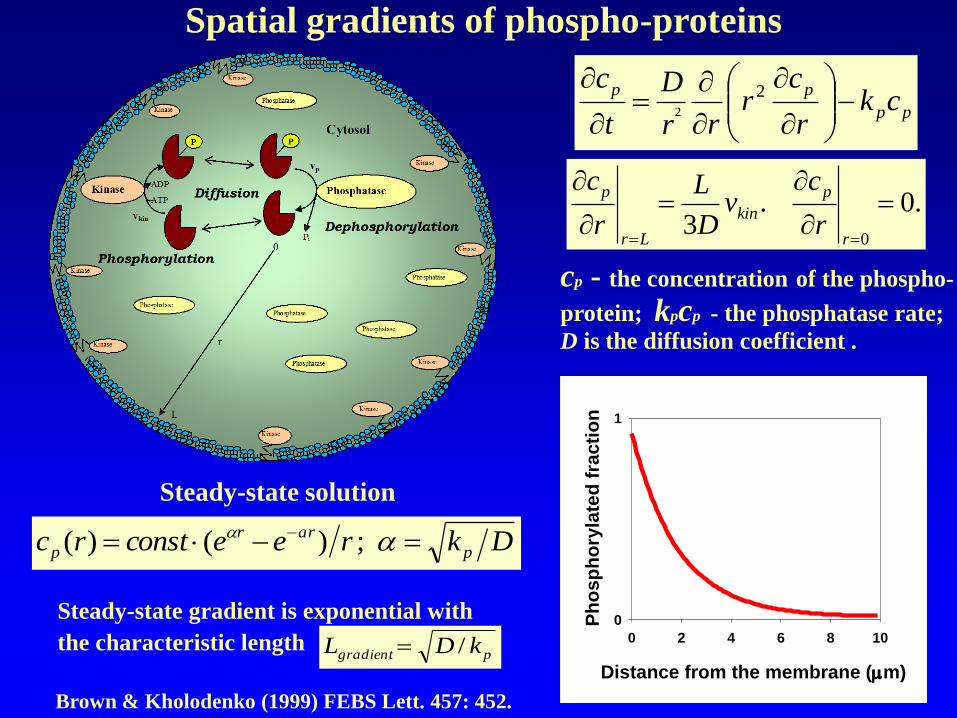
Spatial gradients of phospho-proteins
Steady-state solution
Dkreeconstrc p
arr
p - - ;)()(
cp - the concentration of the phospho-
protein; kpcp - the phosphatase rate;
D is the diffusion coefficient .
pp
ppck
r
cr
rr
D
t
c-
2
2
.0.3
0
r
p
kin
Lr
p
r
cv
D
L
r
c
Distance from the membrane (m)
0 2 4 6 8 10
Ph
os
ph
ory
late
d f
rac
tio
n
0
1
Brown & Kholodenko (1999) FEBS Lett. 457: 452.
pgradient kDL /
Steady-state gradient is exponential with
the characteristic length
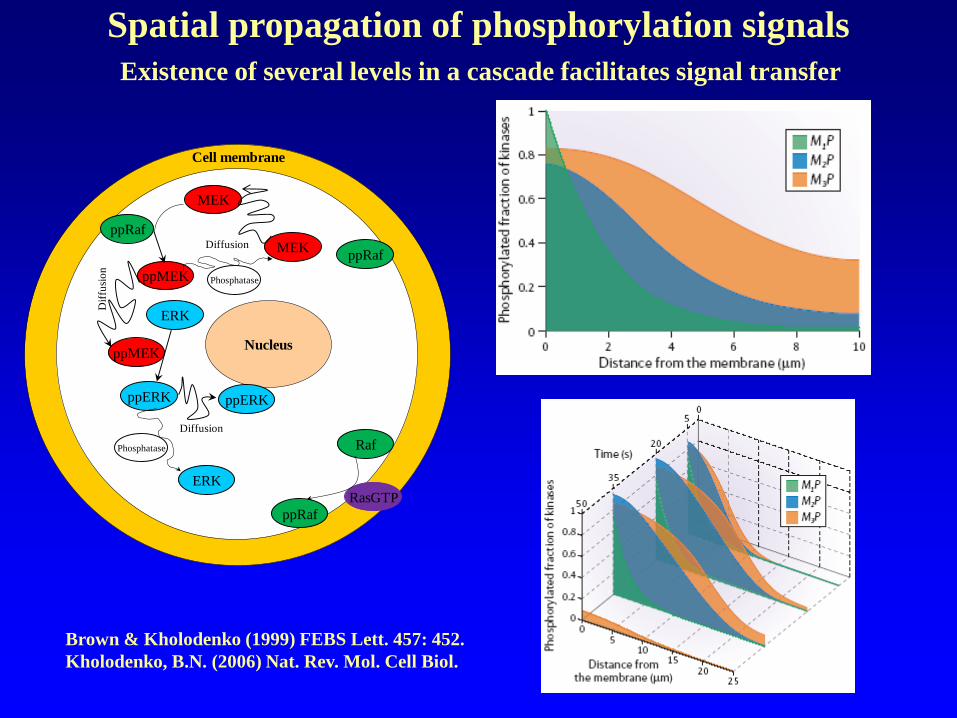
Spatial propagation of phosphorylation signals
Brown & Kholodenko (1999) FEBS Lett. 457: 452.
Kholodenko, B.N. (2006) Nat. Rev. Mol. Cell Biol.
Existence of several levels in a cascade facilitates signal transfer
DiffusioNucleus
ppRaf
ppRaf
ppRaf
Raf
Cell membrane
MEK
MEK
ppMEK
ppMEK
ERK
ppERK
ERK
ppERK
Dif
fusi
on
Diffusion
Phosphatase
Phosphatase
RasGTP
Diffusion
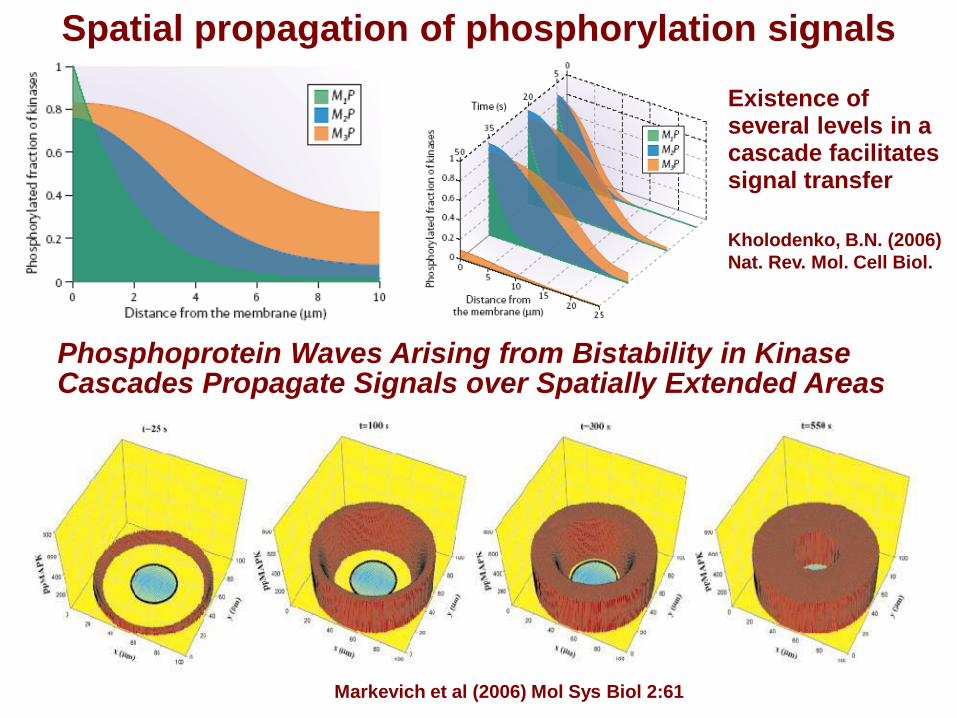
Spatial propagation of phosphorylation signals
Kholodenko, B.N. (2006)
Nat. Rev. Mol. Cell Biol.
Existence of several levels in a cascade facilitates signal transfer
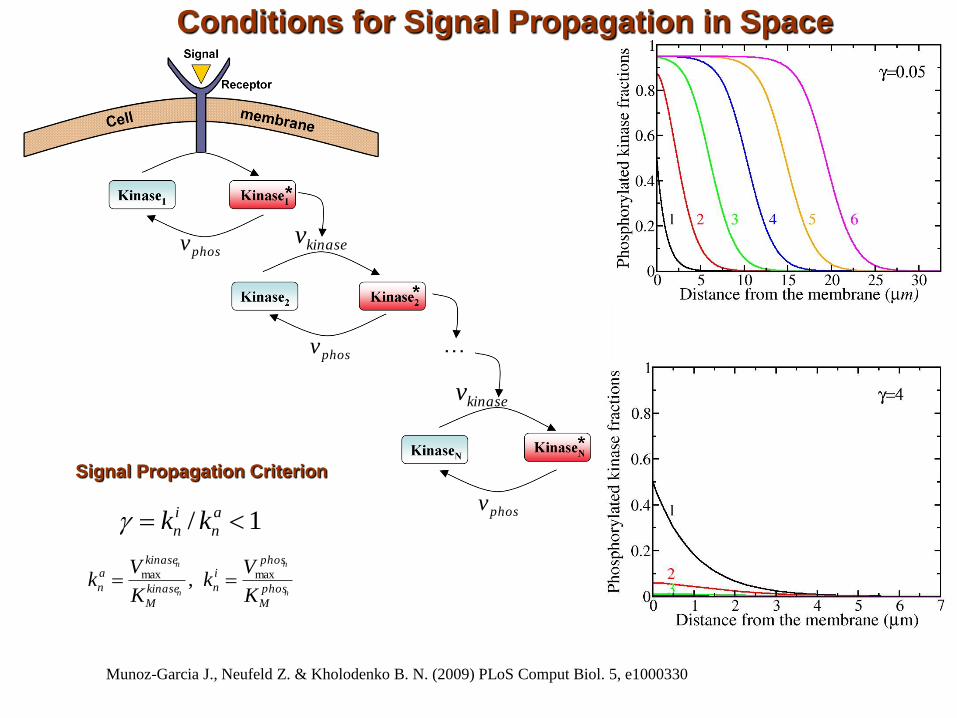
Phosphoprotein Waves Arising from Bistability in Kinase Cascades Propagate Signals over Spatially Extended Areas
Markevich et al (2006) Mol Sys Biol 2:61
phosv kinasev
kinasev
phosv
phosv
Conditions for Signal Propagation in Space
1/ a
n
i
n kk
n
n
n
n
phos
M
phosi
nkinase
M
kinasea
nK
Vk
K
Vk maxmax ,
Signal Propagation Criterion
Munoz-Garcia J., Neufeld Z. & Kholodenko B. N. (2009) PLoS Comput Biol. 5, e1000330
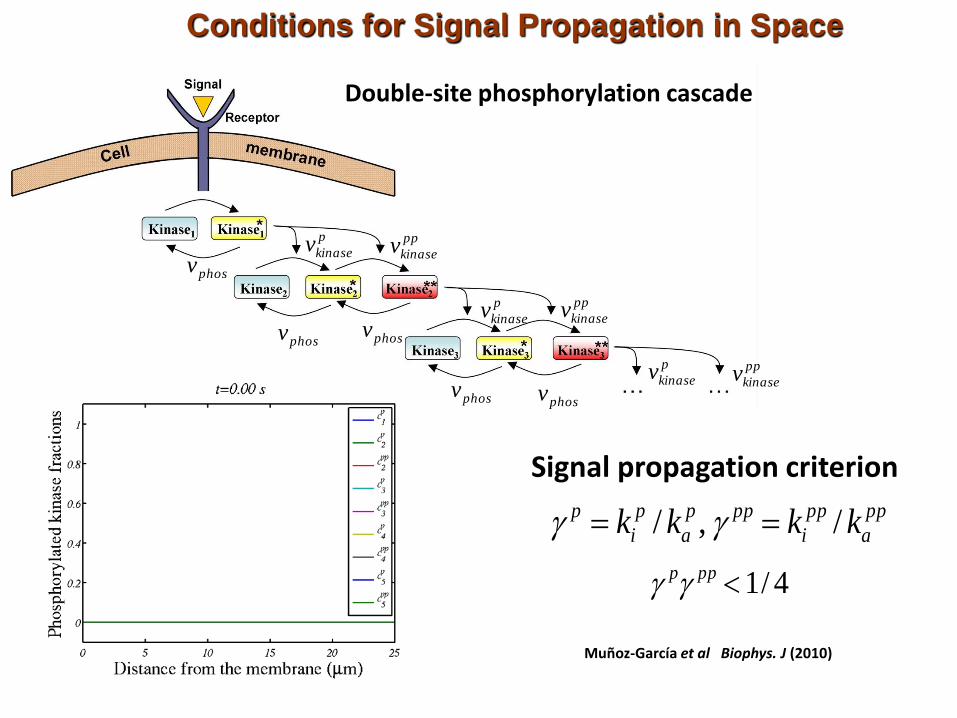
Conditions for Signal Propagation in Space
4/1ppp
pp
a
pp
i
ppp
a
p
i
p kkkk /,/
Signal propagation criterion
Muñoz-García et al Biophys. J (2010)
Double-site phosphorylation cascade
phosv
phosvphosv
phosv phosv
pp
kinasev
pp
kinasev
pp
kinasev
p
kinasev
p
kinasev
p
kinasev
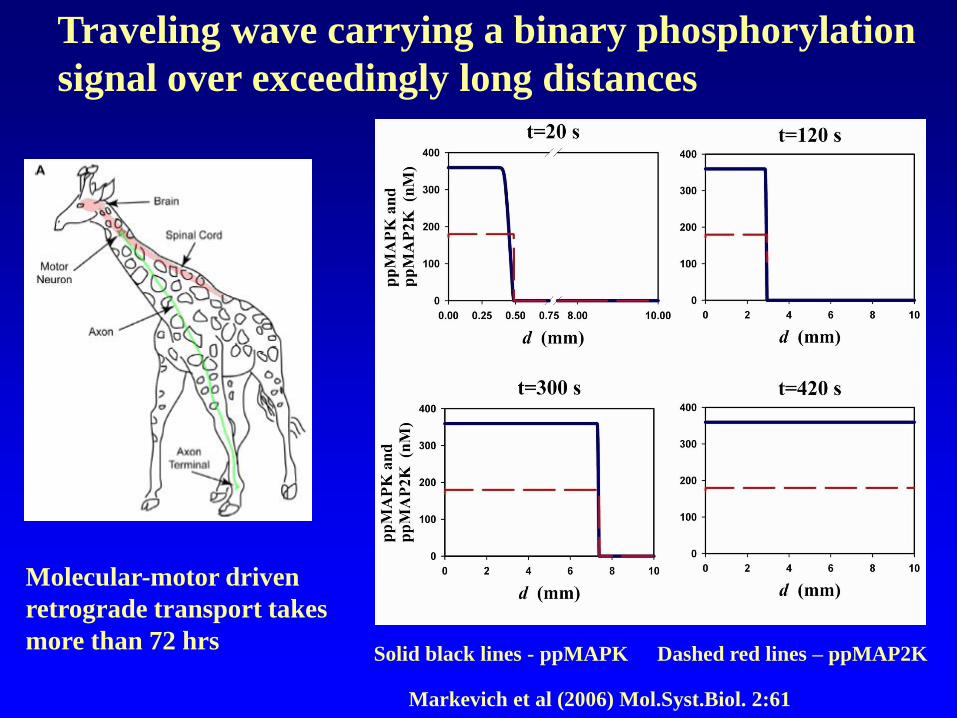
Traveling wave carrying a binary phosphorylation
signal over exceedingly long distances
Markevich et al (2006) Mol.Syst.Biol. 2:61
Solid black lines - ppMAPK Dashed red lines – ppMAP2K
Molecular-motor driven
retrograde transport takes
more than 72 hrs
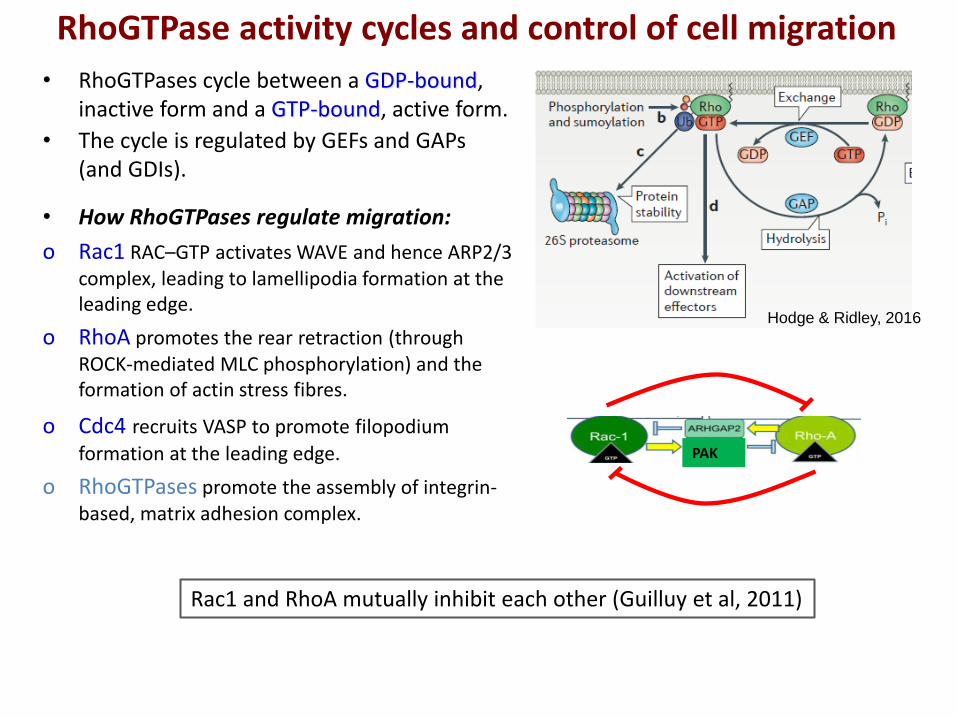
RhoGTPase activity cycles and control of cell migration
• RhoGTPases cycle between a GDP-bound, inactive form and a GTP-bound, active form.
• The cycle is regulated by GEFs and GAPs (and GDIs).
• How RhoGTPases regulate migration:
o Rac1 RAC–GTP activates WAVE and hence ARP2/3 complex, leading to lamellipodia formation at the leading edge.
o RhoA promotes the rear retraction (through ROCK-mediated MLC phosphorylation) and the formation of actin stress fibres.
o Cdc4 recruits VASP to promote filopodium
formation at the leading edge.
o RhoGTPases promote the assembly of integrin-based, matrix adhesion complex.
Rac1 and RhoA mutually inhibit each other (Guilluy et al, 2011)
Hodge & Ridley, 2016
PAK

Modelling the Rac1-RhoA interaction network
Byrne et al. Cell Systems (2016)
• In MDA-MB-231 mesenchymal breast cancer cells, Rac1 activates its effector kinase PAK, which phosphorylates and inhibits GEF-H1, a major GEF for RhoA in these cells.
• RhoA activates its effector kinase ROCK, which in turn phosphorylates and activates FilGAP and ArhGAP22, which are Rac1-specific GAPs, thereby inhibiting Rac1.
How will the Rac-Rho network respond to perturbations of negative feedback from Rac1 to RhoA by an inhibitor (IPA-3) of PAK?
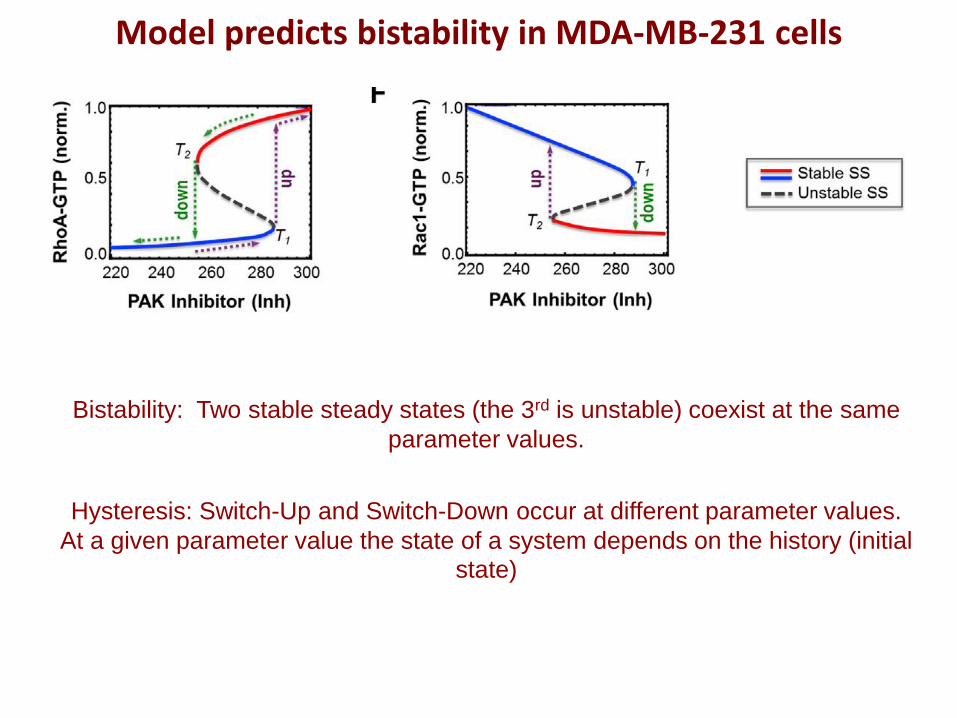
Model predicts bistability in MDA-MB-231 cells
Bistability: Two stable steady states (the 3rd is unstable) coexist at the same
parameter values.
Hysteresis: Switch-Up and Switch-Down occur at different parameter values.
At a given parameter value the state of a system depends on the history (initial
state)

Rac1 Total RhoA Total GEF-H1Total PAK Total 14-3-3 Total
No
rmali
sed
Va
lue
s
[0-1000] [0-1000] [0-1000] [0-1000] [0-1000] (nM)
Bistable Sets
MDA-MB-321
values
Random Colours
Rac1 Total RhoA Total GEF-H1Total PAK Total 14-3-3 Total
No
rma
lis
ed
Valu
es
[0-1000] [0-1000] [0-1000] [0-1000] [0-1000] (nM)
Bistable Sets
Monostable Sets
MDA-MB-321
values
a
b
Applying DYVIPAC to the Rac1-RhoA model
The measured parameters in MDA-MB-231 cells (protein abundance of
GTPases, PAK, GEF-H1, and 14-3-3) belong to the bistability regime
Byrne et al. Cell Systems (2016)
Biochemical/cellular measurements
Biochemical/cellular measurements
PAK inhibitor
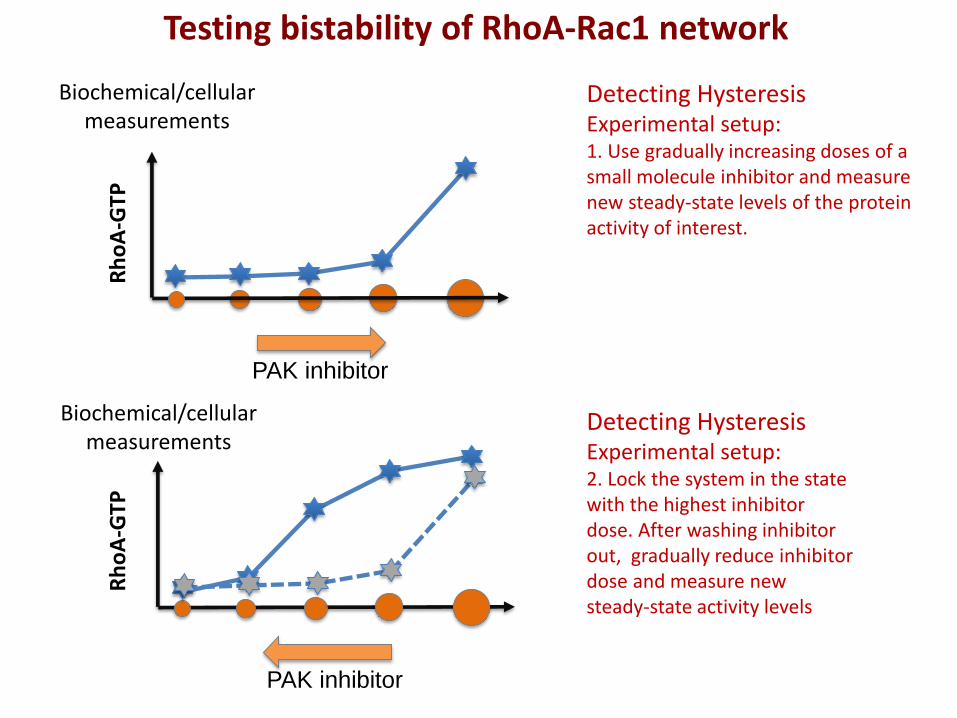
Detecting Hysteresis Experimental setup: 2. Lock the system in the state with the highest inhibitor dose. After washing inhibitor out, gradually reduce inhibitor dose and measure new steady-state activity levels
Testing bistability of RhoA-Rac1 network
Detecting Hysteresis Experimental setup: 1. Use gradually increasing doses of a small molecule inhibitor and measure new steady-state levels of the protein activity of interest.
PAK inhibitor
Rh
oA
-GTP
R
ho
A-G
TP
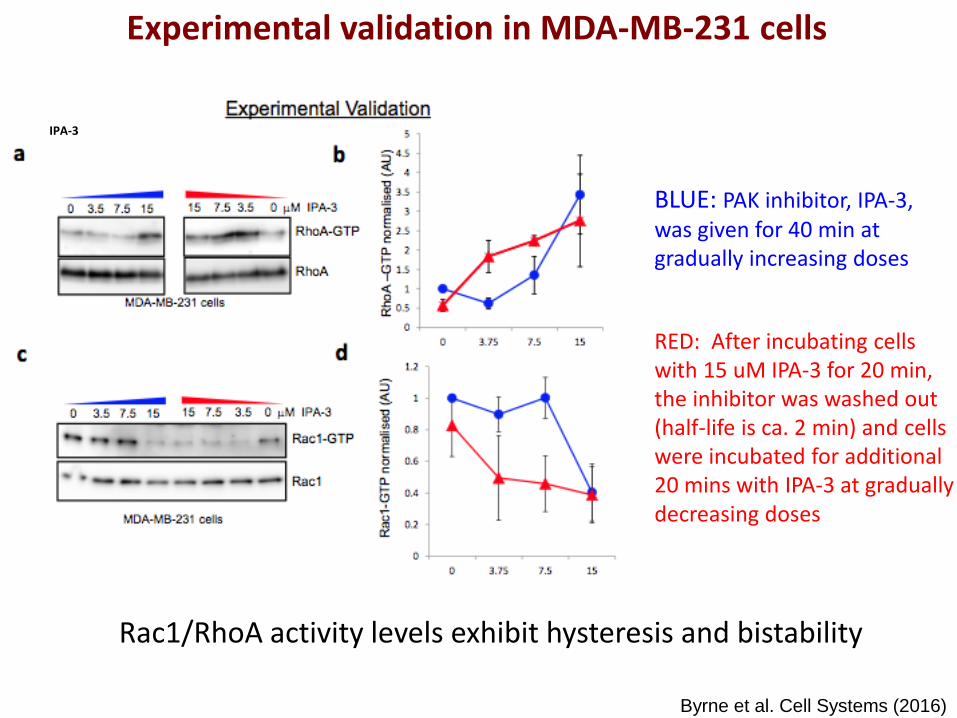
Experimental validation in MDA-MB-231 cells
BLUE: PAK inhibitor, IPA-3, was given for 40 min at gradually increasing doses
RED: After incubating cells with 15 uM IPA-3 for 20 min, the inhibitor was washed out (half-life is ca. 2 min) and cells were incubated for additional 20 mins with IPA-3 at gradually decreasing doses
Rac1/RhoA activity levels exhibit hysteresis and bistability
Byrne et al. Cell Systems (2016)
IPA-3
Wo
un
d c
losu
re 1
8h
(%)
0 μM 3.75 μM 7.5 μM 15 μM IPA-3
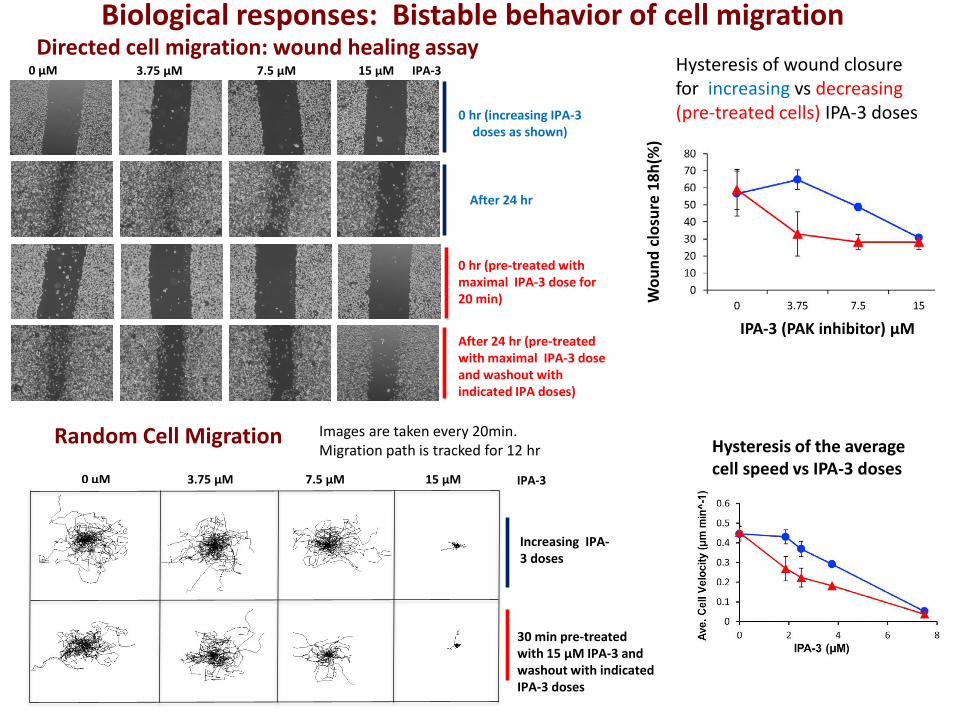
Increasing IPA-3 doses
30 min pre-treated with 15 μM IPA-3 and washout with indicated IPA-3 doses
Directed cell migration: wound healing assay
Random Cell Migration
Biological responses: Bistable behavior of cell migration
IPA-3 (PAK inhibitor) μM
Hysteresis of the average cell speed vs IPA-3 doses
Hysteresis of wound closure for increasing vs decreasing (pre-treated cells) IPA-3 doses
Images are taken every 20min. Migration path is tracked for 12 hr
0 hr (increasing IPA-3 doses as shown)
After 24 hr
After 24 hr (pre-treated with maximal IPA-3 dose and washout with indicated IPA doses)
0 hr (pre-treated with maximal IPA-3 dose for 20 min)
0 μM 3.75 μM 7.5 μM 15 μM IPA-3
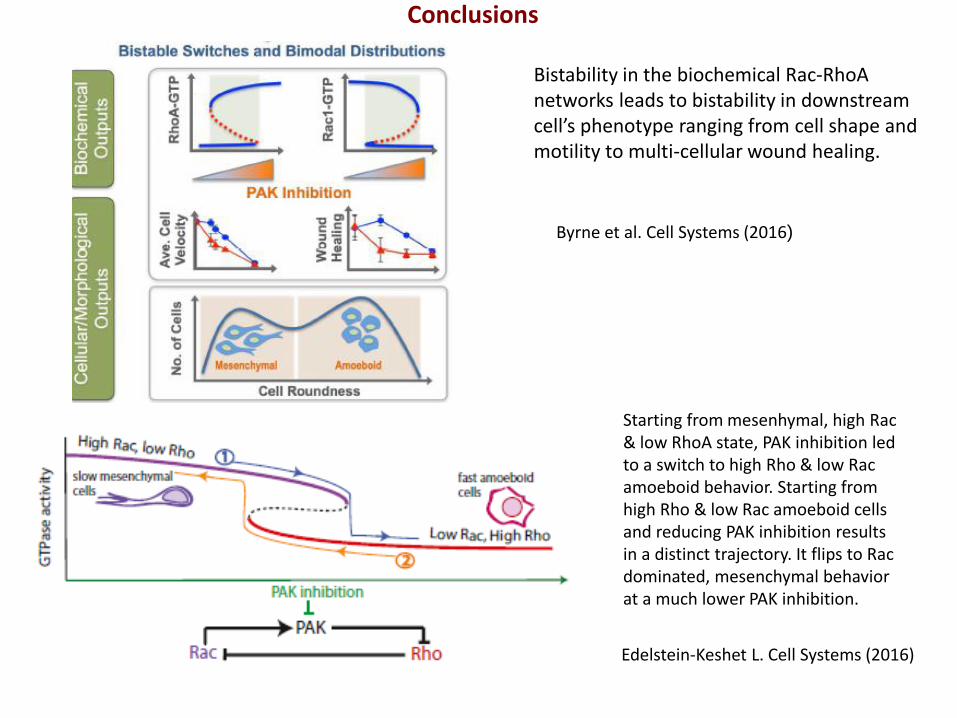
Conclusions
Byrne et al. Cell Systems (2016)
Edelstein-Keshet L. Cell Systems (2016)
Starting from mesenhymal, high Rac & low RhoA state, PAK inhibition led to a switch to high Rho & low Rac amoeboid behavior. Starting from high Rho & low Rac amoeboid cells and reducing PAK inhibition results in a distinct trajectory. It flips to Rac dominated, mesenchymal behavior at a much lower PAK inhibition.
Bistability in the biochemical Rac-RhoA networks leads to bistability in downstream cell’s phenotype ranging from cell shape and motility to multi-cellular wound healing.
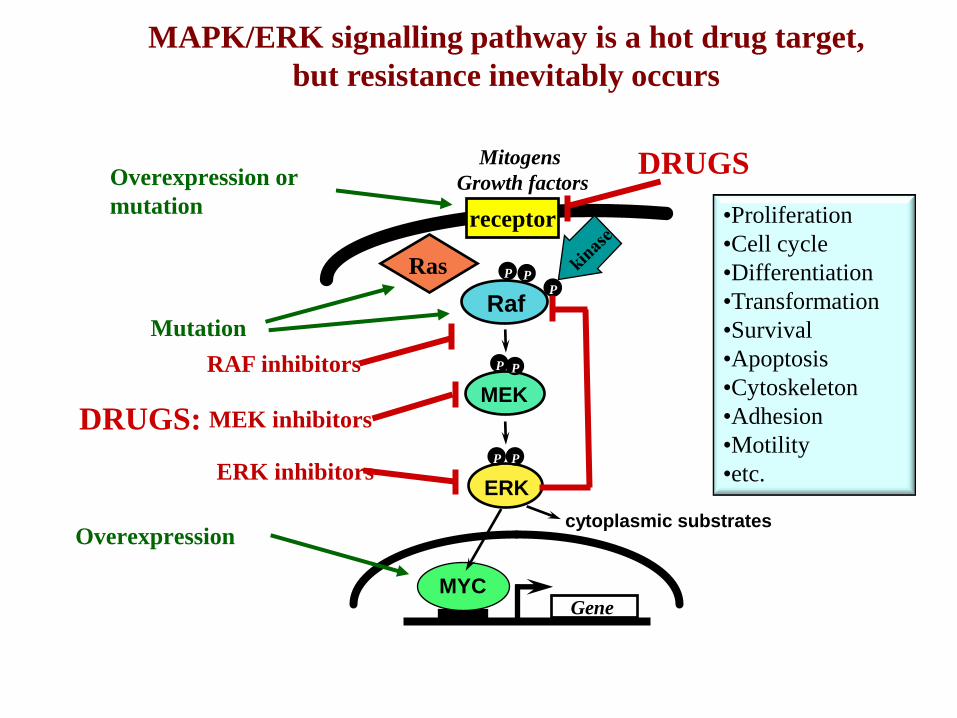
MAPK/ERK signalling pathway is a hot drug target,
but resistance inevitably occurs
Mitogens
Growth factors
Receptor receptor
Ras
cytoplasmic substrates
MYC
Gene
Raf
P P P
P
MEK
P
ERK
P P
Overexpression or
mutation
Mutation
Overexpression
DRUGS
DRUGS:
•Proliferation
•Cell cycle
•Differentiation
•Transformation
•Survival
•Apoptosis
•Cytoskeleton
•Adhesion
•Motility
•etc.
RAF inhibitors
MEK inhibitors
ERK inhibitors

BRAF mutations, RAF dimerization & drug resistance
Thomas et al, Nat Gen, 2007
• BRAF activation mutations (most frequent
BRAF V600E) are found in many cancers.
These cancers are often resistant to
specific BRAF inhibitors.
• Why does BRAF kinase dimerization
conveys drug resistance?
• Side effects: treating melanoma with
BRAF inhibitors causes skin tumours
(squamous cell carcinomas,
keratoacanthomas) due to paradoxical
activation of ERK-signalling in cells with
wild-type BRAF (Hall-Jackson et al., 1999).
• This ERK activation is related to BRAF
homo/heterodimerization (Poulikakos et al.,
2010, Hatzivassiliou et al., 2010; Heidorn et
al., 2010).

Hu et al. Cell 2013 154:1036.
• Drug-bound RAF protomer allosterically activates the other free protomer (spine assembly).
Therefore, a dimer that has bound only one inhibitor molecule is still active.
Why is the 2nd inhibitor molecule unable to
effectively bind and fully inhibit the dimer?
• RAF inhibitors facilitate RAF homo/heterodiimerization (Poulikakos et al. Nature 2010)
• Dimerization is part of physiological RAF activation. RAF heterodimerization increases
the total RAF kinase activity > 10 – 20-fold (Rushworth et al. Mol Cell Biol 2006)
Why does BRAF-CRAF heterodimerization
convey drug resistance?
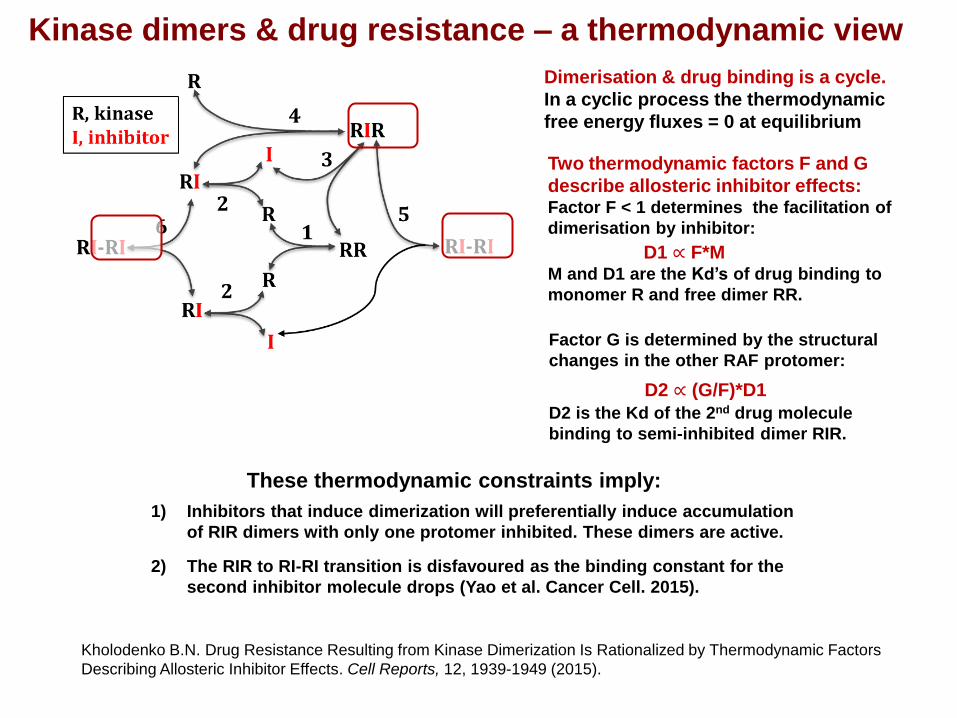
Dimerisation & drug binding is a cycle.
In a cyclic process the thermodynamic
free energy fluxes = 0 at equilibrium
These thermodynamic constraints imply:
1) Inhibitors that induce dimerization will preferentially induce accumulation
of RIR dimers with only one protomer inhibited. These dimers are active.
2) The RIR to RI-RI transition is disfavoured as the binding constant for the
second inhibitor molecule drops (Yao et al. Cancer Cell. 2015).
Kinase dimers & drug resistance – a thermodynamic view
Kholodenko B.N. Drug Resistance Resulting from Kinase Dimerization Is Rationalized by Thermodynamic Factors
Describing Allosteric Inhibitor Effects. Cell Reports, 12, 1939-1949 (2015).
Two thermodynamic factors F and G
describe allosteric inhibitor effects: Factor F < 1 determines the facilitation of
dimerisation by inhibitor:
D1 ∝ F*M M and D1 are the Kd’s of drug binding to
monomer R and free dimer RR.
Factor G is determined by the structural
changes in the other RAF protomer:
D2 ∝ (G/F)*D1
D2 is the Kd of the 2nd drug molecule
binding to semi-inhibited dimer RIR.
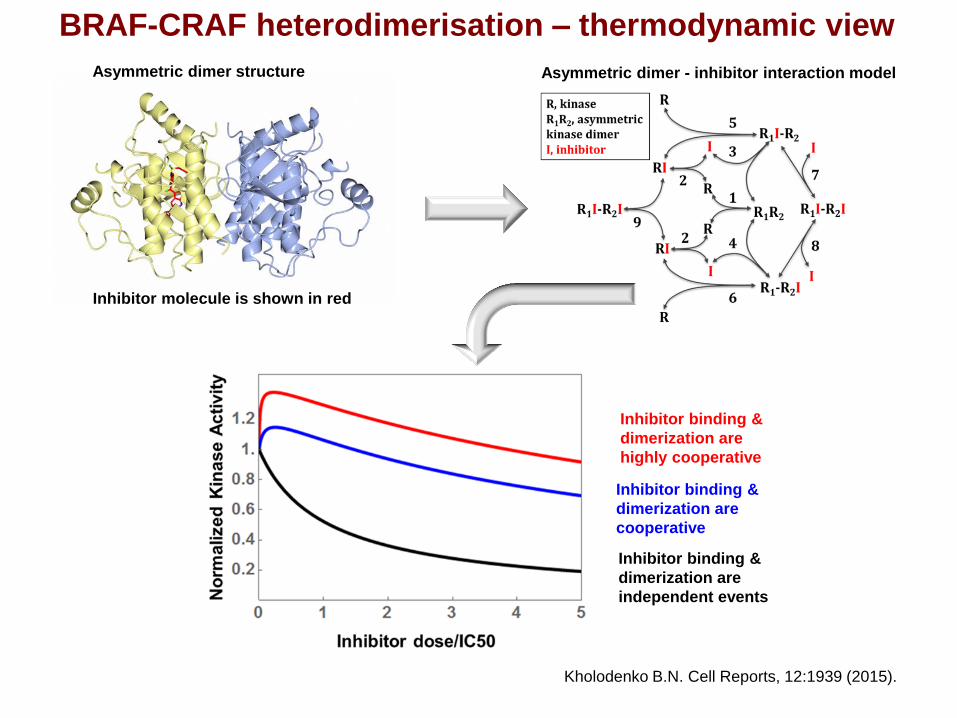
BRAF-CRAF heterodimerisation – thermodynamic view
Asymmetric dimer structure Asymmetric dimer - inhibitor interaction model
Inhibitor molecule is shown in red
Inhibitor binding &
dimerization are
independent events
Inhibitor binding &
dimerization are
highly cooperative
Inhibitor binding &
dimerization are
cooperative
Kholodenko B.N. Cell Reports, 12:1939 (2015).
I1
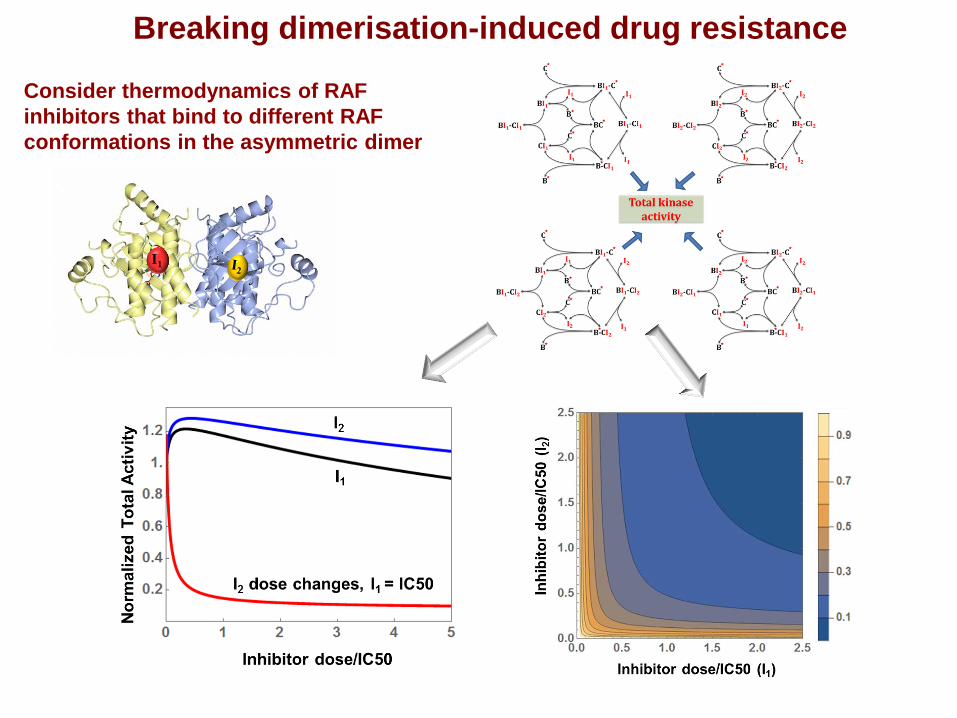
Breaking dimerisation-induced drug resistance
Consider thermodynamics of RAF
inhibitors that bind to different RAF
conformations in the asymmetric dimer
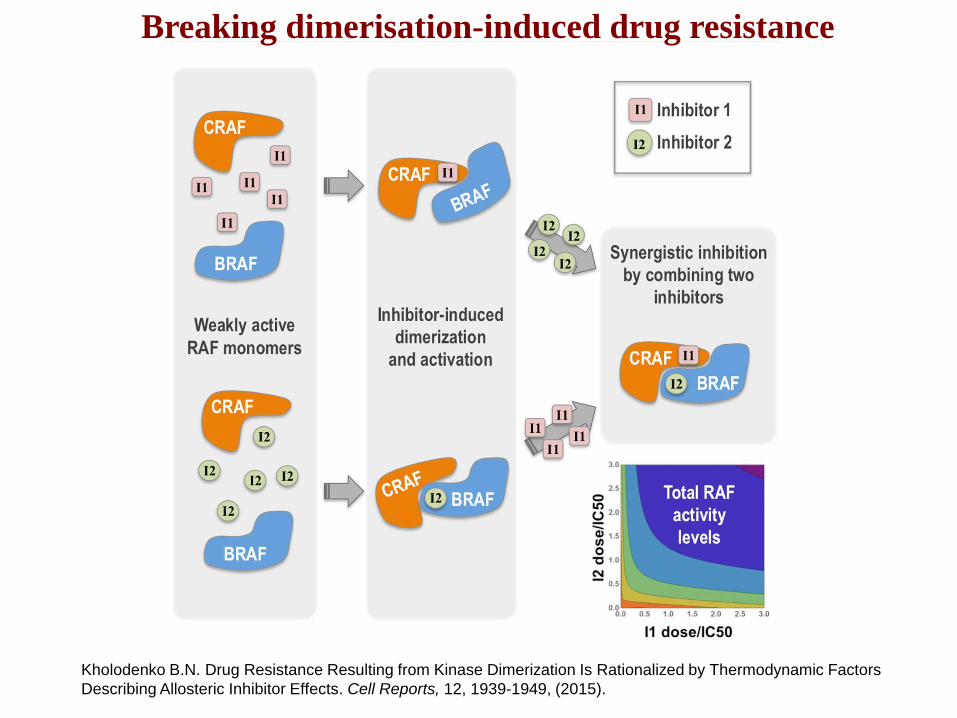
Breaking dimerisation-induced drug resistance
Kholodenko B.N. Drug Resistance Resulting from Kinase Dimerization Is Rationalized by Thermodynamic Factors
Describing Allosteric Inhibitor Effects. Cell Reports, 12, 1939-1949, (2015).

Special Thanks
Oleksii Rukhlenko
Dirk Fey
Fahimeh Khorsand
David Gomez
Tapesh Santra
Lan Nguyen
Alex von Kriegsheim
Jens Rauch
Walter Kolch
Supported by EU FP7 & EU H2020
Systems Biology Ireland, UCD
William Hlavacek, Los
Alamos National Lab, USA
Richard Posner, Northern
Arizona University, USA
Mariko Okada-Hatakeyama,
RIKEN, Yokohama Japan
Olivier Pertz, University of
Bern, Switzerland
Collaborators
Marc Birtwistle,
MSSM, NY, USA
Anatoly Kiyatkin,
Yale, USA