molecular and clinical factors affecting myocardial …
TRANSCRIPT

MOLECULAR AND CLINICAL FACTORS
AFFECTING MYOCARDIAL IRON RETENTION
IN TRANSFUSIONAL HAEMOSIDEROSIS
Maciej Wojciech Garbowski
A thesis submitted for the degree of Doctor of Philosophy
at
University College London
2016
From work performed
at the Department of Haematology,
University College London, Cancer Institute,
72 Huntley Street London WC1E 6BT
DECLARATION
This thesis entitled “Molecular and clinical factors affecting myocardial iron
retention in transfusional haemosiderosis” is based on work conducted by
the author in the Department of Haematology, University College London,
between March 2009 and April 2016. All the work described herein is
original unless otherwise acknowledged in the text or references. None of the
work has been submitted for another degree in this or any other University.
___________________________________
Maciej Wojciech Garbowski
Abstract
Myocardial haemosiderosis (MH) complicates Transfusion Dependent
Thalassaemias (TDT), increasing mortality from cardiomyopathy. Plasma non-
transferrin-bound iron (NTBI) and its redox-active component, labile plasma iron
(LPI), are potential causes of MH. In 73 TDT patients, those with MH had
significantly lower soluble transferrin receptors (sTfR) than those without. By
contrast, transfusion duration, iron-loading rate (ILR), NTBI and transferrin
saturation (TfSat) were similar in both groups. MH occurred only when ILR
exceeded the erythroid transferrin uptake rate (ETUR) derived from sTfR, by
>0.21mg/kg/d. LPI was >3-fold higher above this ETUR threshold, while NTBI
and TfSat showed no difference, implicating the LPI fraction of NTBI in MH.
We hypothesized that high ETUR decreases MH through increased generation of
apotransferrin by the erythron. We used a cardiomyocyte (HL-1) cell line to
explore the effects of NTBI speciation (iron:citrate ratio) and apotransferrin on
iron uptake. Uptake was most efficient when citrate exceeded iron >100-fold, as
was intracellular ROS formation and extracellular iron detectability using the LPI
assay. Apotransferrin, when in excess, inhibited iron uptake, decreased
intracellular ROS and decreased NTBI species detectable by LPI assay.
However, at very high NTBI concentrations (≥10µM), when the iron content of
ferric citrate (FC) exceeded the binding capacity of ApoTf, iron uptake was
increased above that seen without transferrin present. Under these conditions
ferric monocitrate species exist that are both LPI-detectable and enter
myocardium. We propose that in TDT, transient generation of ApoTf under
conditions of high residual erythropoiesis decreases MH by binding LPI-
detectable species of NTBI.
Qualitative differences in NTBI are therefore crucial to predict MH in TDT.
Attempting to demonstrate relevant NTBI speciation differences we compared
two methods: NTA-NTBI and a novel bead-NTBI. This approach, however,
highlighted important methodological drawbacks rather than positive species
identification; therefore, more work is needed in NTBI detection to elucidate the
speciation further.

4
Table of Contents
DECLARATION ......................................................................................................... 2
ABSTRACT ................................................................................................................. 3
TABLE OF CONTENTS ............................................................................................ 4
TABLE OF TABLES .................................................................................................. 8
TABLE OF FIGURES ................................................................................................. 9
ACKNOWLEDGEMENTS ....................................................................................... 12
DEDICATION ........................................................................................................... 14
LIST OF ABBREVIATIONS ................................................................................... 15
CHAPTER 1 INTRODUCTION: THE PATHOPHYSIOLOGY OF
TRANSFUSIONAL IRON OVERLOAD. ............................................................... 19 1.1 IRON HOMEOSTATIC MECHANISMS .....................................................................19
1.1.1 Systemic iron homeostasis ......................................................................... 20 1.1.2 Cellular iron homoeostasis ......................................................................... 23
1.2 IMPACT OF BLOOD TRANSFUSION ON IRON BALANCE ......................................24 1.2.1 Thalassemia Major ........................................................................................ 25 1.2.2 Sickle cell disease ............................................................................................ 25 1.2.3 Other conditions .............................................................................................. 26
1.3 MECHANISMS OF IRON TOXICITY IN TRANSFUSIONAL OVERLOAD .................27 1.3.1 The role of reactive oxygen species ........................................................ 27 1.3.2 Ambivalence of ROS ....................................................................................... 29 1.3.3 Infection risk ..................................................................................................... 30
1.4 DISTRIBUTION AND CONSEQUENCES OF TIO ....................................................30 1.4.1 Iron distribution and consequences in Thalassemia Major ........ 31 1.4.2 Iron distribution and consequences in sickle cell disease ............ 35 1.4.3 Iron distribution in other forms of TIO. ............................................... 36
1.5 MECHANISMS UNDERLYING DISTRIBUTION OF TRANSFUSED IRON ...............39 1.6 NATURE OF NTBI ..................................................................................................43
CHAPTER 2 METHODOLOGY ......................................................................... 50 2.1 IN VITRO STUDIES ..................................................................................................50
2.1.1 Cell systems ....................................................................................................... 50

5
2.1.2 Preparation of ferric citrate solutions .................................................. 51 2.1.3 Functional assays ........................................................................................... 52
2.2 RESEARCH QUESTIONS AND HYPOTHESES .........................................................77 2.2.1 Clinical questions and hypotheses .......................................................... 77 2.2.2 In vitro questions and hypotheses; ......................................................... 78
CHAPTER 3 FACTORS ASSOCIATED WITH MYOCARDIAL
HAEMOSIDEROSIS IN TDT ................................................................................. 79 3.1 PATIENTS AND METHODS ....................................................................................79
3.1.1 Clinical variables ............................................................................................ 79 3.1.2 Tissue iron levels and their determination ......................................... 80 3.1.3 Blood variables analysed. ........................................................................... 80 3.1.4 Methods of statistical analysis; ................................................................ 81
3.2 LONGITUDINAL ANALYSES OF FACTORS ASSOCIATED WITH MH ...................82 3.2.1 Description, and prevalence of myocardial iron overload in the
patient population. ........................................................................................................ 82 3.2.2 Clinical variables affecting myocardial iron trends in patients82
3.3 CROSS-SECTIONAL ANALYSIS OF FACTORS ASSOCIATED WITH MH. ........... 101 3.3.1 Relationship of soluble transferrin receptors to myocardial iron
in TDT. 102 3.3.2 Relationship of transferrin iron utilisation to myocardial iron in
TDT. 105 3.3.3 Discussion ........................................................................................................ 106 3.3.4 Summary of the main model of the erythroid iron sink ............ 113 3.3.5 Rationale for continuing work .............................................................. 115
3.4 CONFIRMATION COHORT ................................................................................... 115 3.4.1 Soluble transferrin receptor results ................................................... 116 3.4.2 NTBI results ................................................................................................... 116
CHAPTER 4 CLINICAL AND METHODOLOGICAL FACTORS
AFFECTING NON-TRANSFERRIN-BOUND IRON (NTBI) VALUES USING
A NOVEL FLUORESCENT BEAD ASSAY. ....................................................... 122 4.1 INTRODUCTION.................................................................................................... 122 4.2 MATERIALS AND METHODS .............................................................................. 124
4.2.1 Patients ............................................................................................................ 124 4.2.2 NTBI assays .................................................................................................... 124 4.2.3 Transferrin Saturation ............................................................................. 126
6
4.2.4 Routine blood test results and standard of medical care
monitoring ..................................................................................................................... 126 4.2.5 Statistics .......................................................................................................... 126
4.3 RESULTS ............................................................................................................... 127 4.3.1 Correlation and agreement of the two assays in all samples . 127 4.3.2 The distribution of NTBI values by the two methods ................. 127 4.3.3 Relationship of TfSat to NTBI values by the two methods ....... 129 4.3.4 Relationship of chelation therapy and NTBI values by both
methods ........................................................................................................................... 132 4.3.5 Subgroup univariate analysis of other factors affecting
relationships between assays. ............................................................................... 137 4.3.6 Multiple regression ..................................................................................... 144
4.4 DISCUSSION .......................................................................................................... 146
CHAPTER 5 EFFECT OF NTBI SPECIATION (FE:CITRATE RATIO) AND
APOTRANSFERRIN ON IRON UPTAKE INTO CULTURED
CARDIOMYOCYTES. ........................................................................................... 152 5.1 VIABILITY OF HL-1 CARDIOMYOCYTES IN BUFFERED FERRIC CITRATE MEDIA
152 5.2 IRON UPTAKE INTO HL-1 CARDIOMYOCYTES FROM BUFFERED FERRIC
CITRATE MEASURED BY TOTAL CELLULAR IRON. ....................................................... 153 5.3 APOTRANSFERRIN INHIBITION OF IRON UPTAKE FROM FERRIC CITRATE IN
HL-1 CARDIOMYOCYTES ............................................................................................... 154 5.4 EFFECT OF HEPCIDIN ON TOTAL CELLULAR IRON IN THE CARDIOMYOCYTE
157 5.5 EFFECT OF INCUBATION WITH FERRIC CITRATE ON FERRITIN IN HL-1
CARDIOMYOCYTES .......................................................................................................... 160
CHAPTER 6 LABILE PLASMA IRON ASSAY FOR THE ASSESSMENT OF
IRON SPECIATION IN AN NTBI MODEL. ...................................................... 164 6.1 EFFECTS OF NTBI SPECIATION (IRON:CITRATE RATIO) ON LPI LEVELS .. 164 6.2 FERRIC CITRATE SPECIATION-DEPENDENT FORMATION OF
HOLOTRANSFERRIN ........................................................................................................ 168 6.3 DISCUSSION: NTBI SPECIATION INFLUENCES LPI CONTENT AND
TRANSFERRIN BINDING .................................................................................................. 171
7
CHAPTER 7 NTBI UPTAKE INTO CULTURED CARDIOMYOCYTES AND
THE EFFECT OF TRANSFERRIN USING LABILE INTRACELLULAR IRON
POOL ASSAY 173 7.1 THE EFFECT OF TRANSFERRIN .......................................................................... 173 7.2 TRANSFERRIN SATURATION AND NTBI MODEL IN LIP ASSAY SETTING ... 179
7.2.1 Ferrotransferrin does not affect NTBI uptake and is not a donor
of iron in confluent HL-1 cells: CP40 chelator control. .............................. 182 7.2.2 Ferrotransferrin is not a donor of iron in confluent HL-1
cardiomyocytes: dose-response design. ............................................................ 184
CHAPTER 8 INTRACELLULAR ROS LEVELS IN HL-1
CARDIOMYOCYTES AS A MEASURE OF IRON UPTAKE .......................... 186 8.1 APOTRANSFERRIN EFFECTS ON IRON-DEPENDENT ROS LEVELS IN
CARDIOMYOCYTES .......................................................................................................... 186 8.2 APOTRANSFERRIN OUTWEIGHS HOLOTRANSFERRIN IN ITS MODULATORY
EFFECT ON UPTAKE FROM NTBI.................................................................................. 187 8.3 WHICH SPECIES IS TAKEN UP INTO THE CARDIOMYOCYTES?....................... 189 8.4 MODEL OF FERRIC CITRATE SPECIATION ........................................................ 193
CHAPTER 9 CONCLUSION ............................................................................ 195
SUMMARY ............................................................................................................. 196
CHAPTER 10 APPENDIX: PUBLICATIONS .............................................. 199 10.1 PUBLICATIONS FROM THIS THESIS ................................................................ 199 10.2 OTHER ABSTRACTS OR ARTICLES PUBLISHED IN THE COURSE OF THE WORK
TOWARDS THIS PH.D. BUT NOT INCLUDED IN THE THESIS. ..................................... 201
CHAPTER 11 REFERENCES ......................................................................... 203

8
Table of Tables
TABLE 1-1. CONDITIONS ASSOCIATED WITH TRANSFUSIONAL IRON OVERLOAD. ..........................38 TABLE 2-1: POTENTIAL PREDICTORS OF CARDIAC IRON. FACTORS OBTAINABLE FROM THE
CLINICAL DATABASE. ....................................................................................................................77 TABLE 2-2: POTENTIAL PREDICTORS OF MYOCARDIAL IRON. FACTORS REQUIRING ADDITIONAL
CLINICAL BLOOD SAMPLING .........................................................................................................77 TABLE 3-1.SIGNIFICANT CLINICAL AND LABORATORY VARIABLES ASSOCIATED WITH MH. .... 103 TABLE 3-2. CLINICAL AND LABORATORY VARIABLES NOT ASSOCIATED WITH MH. .................. 112 TABLE 4-1. PATIENT DIAGNOSES, PATIENT NUMBER, CORRELATION WITHIN DIAGNOSES AND
NTBI DIFFERENCES FOR GROUPS WITH N>5. ....................................................................... 125 TABLE 4-2. SUBGROUP ANALYSIS: CORRELATIONS, SLOPE COMPARISON AND NTBI DIFFERENCES
BETWEEN TRANSFUSION, ERYTHROPOIESIS, SPLENECTOMY, AND STORAGE IRON AND
CHELATORS SUBGROUPS. ........................................................................................................... 141 TABLE 4-3. MULTIPLE REGRESSION MODELS FOR NTA-NTBI, CP851-NTBI, BIAS (CP851-
NTA), AND TRANSFERRIN SATURATION. .............................................................................. 145
9
Table of Figures
FIGURE 1-1. SCHEMATIC OF NORMAL IRON METABOLISM FLUXES. ..................................................20 FIGURE 1-2. PATHOLOGICAL MECHANISMS AND CONSEQUENCES OF IRON OVERLOAD. ...............28 FIGURE 1-3. LPI RELATES TO BASELINE TRANSFUSION IRON LOAD RATE AND FERRITIN. ...........42 FIGURE 1-4. NTBI SPECIATION PLOTS. ................................................................................................45 FIGURE 1-5. PRINCIPAL NTBI SPECIES ARE SHOWN. ........................................................................47 FIGURE 2-1. TYPICAL VIABILITY OF HL-1 CARDIOMYOCYTES BY TRYPAN BLUE EXCLUSION
METHOD DURING ROUTINE PASSAGING......................................................................................51 FIGURE 2-2. TYPICAL STANDARD CURVE FOR FERROZINE IRON COMPLEX .....................................52 FIGURE 2-3. BASELINE AND FINAL CONFLUENCE OF HL-1 MONOLYERS DURING THE LIP ASSAY
(PREVIOUS PAGE). ..........................................................................................................................56 FIGURE 2-4. EXAMPLE OF STANDARD CURVE SHOWING DOSE RESPONSE OF HL-1
CARDIOMYOCYTE LIP TO FERRIC CITRATE. ...............................................................................56 FIGURE 2-5. INTRACELLULAR LABILE IRON POOL CALCEIN ASSAY. ..................................................57 FIGURE 2-6. ROS ASSAY OPTIMIZATION FOR HL-1 CARDIOMYOCYTES, THE PROBE DOSE EFFECT.
.........................................................................................................................................................59 FIGURE 2-7. ROS ASSAY OPTIMIZATION FOR HL-1 CARDIOMYOCYTES, THE EFFECT OF
DEFERIPRONE. ...............................................................................................................................61 FIGURE 2-8. ROS ASSAY OPTIMISATION FOR HL-1 CARDIOMYOCYTES. THE EFFECT OF CP40. 62 FIGURE 2-9. A STANDARD CURVE FOR BPT-NTBI ASSAY. ...............................................................64 FIGURE 2-10. ABSORBANCE SPECTRA OF BPT-FE COMPLEXES AND SERUM ULTRAFILTRATE
SAMPLES. ........................................................................................................................................65 FIGURE 2-11. A STANDARD CURVE FOR BEAD-NTBI ASSAY. ...........................................................67 FIGURE 2-12. BEAD-NTBI METHOD USING FLOW-CYTOMETRY, EXPLANATION OF GATING
(CURRENT AND PREVIOUS PAGE). ................................................................................................69 FIGURE 2-13. STANDARD CURVES FOR MOUSE FERRITIN ELISA ASSAY AND BIORAD DC
PROTEIN ASSAY. ............................................................................................................................70 FIGURE 2-14. K562 CELLS AFFECT LIP IN HL-1 CARDIOMYOCYTES. ............................................72 FIGURE 2-15. OPTIMISATION OF THE HAEMOGLOBINISATION POTENTIAL OF K562 CELLS. ......75 FIGURE 2-16. OPTIMISATION OF THE HAEMOGLOBINISATION POTENTIAL OF K562 CELLS. ......76 FIGURE 3-1. THE CALIBRATION OF T2* AND R2* MODELS FOR LIC ESTIMATION. ......................84 FIGURE 3-2. LIC CONTROL AND TREND IN CARDIAC IRON. ...............................................................85 FIGURE 3-3. TREND IN CARDIAC IRON RELATES TO ABSOLUTE FERRITIN AND ITS TREND. .........86 FIGURE 3-4. COMPLIANCE WITH CHELATION AND TREND IN CARDIAC IRON. ................................87 FIGURE 3-5. THE RELATIONSHIP BETWEEN CARDIAC IRON AND LIVER IRON TRAJECTORIES. .....89 FIGURE 3-6. VECTOR ROSE (DESCRIPTION IN THE TEXT BELOW). ...................................................90 FIGURE 3-7. FREQUENCY DISTRIBUTION OF RELATIVE HEART IRON AND LIVER IRON CHANGES
ON 532 CONSECUTIVE SCAN PAIRS IN 168 IRON OVERLOAD PATIENTS. .............................91
10
FIGURE 3-8. VECTOR ROSE FOR HEART IRON AND LIVER IRON CHANGES. ......................................92 FIGURE 3-9. COMPARISON OF THE CARDIAC IRON CONTENT AND LIVER IRON CONTENT
CALIBRATIONS. ..............................................................................................................................93 FIGURE 3-10. THE CROSSECTIONAL RELATIONSHIP BETWEEN CARDIAC IRON AND LIVER IRON
CONTENT. .......................................................................................................................................95 FIGURE 3-11. TRENDS IN MYOCARDIAL HAEMOSIDEROSIS RELATE TO VITAMIN D STATUS IN
TRANSFUSIONAL IRON OVERLOAD. .............................................................................................97 FIGURE 3-12. PARATHORMONE AND CARDIAC IRON TREND. ...........................................................98 FIGURE 3-13. PLASMA ASCORBATE IN IRON OVERLOAD. ................................................................ 100 FIGURE 3-14. VITAMIN C STATUS IN PATIENTS WITH TRANSFUSIONAL IRON OVERLOAD ON LONG
TERM DEFERASIROX CHELATION AND ITS RELATIONSHIP TO MYOCARDIAL IRON REMOVAL.
...................................................................................................................................................... 101 FIGURE 3-15. BIOMARKERS IN PATIENTS WITH AND WITHOUT MYOCARDIAL HAEMOSIDEROSIS
ARE SHOWN. ................................................................................................................................ 104 FIGURE 3-16. CARDIAC IRON RELATIONSHIP WITH STFR, ILR, AND ETUR. ............................. 107 FIGURE 3-17. MODEL OF EXTRAHEPATIC IRON LOADING IN TDT AS A FUNCTION OF MARROW
IRON UTILISATION. ..................................................................................................................... 109 FIGURE 3-18. THE RELATIONSHIP OF PATIENT HISTORY FACTORS TO STFR IN TDT. .............. 110 FIGURE 3-19. MODEL OF THE ERYTHROID APOTRANSFERRIN SINK FOR LPI. ............................ 114 FIGURE 3-20. CONFIRMATION COHORT RESULTS SHOWING CARDIAC IRON RELATIONSHIP TO
NTBI, LPI, AND STFR. ............................................................................................................. 117 FIGURE 3-21. RELATIONSHIP BETWEEN CARDIAC IRON AND NTA-NTBI WITH THE EFFECT OF
CHELATOR COMPLEXES. ............................................................................................................. 118 FIGURE 3-22. CARDIAC AND LIVER IRON RELATIONSHIP IN THE CONFIRMATION COHORT. ..... 119 FIGURE 4-1. COMPARISON OF NTA AND BEADS METHOD FOR NTBI MEASUREMENT. ............ 128 FIGURE 4-2. DISTRIBUTION OF CP851-NTBI, NTA-NTBI, AND TRANSFERRIN SATURATION
VALUES WITH ANALYSIS OF FALSE-POSITIVE AND FALSE-NEGATIVE NTA-NTBI VALUES
(PREVIOUS PAGE). ...................................................................................................................... 131 FIGURE 4-3. EFFECT OF CHELATION ON METHOD AGREEMENT. ................................................... 134 FIGURE 4-4. ALBUMIN EFFECT ON THE DETECTION OF DFX2FE COMPLEX BY THE BEAD-NTBI
METHOD. ...................................................................................................................................... 137 FIGURE 4-5. NTA-NTBI AND BEAD-NTBI VALUES ACROSS DIAGNOSES. .................................. 138 FIGURE 4-6. COMPARISON AND BLAND-ALTMAN ANALYSIS OF AGREEMENT OF NTA AND
CP851-NTBI METHODS IN DIFFERENT DIAGNOSIS GROUPS. ............................................ 140 FIGURE 4-7. THE EFFECT OF TRANSFERRIN SATURATION ON METHOD AGREEMENT IN
TRANSFUSED AND UNTRANSFUSED PATIENTS. ...................................................................... 142 FIGURE 4-8. COMPARISON OF NTA-NTBI AND CP851-NTBI METHODS IN GROUPS WITH
DIFFERENT ERYTHROPOIETIC, SPLEEN, FERRITIN AND LIC STATUS. ................................. 143

11
FIGURE 5-1. VIABILITY OF HL-1 CARDIOMYOCYTES AFTER 24H-INCUBATION WITH FERRIC
CITRATE WITH OR WITHOUT APOTRANSFERIN. ..................................................................... 153 FIGURE 5-2. NTBI UPTAKE (PRESENTED AS FC OR FAC) INTO HL-1 MYOCARDIAL CELLS AND
THE EFFECTS OF APOTRANSFERRIN (NEXT PAGE). ................................................................ 155 FIGURE 5-3. HEPCIDIN MODULATES IRON LOADING OF HL-1 CELLS WITH FAC. ...................... 159 FIGURE 5-4. HEPCIDIN EFFECT ON HL-1 CELL SUPERNATANT IRON. .......................................... 160 FIGURE 5-5. FERRITIN LEVELS IN HL-1 CARDIOMYOCYTES INCUBATED WITH FERRIC CITRATE.
...................................................................................................................................................... 162 FIGURE 5-6. LIP ASSAY IN PARALLEL TO FERRITIN ASSAY IN FIGURE 5-5. ................................. 163 FIGURE 6-1. EFFECT OF CITRATE:IRON RATIO AND APOTRASFERRIN ON LPI DETECTABILITY OF
FERRIC CITRATE (PREVIOUS PAGE). ......................................................................................... 166 FIGURE 6-2. LABILE PLASMA IRON LEVELS DEPEND ON MOLAR CITRATE EXCESS. ..................... 167 FIGURE 6-3. SPECIATION OF FERRIC CITRATE AND FORMATION OF FERROTRANSFERRIN
(PREVIOUS PAGE). ....................................................................................................................... 171 FIGURE 6-4. COMPARISON OF LPI-, DCI-, AND EPR-VISIBILITY OF FERRIC CITRATE. ............. 172 FIGURE 7-1. LIP ASSAY IN HL-CARDIOMYOCYTES INCUBATED WITH FAC AND
APOTRANSFERRIN, HIGH DOSES. .............................................................................................. 175 FIGURE 7-2. LIP ASSAY IN HL-CARDIOMYOCYTES INCUBATED WITH FAC AND APOTRANSFERRIN
OR RHSA (PREVIOUS AND CURRENT PAGE). ........................................................................... 177 FIGURE 7-3. LIP ASSAY IN HL-CARDIOMYOCYTES INCUBATED WITH FERRIC CITRATE AND
APOTRANSFERRIN. ..................................................................................................................... 178 FIGURE 7-4. DOSE RESPONSE OF LIP TO APOTRANSFERRIN OR RHSA IN CONTROL AND FAC-
TREATED HL-1 CELLS. DATA DERIVED FROM FIGURE 7-1 AND 7-2. ............................... 179 FIGURE 7-5. LIP CHANGE IN HL-1 CARDIOMYOCYTES AFTER IRON UPTAKE FROM NTBI IS
DEPENDENT ON TRANSFERRIN SATURATION. ........................................................................ 181 FIGURE 7-6. THE EFFECT OF APOTRANSFERRIN, HOLOTRANSFERRIN AND CP40 ON THE NTBI
UPTAKE FROM FAC SHOWN AS LIP LEVELS IN CONFLUENT HL-1 CARDIOMYOCYTES. .. 183 FIGURE 7-7. DOSE RESPONSE OF CHELEX-TREATED HOLOTRANSFERRIN ON LIP IN CONFLUENT
HL-1 CARDIOMYOCYTES. .......................................................................................................... 184 FIGURE 8-1. INTRACELLULAR ROS LEVELS REFLECT THE UPTAKE OF FC INTO CARDIOMYOCYTES
WITHIN 45 MINUTES (PREVIOUS PAGE). ................................................................................. 189 FIGURE 8-2. DELAY OF UPTAKE FROM OLIGOMER FC AFTER APOTRANSFERRIN-BICARBONATE-
DEPENDENT DEPOLYMERISATION (PREVIOUS PAGE). ........................................................... 192 FIGURE 8-3. MODEL OF APOTRANSFERRIN DEPENDENT RE-SPECIATION OF POLYMERIC FC... 194
12
ACKNOWLEDGEMENTS
This work has been made possible thanks to the encouragement and support of
many people. First of all, I would like to acknowledge and thank Professor John
Porter for creating and maintaining a unique space where this work could have
been performed, particularly for his trusting attitude towards me, a young and
inexperienced doctor joining his UCLH team in 2006 then becoming his Ph.D.
student in 2009, who was able to discover the pleasure and challenges of merging
scientific and clinical research under his watch. This effort would have been
futile had it not been for Professor Porter’s kind, but resolute and always friendly
mentorship of informal sessions where he would impart his knowledge by
putting to the test research ideas I had the freedom to entertain in his tutelage, of
the gruelling but necessary process of rewriting and deconstructing my
elucubrations to teach the lesson how to disarm the difficult with simplicity and
clarity. I am indebted to him for his help and friendship and grateful to have
learned by his example how to seek the best in people I encountered during my
UCL years.
I would like to thank Professor Robert Hider for many hours of insightful
discussions and his readiness to give advice that has helped me gain a better
understanding of the chemical aspects of this work, especially around NTBI
speciation, but in many other aspects as well. I also thank him for his help with
deferasirox purification, his gift of crucial reagents, such as CP40, CP851 beads
for NTBI assay that his student, Dr Yongmin Ma, whom I thank, kindly
synthesised, and SIH that his colleague Dr Yuanyuan Xie, whom I thank, kindly
synthesised.
I am indebted to Dr Edith Wiener, who introduced me to laboratory art and in her
quiet sagacity always had time for my questions and patience during my first
steps in laboratory research.
I thank Dr Patricia Evans for performing some of the serum assays in Prof
Porter’s laboratory, which were included in this work, but especially for her
collaboration in publications arising from this work.

13
I thank Dr Farrukh Shah, who helped me start this project and has been a
supportive co-supervisor in the early phase of this work, including the advice
before and during the Ph.D. Upgrade. My thanks also go to Professor Kaila Srai
at UCL, who kindly agreed to be the Upgrade examiner.
I also acknowledge Professor Rosemary Gale for her advice and support which
helped shape my approach to the research questions in this work.
I would like to thank my friend Dr Evangelia Vlachodimitropoulou-Komoutsea,
a fellow Ph.D. student, whom I had the pleasure to meet and work with during
the time of this project, for providing unmatched support and camaraderie in the
laboratory.
Additional thanks go to Arnold Pizzey for helping in and troubleshooting many
methodological aspects of this work, but especially flow-cytometry; to Dr Rob
Sellar for much needed support, encouragement and friendship which made this
project a pleasure, to Pimpisid Koonyosying for help with cell culture, to Sarah
Benn-Hirsch, Nausheen Saleem, Dr Xenya Kantaris, Rebecca Berridge, and
Lucia Geoffrey who helped with the clinical aspect of my work and made it
possible to run patient clinics smoothly and efficiently and thus enable me to
spend more quality time researching this project.
Last, but not least I thank my patient volunteers, who have kindly agreed to take
part in various research aspects of this work.
I also would like to acknowledge British Society for Haematology, UK
Thalassaemia Society and Sickle Cell Society for providing the
Haemoglobinopathy Fellowship Grant (£160,000). I thank Wellcome Trust for
salary support and consumables as part of a joint grant with KCL, number
WT093209MA “Novel approaches to quantitation and speciation of plasma
NTBI, implications for prevention of iron mediated toxicity”) and finally I
acknowledge Leukaemia and Blood Diseases Appeal for “Cardiomyocytes iron
metabolism in iron overload conditions” grant (£100,000) which provided the
financial support in the latter years of my Ph.D. studies.

14
Dedication
Matce i Ojcu
15
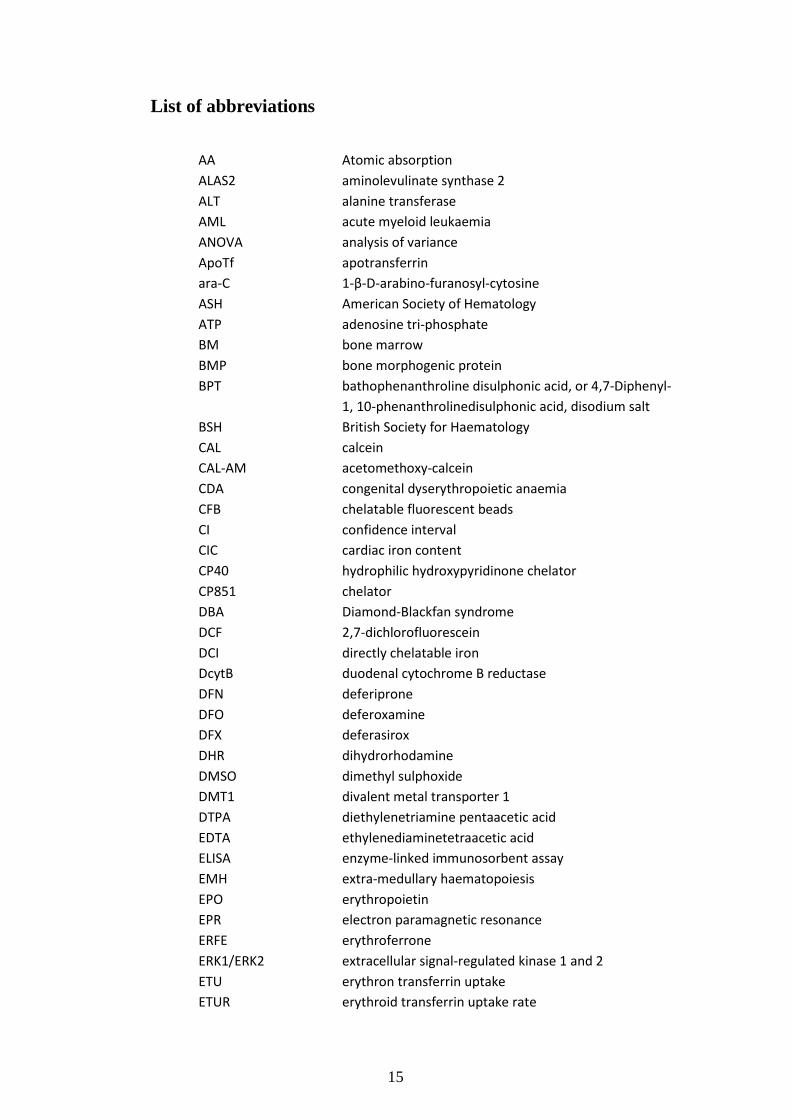
List of abbreviations
AA Atomic absorption ALAS2 aminolevulinate synthase 2 ALT alanine transferase AML acute myeloid leukaemia ANOVA analysis of variance ApoTf apotransferrin ara-C 1-β-D-arabino-furanosyl-cytosine ASH American Society of Hematology ATP adenosine tri-phosphate BM bone marrow BMP bone morphogenic protein BPT bathophenanthroline disulphonic acid, or 4,7-Diphenyl-
1, 10-phenanthrolinedisulphonic acid, disodium salt BSH British Society for Haematology CAL calcein CAL-AM acetomethoxy-calcein CDA congenital dyserythropoietic anaemia CFB chelatable fluorescent beads CI confidence interval CIC cardiac iron content CP40 hydrophilic hydroxypyridinone chelator CP851 chelator DBA Diamond-Blackfan syndrome DCF 2,7-dichlorofluorescein DCI directly chelatable iron DcytB duodenal cytochrome B reductase DFN deferiprone DFO deferoxamine DFX deferasirox DHR dihydrorhodamine DMSO dimethyl sulphoxide DMT1 divalent metal transporter 1 DTPA diethylenetriamine pentaacetic acid EDTA ethylenediaminetetraacetic acid ELISA enzyme-linked immunosorbent assay EMH extra-medullary haematopoiesis EPO erythropoietin EPR electron paramagnetic resonance ERFE erythroferrone ERK1/ERK2 extracellular signal-regulated kinase 1 and 2 ETU erythron transferrin uptake ETUR erythroid transferrin uptake rate

16
Eβ-thal Eβ-Thalassaemia f.c. final concentration FAC ferric ammonium citrate FBC full blood count FC ferric citrate FCS foetal calf serum FO feroxamine FPA fasting plasma ascorbate FPH free plasma heme Fpn ferroportin gCM growth Claycomb Medium GDF-15 growth differentiation factor 15 GSH glutathione H2DCF 2’,7’-dichlorofluorescin H2DCF-DA 2’,7’-dichlorofluorescin diacetate HAS human serum albumin HbA1C glycated adult haemoglobin A hbd mouse haemoglobin deficit mouse HbS sickle haemoglobin HBSS Hank’s balanced salt solution HFE human haemochromatosis protein HH hereditary haemochromatosis HPLC high-pressure liquid chromatography IBE iron-binding equivalents IE ineffective erythropoiesis IL–6 interleukin 6 ILR iron load rate IO iron overload IQR interquartile range IRE iron responsive elements IRP IRE-binding protein LDH lactate dehydrogenase LFT liver function test LIC liver iron content LIP labile iron pool (regulatory iron pool) LoA limit of agreement LPI labile plasma iron LTCC L-type calcium channel LVEF left ventricular ejection fraction MCSIO Multi Centre Study of Iron Overload MDA malondialdehyde MDS Myelodysplastic syndrome MH myocardial haemosiderosis MI myocardial iron MIC myocardial iron concentration

17
MOPS (3-(N-Morpholino)propanesulphonic acid, 4-Morpholinepropanesulphonic acid)
MRI magnetic resonance imaging MWCO molecular weight cut-off NF-κB nuclear factor kappa-light-chain-enhancer of activated
B cells NPV negative predictive value NRBC nucleated red blood cells NTA nitrilotriacetic acid NTBI non-transferrin bound iron NTDT non-transfusion dependent thalassaemia OD optical density OR odds ratio p38 MAP kinase p38 mitogen-activated protein kinase PBS phosphate buffered saline PDA photodiode array PES polyethersulfone PKD pyruvate kinase deficiency PPV positive predictive value PTH parathormone RBC red blood cells RCA red cell aplasia RES reticulo-endothelial system rHSA recombinant human serum albumin RIPA radioimmunoprecipitation assay (buffer) ROC receiver operating characteristic (curve) ROS reactive oxygen species RPMI Roswell Park Memorial Institute (medium) RT room temperature SA sideroblastic anaemia SCD Sickle Cell disease SD Standard deviation SE standard error SF serum ferritin SIH salicylaldehyde isonicotinoyl hydrazone SMAD small mothers against decapentaplegic (portmanteau),
intracellular proteins transducing signals from TGFβ ligands to the nucleus
STAT Signal transducer and activator of transcription sTfR soluble transferrin receptor TBI total body iron, transferrin bound iron TCA trichloroacetic acid TDT transfusion dependent thalassaemia Tf transferrin TfR1 transferrin receptor-1
18
TfSat transferrin saturation TGA thioglycolic acid or mercaptoacetic acid TGFβ-1 transforming growth factor beta TI thalassaemia intermedia TIBC total iron-binding capacity TIO transfusional iron overload TM Thalassaemia Major TRIS Tris(hydroxymethyl)aminomethane, 2-amino-2-
hydroxymethyl-propane-1,3-diol UCL University College London UCLH University College London Hospital UIBC unsaturated iron-binding capacity ULN upper limit of normal UTR un-translated region (of mRNA) VDCC voltage-dependent calcium channel VDH vitamin D VSCC voltage-sensitive calcium channel β-TM β-Thalassaemia Major
19
Chapter 1 Introduction: The pathophysiology of transfusional iron overload.
1.1 Iron homeostatic mechanisms
The pathophysiological complications of transfusional iron overload (TIO) arise
inevitably as the consequence of iron homeostatic mechanisms. These, in turn,
have been fine-tuned by evolution to counter (prevent or rescue) the iron
deficiency arising from frequent exsanguination or malnutrition both through
unopposed iron absorption and nearly completely limited iron excretion. The
other important evolutionary mechanism consists in the inflammatory
withholding of iron away from invading microbes by limiting iron redistribution
out of the macrophage system. Thus neither the elimination of excess iron nor
control of the distribution of TIO is well governed by these mechanisms. In other
species, on the other hand, especially rodents, on which majority of experimental
animal studies in iron overload and iron metabolism were undertaken, the excess
iron is efficiently eliminated via biliary excretion. The principal role of iron
homeostatic mechanisms, therefore, is supplying sufficient levels of iron for
incorporation into mitochondrial proteins transporting oxygen and electrons in
cellular respiration pathways as well as DNA replication, while at the same time
ensuring that levels of iron are not too high for the redox-dependent iron toxicity
to arise. This is achieved by a highly tuned iron transport, uptake and storage
mechanisms, which evolved so that the redox cycling capacity of free iron is
limited to a minimum. Sequestration with various proteins such as transferrin,
ferritin and high-affinity prosthetic groups provides one way of limiting the
redox activity of free iron but is metabolically costly which in turn justifies the
tight recycling control of the iron content. Essential goods dearly acquired,
expensive to move around and expensive to store must be carefully recycled
especially if toxic when not contained, the parallel with the way a state deals
with radioactive material is informative. Another way of limiting iron toxicity is
ensuring that the pool of free iron is reduced and maintained in a fully ligand-
coordinated state. To orchestrate this fine balance, the homeostatic mechanisms
operate at two levels: at the systemic level through interactions of plasma
hepcidin with membrane ferroportin and at a cellular level through the

20
interaction of IRE-binding proteins (IRPs) with iron responsive elements (IREs)
present on mRNAs of key iron metabolism-related proteins(Porter & Garbowski,
2014).
1.1.1 Systemic iron homeostasis
In a healthy human being the total iron content of 40-50mg/kg is apportioned to
several key compartments: predominantly as haem iron in haemoglobin (about
30mg/kg), muscle myoglobin (about 4mg/kg), and in cellular iron-containing
enzymes (about 2mg/kg). The storage iron compartment is made up of ferritin
and its compact, partially degraded form haemosiderin, equally capacitous as it is
variable ranging from 0 to 2g(Jacobs, 1974). It comprises hepatic, splenic and
bone marrow (BM) macrophages, previously called the reticuloendothelial
system (RES), as well as hepatocytes(Drygalski & Adamson, 2013). Liver iron
concentration (LIC) remains under 1.8mg/g dry weight in a healthy individual,
unless the patient has liver disease, hemochromatosis mutation, overdoses oral
iron supplements, or is transfused.
Figure 1-1. Schematic of normal iron metabolism fluxes. The principal systemic fluxes of iron are shown as arrows of variable thickness to illustrate the amount of iron flux directed from one compartment to another.
An average dietary iron absorption in a normal subject reaches about 10% of
dietary iron or 1-2mg/day. A similar amount is lost with cells shed daily from
skin and gut, or during menstruation and pregnancy. Iron absorption is raised by
21
anaemia, hypoxia, ineffective erythropoiesis (IE), and haemochromatotic
mutations, by a shared mechanism of inappropriately low (insufficient) plasma
hepcidin levels(Nemeth & Ganz, 2006). Under hepcidin insufficiency, enterocyte
baso-lateral ferroportin expression is not appropriately down-regulated, allowing
for the unchecked Fe2+ flux into the plasma compartment and hence increasing
dietary iron absorption. Hypoxia-inducible factor-2α-mediated signalling, up-
regulation of DcytB and DMT1 expression in the duodenum(Mastrogiannaki et
al, 2009), also result in enhanced dietary iron absorption. Any anaemia will thus
lead to iron absorption being more efficient. However, systemic iron turnover
does not depend on absorption in humans. As is illustrated in Figure 1-1, the
principal circuit of body iron turnover bypasses the gut and goes via the plasma
transferrin, which, while binding only 1-2mg of iron at any moment, delivers
about 20-30mg/day via erythroblast transferrin receptors for haemoglobin
synthesis(Porter & Garbowski, 2014). This high rate small volume transfer
system rapidly responds to small changes in supply and demand of iron by
adjusting plasma transferrin levels or by signalling within regulatory feedback to
regulators of iron entry into and iron exit from plasma compartment. Despite its
high dynamic range, it can be saturated resulting in secondary effects that drive
the pathophysiology of iron overload.
1.1.1.1 Hepcidin regulation
Hepcidin directly regulates the critical gating mechanism for iron entry into the
plasma compartment, which is the enterocyte and macrophage ferroportin. Thus,
it modulates dietary iron absorption and the rate of iron egress from
macrophages, which are involved in the recycling of iron from senescent or
effete erythrocytes (erythrophagocytic macrophages). This control of iron egress
into plasma from both types of cells, and indeed all other cells in the organism,
except the acinar pancreatic cells(Altamura et al, 2014) is effected by the binding
to and subsequent ubiquitination of ferroportin, which remains hitherto the sole
exporter of iron as ferrous ion, Fe2+, from cells(Nemeth, 2004; Delaby et al,
2005). Hepatic hepcidin synthesis is controlled by at least three distinct
regulatory mechanisms responsive to levels of iron, erythropoiesis or
inflammation.
22
1.1.1.1.1 Iron level sensing
The level of iron in the plasma compartment is sensed in the following way: the
di-ferric transferrin binds to transferrin receptor-1 (TfR1) on the hepatocyte
membrane, the binding causes translocation of HFE from TfR1 to TfR2 and
subsequent signalling via ERK1//ERK2 and p38 MAP kinase which induce
hepcidin expression. Storage compartment iron is sensed by BMP6, which
signals via BMP receptor and phosphorylation of SMADs. BMP receptor
sensitivity is increased through interaction with haemojuvelin, HFE, and TfR2 in
a holotransferrin-dependent manner, which further potentiates hepcidin
transcription(Ganz, 2011; Darshan & Anderson, 2009).
1.1.1.1.2 Erythropoietic drive
Erythropoiesis signals to the hepcidin regulon via BM-derived factors, which are
powerful suppressors of hepcidin expression; such factors are high in ineffective
erythropoiesis but their nature remains debatable. Factors have been proposed
such as GDF-15(Tanno et al, 2007), twisted gastrulation factor–1(Tanno et al,
2009), and most recently erythroferrone(Kautz et al, 2014). The latter has been
identified as the principal factor in murine erythropoiesis, but its relevance to
human pathology has not been shown clinically. An additional erythropoiesis
sensing mechanism likely involves de-saturation of transferrin by the erythron
because disruption of transferrin iron uptake into erythron in hbd mouse
increases hepcidin despite on-going anaemia(Darshan & Anderson, 2009;
Wilkins et al, 2006), presumably overriding the erythropoietic depressors of
hepcidin (or demonstrating that depressors have an effect only with concomitant
transferrin desaturation).
1.1.1.1.3 Inflammatory status
Inflammation sensing mediated through IL–6/STATs pathway and other
cytokines regulate hepcidin synthesis(Nemeth et al, 2003), being the key
mechanism in hypoferremia of acute inflammation through the action of
ferroportin degradation in macrophages(Nemeth, 2004).
Other factors also affect hepcidin expression, these involve e.g. hypoxia(Liu et
al, 2012) and matriptase pathway(Silvestri et al, 2008). It is not fully explained
23
to what degree does either of the mechanisms control hepcidin expression and
how they sum up to a common outcome, but it is known that the erythropoietic
repressors predominate over both the iron-sensing(Pak et al, 2006; Frazer et al,
2012; Vokurka et al, 2006) and inflammation-sensing mechanisms(Lasocki et al,
2008). Animal studies alone do not translate directly into the iron metabolism
context of human TIO so the influences within the network of potentially
opposing regulators of hepcidin synthesis may be weighted differently. They are
considered in the respective clinical conditions below.
1.1.2 Cellular iron homoeostasis
Ferritin synthesis and the regulation of iron uptake through membrane transferrin
receptors (TfR) are the main processes that control intracellular iron
homoeostasis. A feedback mechanism operates between labile iron pool
(regulatory iron pool, LIP) and iron-responsive elements (IREs), stem-loop
motifs present in the un-translated regions (UTR) of mRNA, such as in the H-
ferritin matrices (5’UTR) or the of TfR1 matrices (3’UTR), also erythroid
ALAS2, DMT1, and mitochondrial aconitase. The feedback is mediated by IRPs:
binding of LIP iron changes the conformation of IRPs such that they undock
from the IRE motifs; IRP-IRE interaction is, therefore, LIP-sensitive(Rouault et
al, 1991). In iron-deficient conditions, more of IREs are bound by both IRP1 and
IRP2, but in iron-replete states, iron and heme bind to IRPs and thus mark them
from rapid degradation by ubiquitination. IRP2 has predominant control overall,
because its targeted deletion leads to gross disruption in iron metabolism in
multiple tissues(Cooperman et al, 2005) while IRP1 deletion leads to
dysregulation in brown fat and kidney only. IRP1 can switch from c-aconitase
activity form in iron repletion (dependent on iron-sulphur cluster assembly, 4Fe-
4S), which does not bind IRE, to high IRE-affinity form in iron deficiency (iron-
sulphur cluster disassembly losing iron: 3Fe-4S)(Taketani, 2005). In this way,
the amount, as well as the position of IRE motifs on mRNA together, regulate the
onset and degree of translation events (5’ UTR governing access to matrices,
3’UTR governing stability of matrices by regulating the binding of
nucleases)(Porter & Garbowski, 2014). High levels of LIP thus increase ferritin
synthesis while decreasing the membrane expression of TfR1. Such feedback
24
does not occur in the erythron; instead transcriptional control permits high TfR
expression despite high cellular iron or heme, consistent with haemoglobin
synthesis requirements(Ponka & Lok, 1999; Porter & Garbowski, 2014). Most
ferroportin transcripts also contain IRE at 5’UTR, which increases the amount of
its mRNA in iron overload. However the effective regulation of ferroportin
happens post-translationally through hepcidin-dependent down-
regulation(Delaby et al, 2005) or lack of Fe(II) acceptor(De Domenico et al,
2007).
Iron is made available for the synthesis of the essential iron-containing molecules
via LIP, the transient low molecular weight iron pool that controls the level and
function of IRPs. The nature of the iron ligands in LIP is unattested, but from the
thermodynamic perspective, it is probably coordinated mainly by
glutathione(Hider & Kong, 2011). Apparently despite that, it can still redox cycle
between Fe2+ and Fe3+ generating harmful free radicals, however, it may be
because of tissue-dependent variable GSH levels or their depletion. In order to
minimise these risks, elegant homoeostatic mechanisms carefully coordinate the
distribution of body iron so as to provide iron pools for efficient synthesis of
these proteins, while minimizing iron-mediated free radical generation(Porter &
Garbowski, 2014).
1.2 Impact of blood transfusion on iron balance
Chronic blood transfusion is a life-saving therapy for patients with severe
anaemias due to inborn or acquired defects in red cell production, structure or
metabolism. The most common worldwide causes of life-long transfusion
therapy are haemoglobinopathies: Thalassaemia major (TM), and Sickle Cell
disease (SCD). Because the human body cannot excrete excess iron, and each
unit of blood contains about 200mg of heme iron, such patients have in excess of
20g of iron in their body, compared with 3g in a healthy adult. The systemic
distribution and accumulation of iron depend on the rates and nature of blood
transfusion regimens. This is fundamental to the pathophysiology of iron
overload and differs with the underlying diagnosis.
25
1.2.1 Thalassemia Major
In thalassemia major (TM), most cases become transfusion dependent in the first
year of birth. Current indications for commencing transfusion in TM aim to keep
the pre-transfusion haemoglobin level at approximately 9.5g/dl and to maintain
an average haemoglobin of 12g/dl(Porter, 2009), which typically amounts to an
iron load rate (ILR) of 0.3-0.5mg/kg/d(Porter, 2009). Transfusion rescues the
otherwise fatal anaemia, suppresses the ineffective erythropoiesis and the
resultant increase in dietary iron absorption, but delivers a substantial amount of
iron with each unit of blood transfused (approx. 200mg) which accumulates,
therefore the guidelines as to haemoglobin thresholds are carefully chosen. How
suppressed is the residual BM activity can be assessed by monitoring circulating
transferrin receptors, which show more suppression when the pre-transfusion
haemoglobin level exceeds 10g/dL(Cazzola et al, 1995). Maintaining a mean
pre-transfusion haemoglobin level of 9.4g/dl versus 11.3g/dl consumed fewer
blood units and related to a better control of iron overload in an Italian
cohort(Cazzola et al, 1997). This optimal balance may not be universal and may
depend on the severity of thalassemia genotype. Unchecked transfusion will
inevitably lead to severe and fatal iron accumulation: in the pre-chelation era,
LICs of 40mg/g dry weight were typically seen by 10 years of age(Barry et al,
1974). Failure to control these levels risks extra-hepatic spread of iron (see
below).
1.2.2 Sickle cell disease
The rate and extent of iron overload in SCD differ considerably from TM but age
of commencing blood transfusion and its ILR, as well as the type of the
transfusion regimen itself (top-up, manual or automatic exchange), have an
influence. ILR in SCD is lower than TM leading to slower accumulation and the
reasons for this are twofold: firstly, transfusion practice differs between these
conditions and, secondly, due to a typically negative iron balance in the absence
of transfusion in SCD. Considerable intravascular haemolysis in SCD results in
iron loss via urine(Koduri, 2003; Sears et al, 1966; Washington & Boggs, 1975)
as in PNH, and possibly via bile(Keel et al, 2008), and may reach as much as 15
mg/d(Sears et al, 1966) or about 0.2mg/kg/d i.e. similar to average transfusional

26
loading in SCD. Additionally, a less expanded marrow in SCD as compared to
TM and, especially, to NTDT, suppresses hepcidin to a lesser degree (Porter et
al, 2014); thus, dietary iron absorption is less prominent. Intravascular
haemolysis can be significantly reduced if HbS synthesis is suppressed when
patients are hyper-transfused or under automated erythrocytapheresis set to
maintain low %HbS, and thus, the tendency to lose iron through this mechanism
will be diminished(Porter & Garbowski, 2014).
Historically, blood transfusions were typically sporadic and given by simple
transfusion or by some form of partial exchange procedure in response to acute
episodes, which over a lifetime would lead to significant iron overload.
Transfusion tends now to be prescribed for primary and secondary stroke
prevention(Adams & Brambilla, 2005). Together with transfusion for prevention
or management of other complications, such as chest syndrome, or in preparation
for major surgery, this leads to more patients being at risk of TIO. The absolute
amount of blood consumed remains still well below that observed in TM: in a
large multicentre international study, simple (60%) or exchange (20%)
transfusions, amounted to an average ILR of 0.22mg/kg/day(Vichinsky et al,
2011). Manual exchange procedures, where about 1/3 of the blood volume is
exchanged, lead to an ILR of about 40% of that seen in simple transfusions, as
estimated from ferritin increments(Porter & Huehns, 1987). If patients undergo
automated erythrocytapheresis, the ILR can be as low as 0.053mg/kg/day for a
target pre-transfusion HbS<50%(Kim et al, 1994); comparing with
0.39mg/kg/day for simple transfusion with a target HbS<30% and
0.29mg/kg/day with a target HbS<50%. However less emphasis on chelation and
frequent problems with compliance in SCD lead to severe iron accumulation
over time.
1.2.3 Other conditions
Rare anaemias such as sideroblastic anaemia (SA), Diamond-Blackfan syndrome
(DBA), pure red cell aplasia (RCA), pyruvate kinase deficiency anaemia (PKD),
may also require life-long blood transfusions. Myelodysplastic syndromes
(MDS) are typically acquired but may also require chronic blood transfusions. In

27
these other forms of TIO, the ILR varies considerably; for example in
transfusion-dependent DBA patients, it can reach a mean of 0.4mg/kg/day, one
of the highest in TIO; in the same study MDS patients were transfused at
0.28mg/kg/day(Porter et al, 2008). Patients undergoing repeated myeloablative
chemotherapy for leukaemia or lymphoma can require over 100 units of
transfused blood, which translates to 20g of excess body iron that will eventually
require removal if long-term iron toxicity is to be avoided(Porter & Garbowski,
2014).
1.3 Mechanisms of iron toxicity in transfusional overload
1.3.1 The role of reactive oxygen species
The other physiological consequences of TIO are typically present in the tissues
where the storage iron reaches the highest concentrations, see summary in Figure
1-2. Lysosome or proteasome degradation of ferritin within cells releases iron
into LIP, from where the iron is incorporated anew into ferritin, inducing its
synthesis, or is made available for synthesis of essential iron-containing
proteins(Taketani, 2005). Above a critical concentration of LIP iron, e.g. 887±58
pmol/mg protein, or almost 3-fold normal, in rat hepatocytes(Ceccarelli et al,
1995), the iron starts to effectively redox cycle between ferric Fe3+ and ferrous
Fe2+ forms through the donation or acceptance of an electron and enhances the
generation of reactive oxygen species (ROS), with a cascade of consequences
(Figure 1-2) (Porter & Garbowski, 2014). The level of LIP and the capacity of
cells to resist the consequences of raised iron concentration depend on the cell
type: e.g. K562 cell line LIP concentrations of 0.24-0.4µM have been estimated
with fluorochrome calcein as a probe(Breuer et al, 1995) to consist
predominantly (80%) of ferrous iron. On the other hand, in EPR spectroscopy,
which detects ferric iron and requires no manipulation of cells, intracellular EPR-
detectable ferric iron was approximately 3.2µM(Cooper et al, 1996; Cooper &
Porter, 1997). Raised concentration of LIP is associated with ROS production
and potentially oncogenic effects(Galaris et al, 2008). Whereas the speciation
and redox state of LIP have not been directly demonstrated, an important insight
into its nature was provided recently by Hider and Kong(Hider & Kong, 2011)

28
Figure 1-2. Pathological mechanisms and consequences of iron overload. In iron overload resulting from repeated blood transfusions or long-term increased iron absorption, iron that is not liganded to naturally occurring molecules such as transferrin or ferritin or to therapeutic iron chelators, generates a variety of reactive oxygen species (ROS), most notably hydroxyl radicals. This occurs in cells where labile plasma iron is accumulated (especially liver, endocrine tissues and myocardium) thereby increasing the level of both storage and labile cellular iron. ROS increase lipid peroxidation and organelle damage, leading to cell death and fibrogenesis mediated by transforming growth factor, TGF-β1(Porter, 2005) ROS also damage DNA, risking genomic instability, mutagenesis and cell death or neoplasia. ROS directly activates caspases thereby accelerating apoptotic death (Zuo et al, 2009). Paradoxically, ROS may also have anti-apoptotic effects by activating NF-kB (dashed lines) (Aggarwal, 2004) which may contribute to MDS transformation and to iron-mediated neoplasia such as hepatoma. From (Porter & Garbowski, 2014)
who used potentiometric titration and thermodynamic speciation to identify
glutathione and not the citrate, or cysteine or ATP as the predominant ligand.
This is more interesting because even though GSH does not fully coordinate iron,
it stabilizes iron in its ferrous form through to the bond with sulphur in the
glutathione molecule as pentaquo•Fe(II). This means that inasmuch as iron is
complexed with glutathione it is not taking part in Fenton and Haber-Weiss
reactions, so does not catalyse formation of ROS. The affinity of GSH for LIP
Fe(II) is such that hexaquo•Fe(II) remains at around 100nM, so that the ROS
production is limited and access to cytoplasmic iron(II)-dependent proteins and

29
enzymes is maintained(Hider & Kong, 2011). In this context, Ceccarelli et al
1995 work is interesting because it suggests that LIP iron increased above
threefold is likely over-saturating the GSH buffer and leads to a significant
increase in ROS damage, as seen by MDA increase with concomitant ATP
drop(Ceccarelli et al, 1995), before inducible ROS-scavenging systems are
activated. Ferritin for example can act as a sink for LIP by decreasing its
magnitude and its potential toxicity: in e.g. murine erythroleukaemia cells,
overexpression of H-ferritin led to reduced level of LIP and ROS(Epsztejn et al,
1999).
1.3.2 Ambivalence of ROS
A significant amount of superoxide is produced physiologically during
mitochondrial respiration (about 30g/day of superoxide) and is contained by
superoxide dismutase and glutathione peroxidase, which convert it to water. Iron
can undergo redox cycling and thereby catalyse superoxide-hydrogen peroxide
interaction in the Haber-Weiss reaction yielding hydroxyl radicals. This can
occur thanks to a favourable redox potential of the Fe(II)/Fe(III) couple (between
+0.35 and -0.5V)(Marx & van Asbeck, 1996). The hydroxyl radical is extremely
active and due to the great affinity for electrons it can oxidize all substances
within its immediate vicinity (diffusion radius of 2.3nm)(Marx & van Asbeck,
1996), initiate lipid peroxidation(Kornbrust & Mavis, 1980; Bacon et al, 1983),
damage lysosomes(Myers et al, 1991) and mitochondria(Link et al, 1993, 1998).
The process whereby hydroxyl radical interacts with lipids starts with the initial
abstraction of a hydrogen atom, which yields a water molecule. Subsequently,
the lipid molecules are rearranged with peroxidation together with the abstraction
of a peroxyl radical. The latter starts a chain reaction of lipid peroxidation, which
disrupts the lipid bilayer thus damaging the organelles. This can lead to cell death
by apoptosis(Zhao et al, 1997; Jacob et al, 2000), or to fibrogenesis, with
products of lipid peroxidation (Houglum et al, 1990; Parola et al, 1993)
promoting collagen expression. Autocrine production of TGFβ-1 in Ito
cells(Bissell et al, 1995) also leads to fibrogenesis (Figure 1-2). The ROS-
dependent mutagenic damage to DNA may lead to cell death or neoplasia.
Additionally, via direct caspase activation, ROS can accelerate apoptosis(Zuo et

30
al, 2009); on the other hand, it may also exert anti-apoptotic effects through
activation of NF-kB(Aggarwal, 2004). This may contribute to MDS
transformation and to iron-mediated neoplastic transformation, such as in
hepatoma.
1.3.3 Infection risk
The increased risk of infection is an important, often neglected, mechanism of
toxicity from iron overload, being the second most common cause of mortality in
TDT. It is brought about by several mechanisms, the most important being
transferrin saturation. Apart from the transport of iron to the erythron and the
other tissues being its principal function, its another important role is that, in the
physiological state, transferrin is only partially saturated with ferric iron where
the majority, about 70% of its double high-affinity binding sites remain
unoccupied. The protective role of transferrin is to deny iron to bacteria that
require it to grow. Although strains exist that have evolved to extract iron from
transferrin by means of siderophores of higher affinity (such as enterobactin),
withholding of iron from invading microorganisms is still an efficient strategy
most of the time. For this reason, once transferrin becomes saturated there is a
paradigm shift in the availability of iron to microorganisms(Porter & Garbowski,
2014). Among other mechanisms leading to the infection risk is the impairment
of neutrophil function (Hoepelman et al, 1989) or increased virulence of intra-
macrophage organisms when host cells are iron overloaded(Nairz et al, 2013).
NTBI generation in TIO increases infection risk, as NTBI becomes an easier
substrate for bacterial uptake systems than transferrin iron. It has been shown
recently that following blood transfusion, NTBI is liberated from the rapidly
catabolised non-viable erythrocytes arising from storage lesion(Hod et al, 2010)
and result in enhanced bacterial growth.
1.4 Distribution and consequences of TIO
The distribution of the extra-hepatic iron overload appears to differ between
transfusion dependent diagnoses, most importantly in relative sparing of heart
and endocrine tissues in those patients with SCD who receive regular blood
transfusions. We discuss these important differences first by describing the

31
distribution of TIO in thalassaemia major, followed by sickle cell disease and
other diagnoses that may be complicated by TIO.
1.4.1 Iron distribution and consequences in Thalassemia Major
Thalassemia major is the prototypical condition in which the distribution of body
iron resulting from chronic (life-long) blood transfusion has been most
completely described. The first storage compartment in which transfused iron
accumulates is the spleen, liver and BM macrophages, at a later stage iron
accumulates in the hepatocyte compartment, with 80% of storage iron in the
liver. The storage capacity of the macrophage system following blood
transfusion can be as high as 10g according to historical studies. Once the
macrophage system becomes saturated, more iron becomes demonstrable by
Perl’s stain in the hepatocytes, as the TIO increases. The highest concentration of
iron in TIO is found in the liver. This organ is adapted to store iron, in Kupffer
cells (macrophages) or hepatocytes. Liver damage from iron overload in this
organ occurs slowly and at relatively high concentrations compared with other
tissues where excess transfused iron is directed. However, if levels exceed 15-20
mg/g dry weight, an increase in liver enzymes occurs, fibrosis and eventually
cirrhosis develop. With the advent of the chelation era, however, particularly
with optimal chelation, TM patients tend to have low hepatocytes iron deposits
whereas macrophage iron remains present(Origa et al, 2007). In NTDT on the
other hand, dietary iron accumulates through the portal system and concentrates
in peri-portal hepatocytes with macrophage sparing(Porter & Garbowski, 2014).
High levels of IE, typical in thalassaemia(Origa et al, 2007; Kattamis et al, 2006)
contribute to low hepcidin levels which permit high ferroportin expression in
macrophages; this in turn leads to an empty macrophage syndrome likely
influencing further the distribution in NTDT.
With the progression of TIO, especially under sub-optimal chelation therapy, a
variable proportion of iron ‘escapes’ from the liver into the endocrine tissues and
heart (or rather fails to be taken up by the liver and distributes extrahepatically).
This causes the classic pathology, morbidity and mortality associated with TIO to
arise. The post-mortem data obtained during the pre-chelation era(Modell, 1976)
32
are most informative for the understanding of how the transfused iron distributes
systemically, this is because iron chelation significantly alters systemic iron
distribution, being relatively tropic for hepatocellular iron compared with extra-
hepatic iron(Porter & Garbowski, 2014). Thus in patients dying from TIO
complications, the non-uniform distribution of iron in the body was demonstrated
with high hepatic, myocardial and endocrine concentration of iron, very low in
striated muscle and none in the brain(Modell & Matthews, 1976). However
despite the myocardial iron concentration (MIC) being but a fraction of that in
the liver, heart failure mortality occurred in the second and third decades of life
in all patients. Recent confirmation of this observation by MRI
evidence(Carpenter et al, 2011) was reported: myocardial tissue examined
biochemically and by MRI at post-mortem in patients dying from iron-induced
cardiomyopathy showed an average MIC of only 5.98±2.42mg/g dry weight. The
heart is less adapted to accommodating high concentrations of storage iron than
the liver, even though the storage iron is not directly toxic to cells (see
below)(Porter & Garbowski, 2014).
Even before the routine MRI monitoring or newer chelation regimens were
introduced, there was already a decrease in the incidence of cardiac failure,
diabetes, hypothyroidism and hypoparathyroidism(Borgna-Pignatti et al, 2004a;
Gamberini et al, 2008). However, hypogonadism (typically hypogonadotropic)
still remains an early and common feature of TIO in TDT(Borgna-Pignatti et al,
2004a). There was a further fall in the frequency of cardiac failure after the
cardiac MRI monitoring was introduced and chelation therapy intensified in
patients with increased MIC (myocardial T2*<20ms, see the discussion of MRI
methodology in 3.1.2). Analysis of a recent cohort of patients with a decade of
cardiac MRI follow-up on individually tailored chelation at UCLH and the
Whittington Hospital demonstrated that the cardiac failure was no longer the
leading cause of death and the frequency of increased myocardial iron
(myocardial T2*<20ms) decreased significantly from 60% to 23%(Thomas et al,
2010). The shift in the principal complications of TIO is imminent, with
cirrhosis, which develops one or two decades later than heart failure in the course
of TIO, becoming more common as survival increases, being present in as much
as 50% of patients at post-mortem, especially when chronic hepatitis coincides.

33
The frequency of hepatocellular carcinoma(Borgna-Pignatti et al, 2004b) is also
on the rise.
For TM patients, the factors affecting the extra-hepatic distribution of iron are
incompletely understood. It is clear that poor control of iron overload, as
evidenced by high serum ferritin or liver iron content (LIC) values over several
years, increases the risk of extra-hepatic iron distribution(Brittenham et al, 1994)
but there is considerable variability in the tendency to load iron in the heart
between patients and the factors affecting this variability require further
investigation.
The concentration of myocardial iron (MI), as estimated by the shortening of
myocardial T2*(ms), using gradient echo MRI, is a major predictor of mortality
in chronically transfused Thalassaemia patients(Modell et al, 2000; Sonakul et
al, 1984; Zurlo et al, 1989; Kirk et al, 2009). Factors affecting the development
of MH are not fully understood but may include: total number of units of blood
transfused(Cazzola et al, 1997; Olivieri et al, 1994), the rate of accumulation of
transfusional iron, LIC values above a certain threshold(Telfer et al, 2000;
Brittenham et al, 1994), long-term control of serum ferritin(Olivieri et al, 1994),
modality and quality of chelation therapy(Porter & Davis, 2002). Thus control of
body iron levels is clearly important to limiting the risk of extra-hepatic iron
overload and these factors will be explored in this thesis. However, it is apparent
that individual patients show variability in their propensity to accumulate
myocardial iron that cannot be explained by these factors alone. Some patients
do not accumulate myocardial iron despite poor long-term control of liver iron or
ferritin, whereas others appear to load iron into the heart at relatively modest
levels of transfusional iron. This suggests that additional factors may influence
extra-hepatic iron spread. In principle, these may include environmental and
genetic factors. Nutritional factors that have been suggested are vitamin D(Wood
et al, 2008), C, and E(Bartfay et al, 1998; Dissayabutra et al, 2005). We and
others have noticed that a proportion of patients, despite high total body iron
(TBI) and poor chelation compliance, never develop myocardial iron
overload(Inati et al, 2009), and conversely, well-controlled patients do retain and
occasionally load myocardial iron(Anderson et al, 2006), therefore, clearly,
34
factors other than quality of iron control influence the extra-hepatic iron
distribution.
Genetic factors include β0 vs. β+ Thalassaemia genotype(Origa et al, 2008a) and
glutathione transferase(Origa et al, 2008b; Wu et al, 2006) variants as possible
factors affecting MI deposition. Additionally, there will be genetic factors
present that distribute unevenly among ethnicities as a recent study of Egyptian
patients(El Beshlawy et al, 2014) identified a surprisingly low proportion of beta
thalassaemia major patients with myocardial iron overload compared with the
UK cohorts.
There is an on-going debate as to how the liver iron accumulation relates to the
risk of extra-hepatic distribution. Initially, a close relationship between the LIC
control with deferoxamine and long-term outcome from cardiomyopathy in TM
was observed(Brittenham et al, 1994). Similar observations from post-mortem
data in un-chelated patients with other diseases suggested a relationship between
transfusional iron load rate (ILR), LIC and MIC(Buja & Roberts, 1971; St Pierre
et al, 1991). However once myocardial T2* monitoring was introduced in
patients treated with different chelation regimens, LIC and myocardial T2* were
found to correlate only weakly, which led to a conclusion that in TM the LIC
control was unimportant in MIC control and, therefore, in limiting potentially
fatal cardiomyopathy(Anderson et al, 2001). The weak correlation was mainly
due to the majority of patients having been receiving intensive DFO chelation,
which was later shown to decrease LIC faster than MIC(Anderson et al, 2001,
2004). This could have confounded a potentially important relationship between
these variables. Others (Noetzli et al, 2008a) have shown that this relationship is
demonstrable longitudinally rather than cross-sectionally because failure to
control LIC over time with chelation increased the risk of MIC while on the other
hand LIC reduction had a delayed effect on decreasing the MIC (the lag effect).
The LVEF relationship to mT2* in longitudinal UK studies showed that the
cardiac failure risk increases for mT2*<10ms(Anderson et al, 2001; Kirk et al,
2009), or MIC>2.7mg/g dry weight(Carpenter et al, 2011). In conclusion,
therefore, the LIC control is relevant both to limiting hepatic damage and

35
controlling myocardial haemosiderosis in TM, thus markedly reducing the risk of
iron-mediated cardiomyopathy with heart failure(Porter & Garbowski, 2014).
1.4.2 Iron distribution and consequences in sickle cell disease
In comparison with TM, the clinical consequences of TIO begin later if patients
with SCD are repeatedly transfused so that growth and sexual development are
relatively unaffected. The iron from the catabolised transfused red cells initially
accumulates in macrophages, then in hepatocytes(Hankins et al, 2010), when the
LIC exceeds 7mg/g dry weight, or about 5g of transfused iron in a 70kg adult,
being equivalent to 25 units of transfused blood, based on the Angelucci
formula(Angelucci et al, 2000). The iron stores in hepatocytes become
comparable to the sinusoidal compartment for LIC>15 mg/g dry weight
equivalent to about 50 units of transfused red cells(Hankins et al, 2010). If liver
iron increases without adequate chelation so do the risks of fibrosis and
cirrhosis(Comer et al, 1991; Harmatz et al, 2000; Olivieri, 2001). Fibrosis was
observed already two years following the initiation of transfusion and in about
30% of patients with LIC>9mg/g dry weight, correlating with LIC(Olivieri,
2001)(Harmatz et al, 2000) even in the absence of hepatitis C infection(Olivieri,
2001; Brown et al, 2009). In post-mortem studies, cirrhosis was seen in 11% of
all patients and in almost half of patients who died with severe liver iron
overload (Darbari et al, 2006), so the true frequency of cirrhosis in multi-
transfused adult SCD patients is not clear(Porter & Garbowski, 2014)
The endocrine and cardiac complications of TIO are more delayed in SCD than
TM and less frequent. Low myocardial T2* is rare(Porter, 2007; Westwood et al,
2007) and requires more transfusion episodes to occur in SCD than TM(Wood et
al, 2004). In post-mortem studies of heavily transfused patients, there was,
however, cardiac iron deposition(Darbari et al, 2006). When SCD and TM
patients are matched for LIC, the frequency of cardiac complications, gonadal
failure or endocrine disturbances is lower in SCD patients <20 years
old(Vichinsky et al, 2005). Such differences notwithstanding, complete
protection from the extra-hepatic distribution of TIO in SCD is unlikely, for
cases of cardiac iron overload by MRI have been reported(Glanville et al, 2006).
36
Furthermore, the Multi-Centre Study of Iron Overload (MCSIO) group recently
found evidence of pituitary iron accumulation in SCD with highest LIC. Pituitary
iron also correlated inversely with pituitary volume and thus its endocrine
reserve, suggesting that MRI may identify preclinical pituitary complications
from iron overload in SCD(Wang et al, 2013). Others have found that the bone
mass inversely correlated with serum iron values, despite normal SF(Sadat-Ali et
al, 2011).
Renal iron overload has also been reported in SCD using MRI(Schein et al,
2008; Vasavda et al, 2012). In the non-transfused patients with high levels of
LDH, the renal overload is highest, does not correlation with LIC and is higher
than in TM. This suggests that its source is the iron released from haemoglobin
during intravascular haemolysis rather than TIO-dependent uptake from TBI or
NTBI. Furthermore, renal R2* may have a role of a biomarker for chronic
haemolysis-mediated vascular complications in SCD similar to fructosamine or
HbA1C in diabetes, being a cumulative marker of intravascular haemolysis. It has
not been studied to what extent this mechanism leads to renal damage in
SCD(Porter & Garbowski, 2014).
1.4.3 Iron distribution in other forms of TIO.
Many conditions may be complicated by TIO (Table 1-1). In MDS for instance,
iron loading may precede transfusion dependence due to IE, which may still
inhibit hepcidin expression and thus increased iron absorption from the gut
despite increased levels of inflammatory cytokines during infections such as IL-
6(Santini et al, 2011). With the onset of transfusion independence, as described
in the conditions with TIO, iron first accumulated in the macrophage
compartment and later in the liver parenchyma. Of paramount importance is the
rate at which the extrahepatic iron spread occurs and how soon is this going to
affect patients clinically, and so require chelation therapy. Historically, before
chelation was available, patients at autopsy had increased MIC with increased
transfusions(Buja & Roberts, 1971). When cardiac MRI monitoring was begun,
it was demonstrated that cardiac iron risk went up as the number of units
transfused exceeded fifty(Jensen et al, 2003; Jaeger et al, 1992). That
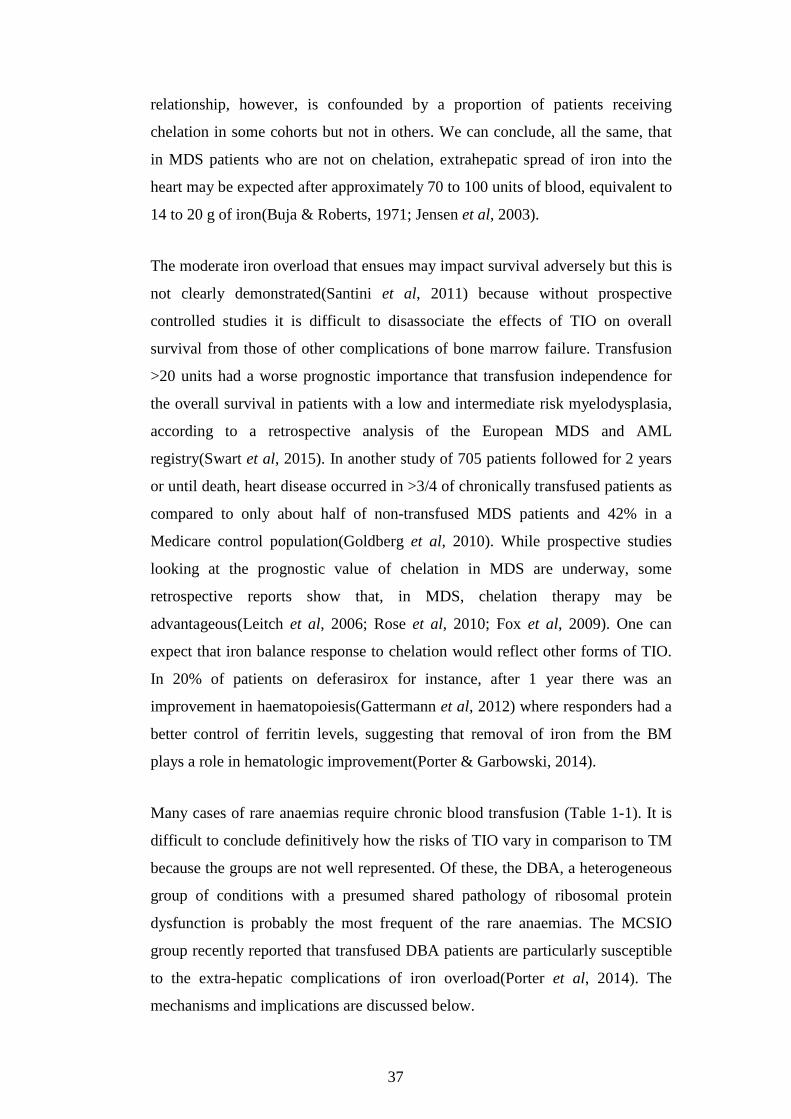
37
relationship, however, is confounded by a proportion of patients receiving
chelation in some cohorts but not in others. We can conclude, all the same, that
in MDS patients who are not on chelation, extrahepatic spread of iron into the
heart may be expected after approximately 70 to 100 units of blood, equivalent to
14 to 20 g of iron(Buja & Roberts, 1971; Jensen et al, 2003).
The moderate iron overload that ensues may impact survival adversely but this is
not clearly demonstrated(Santini et al, 2011) because without prospective
controlled studies it is difficult to disassociate the effects of TIO on overall
survival from those of other complications of bone marrow failure. Transfusion
>20 units had a worse prognostic importance that transfusion independence for
the overall survival in patients with a low and intermediate risk myelodysplasia,
according to a retrospective analysis of the European MDS and AML
registry(Swart et al, 2015). In another study of 705 patients followed for 2 years
or until death, heart disease occurred in >3/4 of chronically transfused patients as
compared to only about half of non-transfused MDS patients and 42% in a
Medicare control population(Goldberg et al, 2010). While prospective studies
looking at the prognostic value of chelation in MDS are underway, some
retrospective reports show that, in MDS, chelation therapy may be
advantageous(Leitch et al, 2006; Rose et al, 2010; Fox et al, 2009). One can
expect that iron balance response to chelation would reflect other forms of TIO.
In 20% of patients on deferasirox for instance, after 1 year there was an
improvement in haematopoiesis(Gattermann et al, 2012) where responders had a
better control of ferritin levels, suggesting that removal of iron from the BM
plays a role in hematologic improvement(Porter & Garbowski, 2014).
Many cases of rare anaemias require chronic blood transfusion (Table 1-1). It is
difficult to conclude definitively how the risks of TIO vary in comparison to TM
because the groups are not well represented. Of these, the DBA, a heterogeneous
group of conditions with a presumed shared pathology of ribosomal protein
dysfunction is probably the most frequent of the rare anaemias. The MCSIO
group recently reported that transfused DBA patients are particularly susceptible
to the extra-hepatic complications of iron overload(Porter et al, 2014). The
mechanisms and implications are discussed below.
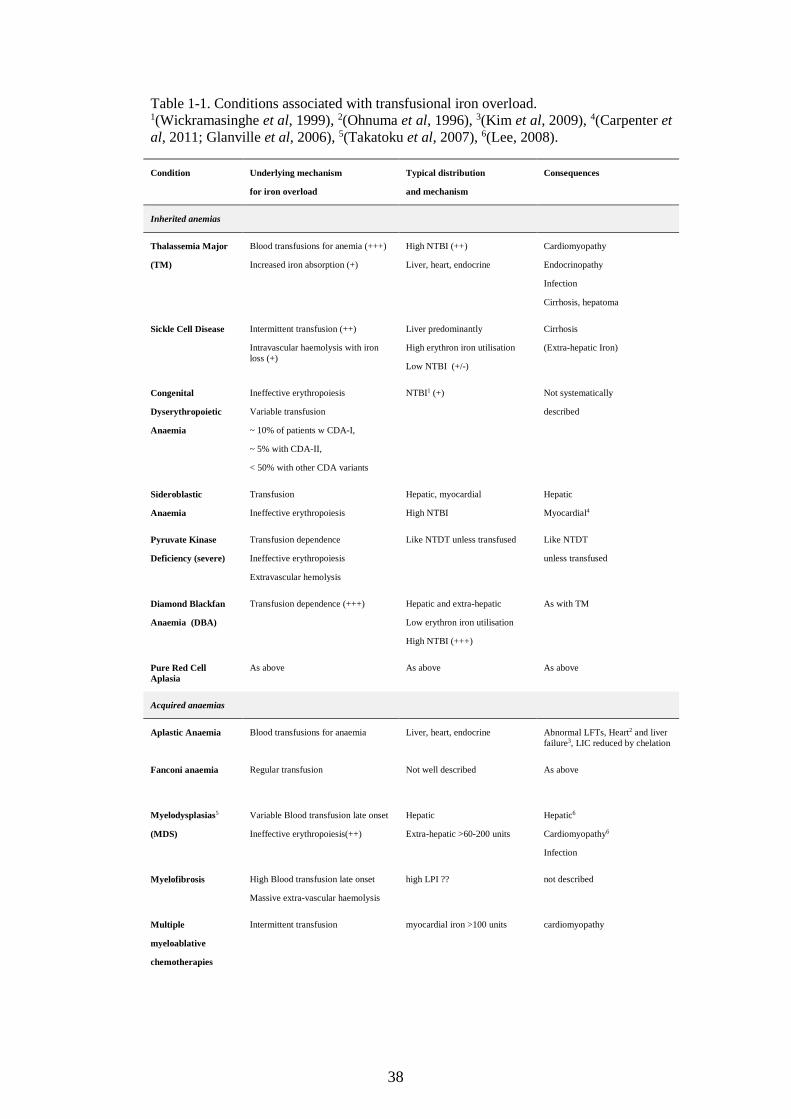
38
Table 1-1. Conditions associated with transfusional iron overload. 1(Wickramasinghe et al, 1999), 2(Ohnuma et al, 1996), 3(Kim et al, 2009), 4(Carpenter et al, 2011; Glanville et al, 2006), 5(Takatoku et al, 2007), 6(Lee, 2008).
Condition Underlying mechanism
for iron overload
Typical distribution
and mechanism
Consequences
Inherited anemias
Thalassemia Major
(TM)
Blood transfusions for anemia (+++)
Increased iron absorption (+)
High NTBI (++)
Liver, heart, endocrine
Cardiomyopathy
Endocrinopathy
Infection
Cirrhosis, hepatoma
Sickle Cell Disease Intermittent transfusion (++)
Intravascular haemolysis with iron loss (+)
Liver predominantly
High erythron iron utilisation
Low NTBI (+/-)
Cirrhosis
(Extra-hepatic Iron)
Congenital
Dyserythropoietic
Anaemia
Ineffective erythropoiesis
Variable transfusion
~ 10% of patients w CDA-I,
~ 5% with CDA-II,
< 50% with other CDA variants
NTBI1 (+)
Not systematically
described
Sideroblastic
Anaemia
Transfusion
Ineffective erythropoiesis
Hepatic, myocardial
High NTBI
Hepatic
Myocardial4
Pyruvate Kinase
Deficiency (severe)
Transfusion dependence
Ineffective erythropoiesis
Extravascular hemolysis
Like NTDT unless transfused Like NTDT
unless transfused
Diamond Blackfan
Anaemia (DBA)
Transfusion dependence (+++) Hepatic and extra-hepatic
Low erythron iron utilisation
High NTBI (+++)
As with TM
Pure Red Cell Aplasia
As above As above As above
Acquired anaemias
Aplastic Anaemia Blood transfusions for anaemia Liver, heart, endocrine Abnormal LFTs, Heart2 and liver failure3, LIC reduced by chelation
Fanconi anaemia Regular transfusion
Not well described As above
Myelodysplasias5
(MDS)
Variable Blood transfusion late onset
Ineffective erythropoiesis(++)
Hepatic
Extra-hepatic >60-200 units
Hepatic6
Cardiomyopathy6
Infection
Myelofibrosis High Blood transfusion late onset
Massive extra-vascular haemolysis
high LPI ?? not described
Multiple
myeloablative
chemotherapies
Intermittent transfusion myocardial iron >100 units cardiomyopathy

39
1.5 Mechanisms underlying distribution of transfused iron
Here we consider the putative mechanisms underlying the distribution of storage
iron in TIO.
As transferrin transports iron to the erythron and other tissues under the control
of receptor-mediated endocytosis it is the expression of TfR that governs iron
acquisition from transferrin, which in turn depends on iron homeostatic
mechanisms described above. The erythron, hepatocytes and cells undergoing
proliferation (where its expression is cell cycle-dependent) have the greatest
number of membrane transferrin receptors (especially erythroblasts and
reticulocytes: up to 800K and 100-500K receptors per cell(Ponka & Lok, 1999)).
With the progression of iron overload, as transferrin becomes saturated to 75%
and above, NTBI starts to appear in plasma(Le Lan et al, 2005; Loréal et al,
2000). Because the NTBI uptake is less regulated than TBI uptake, which
impacts on distribution differences(Oudit et al, 2003, 2006a), it could explain the
pattern of iron deposition, and hence its toxicity in advanced TIO. For instance,
there is a rapid uptake of NTBI by hepatocytes(Brissot et al, 1985; Parkes et al,
1995) and myocytes(Link et al, 1989b) in experimental models. In cultured
cardiomyocytes, NTBI species are taken up at 200 times the rate of transferrin
iron, generating ROS with typical consequences as described above(Link et al,
1989a, 1989b, 1993; Parkes et al, 1997). L-type calcium channels(Oudit et al,
2003), and zinc transporters(Liuzzi et al, 2006) have been implicated in NTBI
uptake which appears to be restricted to tissues known to accumulate iron. But
there are also other candidate portals for NTBI uptake into the myocardium, and
data on calcium channels in beta thalassaemia is not uniformly
accepted(Wijarnpreecha et al, 2015). Plasma NTBI (or its sub-fractions such as
LPI) may promote lipid peroxidation through the generation of ROS(Gutteridge
et al, 1985) and associate with depletion of plasma anti-oxidants(De Luca et al,
1999).
The putative relationship between NTBI and extra-hepatic iron distribution has
not been convincingly demonstrated clinically. A weak correlation between
NTBI and presence of clinical cardiac disease, not of heart iron, strictly speaking,
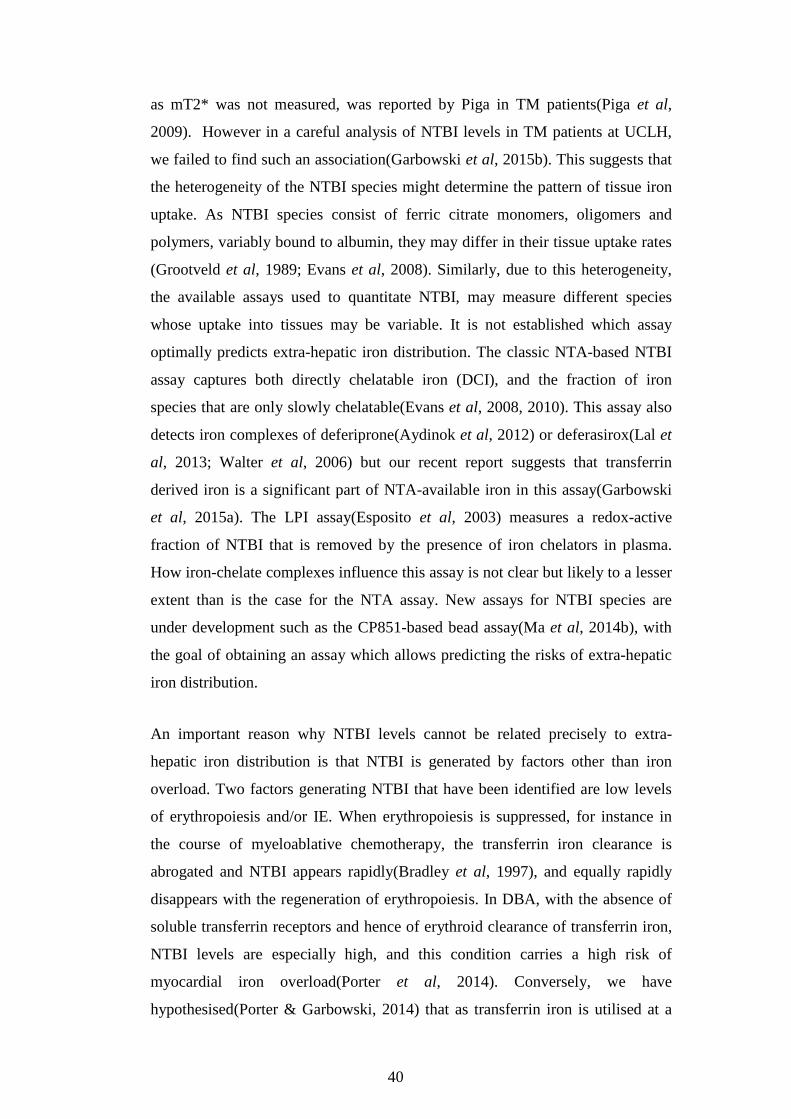
40
as mT2* was not measured, was reported by Piga in TM patients(Piga et al,
2009). However in a careful analysis of NTBI levels in TM patients at UCLH,
we failed to find such an association(Garbowski et al, 2015b). This suggests that
the heterogeneity of the NTBI species might determine the pattern of tissue iron
uptake. As NTBI species consist of ferric citrate monomers, oligomers and
polymers, variably bound to albumin, they may differ in their tissue uptake rates
(Grootveld et al, 1989; Evans et al, 2008). Similarly, due to this heterogeneity,
the available assays used to quantitate NTBI, may measure different species
whose uptake into tissues may be variable. It is not established which assay
optimally predicts extra-hepatic iron distribution. The classic NTA-based NTBI
assay captures both directly chelatable iron (DCI), and the fraction of iron
species that are only slowly chelatable(Evans et al, 2008, 2010). This assay also
detects iron complexes of deferiprone(Aydinok et al, 2012) or deferasirox(Lal et
al, 2013; Walter et al, 2006) but our recent report suggests that transferrin
derived iron is a significant part of NTA-available iron in this assay(Garbowski
et al, 2015a). The LPI assay(Esposito et al, 2003) measures a redox-active
fraction of NTBI that is removed by the presence of iron chelators in plasma.
How iron-chelate complexes influence this assay is not clear but likely to a lesser
extent than is the case for the NTA assay. New assays for NTBI species are
under development such as the CP851-based bead assay(Ma et al, 2014b), with
the goal of obtaining an assay which allows predicting the risks of extra-hepatic
iron distribution.
An important reason why NTBI levels cannot be related precisely to extra-
hepatic iron distribution is that NTBI is generated by factors other than iron
overload. Two factors generating NTBI that have been identified are low levels
of erythropoiesis and/or IE. When erythropoiesis is suppressed, for instance in
the course of myeloablative chemotherapy, the transferrin iron clearance is
abrogated and NTBI appears rapidly(Bradley et al, 1997), and equally rapidly
disappears with the regeneration of erythropoiesis. In DBA, with the absence of
soluble transferrin receptors and hence of erythroid clearance of transferrin iron,
NTBI levels are especially high, and this condition carries a high risk of
myocardial iron overload(Porter et al, 2014). Conversely, we have
hypothesised(Porter & Garbowski, 2014) that as transferrin iron is utilised at a

41
high rate by highly expanded erythron in NTDT, high rate de-saturation of small
concentrations of transferrin could, in turn, inhibit NTBI iron uptake into the
target tissue. Thus, this mechanism could also be relevant in TM patients where
the transfusion regimen does not completely suppress erythropoiesis; this
hypothesis being under investigation in the present work and has been
preliminarily published as an oral ASH abstract in 2015(Garbowski et al, 2015b).
The observation that NTBI levels(Walter et al, 2006; Shah et al, 2002) and LPI
levels(Koren et al, 2010; Ghoti et al, 2010) are lower in SCD than in TM patients
with similar levels of iron overload makes for an attractive hypothesis when
linked with the low propensity for extra-hepatic iron distribution in SCD. In
contrast, in patients with NTDT, there are high NTBI (Taher et al, 2009; Porter
et al, 2011a) and LPI levels(Pootrakul et al, 2004) whereas the risk of
myocardial iron is very low(Origa et al, 2008a), suggesting that absolute NTBI
levels are not the only consideration. LPI comparison in rare anaemias resulting
from haemolysis or from decreased red cell production(Porter et al, 2011b),
showed that both types of anaemia were associated with raised LPI, which was
removed following chelation therapy with deferasirox. Interestingly, a significant
correlation of LPI levels with both the degree of iron overload (as ferritin) and
transfusional ILR (Figure 1-3) at baseline was present but the correlation with
ILR (unlike ferritin) weakened with the progression of the study and disappeared
at the end of the study. This would support the idea that with increasing
transfusional ILR (the threshold reported was >0.2mg/kg/d(Porter et al, 2011b)),
LPI increases and hence the potential to extra-hepatic iron distribution. The
relationship of transfusional loading rate, NTBI speciation and extra-hepatic
complications of iron overload requires a systematic study.

42
Figure 1-3. LPI relates to baseline transfusion iron load rate and ferritin. (A) The relationship between baseline pre-dose labile plasma iron (LPI) and transfusion rate in the year prior to study entry. There is a significant correlation (R = 0.58, P = 0.0005, n = 32) between transfusion rate in the year prior to study entry and baseline pre-dose LPI in all patients. Haemolytic anaemias are shown in circles and production anaemias in diamonds. The grey area denotes the healthy reference range. (B) The relationship between baseline pre-dose LPI and baseline serum ferritin. There is a significant relationship (R = 0.47, P = 0.004) between baseline ferritin and baseline pre-dose LPI for all patients. Haemolytic anaemias are shown in circles and production anaemias in diamonds. The grey area denotes the healthy reference range. From Porter JB, Lin KH, Beris P, et al. Response of iron overload to deferasirox in rare transfusion-dependent anaemias: equivalent effects on serum ferritin and labile plasma iron for haemolytic or production anaemias. Eur J Haematol. 2011;87(4):338-348. Copyright © 2011 John Wiley & Sons A/S.
43
1.6 Nature of NTBI
NTBI ever since its discovery by Hershko(Hershko et al, 1978) has been of
fundamental importance in iron overload but ironically it is a historical
misnomer. The name is apophatic(Cabantchik, 2014) describing indirectly
neither exhaustively nor exclusively the iron pools contained in plasma which are
not bound to high affinity double binding site on transferrin, namely as the entity
which is not another entity. There are right arguments for this criticism, namely
that ferritin iron, lipocalin iron or heme iron are not included in the NTBI as it is
commonly understood. However this is only a historical aside and there is no
reason to dwell on it. Some authors have suggested that the NTBI as a name
should be replaced by LPI(Cabantchik, 2014) because that is the main culprit in
IO consequences, but this may be a spurious argument. LPI is merely a subset of
NTBI or a measure of redox activity of NTBI and this varies in the important
way across patient groups or even NTBI models in vitro.
So for the purposes of this work, NTBI refers to plasma iron not bound to high
affinity sites on transferrin but persisting in plasma when transferrin saturation
exceeds typically 75%(Le Lan et al, 2005; Loréal et al, 2000), most frequently
when it is completely saturated (100%) in conditions when iron entry to plasma
compartment exceed the iron exit from it. In such chronic conditions, NTBI is
coordinated by ligands, typically by citrate and albumin, with other ligands of
lesser (hitherto) role. When bound to citrate, NTBI undergoes speciation change
depending on the ratio of iron to citrate and pH.
In a seminal paper on NTBI speciation(Silva et al, 2009) Silva and colleagues
used various techniques to probe the nature of ferric citrate in aqueous solutions.
A figure from that paper is shown below (Figure 1-4), which indicates that with
change of pH the speciation of ferric citrate changes considerably both in terms
of protonation of free carboxylic an alcoxy groups as well as formation of mono
and oligonuclear species where iron is bound to citrate at different ratios either
directly or with other Fe atoms via oxygen bridges. For physiological pH, the
principal species involved are FeL2 (92%), FeL2H (5%) and Fe3L3 (<1%) for
100:1 citrate-to-iron ratio and FeL2 (60%), FeL2H (4%) and Fe3L3 (38%) for 10:1
44
citrate-to-iron ratio. Thus, the principal differences between ferric citrate species
consist in the number of citrate molecules per iron atom. This number also
determines whether iron is fully coordinated by the citrate ligand or not, citrate
being a tridentate ligand. This work complements the previous paper by (Evans
et al, 2008) where initial work on the nature of NTBI in thalassaemic sera and in
vitro NTBI models was for the first time comprehensively examined. It was
shown that NTBI is completely bound to albumin using an in vitro ferric citrate
model ± HSA at 40g/L and that the binding is rapid except for 1000:1 (citrate-to-
iron) ratios where 22% of ferric citrate remains unbound at t0, falls to 5.5% at 1h
and disappears altogether by 24h at the latest(Evans et al, 2008).
Nevertheless, the nature of that binding was not fully explained, nor was its
affinity. Although immunodepletion or adsorption of albumin on sepharose
column suggested that the binding is loose, iron transfer to DFO (as ferrioxamine
formation after 10min) was much lower (2%) when iron was bound to albumin
directly than with mediation of citrate (Fe:citrate ratio 1:10 + HSA, 24.8%), and
these recovery values were only partially corrected under NTA excess
(80mM)(Evans et al, 2008). This suggests therefore that binding to albumin is
variable, very likely species- and time-dependent, and may result in direct
binding of Fe to e.g. carboxylic groups (?) of albumin aminoacids, which are
potentially sterically unavailable to hexadentate DFO, but of higher affinity, as
judged from but a weak NTA-dependent mobilisation. DFN competition with
citrate for Fe(III) was measured using on-column derivatization in the HPLC
assay where ferriprone formation was monitored at 450nm. This showed that
ferriprone is formed at a progressively slower rate as citrate-to-iron ratio of ferric
citrate rises from 1:1 to 1000:1 (half-life of ferric citrate falling from 600s to 5s,
respectively), indicating that the more complex the oligomer the slower the
removal of Fe from the species(Evans et al, 2008). Albumin effect on
deferiprone-dependent mobilisation of iron from ferric citrate ‘ratio-species’ was
not studied, however.
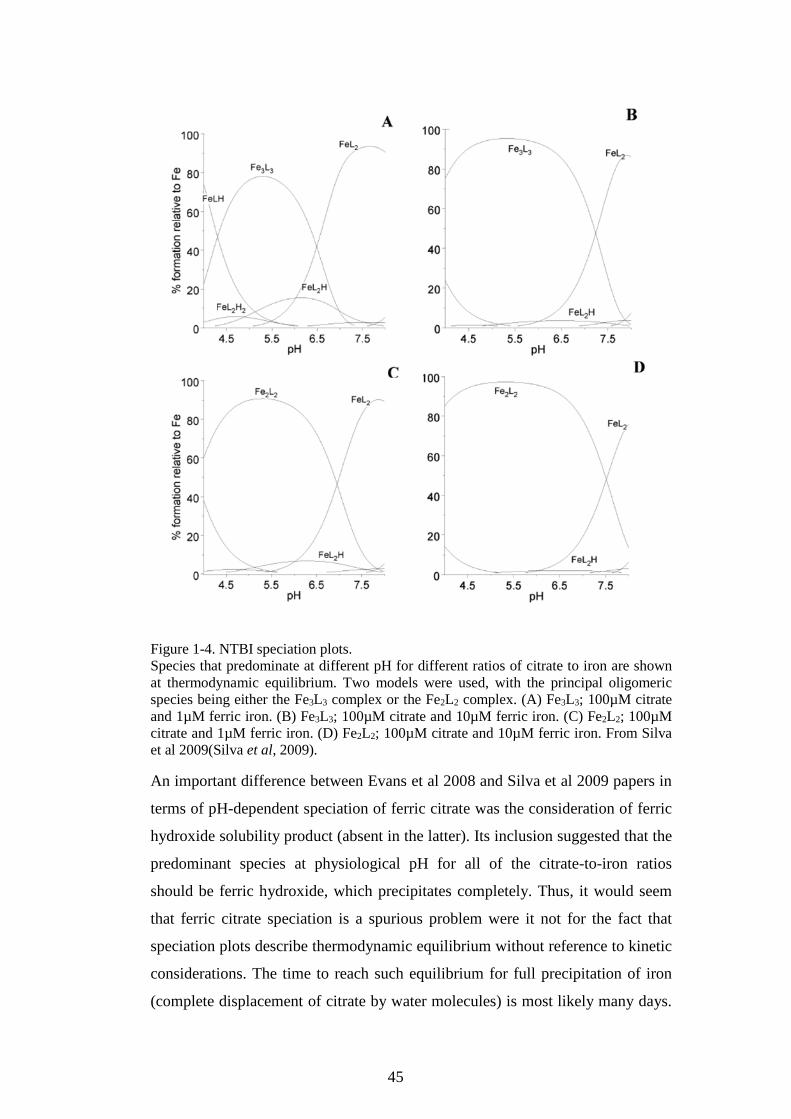
45
Figure 1-4. NTBI speciation plots. Species that predominate at different pH for different ratios of citrate to iron are shown at thermodynamic equilibrium. Two models were used, with the principal oligomeric species being either the Fe3L3 complex or the Fe2L2 complex. (A) Fe3L3; 100µM citrate and 1µM ferric iron. (B) Fe3L3; 100µM citrate and 10µM ferric iron. (C) Fe2L2; 100µM citrate and 1µM ferric iron. (D) Fe2L2; 100µM citrate and 10µM ferric iron. From Silva et al 2009(Silva et al, 2009).
An important difference between Evans et al 2008 and Silva et al 2009 papers in
terms of pH-dependent speciation of ferric citrate was the consideration of ferric
hydroxide solubility product (absent in the latter). Its inclusion suggested that the
predominant species at physiological pH for all of the citrate-to-iron ratios
should be ferric hydroxide, which precipitates completely. Thus, it would seem
that ferric citrate speciation is a spurious problem were it not for the fact that
speciation plots describe thermodynamic equilibrium without reference to kinetic
considerations. The time to reach such equilibrium for full precipitation of iron
(complete displacement of citrate by water molecules) is most likely many days.
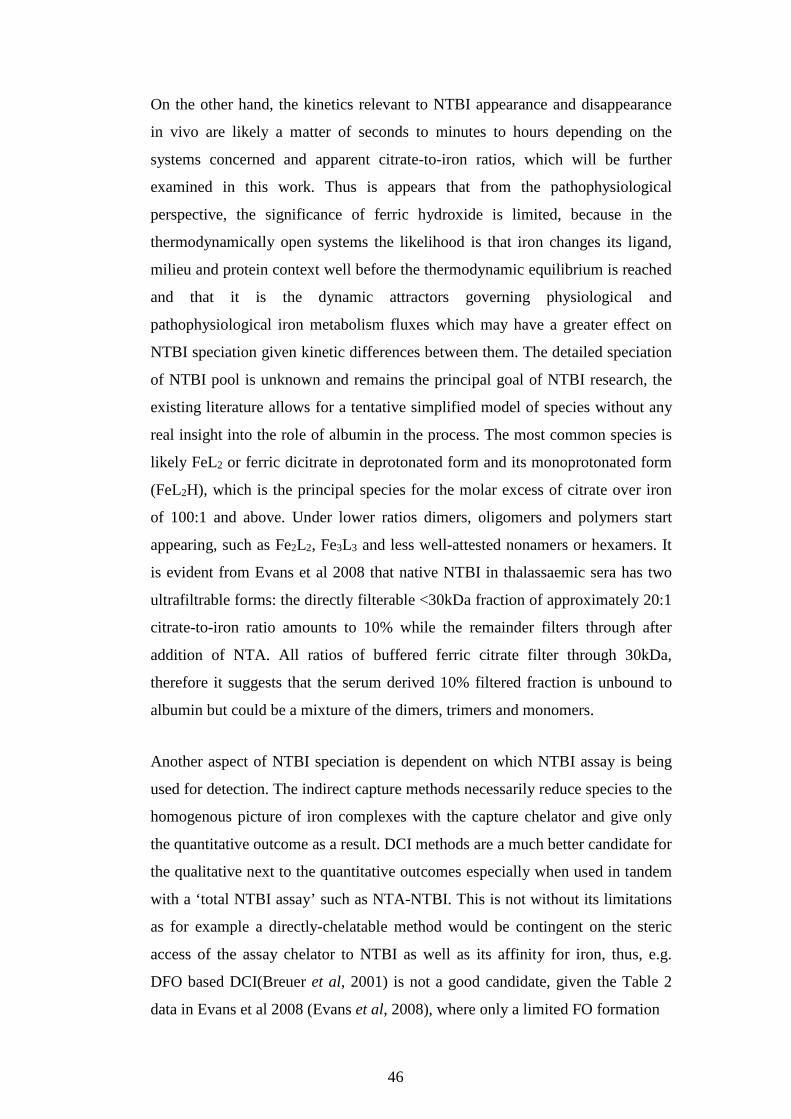
46
On the other hand, the kinetics relevant to NTBI appearance and disappearance
in vivo are likely a matter of seconds to minutes to hours depending on the
systems concerned and apparent citrate-to-iron ratios, which will be further
examined in this work. Thus is appears that from the pathophysiological
perspective, the significance of ferric hydroxide is limited, because in the
thermodynamically open systems the likelihood is that iron changes its ligand,
milieu and protein context well before the thermodynamic equilibrium is reached
and that it is the dynamic attractors governing physiological and
pathophysiological iron metabolism fluxes which may have a greater effect on
NTBI speciation given kinetic differences between them. The detailed speciation
of NTBI pool is unknown and remains the principal goal of NTBI research, the
existing literature allows for a tentative simplified model of species without any
real insight into the role of albumin in the process. The most common species is
likely FeL2 or ferric dicitrate in deprotonated form and its monoprotonated form
(FeL2H), which is the principal species for the molar excess of citrate over iron
of 100:1 and above. Under lower ratios dimers, oligomers and polymers start
appearing, such as Fe2L2, Fe3L3 and less well-attested nonamers or hexamers. It
is evident from Evans et al 2008 that native NTBI in thalassaemic sera has two
ultrafiltrable forms: the directly filterable <30kDa fraction of approximately 20:1
citrate-to-iron ratio amounts to 10% while the remainder filters through after
addition of NTA. All ratios of buffered ferric citrate filter through 30kDa,
therefore it suggests that the serum derived 10% filtered fraction is unbound to
albumin but could be a mixture of the dimers, trimers and monomers.
Another aspect of NTBI speciation is dependent on which NTBI assay is being
used for detection. The indirect capture methods necessarily reduce species to the
homogenous picture of iron complexes with the capture chelator and give only
the quantitative outcome as a result. DCI methods are a much better candidate for
the qualitative next to the quantitative outcomes especially when used in tandem
with a ‘total NTBI assay’ such as NTA-NTBI. This is not without its limitations
as for example a directly-chelatable method would be contingent on the steric
access of the assay chelator to NTBI as well as its affinity for iron, thus, e.g.
DFO based DCI(Breuer et al, 2001) is not a good candidate, given the Table 2
data in Evans et al 2008 (Evans et al, 2008), where only a limited FO formation
47
Figure 1-5. Principal NTBI species are shown. (A) Ferric dicitrate in deprotonated form, FeL2. (B) Ferric citrate dimer, Fe2L2. (C) Ferric citrate trimer in deprotonated form, Fe3L3. From Silva et al 2009(Silva et al, 2009)
over 10 min is possible so it would be ‘blind’ to many species otherwise present,
however it would ‘speciate’ the total NTBI into the DCI and the non-DCI forms.
A similar method could be utilised with transferrin based DCI(Breuer &
Cabantchik, 2001) but again not all ferric citrate species are available to
transferrin in a given period of incubation(Bates et al, 1967), hence the need for a
mobilising agent within the assay such as oxalate. A recently developed DCI
based on a hexadentate CP851 has a seeming access to nearly all species of
NTBI given a 24h incubation but steric hindrance is still a possible cause for
large polymers/oligomers bound to albumin(Ma et al, 2014a) to be only partially
detectable. In principle, it is therefore currently possible to ‘speciate’
experimentally only by means of employing several NTBI assays in parallel and
examining their outcomes in a dichotomous way as above.
Another aspect which is relevant to iron overload is the redox activity of NTBI.
This is in principle predicated by the stability of ligand coordination, the
‘denticity’ of ligands, and, consequently, the ratio of ligand to iron in a complex,
itself dependent on relative concentrations of both iron atoms and the ligand
molecules. Thus a full coordination of ferric iron by citrate in a mononuclear
complex (ferric dicitrate) stably and completely coordinates the iron making it
relatively redox-actively inert; this is not so for higher order complexes such as

48
the dimer, trimer and polymers where iron atoms are partially coordinated by
water molecules and not citrate and may, therefore, partake in redox active
processes. The redox active NTBI has been measured using various methods, but
over the last decade typically detected by labile plasma iron assay(Esposito et al,
2003), where ascorbate is used as a reducing agent and the redox active potential
of NTBI is made apparent by oxidation of a fluorescent probe
(Dihydrorhodamine), under Fenton reaction conditions and deferiprone control.
LPI is typically a sub-fraction of the total NTBI (NTA-NTBI) in vivo, suggesting
that this is another form to look at speciation.
The use of chelators is another confounding factor but, from the point of
speciation of NTBI, a valid and significant ‘source’ or ‘component’ of NTBI
itself, again dependent on the NTBI detection method. In principle, any chelator-
iron complexes of deferasirox, deferiprone or deferoxamine are part of NTBI by
definition but also in practice when NTBI assay results are examined in the
context of patient history, chelator posology and dose, the presence of washout
and other consideration such as chelator combinations. Whether they are a
significant functional part of NTBI is perhaps dependent on the degree of
coordination predicated by chelator denticity and their active concentration in
serum. Thus for deferiprone, it is more likely to observe partially coordinated
iron (and therefore likely LPI-detectable, partially redox-active) than for
deferasirox, especially at trough levels of the ligand. This is further complicated
by the rate of egress of chelates from tissues where complexation with iron
occurred as chelates may pool intracellularly, egress at a slower rate(Cooper et
al, 1996), and change total NTBI if that is sampled at different times.
Ferrioxamine is typically a good control as it is not detectable by NTBI assays, at
least theoretically. It is seen as total iron using ferrozine acid extraction. NTBI
assays also differ in their access to chelator complexes with iron for reasons
other than their respective affinity for iron. For instance, steric considerations
may be necessary given the albumin binding of deferasirox-iron complexes,
which is shown in this work.
In chelated patients, the presence of free ligands is an important factor, which
tends to introduce a measurement bias (underestimation of true NTBI) in most of

49
the assays used. This is also apparent in indirect methods when transferrin is not
fully saturated, although not, for example, in CP851 method, which is robust to
transferrin, as are other DCI methods. Finally, NTBI may come from iron being
displaced from ferritin or transferrin and spuriously appear as NTBI in e.g. the
NTA assay, as a positive bias (overestimation). It is, therefore, important to
examine NTBI levels ideally using a raft of assays together with total cellular
iron, TIBC, UIBC, transferrin level, transferrin saturation and history details. To
complete the picture, ferrioxamine levels, DFN complexes and deferasirox
complexes can be measured separately from NTBI.
Not all NTBI is a candidate for extrahepatic uptake, or strictly speaking
extrahepatic loading (uptake and retention). This is evident when high NTBI
level as seen in NTDT, often comparable to TDT, do not typically result in
extrahepatic loading. It is possible that NTBI may be a candidate for uptake but
there are other, non-NTBI factors that determine retention. This work addressed
this question directly and provides a tentative answer to this paradox.
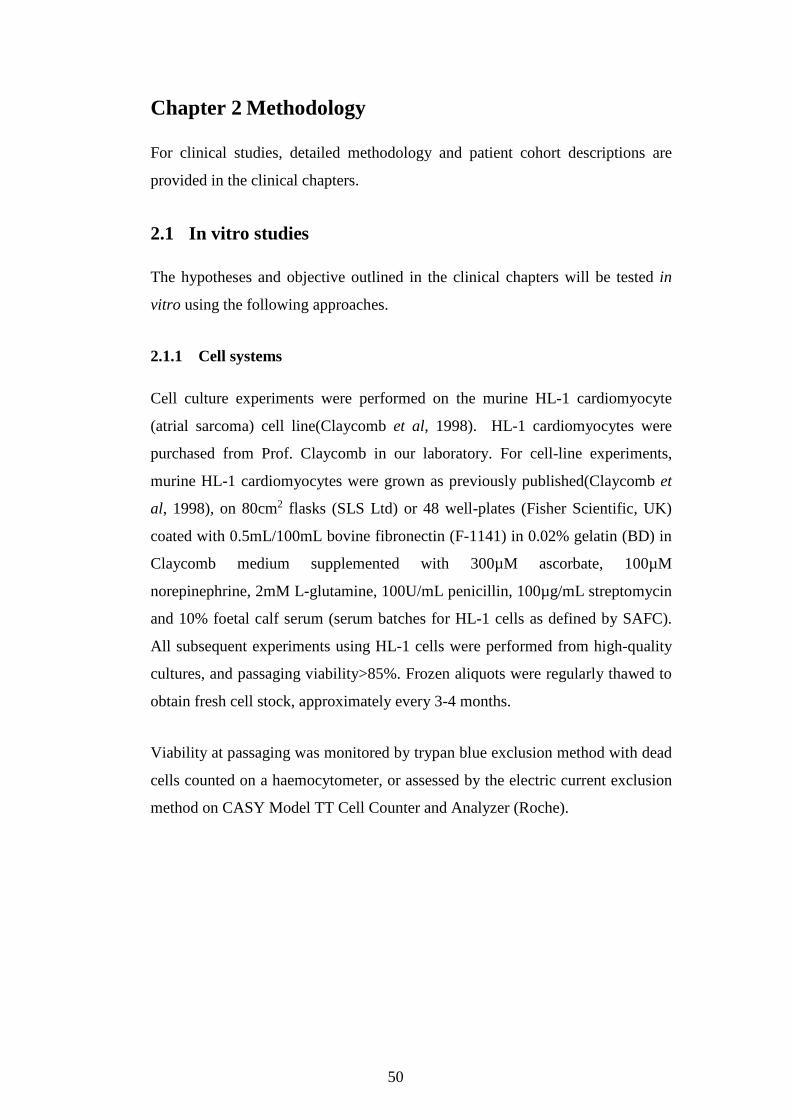
50
Chapter 2 Methodology
For clinical studies, detailed methodology and patient cohort descriptions are
provided in the clinical chapters.
2.1 In vitro studies
The hypotheses and objective outlined in the clinical chapters will be tested in
vitro using the following approaches.
2.1.1 Cell systems
Cell culture experiments were performed on the murine HL-1 cardiomyocyte
(atrial sarcoma) cell line(Claycomb et al, 1998). HL-1 cardiomyocytes were
purchased from Prof. Claycomb in our laboratory. For cell-line experiments,
murine HL-1 cardiomyocytes were grown as previously published(Claycomb et
al, 1998), on 80cm2 flasks (SLS Ltd) or 48 well-plates (Fisher Scientific, UK)
coated with 0.5mL/100mL bovine fibronectin (F-1141) in 0.02% gelatin (BD) in
Claycomb medium supplemented with 300µM ascorbate, 100µM
norepinephrine, 2mM L-glutamine, 100U/mL penicillin, 100µg/mL streptomycin
and 10% foetal calf serum (serum batches for HL-1 cells as defined by SAFC).
All subsequent experiments using HL-1 cells were performed from high-quality
cultures, and passaging viability>85%. Frozen aliquots were regularly thawed to
obtain fresh cell stock, approximately every 3-4 months.
Viability at passaging was monitored by trypan blue exclusion method with dead
cells counted on a haemocytometer, or assessed by the electric current exclusion
method on CASY Model TT Cell Counter and Analyzer (Roche).
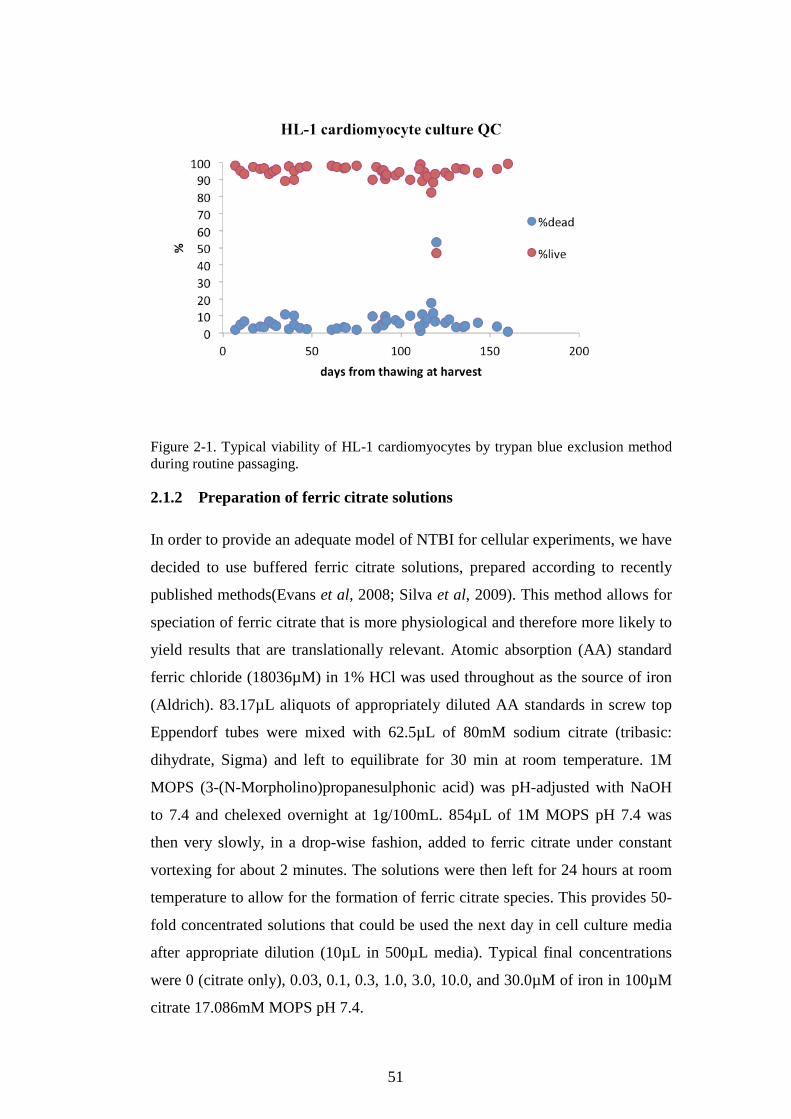
51
Figure 2-1. Typical viability of HL-1 cardiomyocytes by trypan blue exclusion method during routine passaging.
2.1.2 Preparation of ferric citrate solutions
In order to provide an adequate model of NTBI for cellular experiments, we have
decided to use buffered ferric citrate solutions, prepared according to recently
published methods(Evans et al, 2008; Silva et al, 2009). This method allows for
speciation of ferric citrate that is more physiological and therefore more likely to
yield results that are translationally relevant. Atomic absorption (AA) standard
ferric chloride (18036µM) in 1% HCl was used throughout as the source of iron
(Aldrich). 83.17µL aliquots of appropriately diluted AA standards in screw top
Eppendorf tubes were mixed with 62.5µL of 80mM sodium citrate (tribasic:
dihydrate, Sigma) and left to equilibrate for 30 min at room temperature. 1M
MOPS (3-(N-Morpholino)propanesulphonic acid) was pH-adjusted with NaOH
to 7.4 and chelexed overnight at 1g/100mL. 854µL of 1M MOPS pH 7.4 was
then very slowly, in a drop-wise fashion, added to ferric citrate under constant
vortexing for about 2 minutes. The solutions were then left for 24 hours at room
temperature to allow for the formation of ferric citrate species. This provides 50-
fold concentrated solutions that could be used the next day in cell culture media
after appropriate dilution (10µL in 500µL media). Typical final concentrations
were 0 (citrate only), 0.03, 0.1, 0.3, 1.0, 3.0, 10.0, and 30.0µM of iron in 100µM
citrate 17.086mM MOPS pH 7.4.
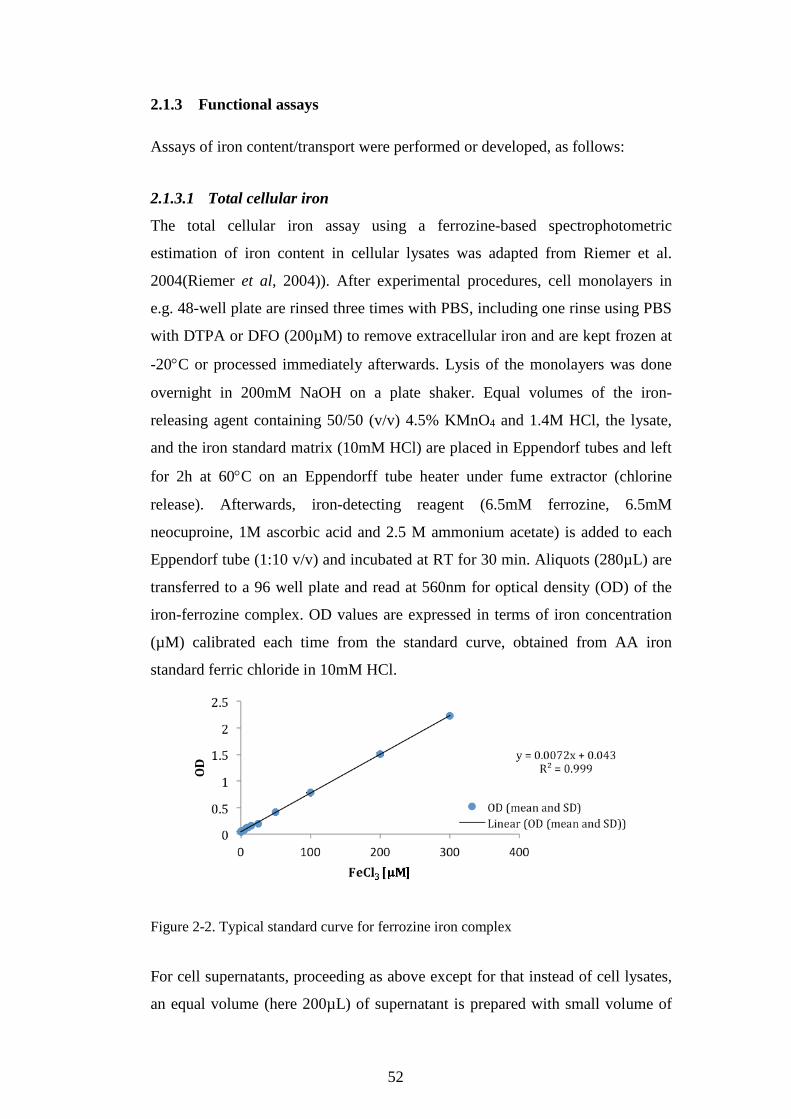
52
2.1.3 Functional assays
Assays of iron content/transport were performed or developed, as follows:
2.1.3.1 Total cellular iron
The total cellular iron assay using a ferrozine-based spectrophotometric
estimation of iron content in cellular lysates was adapted from Riemer et al.
2004(Riemer et al, 2004)). After experimental procedures, cell monolayers in
e.g. 48-well plate are rinsed three times with PBS, including one rinse using PBS
with DTPA or DFO (200µM) to remove extracellular iron and are kept frozen at
-20°C or processed immediately afterwards. Lysis of the monolayers was done
overnight in 200mM NaOH on a plate shaker. Equal volumes of the iron-
releasing agent containing 50/50 (v/v) 4.5% KMnO4 and 1.4M HCl, the lysate,
and the iron standard matrix (10mM HCl) are placed in Eppendorf tubes and left
for 2h at 60°C on an Eppendorff tube heater under fume extractor (chlorine
release). Afterwards, iron-detecting reagent (6.5mM ferrozine, 6.5mM
neocuproine, 1M ascorbic acid and 2.5 M ammonium acetate) is added to each
Eppendorf tube (1:10 v/v) and incubated at RT for 30 min. Aliquots (280µL) are
transferred to a 96 well plate and read at 560nm for optical density (OD) of the
iron-ferrozine complex. OD values are expressed in terms of iron concentration
(µM) calibrated each time from the standard curve, obtained from AA iron
standard ferric chloride in 10mM HCl.
Figure 2-2. Typical standard curve for ferrozine iron complex
For cell supernatants, proceeding as above except for that instead of cell lysates,
an equal volume (here 200µL) of supernatant is prepared with small volume of

53
highly concentrated (4.2-8.4 M) NaOH (typically 5-10µL) used to adjust the
final concentration (and pH) of NaOH to 200µM for cross-experimental
comparison.
2.1.3.2 Intracellular labile iron pool assay
The intracellular labile iron pool (LIP) assay was adapted from a previous
publication(Epsztejn et al, 1997) with significant modifications for the
cardiomyocyte cell line model. The assay utilises chelator-induced de-quenching
of calcein fluorescence as a measure of iron levels in the LIP.
During the assay preparation, acetomethoxy-calcein (CAL-AM, Sigma) is
introduced to cell monolayers and left to equilibrate across the cell membrane.
Intracellular esterases cleave the ester bond in CAL-AM to produce a membrane
impermeable free calcein (CAL), which accumulates as a strongly fluorescing
compound. CAL equilibrates with LIP iron present in cells at baseline giving a
net fluorescence signal that is quenched proportionally to the amount of iron in
LIP. Subsequently, CAL fluorescence is monitored continuously for 1-2 h during
which time experimental media are added and their effect on fluorescence is
quantified in a time-resolved manner.
Experimental media included iron species in buffered solutions and/or cell
culture media such as e.g. ferric ammonium citrate, ferric citrate species, iron-
NTA, transferrin species, patient sera, and other. Calcein fluorescence is
quenched after it binds iron but this depends on the form of iron presented to
cardiomyocytes and on other factors that are present as well.
The addition of cell-permeable high-affinity iron chelators (SIH or deferiprone)
leads to stripping of iron from CAL and increases the fluorescence intensity of
calcein, with the increase being directly proportional to iron that was bound to
calcein. This is an indirect measure of LIP iron in live cell conditions under the
assumption that calcein accessible iron pool is an appropriate model of the
cytosolic labile iron pool.
54
Confluent HL-1 monolayers, usually 24h after plating in a 48-well plate, are
washed with 500µL/well of assay media warmed up to 37°C: (1) 50µM
DTPA/RPMI, (2) RPMI, (3) 0.1% bovine serum albumin (BSA) loading medium
(BSA in RPMI) and incubated with (4) calcein medium for 10 min (0.25µM
calcein-AM in 0.1% loading medium); calcein is subsequently washed off twice
with HBS containing probenecid and finally 500µL of warm RPMI is added to
each well. The plate is then inserted into a plate reader programmed to keep 37°C
for the duration of the assay. Every 120s fluorescence is read in each well
(excitation 485nm, emission at 535nm), using a multipoint setting to account for
within-monolayer variability in fluorescence, which essentially monitors the
quality of monolayer confluence, see Figure 2-3. At specified intervals the
experimental media are added (typically after baseline reading), then again
immediately before de-quenching of fluorescence.
After baseline reading of fluorescence, cells are exposed to iron-containing
media e.g. ferric ammonium citrate in RPMI and change in fluorescence (fitted
by exponential decay function) is recorded for 1h in 120 s steps (30 readings).
50µM DTPA (f.c.) is added at 1h and signal is followed for 10-15 min (5-8
readings), typically a flat line is fitted. 100µM of SIH (f.c.) is added and the
signal is subsequently followed for 30 min (15 readings), typically fitted using an
exponential association function, see Figure 2-5
.
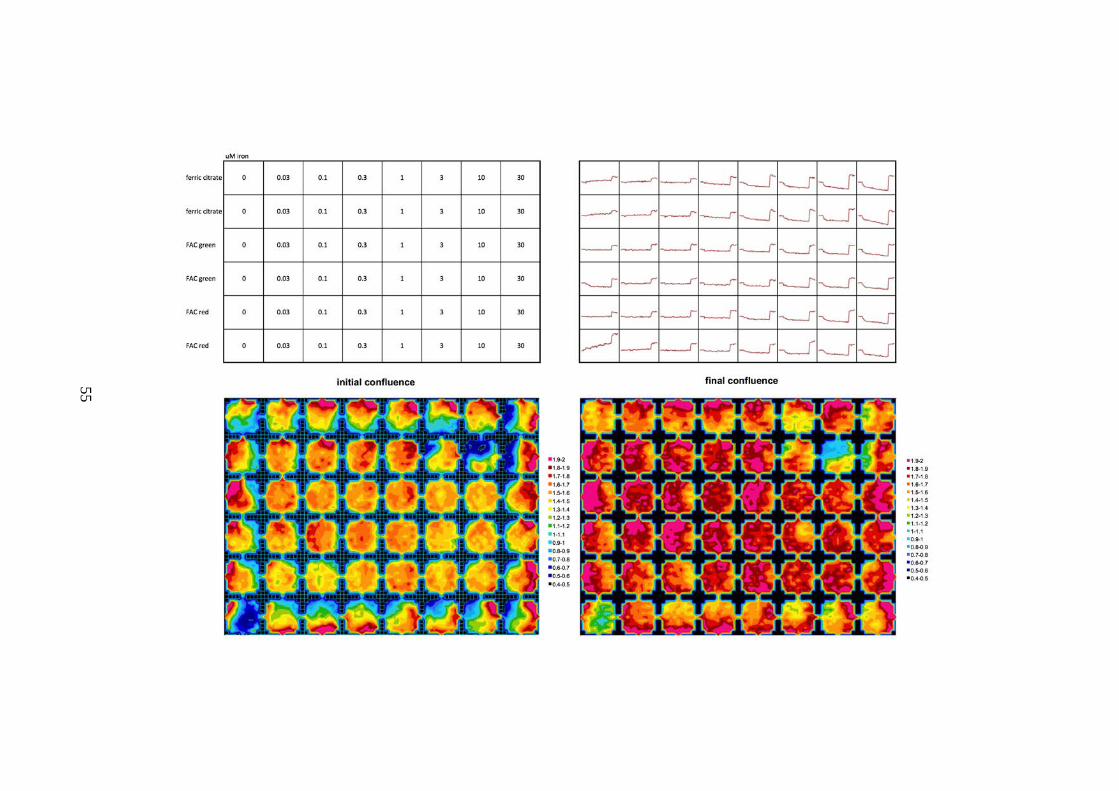
55
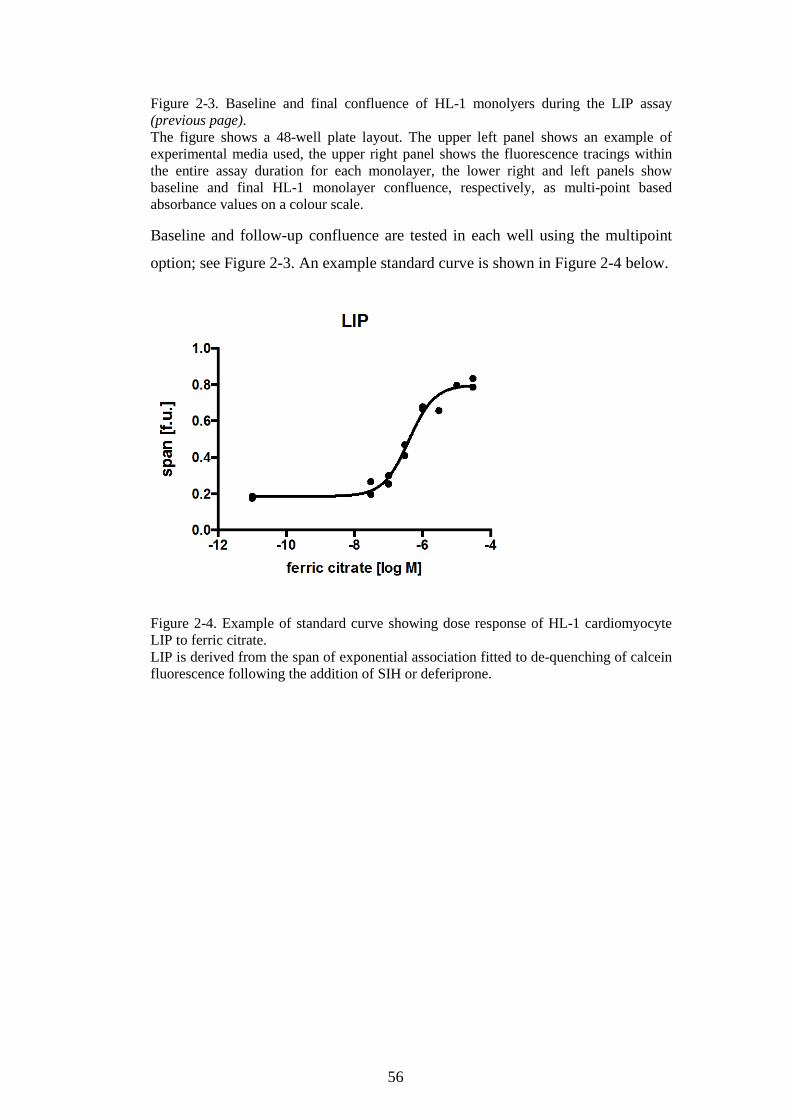
56
Figure 2-3. Baseline and final confluence of HL-1 monolyers during the LIP assay (previous page). The figure shows a 48-well plate layout. The upper left panel shows an example of experimental media used, the upper right panel shows the fluorescence tracings within the entire assay duration for each monolayer, the lower right and left panels show baseline and final HL-1 monolayer confluence, respectively, as multi-point based absorbance values on a colour scale.
Baseline and follow-up confluence are tested in each well using the multipoint
option; see Figure 2-3. An example standard curve is shown in Figure 2-4 below.
Figure 2-4. Example of standard curve showing dose response of HL-1 cardiomyocyte LIP to ferric citrate. LIP is derived from the span of exponential association fitted to de-quenching of calcein fluorescence following the addition of SIH or deferiprone.
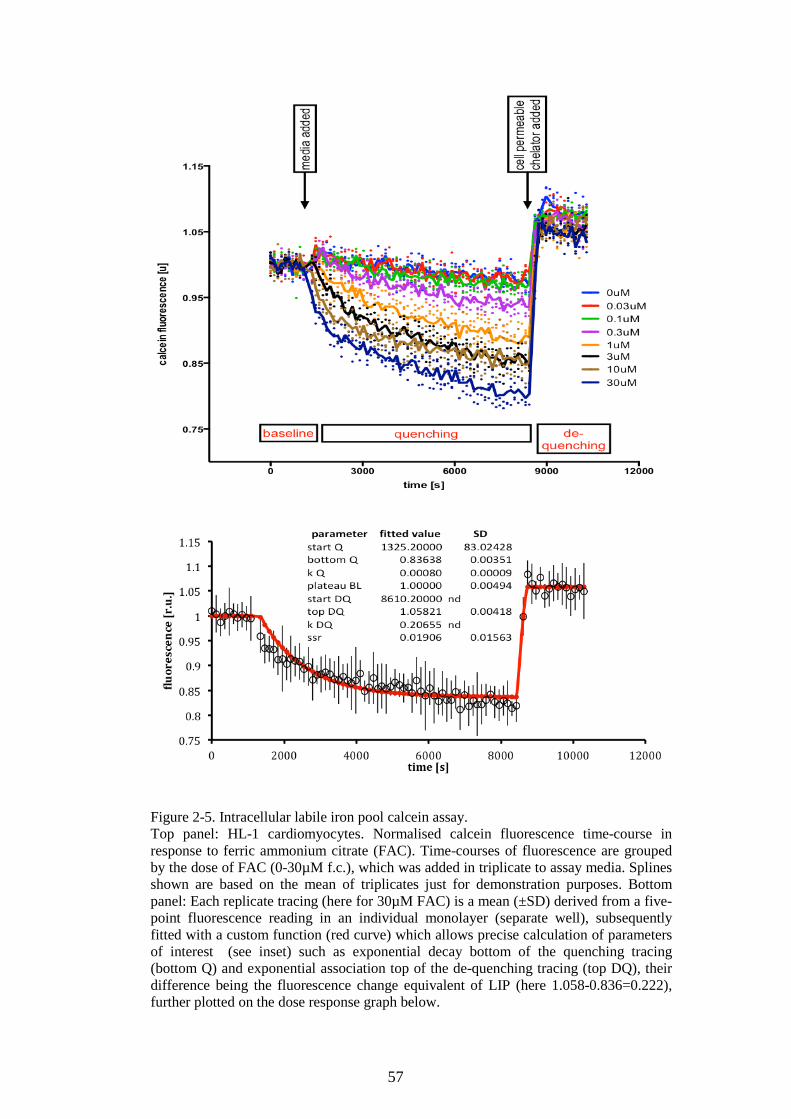
57
Figure 2-5. Intracellular labile iron pool calcein assay. Top panel: HL-1 cardiomyocytes. Normalised calcein fluorescence time-course in response to ferric ammonium citrate (FAC). Time-courses of fluorescence are grouped by the dose of FAC (0-30µM f.c.), which was added in triplicate to assay media. Splines shown are based on the mean of triplicates just for demonstration purposes. Bottom panel: Each replicate tracing (here for 30µM FAC) is a mean (±SD) derived from a five-point fluorescence reading in an individual monolayer (separate well), subsequently fitted with a custom function (red curve) which allows precise calculation of parameters of interest (see inset) such as exponential decay bottom of the quenching tracing (bottom Q) and exponential association top of the de-quenching tracing (top DQ), their difference being the fluorescence change equivalent of LIP (here 1.058-0.836=0.222), further plotted on the dose response graph below.

58
2.1.3.3 Intracellular radical oxygen species (ROS) assay
Fenton chemistry and Haber-Weiss reaction are the chemical basis of iron-
dependent oxidative stress in the cells. The generation of hydroxyl radicals from
hydrogen peroxide and superoxide is catalysed by iron and involves reduction of
ferric to ferrous iron followed by the Fenton reaction and disproportionation of
hydrogen peroxide:
Fe3+ + •O2– → Fe2++ O2
Fe2+ + H2O2 → Fe3+ + HO• + OH–
Fe3+ + H2O2 → Fe2+ + HOO• + H+
In order to measure the formation of reactive oxygen species in HL-1
cardiomyocytes we used the dichlorofluorescein assay(Brunt et al, 2009) with
significant modifications. The assay was performed using 2’,7’-dichlorofluorescin
diacetate (H2DCF-DA, Sigma), which is de-esterified intracellularly by cytosolic
esterases in live cells to 2’,7’-dichlorofluorescin, H2DCF. Both are non-fluorescent,
but whereas the substrate is a membrane-permeable non-polar compound
equilibrating across the cell membrane through passive diffusion, the product
becomes polar and therefore is trapped inside the cell in the cytosolic compartment.
H2DCF is rapidly oxidised to a strongly fluorescent 2,7-dichlorofluorescein (DCF)
by various reactive oxygen species, relatively non-specifically, but mainly by the
hydroxyl radical and the superoxide(Wang & Joseph, 1999). 9µM H2DCF-DA in
DMSO/PBS was added to the HL-1 monolayers after PBS rinse and incubated for
30 min in 48well plates at 37°C and 5% CO2 atmosphere. Following three rinses
with PBS, a 500µL PBS aliquot was added with final concentrations of experimental
media, added as 10µL of 50-fold concentrated solutions. Immediately afterwards, 0-
30µM f.c. ferric citrate solution in MOPS pH 7.4 was added. 45 fluorescence
readings followed every 2 min for a total of 90min (excitation 493nm, emission
523nm). Slopes were derived from fluorescence versus time data to represent the
intracellular ROS formation.
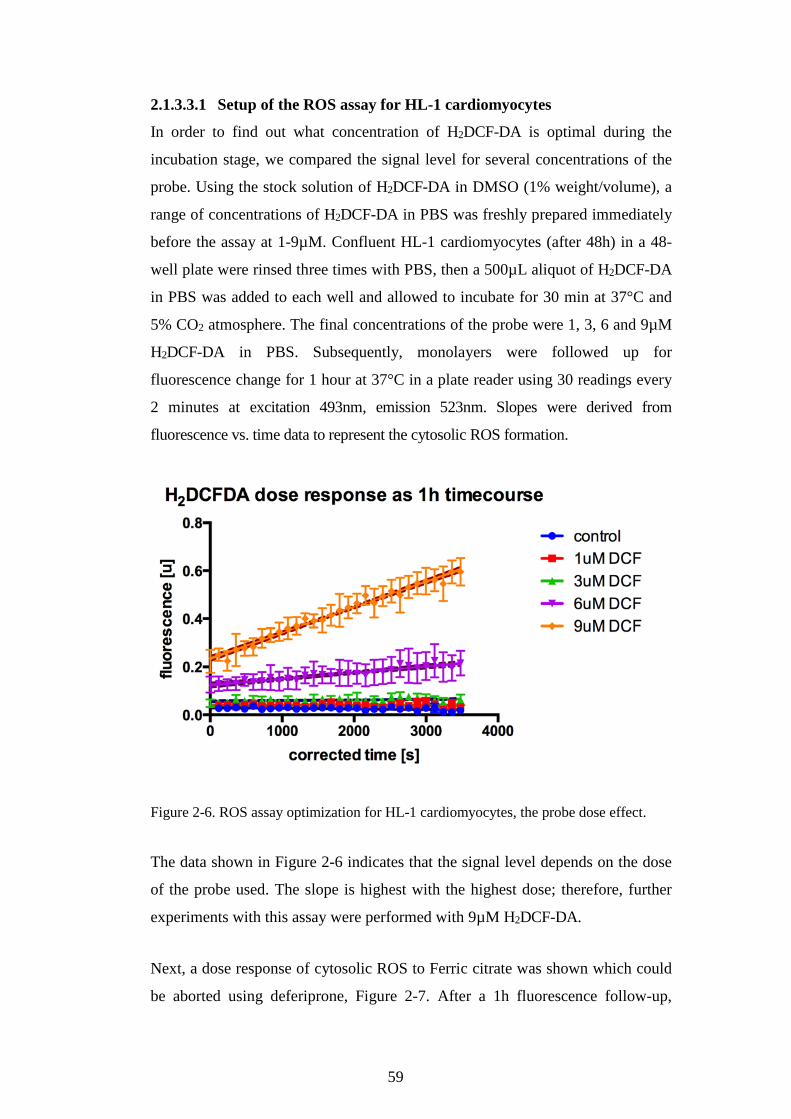
59
2.1.3.3.1 Setup of the ROS assay for HL-1 cardiomyocytes
In order to find out what concentration of H2DCF-DA is optimal during the
incubation stage, we compared the signal level for several concentrations of the
probe. Using the stock solution of H2DCF-DA in DMSO (1% weight/volume), a
range of concentrations of H2DCF-DA in PBS was freshly prepared immediately
before the assay at 1-9µM. Confluent HL-1 cardiomyocytes (after 48h) in a 48-
well plate were rinsed three times with PBS, then a 500µL aliquot of H2DCF-DA
in PBS was added to each well and allowed to incubate for 30 min at 37°C and
5% CO2 atmosphere. The final concentrations of the probe were 1, 3, 6 and 9µM
H2DCF-DA in PBS. Subsequently, monolayers were followed up for
fluorescence change for 1 hour at 37°C in a plate reader using 30 readings every
2 minutes at excitation 493nm, emission 523nm. Slopes were derived from
fluorescence vs. time data to represent the cytosolic ROS formation.
Figure 2-6. ROS assay optimization for HL-1 cardiomyocytes, the probe dose effect.
The data shown in Figure 2-6 indicates that the signal level depends on the dose
of the probe used. The slope is highest with the highest dose; therefore, further
experiments with this assay were performed with 9µM H2DCF-DA.
Next, a dose response of cytosolic ROS to Ferric citrate was shown which could
be aborted using deferiprone, Figure 2-7. After a 1h fluorescence follow-up,

60
100µM deferiprone was added to half of the wells, the others serving as control,
and the fluorescence was measured for a further 1.5h. This was done to show that
ROS change is dependent on the availability of iron in the cytosol for Fenton
reaction dependent oxidation of the probe because high affinity and high
specificity membrane-permeable iron chelator abolishes that effect. It can be
seen that the slopes for 100µM deferiprone are flattened immediately after
addition of the chelators while fluorescence continues to increase with time for
the controls. This indicates that the change in fluorescence over time reflecting
cytosolic ROS levels observed during the duration of the assay is directly related
to iron uptake from the iron source presented to the cells extracellularly.
A similar effect is observed when an extracellular chelator is added to ferric
citrate halfway in the uptake process in order to abort further uptake. In this case,
as can be seen in Figure 2-8, the slopes flatten rapidly upon addition of CP40,
suggesting that the withholding of iron in the extracellular medium by a
membrane-impermeable high affinity and high specificity chelator directly
affects oxidation rate of the probe intracellularly. Taken together, the findings in
Figure 2-7 and Figure 2-8 specifically relate the rate of change in DCF
fluorescence to the uptake of iron from the extracellular source by the HL-1
cardiomyocytes within the duration of the assay (45-90 min). Given that the
kinetics of DCF oxidation and the kinetics of the formation of ROS in the
presence of labile iron are relatively rapid and highly dependent on ferrous iron
concentration(Chan & Chu, 2003; Wang, 2008; Zepp et al, 1992), the rate of
change of fluorescence can indirectly indicate the rate of uptake of a given
species to the cell, all other things being equal.

61
Figure 2-7. ROS assay optimization for HL-1 cardiomyocytes, the effect of deferiprone. Red linear fits indicate when deferiprone was used; black linear fits indicate a rise in fluorescence in wells before deferiprone was added while whole-range curvilinear fits describe the rise in fluorescence without deferiprone. The slopes were derived from time-course data and plotted in the lower right panel.
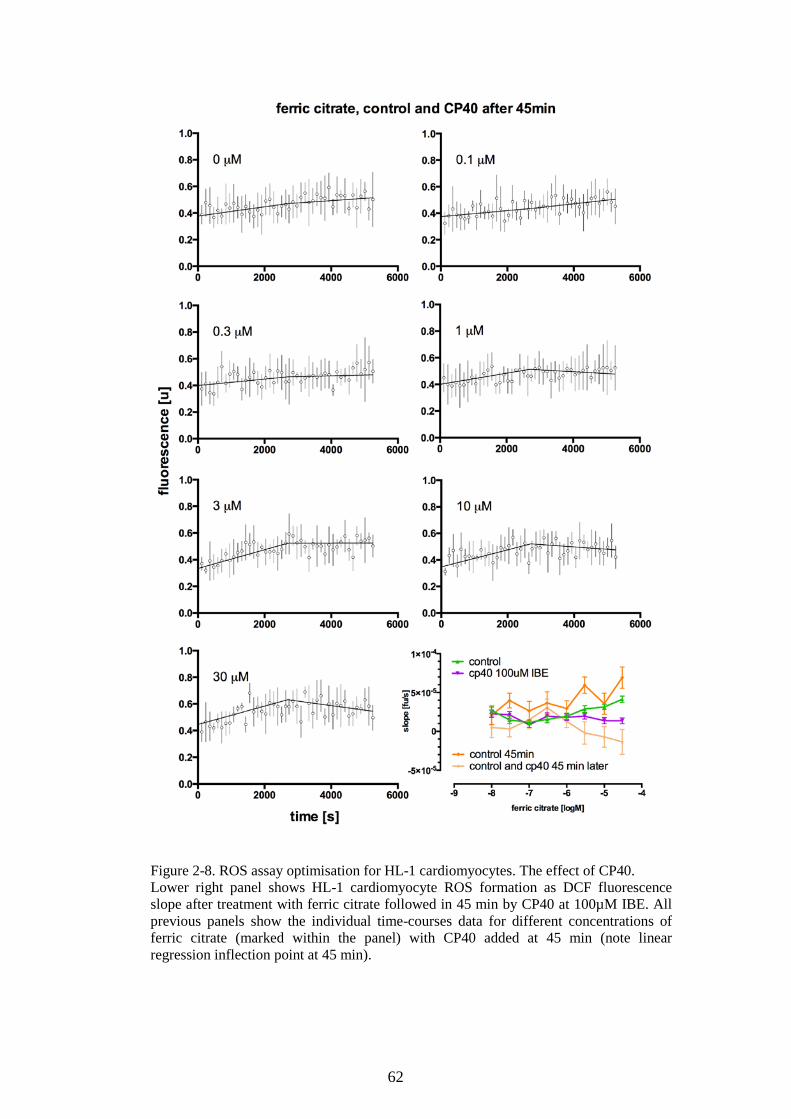
62
Figure 2-8. ROS assay optimisation for HL-1 cardiomyocytes. The effect of CP40. Lower right panel shows HL-1 cardiomyocyte ROS formation as DCF fluorescence slope after treatment with ferric citrate followed in 45 min by CP40 at 100µM IBE. All previous panels show the individual time-courses data for different concentrations of ferric citrate (marked within the panel) with CP40 added at 45 min (note linear regression inflection point at 45 min).

63
2.1.3.4 Labile plasma iron
The labile plasma iron (LPI) assay was used as first published by Esposito et al
2003(Esposito et al, 2003) but several modifications were introduced. This was
used for both serum samples and ferric citrate solutions in NTBI speciation
experiments. 24h-aged buffered solutions of ferric citrate, prepared as per Evans
et al 2008 and Silva et al 2009(Evans et al, 2008; Silva et al, 2009) were
incubated with dihydrorhodamine (DHR, Sigma-Aldrich) and 40µM L-ascorbic
acid with and without 50µM deferiprone, using Fe-NTA as standards (0-30µM).
The standards were prepared from a stock solution of 15mM Fe-NTA obtained
by mixing 400µL of 45mM ferrous ammonium sulphate (Sigma) with 800µL of
157.5mM trisodium salt of nitrilotriacetic acid (N,N-bis[Carboxymethyl]glycine,
Sigma) and left on the bench-top at room temperature for 30 minutes in ambient
air in order to allow oxidation of ferrous iron to ferric iron and complexation by
NTA, with the final ratio of iron to NTA of 1:7. The oxidation rate of DHR was
determined from the difference (in the presence or absence of deferiprone) in
regression slopes of fluorescence vs. time over 1-hour incubation at 37°C in a
Varioscan Flash plate reader (readings every 2 min, excitation 485nm emission
538nm). Unknowns were obtained by interpolation from the standard curve.
2.1.3.5 NTBI assay
NTBI was quantified using Gosriwatana method (Gosriwatana et al, 1999) with
slight modifications. Serum was obtained by phlebotomy and blood sample was
collected into special soda glass tubes (Labco Exetainer) that were determined
not to be contaminated with iron. After 30 minutes were allowed for the clot
formation and retraction, samples were centrifuged at 3000g 4°C for 10 min and
serum was decanted and frozen at -80°C in batches. On the day of the assay
centrifugal filters (Modified PES 30K, 500µL low protein binding, VWR) were
washed with 10mM NTA (200µL) and spun at 20300g for 10 min at 4°C
followed by 2 rinses with 400µL HPLC-grade water and vacuum-aspirated till
dry. Then 180µL serum was added in duplicate followed by admixture of 20µL
800mM NTA (containing 20µM Fe). This was left to equilibrate at 22°C for
exactly 30 minutes; thereafter the ultrafilters were centrifuged at 20300g for 60
min at 4°C. Clear ultrafiltrate (about 180µL) was recovered and where it was
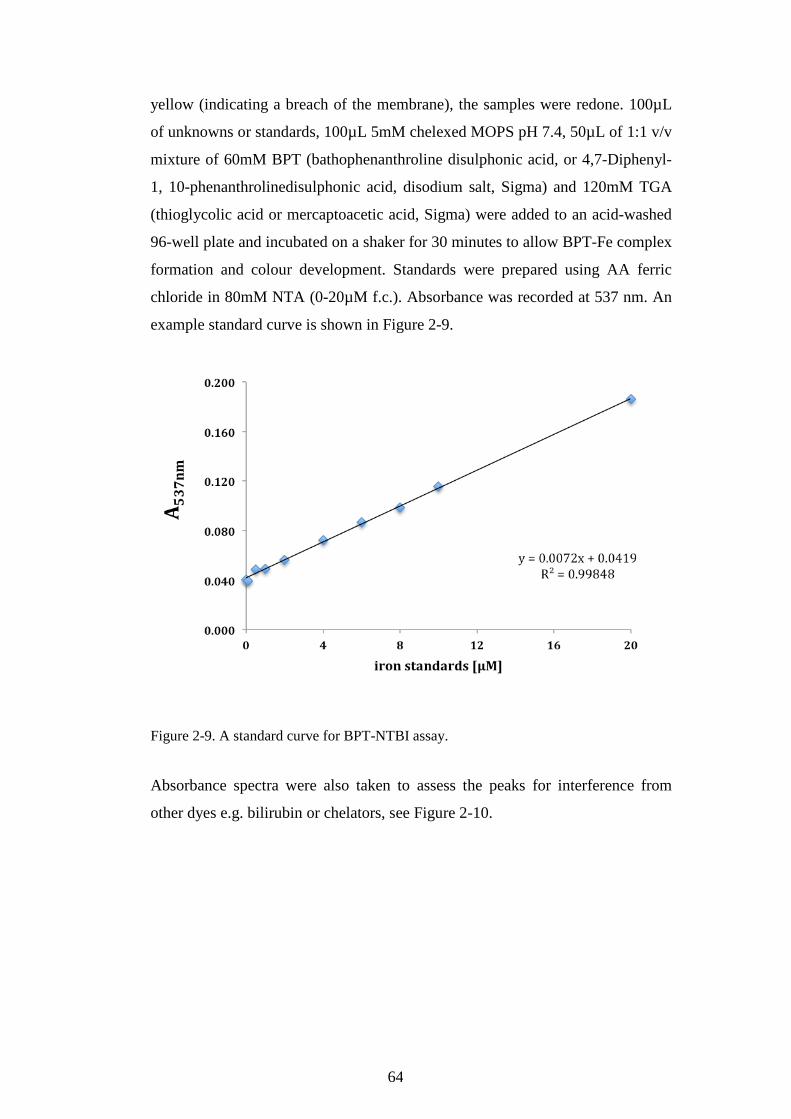
64
yellow (indicating a breach of the membrane), the samples were redone. 100µL
of unknowns or standards, 100µL 5mM chelexed MOPS pH 7.4, 50µL of 1:1 v/v
mixture of 60mM BPT (bathophenanthroline disulphonic acid, or 4,7-Diphenyl-
1, 10-phenanthrolinedisulphonic acid, disodium salt, Sigma) and 120mM TGA
(thioglycolic acid or mercaptoacetic acid, Sigma) were added to an acid-washed
96-well plate and incubated on a shaker for 30 minutes to allow BPT-Fe complex
formation and colour development. Standards were prepared using AA ferric
chloride in 80mM NTA (0-20µM f.c.). Absorbance was recorded at 537 nm. An
example standard curve is shown in Figure 2-9.
Figure 2-9. A standard curve for BPT-NTBI assay.
Absorbance spectra were also taken to assess the peaks for interference from
other dyes e.g. bilirubin or chelators, see Figure 2-10.
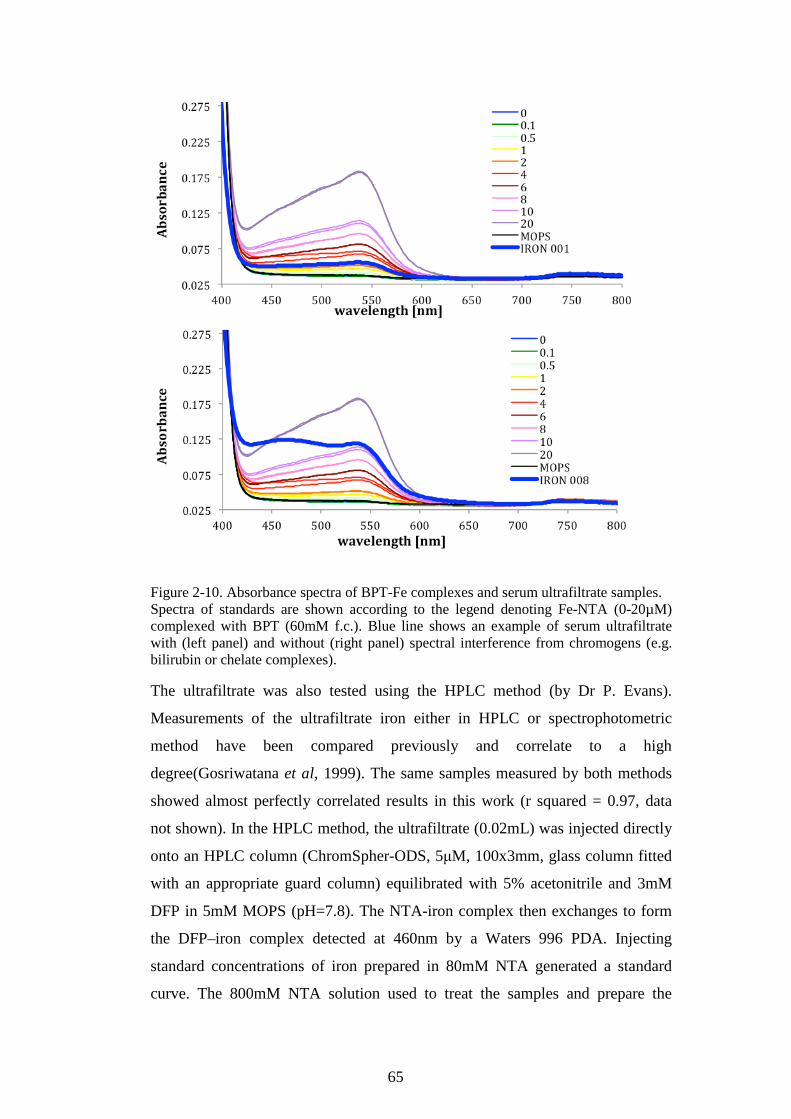
65
Figure 2-10. Absorbance spectra of BPT-Fe complexes and serum ultrafiltrate samples. Spectra of standards are shown according to the legend denoting Fe-NTA (0-20µM) complexed with BPT (60mM f.c.). Blue line shows an example of serum ultrafiltrate with (left panel) and without (right panel) spectral interference from chromogens (e.g. bilirubin or chelate complexes).
The ultrafiltrate was also tested using the HPLC method (by Dr P. Evans).
Measurements of the ultrafiltrate iron either in HPLC or spectrophotometric
method have been compared previously and correlate to a high
degree(Gosriwatana et al, 1999). The same samples measured by both methods
showed almost perfectly correlated results in this work (r squared = 0.97, data
not shown). In the HPLC method, the ultrafiltrate (0.02mL) was injected directly
onto an HPLC column (ChromSpher-ODS, 5μM, 100x3mm, glass column fitted
with an appropriate guard column) equilibrated with 5% acetonitrile and 3mM
DFP in 5mM MOPS (pH=7.8). The NTA-iron complex then exchanges to form
the DFP–iron complex detected at 460nm by a Waters 996 PDA. Injecting
standard concentrations of iron prepared in 80mM NTA generated a standard
curve. The 800mM NTA solution used to treat the samples and prepare the
66
standards is treated with 2μM iron to normalise the background iron that
contaminates reagents. This means that the zero standard gives a positive signal
since it contains the added background iron as an NTA–complex. When
unsaturated transferrin is present in sera, this additional background iron can be
donated to vacant transferrin sites resulting in a loss of the background signal and
yielding a negative NTBI value.
2.1.3.6 Bead-NTBI assay
The assay utilised a novel custom-made hexadentate chelator CP851 linked with
fluorescein moiety and covalently attached to beads(Ma et al, 2014b). Upon
binding of iron by the CP851 part, the intensity fluorescence of fluorescein is
dimmed, for a given population of beads; the reduction in specific fluorescence
intensity is dependent on the concentration of iron in the solution. This assay
measures directly chelatable iron (DCI) over the course of 24h (incubation
period) and does not remove iron from transferrin, unlike the NTA-based
ultrafiltration methods. An acid-washed 96-well plate was prepared; 20µL of
serum or standards were aliquoted, 180µL of chelexed 50mM MOPS pH 7.4
with 100µL beads (2x10^8/mL) in 35.9mL of the buffer. This was left on a plate
shaker for 24 h protected from light to incubate. Next day the plate was analysed
using BD Accuri Flow-cytometer with gates built on forward-scatter area vs.
side-scatter area plots, forward-scatter height vs. forward-scatter area and side-
scatter height vs. width to identify doublets, fluorescence channel 3 vs. channel 1
to identify auto-fluorescence in other channels, and finally on fluorescence
channel 1 histogram, which identifies the fluorescein specific signal (excitation
488nm and emission 530nm), the median of which was taken to represent an
average fluorescence per replicate, as explained in Figure 2-12. Standard curve
was produced in triplicate, with the example shown in Figure 2-11. Standards
were prepared in 1:2.5 ratio of iron to NTA using AA ferric chloride standards.
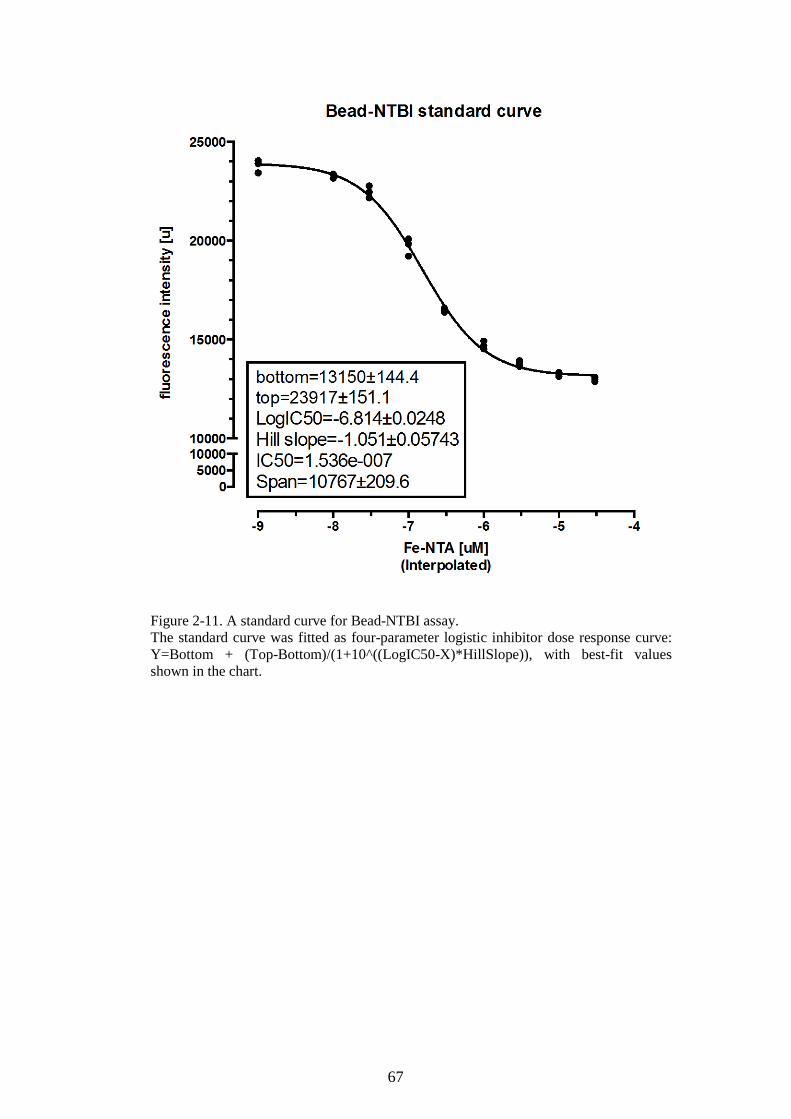
67
Figure 2-11. A standard curve for Bead-NTBI assay. The standard curve was fitted as four-parameter logistic inhibitor dose response curve: Y=Bottom + (Top-Bottom)/(1+10^((LogIC50-X)*HillSlope)), with best-fit values shown in the chart.
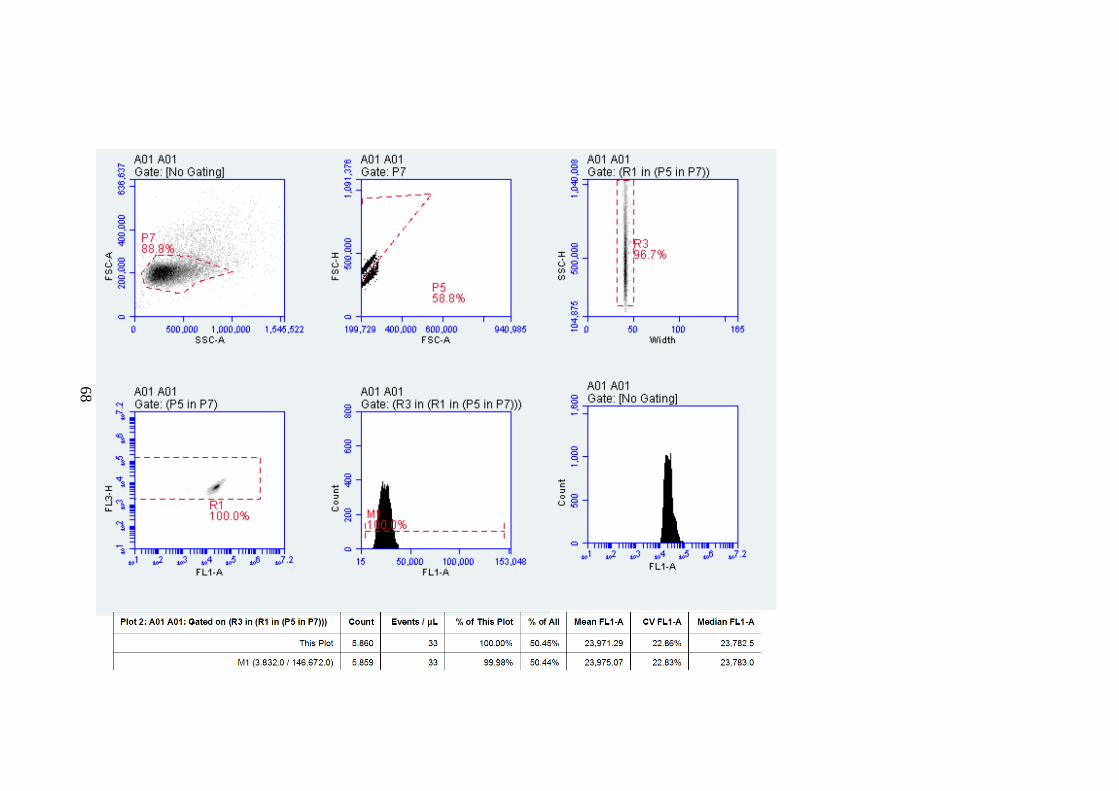
68
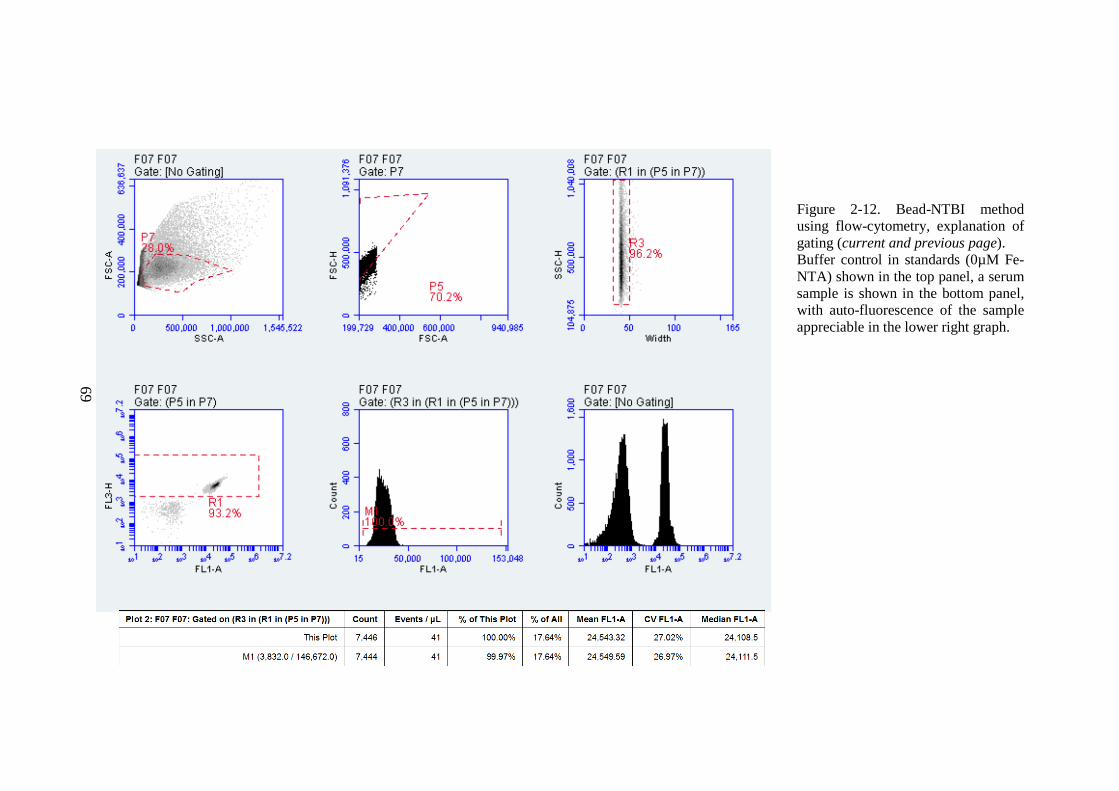
69
Figure 2-12. Bead-NTBI method using flow-cytometry, explanation of gating (current and previous page). Buffer control in standards (0µM Fe-NTA) shown in the top panel, a serum sample is shown in the bottom panel, with auto-fluorescence of the sample appreciable in the lower right graph.

70
2.1.3.7 Cellular ferritin- using ferritin H/L ELISA
HL-1 cellular monolayers were lysed using a non-denaturing lysis buffer
prepared from 20mM TRIS-HCl pH=8, 137mM NaCl, 10% glycerol, 1% Triton
X-100 and 2mM EDTA. Protease inhibitors cOmplete™ ULTRA Mini (Roche)
were added at 1 tab per 10mL. Washed monolayers of HL-1 were treated with
100µL lysate per well in a 48 well plate for 2h on a plate shaker. Bovine serum
albumin was dissolved in the same lysis buffer as used with the monolayers to
provide protein standards for protein quantification in the lysate. Abnova mouse
Ferritin ELISA kit was used (KA1941) and the assay was performed according to
manufacturer’s specification. Protein content was quantified using Bio-Rad Dc
Protein Assay, as per manufacturer’s instructions. Typical standard curves are
shown in Figure 2-13.
Figure 2-13. Standard curves for mouse ferritin ELISA assay and BioRad Dc Protein Assay. Both curves were fitted by 4-parameter logistic agonist dose-response function.
2.1.3.8 Development of K562 based iron extraction system for co-culture with
HL-1 cells.
The purpose of these experiments was to develop a cellular based system of
transferrin desaturation, which in the presence of HL-1 cardiomyocytes could
produce sufficient amount of apotransferrin to model the in vivo effect of bone
marrow uptake of transferrin and thus help explain the mechanism behind the
association of soluble transferrin receptors with cardiac iron.
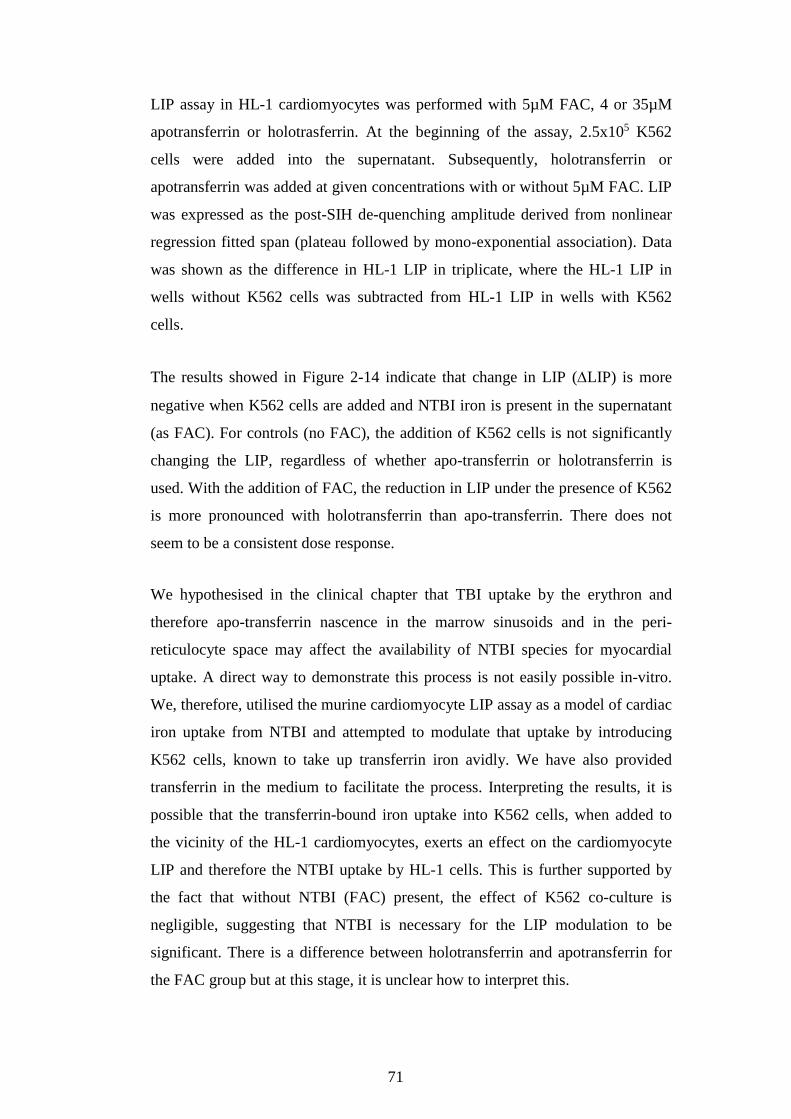
71
LIP assay in HL-1 cardiomyocytes was performed with 5µM FAC, 4 or 35µM
apotransferrin or holotrasferrin. At the beginning of the assay, 2.5x10⁵ K562
cells were added into the supernatant. Subsequently, holotransferrin or
apotransferrin was added at given concentrations with or without 5µM FAC. LIP
was expressed as the post-SIH de-quenching amplitude derived from nonlinear
regression fitted span (plateau followed by mono-exponential association). Data
was shown as the difference in HL-1 LIP in triplicate, where the HL-1 LIP in
wells without K562 cells was subtracted from HL-1 LIP in wells with K562
cells.
The results showed in Figure 2-14 indicate that change in LIP (∆LIP) is more
negative when K562 cells are added and NTBI iron is present in the supernatant
(as FAC). For controls (no FAC), the addition of K562 cells is not significantly
changing the LIP, regardless of whether apo-transferrin or holotransferrin is
used. With the addition of FAC, the reduction in LIP under the presence of K562
is more pronounced with holotransferrin than apo-transferrin. There does not
seem to be a consistent dose response.
We hypothesised in the clinical chapter that TBI uptake by the erythron and
therefore apo-transferrin nascence in the marrow sinusoids and in the peri-
reticulocyte space may affect the availability of NTBI species for myocardial
uptake. A direct way to demonstrate this process is not easily possible in-vitro.
We, therefore, utilised the murine cardiomyocyte LIP assay as a model of cardiac
iron uptake from NTBI and attempted to modulate that uptake by introducing
K562 cells, known to take up transferrin iron avidly. We have also provided
transferrin in the medium to facilitate the process. Interpreting the results, it is
possible that the transferrin-bound iron uptake into K562 cells, when added to
the vicinity of the HL-1 cardiomyocytes, exerts an effect on the cardiomyocyte
LIP and therefore the NTBI uptake by HL-1 cells. This is further supported by
the fact that without NTBI (FAC) present, the effect of K562 co-culture is
negligible, suggesting that NTBI is necessary for the LIP modulation to be
significant. There is a difference between holotransferrin and apotransferrin for
the FAC group but at this stage, it is unclear how to interpret this.
72
Figure 2-14. K562 cells affect LIP in HL-1 cardiomyocytes. Change in LIP of HL-1 cardiomyocytes following the addition of FAC and K562 cells at 2.5x10⁵/well.
In preparation for subsequent experiments we attempted to increase the TBI
uptake rate in the K562 cells using differentiating agents such as hydroxyurea, 1-
β-D-arabino-furanosyl-cytosine (ara-C), haemin, and sodium butyrate, singly or
in comparison, in an effort to obtain a K562 cell population which has the
greatest potential to take up TBI and thus reduce cardiomyocyte LIP the most.
The differentiating agents were first tested on K562 cells only to establish which
combination was optimally inducing the cells to haemoglobinise most efficiently
and therefore also remove iron from the supernatant to the highest degree. K562
cells were plated at 5x10⁵/well in a 24-well plate in 2mL RPMI with 10% FCS,
penicillin and gentamycin. On the 5th day from plating cells were incubated in
four conditions: control (medium only), 50µM haemin, 600µM sodium butyrate
or 100nM ara-C, with or without 0, 100, 200, or 400µM hydroxyurea. Media was
replaced with exactly the same concentration of differentiating agent
combinations every 24 hours for a total of 4 days. Afterwards, 1mL of
supernatant aliquots was transferred to a 24-well plate, wherefrom 750µL was
transferred to 1.5mL Eppendorf tubes to be treated with 750µL aqua regia at
73
70°C for 24h on an Eppendorf tube heater till complete evaporation was
achieved. The residue was dissolved in 300µL of 10mM HCl and a standard
curve was prepared from atomic absorption standard of FeCl3. Both the
unknowns and the standards were assayed using ferrozine assay. Remaining
supernatant was vacuumed off and cells were treated with RIPA buffer in a total
volume of 500µL, left on a shaker overnight. Haemoglobin was measured in
lysates using spectrophotometry against a standard curve from human
haemoglobin (Sigma) at 410 nm.
The results indicate that additional haemoglobin production may be induced
using the known differentiating agents such as hydroxyurea (100-400µM), ara-C
(100nM), butyrate sodium (600µM) or haemin (50µM). We have measured the
total iron concentration in the supernatant from K562 cell suspension and the
amount of haemoglobin in the cell lysate. This represents the capacity for iron
consumption from the supernatant for haem synthesis, a prerequisite for
haemoglobin formation (typically HbF in this case). It is apparent that haemin is
the best inducer of haemoglobin synthesis in K562 cells and shows some
synergism with hydroxyurea. However ara-C and sodium butyrate at 100µM
hydroxyurea also show synergistic increase in supernatant iron consumption, see
Figure 2-15. Therefore, optimal concentration seems to be 100µM hydroxyurea,
50µM haemin, sodium butyrate at 600µM and ara-C at 100nM for subsequent
incubations of K562 cells. This combination also increases haemoglobin
production in the K562 cells overall, see Figure 2-16.
We have obtained a suitable K562 cell population for future co-culture
experiments with HL-1 cardiomyocytes, which are predicted to enhance the
effect of the un-induced K562 cells on HL-1 LIP, seen in Figure 2-14. If we
accept the assumption that K562 cells are a model of the erythroid compartment
in vivo by virtue of their capacity to take up TBI and synthesise haemoglobin,
then increasing their amount or their haemoglobinising (and hence iron
consumption) potential may mimic the expansion of the erythron in thalassaemia.
We have shown that inclusion of K562 cells in our HL-1 LIP assay decreases the
NTBI uptake into cardiomyocytes as seen in the decrease of LIP. We predict that

74
increasing the haemoglobin synthesis in K562 cells co-cultured with HL-1
cardiomyocytes during the LIP assay would further decrease that NTBI uptake.
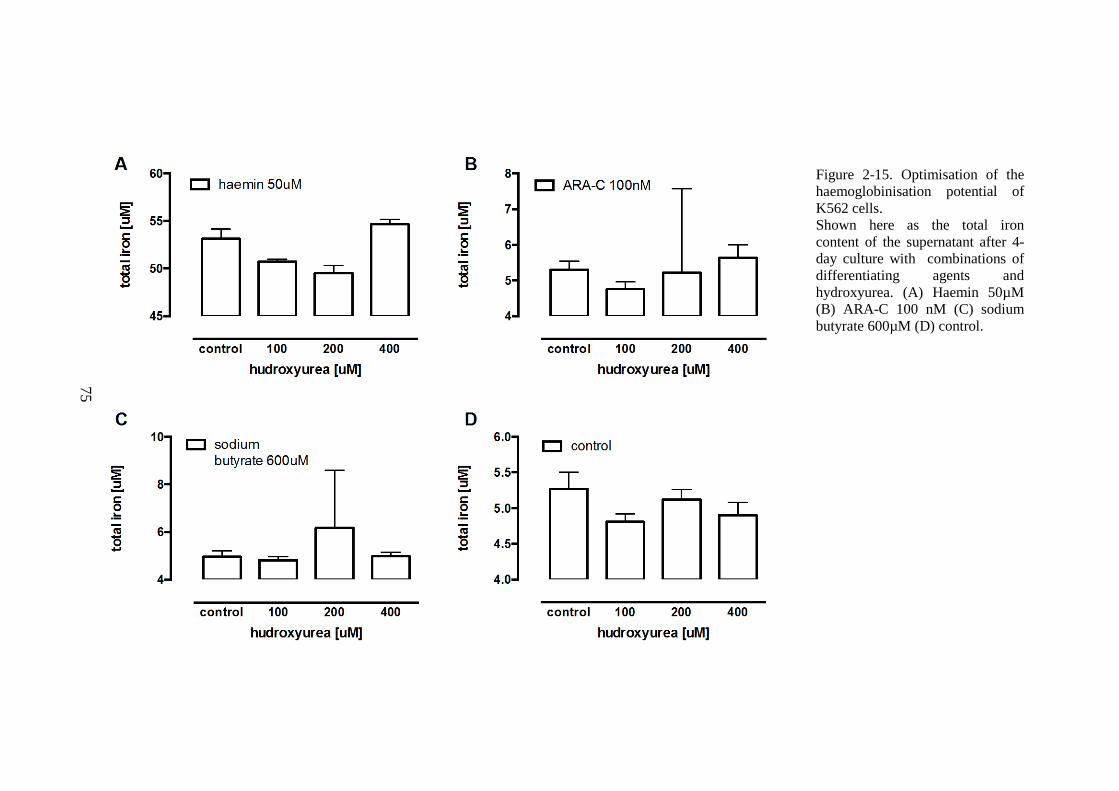
75
Figure 2-15. Optimisation of the haemoglobinisation potential of K562 cells. Shown here as the total iron content of the supernatant after 4-day culture with combinations of differentiating agents and hydroxyurea. (A) Haemin 50µM (B) ARA-C 100 nM (C) sodium butyrate 600µM (D) control.
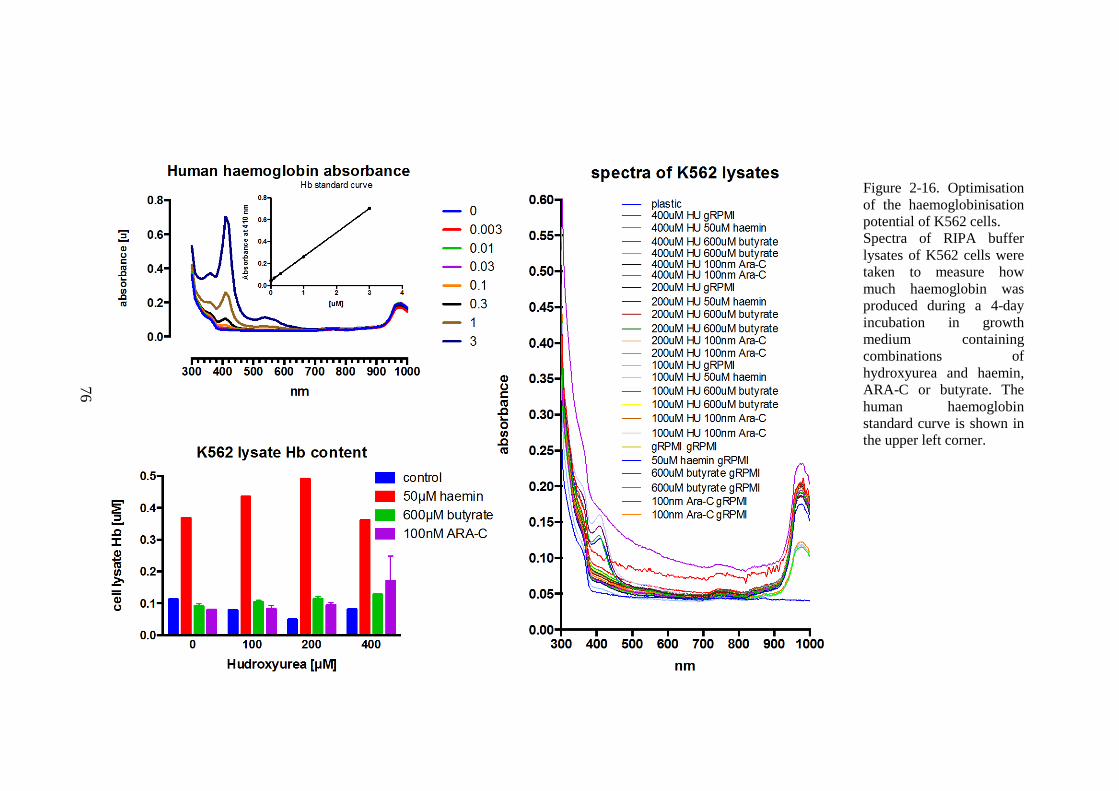
76
Figure 2-16. Optimisation of the haemoglobinisation potential of K562 cells. Spectra of RIPA buffer lysates of K562 cells were taken to measure how much haemoglobin was produced during a 4-day incubation in growth medium containing combinations of hydroxyurea and haemin, ARA-C or butyrate. The human haemoglobin standard curve is shown in the upper left corner.

77
2.2 Research questions and hypotheses
The work in this thesis will aim to clarify the mechanisms responsible for
variability in extra-hepatic iron distribution, both between different forms of iron
overload and within a given diagnosis, such as TDT. This will be achieved by
both clinical and in vitro studies.
2.2.1 Clinical questions and hypotheses
The objective of the work is to understand the factors that determine myocardial
iron accumulation in iron-overloaded patients at UCLH and Whittington
Hospitals (Red Cell Disorders Unit).
It is hypothesised that one or more of the following may affect the propensity to
myocardial iron deposition in transfusional siderosis;
Factors obtainable from the clinical database:
Table 2-1: Potential predictors of cardiac iron. Factors obtainable from the clinical database.
Level of body iron load (as measured by LIC)
Control of body iron load (ferritin or LIC trend)
Rate of transfusional iron loading
Modality and quality of (adherence to) chelation therapy
Effect of nutritional factors (vitamin C and D)
Indirect measures of erythron expansion
Factors requiring additional clinical blood sampling:
Table 2-2: Potential predictors of myocardial iron. Factors requiring additional clinical blood sampling
Levels of markers of anaemia, (erythropoietin - in addition to haemoglobin which is routinely available)

78
Levels of markers of erythroid expansion (sTfR and GDF15)
Level and speciation of plasma NTBI
Levels of modulators of iron homoeostasis (plasma hepcidin)
Levels of markers of (intravascular) haemolysis
2.2.2 In vitro questions and hypotheses;
In principle, the relative tendencies of different patients to accumulate
myocardial iron may result from differences in uptake and/or retention of iron by
cardiomyocytes. This is turn may result from the concentration and nature of
NTBI presented to cardiomyocytes or from other factors that modulate uptake
and retention of iron.
2.2.2.1 Net retention of iron in cardiomyocytes may result from:
a) Iron uptake without concomitant iron exit, or with delayed iron exit. It follows that iron will be sequestered in cardiomyocytes.
b) Iron uptake with iron exit, but where iron uptake rate > iron exit rate (concomitant)
c) Iron uptake rate = iron exit rate but exit is significantly delayed after entry
2.2.2.2 Particular hypotheses that will be explored in vitro are;
2.2.2.2.1 Iron uptake by cardiomyocytes is dependent on;
a) The concentration of plasma NTBI or its subspecies (taken from patients with TIO)
b) Certain conditions (such as apotransferrin) may modulate the level of NTBI or its subspecies and thus the uptake of iron from NTBI into cardiomyocytes
2.2.2.2.2 Iron retention by cardiomyocytes is influenced by;
a) Systemic hepcidin levels and thus expression of cardiomyocyte ferroportin
79
Chapter 3 Factors associated with myocardial haemosiderosis in TDT
In this chapter, it is shown how a range of routine clinical, patient history and
experimental laboratory factors relate to myocardial iron. The relationships
examined are first with myocardial iron trends in a longitudinal design and later
with absolute levels of cardiac iron in cross-sectional analyses.
Clinical studies will relate the levels and trends in hepatic and extra-hepatic iron,
using MRI scans of liver and heart, to clinical and biochemical (plasma)
variables.
3.1 Patients and Methods
The variables affecting hepatic and extra-hepatic iron as determined by MRI
were studied in patients with TM, TI, and SCD from among those attending the
Red Cell Disorders clinics at UCLH or Whittington hospitals. MRI scans of heart
and liver have been undertaken for over a decade in these patients, allowing for a
retrospective analysis of the relationship between liver iron, and heart iron. The
existing clinical databases in the department were updated, in order to address
the hypotheses relating to the propensity to develop myocardial iron loading
longitudinally. Analysis of cross-sectional data will involve descriptive and
inferential statistics in both data- and hypothesis-driven approach.
3.1.1 Clinical variables
Clinical or patient history variables were collected from clinical records
including the underlying diagnosis, the age of onset of transfusion dependency,
duration of transfusion dependency, the age of onset of chelation therapy
including adherence, presence or absence of splenectomy. Transfusional iron
loading rate was calculated for the period between relevant MRI scans included
in the analyses below. It was calculated using the heamatocrit of packed red
blood cell units, as provided by the local blood bank, or when that was
unavailable, an average unit was assumed to contain 200mg of iron.
80
3.1.2 Tissue iron levels and their determination
In order to estimate the liver and heart iron, patients routinely undergo annual or
more frequent MRI scans. In magnetic resonance imaging, the so-called MR
relaxivities are used to derive tissue iron content in particular organs. Organ-
specific calibrations are employed to represent the results in mg of iron per gram
dry weight of tissue such as e.g. liver iron concentration/content
(LIC)(Garbowski et al, 2014) or cardiac iron content (CIC)(Carpenter et al,
2011). Tissue iron is stored in tissue ferritin and its breakdown product
haemosiderin, both of which are paramagnetic. This means that in a strong
magnetic field they may be magnetized, and an MR image of such tissue darkens
more quickly(Wood, 2014) (i.e. darkens with increasing echo time). The time it
takes for that image to darken can be quantified using half-life, and image
intensity is fitted with exponential decay. T2 is the half-life of spin-echo image
while T2* is a half-life of the gradient-echo image. The half-life of the image
darkening shortens with increasing tissue iron. Half-lives are interchangeable
with rates of signal decay (relaxivities or relaxation rates), such that R2=1000/T2
and R2*=1000/T2*. Typically in literature, MR relaxivity of particular organs is
provided in relaxivity units: ms for T2* or s-1 for R2*, with the former relating
reciprocally to tissue iron and the latter – linearly. R2 relaxivity (Ferriscan) is
also represented in s-1 or calibrated as LIC, but its relationship to LIC is
curvilinear(Pierre et al, 2005). These are global measures of tissue iron, not
compartment-specific. Serum ferritin is used as a marker of macrophage storage
iron but is confounded by hepatocyte ferritin released to the circulation when
LIC reaches high levels.
3.1.3 Blood variables analysed.
For blood markers of anaemia, haemoglobin (UCLH routine lab), (pre-
transfusion and mean) and serum erythropoietin (ELISA, Porter lab) were used,
for plasma markers of iron storage - serum ferritin (UCLH routine lab), for
plasma markers of iron transport/iron overload: transferrin saturation (urea gel
electrophoresis method(Evans & Williams, 1980), Porter lab), NTBI after Singh
et al 1990(Singh et al, 1990), Porter lab), labile plasma iron (LPI, after Esposito
et al 2003(Esposito et al, 2003), Porter lab) and total serum iron (UCLH routine
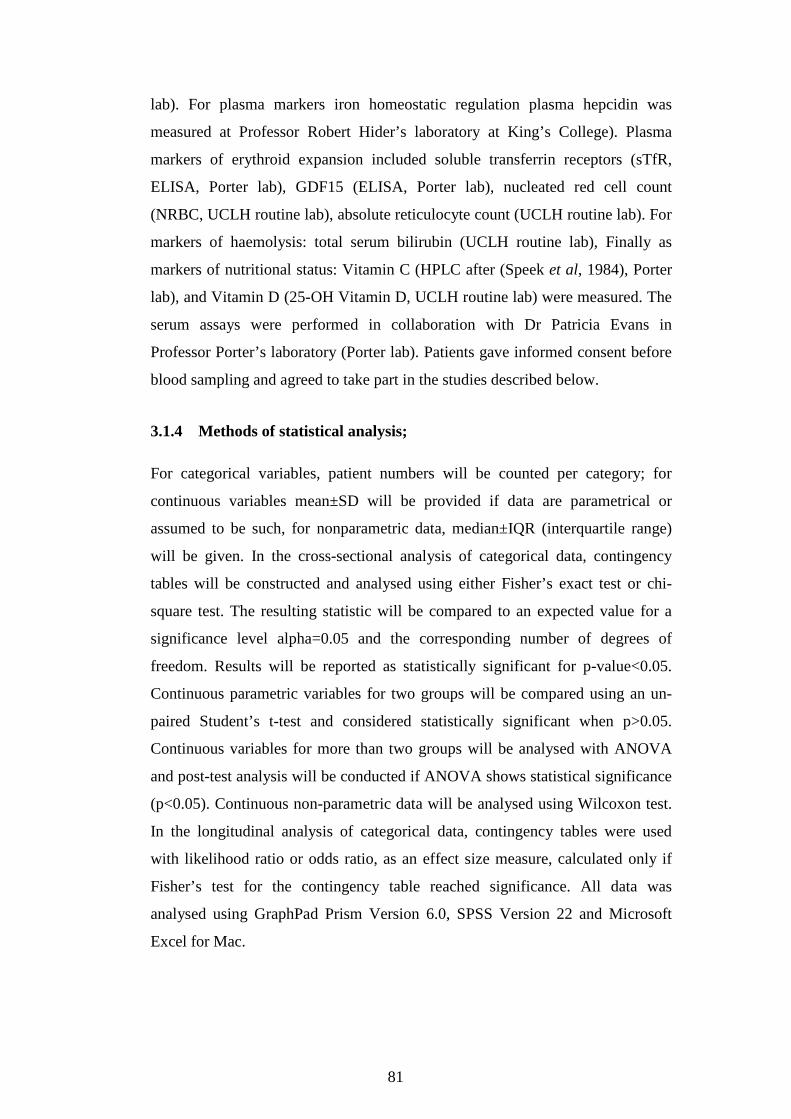
81
lab). For plasma markers iron homeostatic regulation plasma hepcidin was
measured at Professor Robert Hider’s laboratory at King’s College). Plasma
markers of erythroid expansion included soluble transferrin receptors (sTfR,
ELISA, Porter lab), GDF15 (ELISA, Porter lab), nucleated red cell count
(NRBC, UCLH routine lab), absolute reticulocyte count (UCLH routine lab). For
markers of haemolysis: total serum bilirubin (UCLH routine lab), Finally as
markers of nutritional status: Vitamin C (HPLC after (Speek et al, 1984), Porter
lab), and Vitamin D (25-OH Vitamin D, UCLH routine lab) were measured. The
serum assays were performed in collaboration with Dr Patricia Evans in
Professor Porter’s laboratory (Porter lab). Patients gave informed consent before
blood sampling and agreed to take part in the studies described below.
3.1.4 Methods of statistical analysis;
For categorical variables, patient numbers will be counted per category; for
continuous variables mean±SD will be provided if data are parametrical or
assumed to be such, for nonparametric data, median±IQR (interquartile range)
will be given. In the cross-sectional analysis of categorical data, contingency
tables will be constructed and analysed using either Fisher’s exact test or chi-
square test. The resulting statistic will be compared to an expected value for a
significance level alpha=0.05 and the corresponding number of degrees of
freedom. Results will be reported as statistically significant for p-value<0.05.
Continuous parametric variables for two groups will be compared using an un-
paired Student’s t-test and considered statistically significant when p>0.05.
Continuous variables for more than two groups will be analysed with ANOVA
and post-test analysis will be conducted if ANOVA shows statistical significance
(p<0.05). Continuous non-parametric data will be analysed using Wilcoxon test.
In the longitudinal analysis of categorical data, contingency tables were used
with likelihood ratio or odds ratio, as an effect size measure, calculated only if
Fisher’s test for the contingency table reached significance. All data was
analysed using GraphPad Prism Version 6.0, SPSS Version 22 and Microsoft
Excel for Mac.

82
3.2 Longitudinal Analyses of factors associated with MH
3.2.1 Description, and prevalence of myocardial iron overload in the patient population.
As part of a clinical audit, a longitudinal 10-year cohort follow-up of myocardial
iron in 109 β-Thalassaemia Major patients looked after at UCLH and the
Whittington Hospital has been analysed in collaboration with Dr Alison Thomas
at UCLH. We have shown a significantly lower proportion of patients with
cardiac haemosiderosis in 2010 in comparison with 1999-2000 (60% cardiac
T2*<20ms, 17% <10ms vs. 23% and 7% respectively, p<0.001). Of the 8 deaths,
none was directly due to MH although in two patients myocardial iron was still
detectable in the heart. This is a considerable improvement compared with
previous similar reports in terms of mortality index(Modell et al, 2008). Overall
improvement notwithstanding, a subgroup of patients who switched chelation
regimen more than 3 times in the follow-up period were found to have a further
increase of myocardial iron. All other patients have, on average, improved or
normalised their cardiac iron regardless of chelation modality involved. This
suggests that frequent change of chelation may retrospectively identify generally
poorly compliant patients who do badly irrespective of chelation
regimen(Thomas et al, 2010).
3.2.2 Clinical variables affecting myocardial iron trends in patients
Although it is clear from the above that the proportion of patients with TM and
myocardial iron in some centres is decreasing with time and that deaths from
myocardial iron are falling in parallel, it is important to understand the variables
that contribute to this improvement or the lack of it in individual cases. We begin
with the description of factors that associate with changes in the heart iron rather
than its absolute value.
3.2.2.1 The role of liver iron concentration and ferritin on myocardial iron
trends.
Liver iron concentration is known to be a risk factor for MH. Several LIC
thresholds have been published which identify patients at such risk e.g. 15 mg/g

83
dry weight(Brittenham et al, 1994). UCLH has an extensive 10 year follow-up
data of MRI results on approximately 200 iron overloaded patients with the
majority of liver iron data derived from hepatic T2*. In order to define a
threshold liver iron concentration which identifies patients at high or low risk of
MH, initially reported by us as liver R2*=165s-1(Garbowski et al, 2008), see
below, we have performed a calibration of hepatic T2* based on LIC by liver
biopsy(Garbowski et al, 2009a, 2014). This calibration identifies liver iron levels
to be approximately 2.3-fold higher than those originally published(Anderson et
al, 2001) and comparable to other available methods(Pierre et al, 2005; Wood et
al, 2005; Hankins et al, 2009). The 165s-1 threshold can now be expressed as
5.13mg/g dry weight using this calibration, see Figure 3-1 for reference. As part
of the work towards this Ph.D. thesis, a manuscript titled “Biopsy-based
calibration of T2* magnetic resonance for estimation of liver iron concentration
and comparison with R2 Ferriscan” was completed and published in 2014 to
JCMR(Garbowski et al, 2014).
A group of 29 transfusion dependent subjects including 23 patients with β-
Thalassaemia Major, 2 with Congenital Sideroblastic Anaemia, 2 with Diamond-
Blackfan Anaemia, and 2 with Pyruvate Kinase Deficiency Anaemia, were
followed up at UCLH as part of deferasirox registration studies(Galanello et al,
2003; Piga et al, 2008; Pennell et al, 2008; Porter et al, 2008; Cappellini et al,
2006) for a median of 3.8±1.0 years. These patients underwent yearly standard of
care cardiac MRI scans and LIC assessment using hepatic T2*, liver biopsy LIC,
as well as monthly safety and efficacy plasma parameters per study protocols. In
these patients, we have found(Garbowski et al, 2008) factors other than baseline
cardiac iron and dose of deferasirox associating with the long-term cardiac iron
response. These were LIC and ferritin control (also reported for short-term
cardiac outcomes), a statement not unfounded considering that deferasirox dose
allocation at baseline was a function of LIC and subsequent dose alterations
(increases) were mainly a function of ferritin levels.

84
Figure 3-1. The calibration of T2* and R2* models for LIC estimation. (A) The relationship of liver T2* to LIC obtained by biopsy in 50 samples. The regression fit from panel C was plotted onto the data after exponentiation: LIC = 31.94(T2*)-1.014 with 95% CI 27.8 to 36.7 (87-115%) for the first term and −1.118 to −0.91 (110-90%) for the exponent. (B) The relationship of liver R2* (=1000/T2*) to LIC of the data in panel A, with regression line from the model in panel D after exponentiation: LIC = 0.029R2*1.014; 95% CI 0.016 to 0.054 (55-186%) for the first constant, 0.910 to 1.118 (90-110%) for the exponent. (C) Log-log plot of LIC versus liver T2*: Pearson r = −0.94 (95% CI −0.97 to 0.91, p < 0.0001); linear regression: ln(LIC) = 3.464-1.014ln(T2*); slope SE = 0.052, 95% CI −1.118 to −0.9 (110-90%); intercept SE = 0.069, 95% CI 3.325 to 3.603 (96-104%), r squared 0.89. (D) Log-log plot of LIC versus liver R2*: Pearson r = 0.94 (95% CI 0.90 to 0.97, p < 0.0001); linear regression: ln(LIC) = 1.014ln(R2*)-3.54; slope SE = 0.052, 95% CI 0.910 to 1.118 (90-110%); intercept SE = 0.30, 95% CI −4.152 to −2.928 (117-83%); r squared 0.89. From (Garbowski et al, 2014)
3.2.2.2 Role of adherence to chelation therapy
In the same study as above, monthly compliance with deferasirox was assessed
by direct patient questioning during follow-up visits (from patient recall) and
represented as a percentage of the prescribed dose. Each patient’s follow-up
period between subsequent cardiac MRI scans was treated independently. The
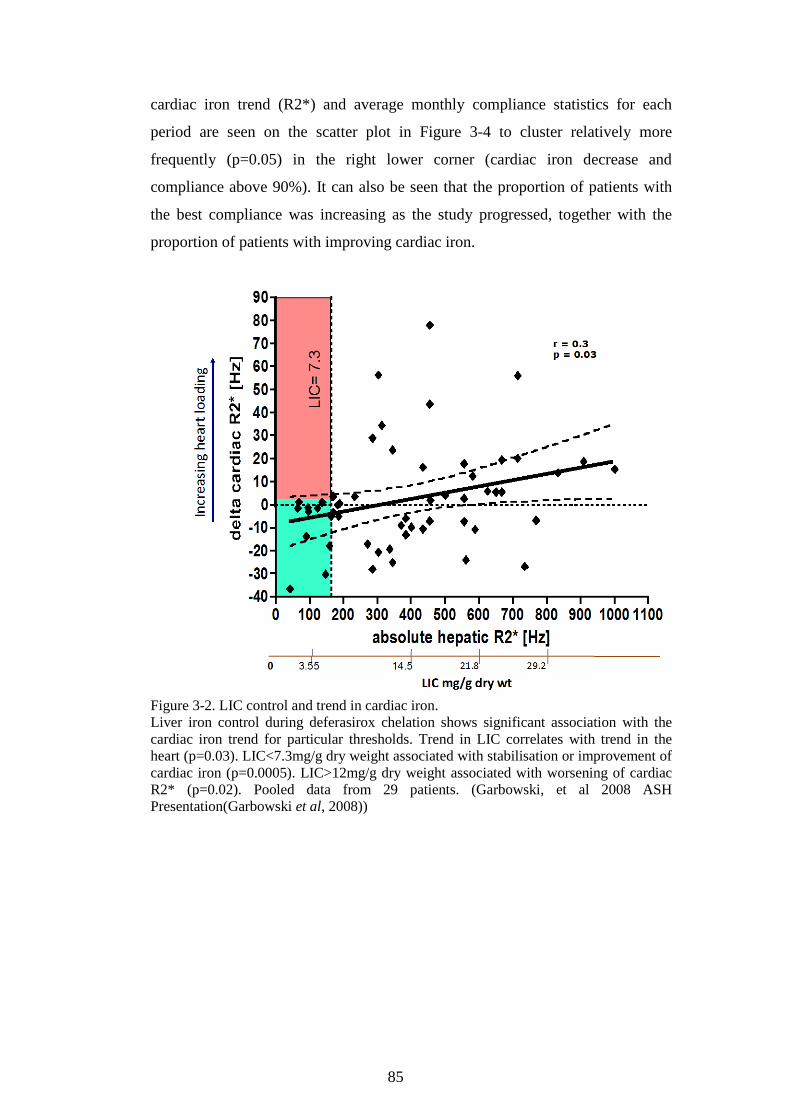
85
cardiac iron trend (R2*) and average monthly compliance statistics for each
period are seen on the scatter plot in Figure 3-4 to cluster relatively more
frequently (p=0.05) in the right lower corner (cardiac iron decrease and
compliance above 90%). It can also be seen that the proportion of patients with
the best compliance was increasing as the study progressed, together with the
proportion of patients with improving cardiac iron.
Figure 3-2. LIC control and trend in cardiac iron. Liver iron control during deferasirox chelation shows significant association with the cardiac iron trend for particular thresholds. Trend in LIC correlates with trend in the heart (p=0.03). LIC<7.3mg/g dry weight associated with stabilisation or improvement of cardiac iron (p=0.0005). LIC>12mg/g dry weight associated with worsening of cardiac R2* (p=0.02). Pooled data from 29 patients. (Garbowski, et al 2008 ASH Presentation(Garbowski et al, 2008))

86
Figure 3-3. Trend in cardiac iron relates to absolute ferritin and its trend. Serum ferritin control during deferasirox chelation shows significant association with the cardiac iron trend for particular thresholds. Pooled data from 29 patients. (Garbowski, et al 2008 ASH Presentation(Garbowski et al, 2008))
These small sample analyses have confirmed that long-term trends of cardiac
iron relate to long-term control of serum ferritin and liver iron and are related to
compliance with chelation therapy. Deferasirox half-life of approximately 17h
allows for once-daily dosing which is a sufficient protection against NTBI
generation if prescribed in relation to the ILR(Porter et al, 2009; Cohen et al,
2005), it indicates, however, based on the data presented here, that 10% doses
missed or >3 days, or three doses, per month, is probably sufficient to transiently
increase NTBI. Such intermittent increases are in principle capable to slow down
or stop the slow process of removal of cardiac iron.
87
Figure 3-4. Compliance with chelation and trend in cardiac iron. Compliance >90% less than 3 daily doses missed per month) associated with increased chance of heart iron removal (p=0.05, top panel). Compliance <90% increases each year as %T2* intervals that improve fall (bottom panel). Compliance data pooled from 29 patients and its impact on cardiac iron trend (as R2*). From (Garbowski et al, 2008).
88
3.2.2.3 Cardio-hepatic lag or hepato-cardiac drag?
Another important finding in the same group of patients as in 3.2.2.1 was the
identification of the s.c. lag between cardiac iron decrease and liver iron decrease
where the former usually follows the latter. Similar analysis was performed by
others(Noetzli et al, 2008b). On a plot of cardiac R2* vs. liver R2*, a clockwise
trajectory of serial heart and liver MRI scans is one that turns clockwise around
its centre of mass (calculated from minimum 3 serial scans for one patient). This
also implies that in such conditions cardiac iron load change usually follows that
of liver iron. Counter-clockwise trajectories imply that cardiac iron decreases
before the liver iron. Our data suggests that clock-wise trajectories are
significantly different than counter-clockwise in terms of a number of trajectories
that start in the siderotic range (cardiac R2*>50s-1), however, the complexity of
trajectories makes it often difficult to interpret whether they are clockwise or
counter-clockwise, see Figure 3-5. Therefore, we propose a new analytical
approach that – in our view – formalises the lag issue better.
In Figure 3-6, liver and cardiac iron trends on x- and y-axes show Cartesian
coordinates for radii derived from each period of observation (between two given
MRI scans) for trajectories in Figure 3-5. All radii start from (0;0). Each radius
length represents the total amount of iron moved in or out of the liver and heart
(the longer the radius, the more iron shifted). The radius inclination angle (theta,
with reference to the positive y-axis) range defines organs being loaded into: 0°
to 90°, liver AND heart; 90° to 180°, liver NOT heart; 270° to 360°, heart NOT
liver; and 180° to 270°, NOT liver NOT heart. The angle value in degrees within
those ranges reflects mutually relative amounts of iron shifted between liver and
heart. This, in essence, allows for a transformation from Cartesian (liver iron
trend, cardiac iron trend) to polar (radius, theta) coordinates. Directional statistics
can be applied to polar coordinates.
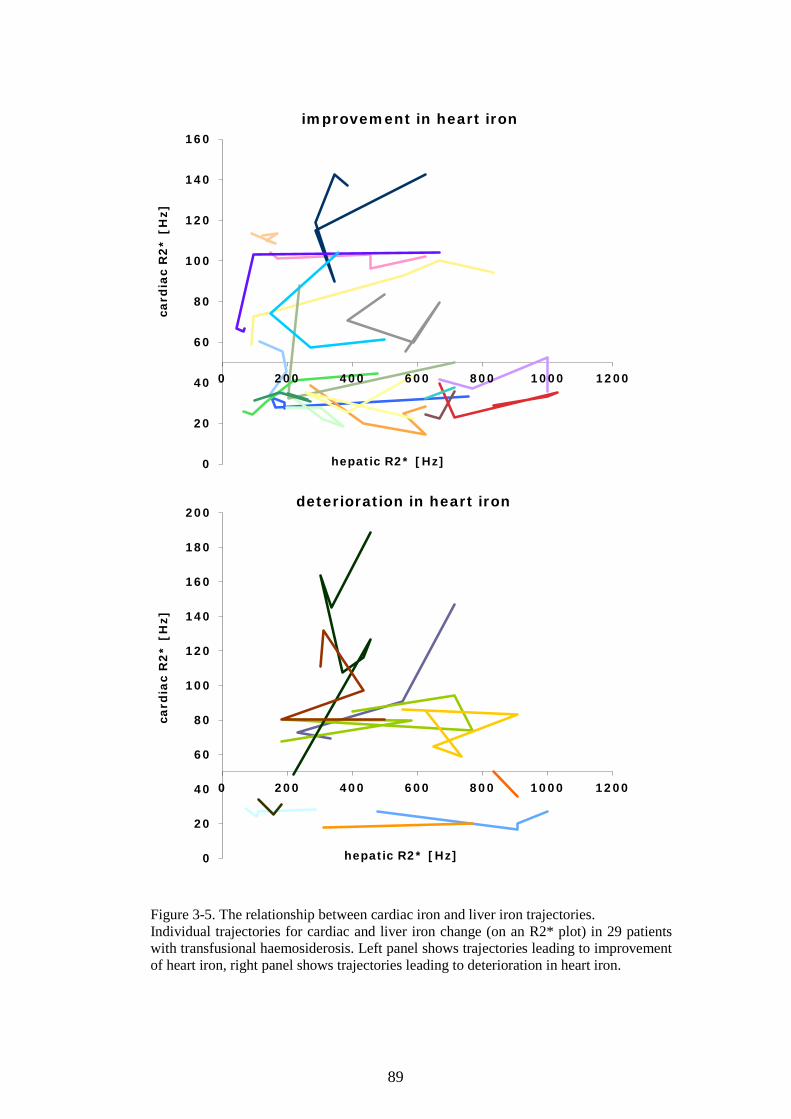
89
Figure 3-5. The relationship between cardiac iron and liver iron trajectories. Individual trajectories for cardiac and liver iron change (on an R2* plot) in 29 patients with transfusional haemosiderosis. Left panel shows trajectories leading to improvement of heart iron, right panel shows trajectories leading to deterioration in heart iron.
0
20
40
60
80
100
120
140
160
0 200 400 600 800 1000 1200
card
iac
R2
* [
Hz]
hepatic R2* [Hz]
improvement in heart iron
0
20
40
60
80
100
120
140
160
180
200
0 200 400 600 800 1000 1200
card
iac
R2
* [
Hz]
hepatic R2* [Hz]
deterioration in heart iron
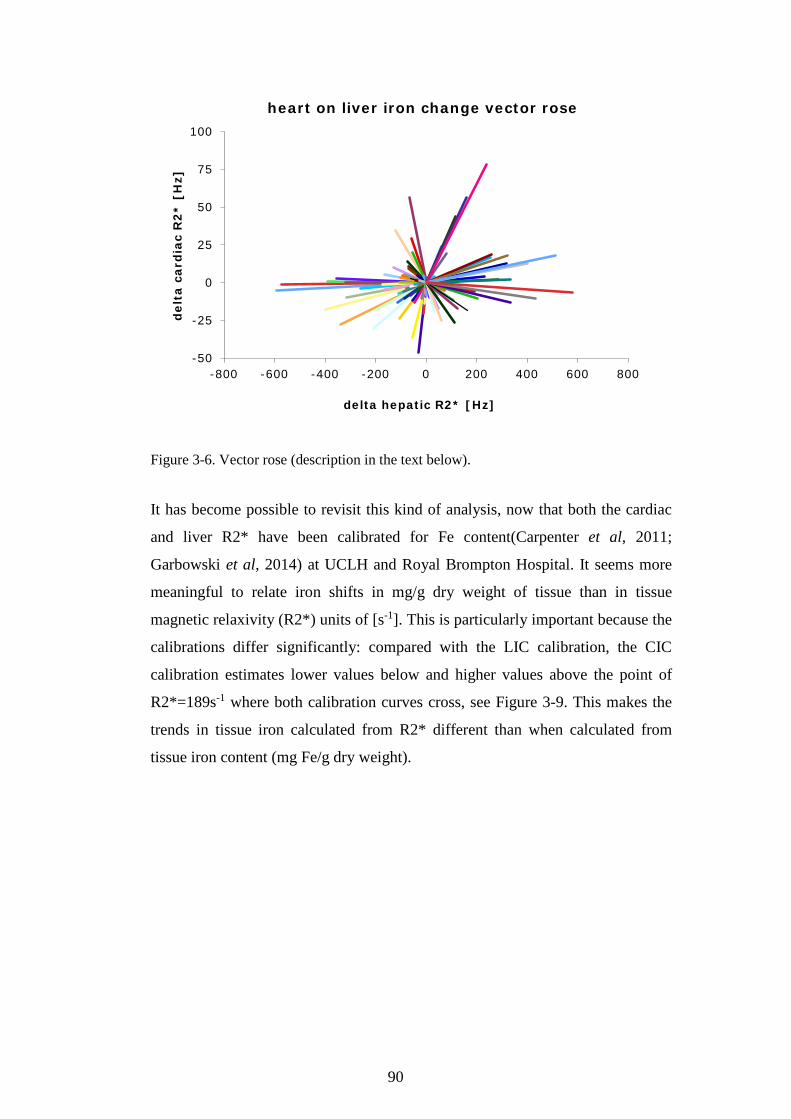
90
Figure 3-6. Vector rose (description in the text below).
It has become possible to revisit this kind of analysis, now that both the cardiac
and liver R2* have been calibrated for Fe content(Carpenter et al, 2011;
Garbowski et al, 2014) at UCLH and Royal Brompton Hospital. It seems more
meaningful to relate iron shifts in mg/g dry weight of tissue than in tissue
magnetic relaxivity (R2*) units of [s-1]. This is particularly important because the
calibrations differ significantly: compared with the LIC calibration, the CIC
calibration estimates lower values below and higher values above the point of
R2*=189s-1 where both calibration curves cross, see Figure 3-9. This makes the
trends in tissue iron calculated from R2* different than when calculated from
tissue iron content (mg Fe/g dry weight).
-50
-25
0
25
50
75
100
-800 -600 -400 -200 0 200 400 600 800
del
ta c
ard
iac
R2
* [
Hz]
delta hepatic R2* [Hz]
heart on liver iron change vector rose

91
Figure 3-7. Frequency distribution of relative heart iron and liver iron changes on 532 consecutive scan pairs in 168 iron overload patients. The data is derived from Figure 3-8 to better illustrate the density of cardio-hepatic vectors. Number of values in log2 scale.

92
Figure 3-8. Vector rose for heart iron and liver iron changes. Description in the text.
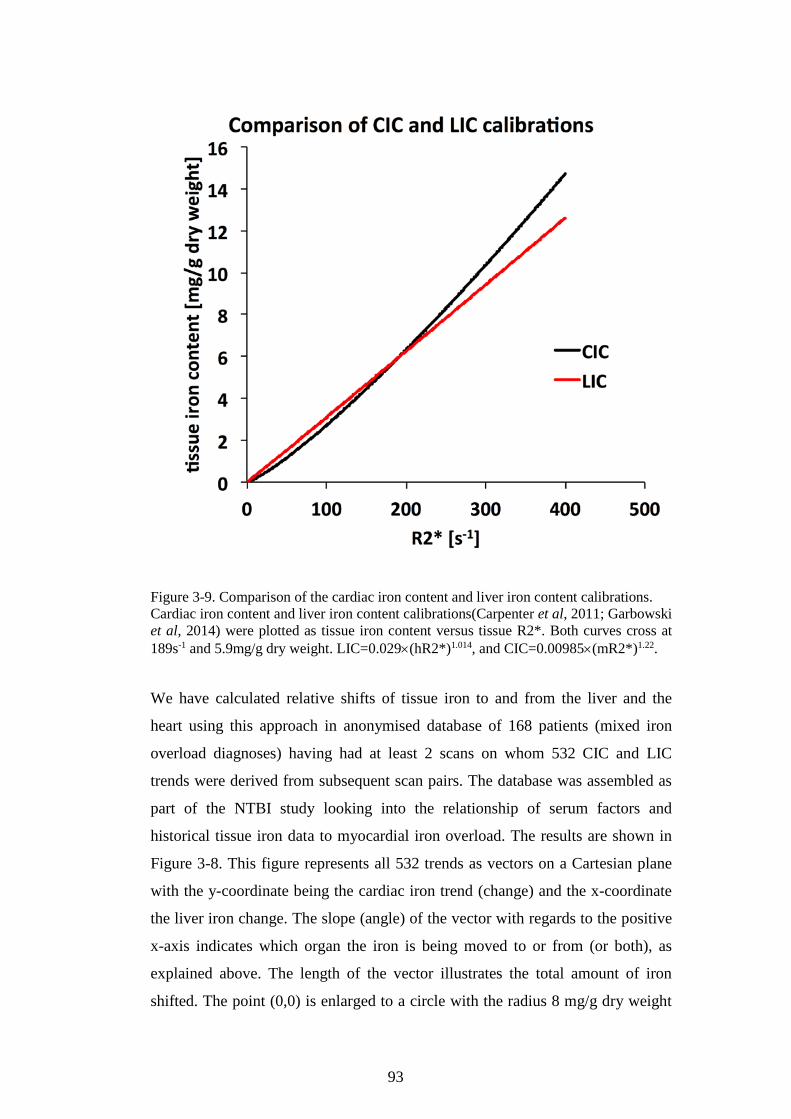
93
Figure 3-9. Comparison of the cardiac iron content and liver iron content calibrations. Cardiac iron content and liver iron content calibrations(Carpenter et al, 2011; Garbowski et al, 2014) were plotted as tissue iron content versus tissue R2*. Both curves cross at 189s-1 and 5.9mg/g dry weight. LIC=0.029×(hR2*)1.014, and CIC=0.00985×(mR2*)1.22.
We have calculated relative shifts of tissue iron to and from the liver and the
heart using this approach in anonymised database of 168 patients (mixed iron
overload diagnoses) having had at least 2 scans on whom 532 CIC and LIC
trends were derived from subsequent scan pairs. The database was assembled as
part of the NTBI study looking into the relationship of serum factors and
historical tissue iron data to myocardial iron overload. The results are shown in
Figure 3-8. This figure represents all 532 trends as vectors on a Cartesian plane
with the y-coordinate being the cardiac iron trend (change) and the x-coordinate
the liver iron change. The slope (angle) of the vector with regards to the positive
x-axis indicates which organ the iron is being moved to or from (or both), as
explained above. The length of the vector illustrates the total amount of iron
shifted. The point (0,0) is enlarged to a circle with the radius 8 mg/g dry weight
94
so that short vectors and their frequency on the circle circumference (=0 mg/g
dry weight) may be easily observed for directional frequency distribution. It is
evident from this analysis that most of the loading and unloading of the heart
happen when large changes in the LIC occur, surprisingly in both directions
around 12 and 6 o’clock (liver loading and unloading) i.e. in bidirectional
distribution. Furthermore, changes in the heart iron are infrequent when there is
no liver iron change, but when they do occur, are typically of small magnitude,
see Figure 3-7. There is a slight inclination for heart loading to be
cotemporaneous with liver loading and similarly heart unloading with liver
unloading, but this tendency is not well defined. Overall this illustrates that there
is no directional relationship between liver iron change and heart iron change.
This supports the already known lack of cross-sectional relationship between
heart iron and liver iron; shown here on the same group of patients, see Figure
3-10.
However, the interesting finding is that it is rather the volume of the liver iron
change (in both directions) that associates best with heart iron change (in both
directions) as indicated by frequency distribution around 12 and 6 o’clock being
much higher than elsewhere on the circumference. The distribution of vectors
(azimuths) on the circumference is highly non-random (p<0.0001) as calculated
from uniformity of azimuths tests from circular statistics (based on chi-square
test). Assuming that 0° is at 12 o’clock in Figure 3-8, the mean vector (azimuth)
is 201.66°, dispersion measure 0.22 (0=maximum dispersion, 1=maximum
concentration), as calculated from sine and cosine values of the vectors angles on
a circle with r=1. This mean vector is consistent with negative LIC and CIC trend
being the average for all vectors. This is also in agreement with frequency
distribution in Figure 3-7, where the mean is just short of the most frequently
observed bin (centre 187.5°, width 15°), but nearly equally frequent patterns are
in the first and last bin as well as the middle two, thus balancing the average to

95
Figure 3-10. The crossectional relationship between cardiac iron and liver iron content. CIC and LIC are shown in mg/g dry weight in 550 scans of 168 patients, r-squared 0.01(Carpenter et al, 2011; Garbowski et al, 2014).
201.66°. It is important to note that this is not a typical average because 360°≠0°.
It seems therefore that the reciprocal behaviour of liver iron and heart iron would
be better described by ‘drag’ rather than lag, with cardiac iron being dragged
together with liver iron rather than the heart iron simply lagging behind the liver
iron. In other words, a large liver iron shift in any direction is necessary so that
the cardiac iron may change (in any direction) and conversely, cardiac iron shifts
very rarely happen in isolation from LIC shifts. We expect that chelation
modality affects this behaviour and future analysis using this powerful approach
will include chelation data to establish whether and, if so, how particular
chelation therapy choice influences the relationship between heart and liver iron
trends.
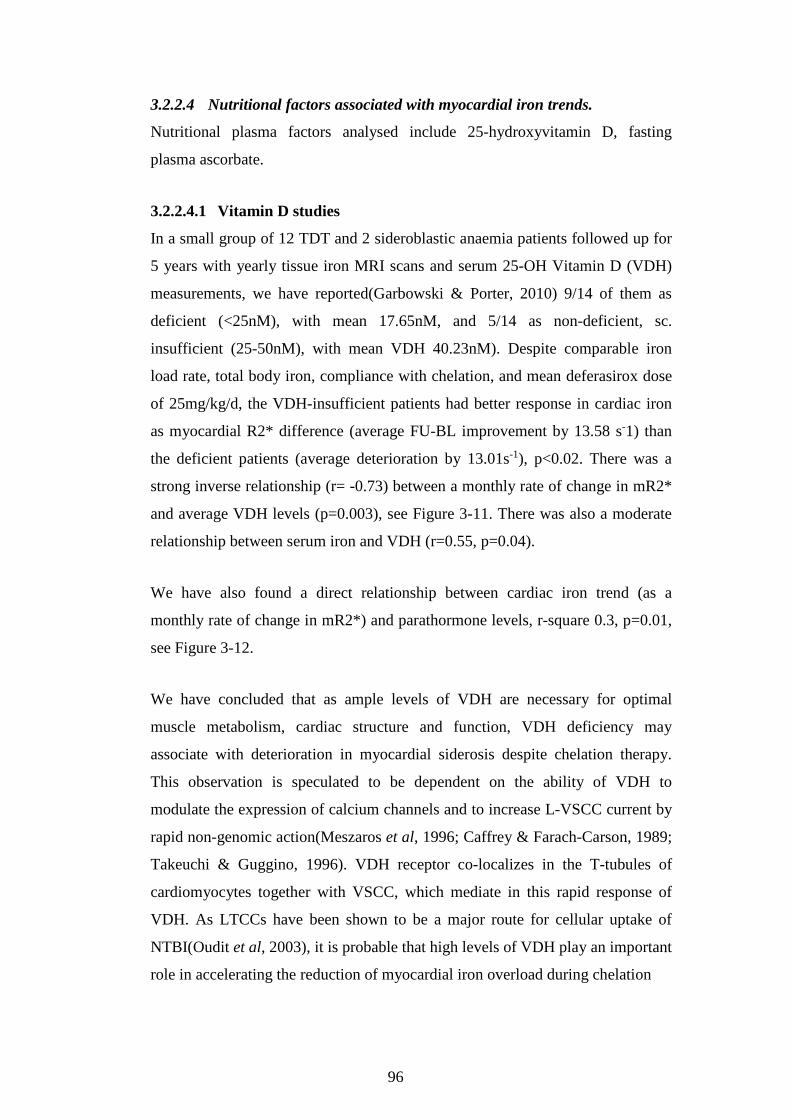
96
3.2.2.4 Nutritional factors associated with myocardial iron trends.
Nutritional plasma factors analysed include 25-hydroxyvitamin D, fasting
plasma ascorbate.
3.2.2.4.1 Vitamin D studies
In a small group of 12 TDT and 2 sideroblastic anaemia patients followed up for
5 years with yearly tissue iron MRI scans and serum 25-OH Vitamin D (VDH)
measurements, we have reported(Garbowski & Porter, 2010) 9/14 of them as
deficient (<25nM), with mean 17.65nM, and 5/14 as non-deficient, sc.
insufficient (25-50nM), with mean VDH 40.23nM). Despite comparable iron
load rate, total body iron, compliance with chelation, and mean deferasirox dose
of 25mg/kg/d, the VDH-insufficient patients had better response in cardiac iron
as myocardial R2* difference (average FU-BL improvement by 13.58 s-1) than
the deficient patients (average deterioration by 13.01s-1), p<0.02. There was a
strong inverse relationship (r= -0.73) between a monthly rate of change in mR2*
and average VDH levels (p=0.003), see Figure 3-11. There was also a moderate
relationship between serum iron and VDH (r=0.55, p=0.04).
We have also found a direct relationship between cardiac iron trend (as a
monthly rate of change in mR2*) and parathormone levels, r-square 0.3, p=0.01,
see Figure 3-12.
We have concluded that as ample levels of VDH are necessary for optimal
muscle metabolism, cardiac structure and function, VDH deficiency may
associate with deterioration in myocardial siderosis despite chelation therapy.
This observation is speculated to be dependent on the ability of VDH to
modulate the expression of calcium channels and to increase L-VSCC current by
rapid non-genomic action(Meszaros et al, 1996; Caffrey & Farach-Carson, 1989;
Takeuchi & Guggino, 1996). VDH receptor co-localizes in the T-tubules of
cardiomyocytes together with VSCC, which mediate in this rapid response of
VDH. As LTCCs have been shown to be a major route for cellular uptake of
NTBI(Oudit et al, 2003), it is probable that high levels of VDH play an important
role in accelerating the reduction of myocardial iron overload during chelation

97
Figure 3-11. Trends in myocardial haemosiderosis relate to Vitamin D status in transfusional iron overload. Top panel. A strong relationship between the monthly rate of heart iron change and average VDH levels in patients with (brown) and without (green) cardiac iron. Bottom panel. Comparison of monthly rate of cardiac iron change is shown in Vitamin D deficient and non-deficient patients. Linear regression and t-test p-values are shown with mean±SD. From Garbowski and Porter 2010 BSH Conference Poster Presentation(Garbowski & Porter, 2010).
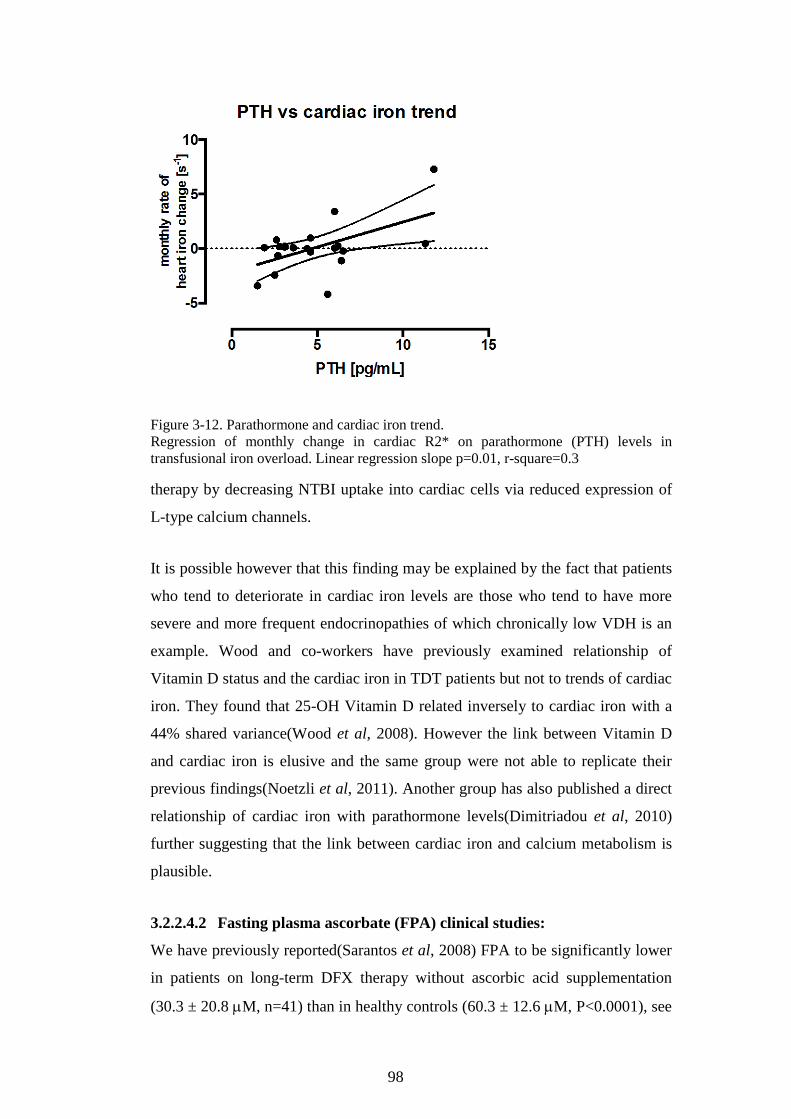
98
Figure 3-12. Parathormone and cardiac iron trend. Regression of monthly change in cardiac R2* on parathormone (PTH) levels in transfusional iron overload. Linear regression slope p=0.01, r-square=0.3
therapy by decreasing NTBI uptake into cardiac cells via reduced expression of
L-type calcium channels.
It is possible however that this finding may be explained by the fact that patients
who tend to deteriorate in cardiac iron levels are those who tend to have more
severe and more frequent endocrinopathies of which chronically low VDH is an
example. Wood and co-workers have previously examined relationship of
Vitamin D status and the cardiac iron in TDT patients but not to trends of cardiac
iron. They found that 25-OH Vitamin D related inversely to cardiac iron with a
44% shared variance(Wood et al, 2008). However the link between Vitamin D
and cardiac iron is elusive and the same group were not able to replicate their
previous findings(Noetzli et al, 2011). Another group has also published a direct
relationship of cardiac iron with parathormone levels(Dimitriadou et al, 2010)
further suggesting that the link between cardiac iron and calcium metabolism is
plausible.
3.2.2.4.2 Fasting plasma ascorbate (FPA) clinical studies:
We have previously reported(Sarantos et al, 2008) FPA to be significantly lower
in patients on long-term DFX therapy without ascorbic acid supplementation
(30.3 ± 20.8 µM, n=41) than in healthy controls (60.3 ± 12.6 µM, P<0.0001), see

99
Figure 3-13. In this context, it was important to assess ascorbate influence on
myocardial iron loading in DFX-treated patients. We have examined
prospectively(Garbowski et al, 2009b) changes in FPA and their relationship to
trends and absolute values of cardiac T2* in a cohort of 21 adult patients with
TIO conditions excluding Sickle Cell Disease (17 with β0-Thalassaemia Major, 2
with Congenital Sideroblastic Anaemia, 1 with Red Cell Aplasia, 1 with
Diamond-Blackfan Anaemia) on long-term DFX chelation (duration of treatment
3-6 years, mean dose 27.1mg/kg/day).
Median follow-up with cardiac and liver MRI was 419 days. 10/21 patients were
on vitamin C supplementation at 2-3 mg/kg/d. FPA was measured under
controlled conditions: a 4 ml fasting heparinized blood sample was taken, placed
immediately on ice and centrifuged at 4oC at 2000g for 10 minutes. An equal
volume of 10% trichloroacetic acid (TCA) was added, the sample re-spun, and
stored at –80oC until measurement of vitamin C fluorimetrically as previously
described(Speek et al, 1984).
The results showed that mean baseline FPA of 35.99 ± 21.02 µM rose to 46.94 ±
14.69 µM at follow-up (p=0.03) in FPA supplemented patients, while in 11
patients without supplementation from 27.4 ± 15.8 µM to 34.0 ± 12.37 µM (ns).
The improved FPA levels in un-supplemented patients correlated with
decrements in liver iron (LIC, r=-0.64, p=0.04), with liver R2* mean decreasing
from 209.24 to 178.07 s-1 (i.e. estimated LIC from 7.01 to 6.08mg Fe/g dry
weight, consistent with previous observations that iron overload accelerates
oxidation of ascorbic acid(Lipschitz et al, 1971).
Significant improvements in myocardial iron (shown as decreasing myocardial
R2*) were seen in ascorbate replete patients at 1y (n=13, mean FPA 48.73 ±
10.61 µM) from a mean myocardial R2* of 61.4 to 52.5s-1 p=0.008, i.e. T2* of
16.2ms to 19ms). By contrast, in patients who remained AA-deficient (mean
FPA 26.28 ± 8.44µM, n=8), the improvement in myocardial R2* was less
marked (from 50.41 to 46.65s-1, i.e. T2* 19.8 to 21.4ms) and did not reach

100
Figure 3-13. Plasma ascorbate in iron overload. Fasting plasma ascorbate levels in healthy controls and patients on deferasirox therapy (top panel) with and without supplementation with vitamin C (bottom panel). From Sarantos et al 2008 ASH Poster Presentation(Sarantos et al, 2008).
significance. We have concluded that AA deficiency poses a significant risk in
patients with TIO on long term DFX without AA supplementation, particularly in
patients with high levels of body iron loading. Our findings suggest that
improvement in myocardial and liver iron with DFX therapy is more likely in
AA replete than AA-deficient patients.
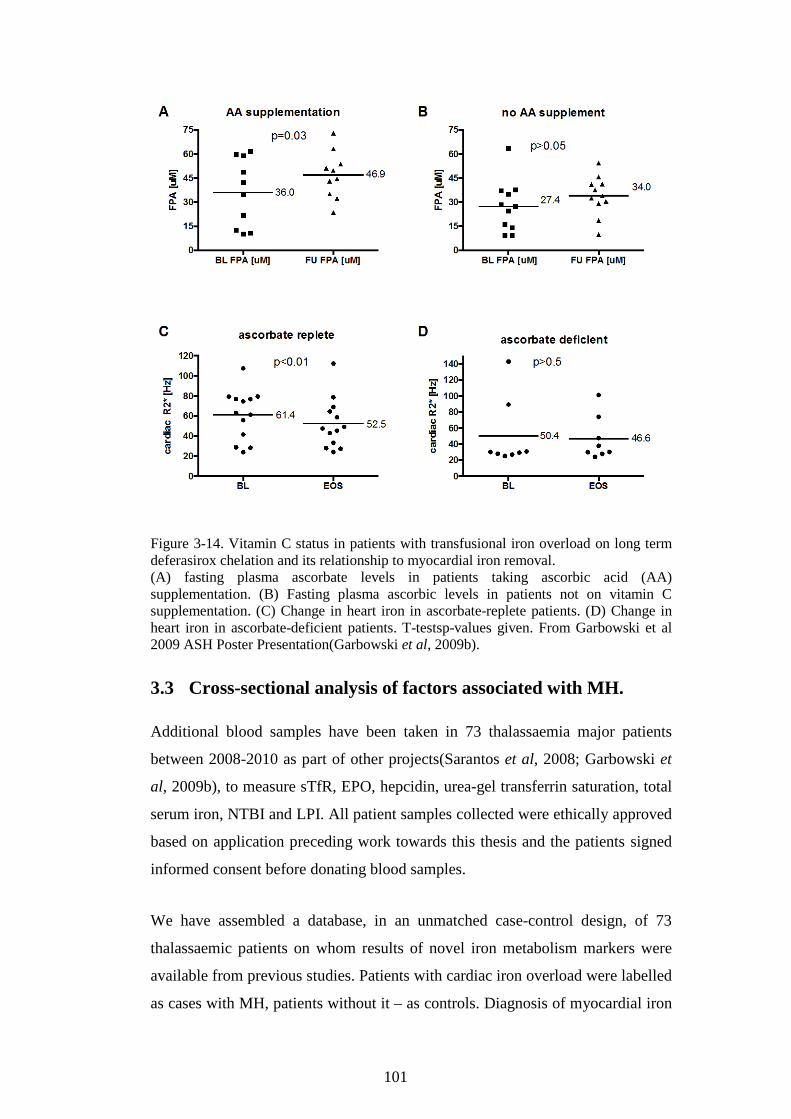
101
Figure 3-14. Vitamin C status in patients with transfusional iron overload on long term deferasirox chelation and its relationship to myocardial iron removal. (A) fasting plasma ascorbate levels in patients taking ascorbic acid (AA) supplementation. (B) Fasting plasma ascorbic levels in patients not on vitamin C supplementation. (C) Change in heart iron in ascorbate-replete patients. (D) Change in heart iron in ascorbate-deficient patients. T-testsp-values given. From Garbowski et al 2009 ASH Poster Presentation(Garbowski et al, 2009b).
3.3 Cross-sectional analysis of factors associated with MH.
Additional blood samples have been taken in 73 thalassaemia major patients
between 2008-2010 as part of other projects(Sarantos et al, 2008; Garbowski et
al, 2009b), to measure sTfR, EPO, hepcidin, urea-gel transferrin saturation, total
serum iron, NTBI and LPI. All patient samples collected were ethically approved
based on application preceding work towards this thesis and the patients signed
informed consent before donating blood samples.
We have assembled a database, in an unmatched case-control design, of 73
thalassaemic patients on whom results of novel iron metabolism markers were
available from previous studies. Patients with cardiac iron overload were labelled
as cases with MH, patients without it – as controls. Diagnosis of myocardial iron
102
was based on the cardiac T2* value <20ms (R2*=50s-1)(Anderson et al, 2004).
Absolute values above 50s-1 are considered pathological; severe cardiac iron
corresponds to values above 100s-1 with highest recorded approximating 300s-1.
Of these, 66 patients had cardiac MRI results, which were available between
10/2006-08/2009 and 11/2007-10/2010, with a mean follow-up of 502.7 days
(SD 189.5) between a baseline scan (mean cardiac R2* 61.14s-1, SE 5.8s-1) and a
follow-up scan (56.96 s-1, SE 5.19s-1). The decrease in mean cardiac iron level
during follow-up was significant (paired t-test p=0.011) although trivial of 4.17s-
1. It was therefore accepted as stable during the period of analysis. However, all
73 patients could be identified as MH-positive or MH-negative based on either
the cotemporaneous scans or from the past and future scans.
The aim of the following analyses was to identify clinical or laboratory factors,
and their optimal thresholds, that associate with cardiac iron presence or absence
in this particular study. Optimal threshold was calculated by performing 100
simulations of serial contingency tables across the entire measured range of the
given factor. Sensitivity, Specificity, positive and negative predictive values were
created only for the contingency table based on the optimal threshold identified
by lowest p-value and confirmed by ROC analysis. Likelihood ratios were
calculated to examine usefulness for a given factor in predicting presence or
absence of cardiac iron at a given threshold. Strength of association was
expressed using an odds ratio – only if association was statistically significant
(by chi-square or Fisher’s exact test) and its 95% CI was calculated using the
log(OR) approximation.
3.3.1 Relationship of soluble transferrin receptors to myocardial iron in TDT.
In order to determine factors associated with MH, a range of biomarkers were
compared in TDT patients with (n=24) and without MH (n=49). sTfR was the
factor most significantly associated with MH (p<0.001, see Figure 3-15DE)
being >3x higher in controls than cases (medians 4.06 vs. 1.26µg/mL, p=0.0005)
with AUCROC of 0.8, p=0.0004. A threshold of 1.77µg/mL was predictive of
MH with 89.7% sensitivity, 64.7% specificity. Other biomarkers, which

103
Table 3-1.Significant clinical and laboratory variables associated with MH.
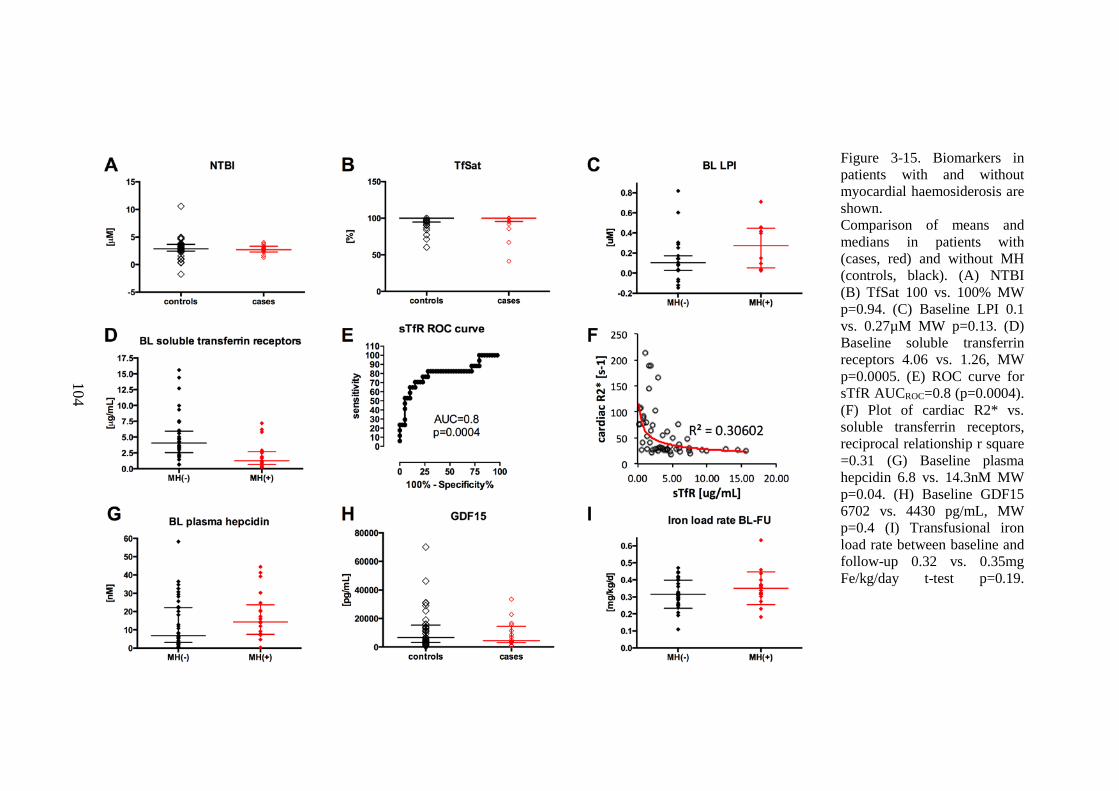
104
Figure 3-15. Biomarkers in patients with and without myocardial haemosiderosis are shown. Comparison of means and medians in patients with (cases, red) and without MH (controls, black). (A) NTBI (B) TfSat 100 vs. 100% MW p=0.94. (C) Baseline LPI 0.1 vs. 0.27µM MW p=0.13. (D) Baseline soluble transferrin receptors 4.06 vs. 1.26, MW p=0.0005. (E) ROC curve for sTfR AUCROC=0.8 (p=0.0004). (F) Plot of cardiac R2* vs. soluble transferrin receptors, reciprocal relationship r square =0.31 (G) Baseline plasma hepcidin 6.8 vs. 14.3nM MW p=0.04. (H) Baseline GDF15 6702 vs. 4430 pg/mL, MW p=0.4 (I) Transfusional iron load rate between baseline and follow-up 0.32 vs. 0.35mg Fe/kg/day t-test p=0.19.
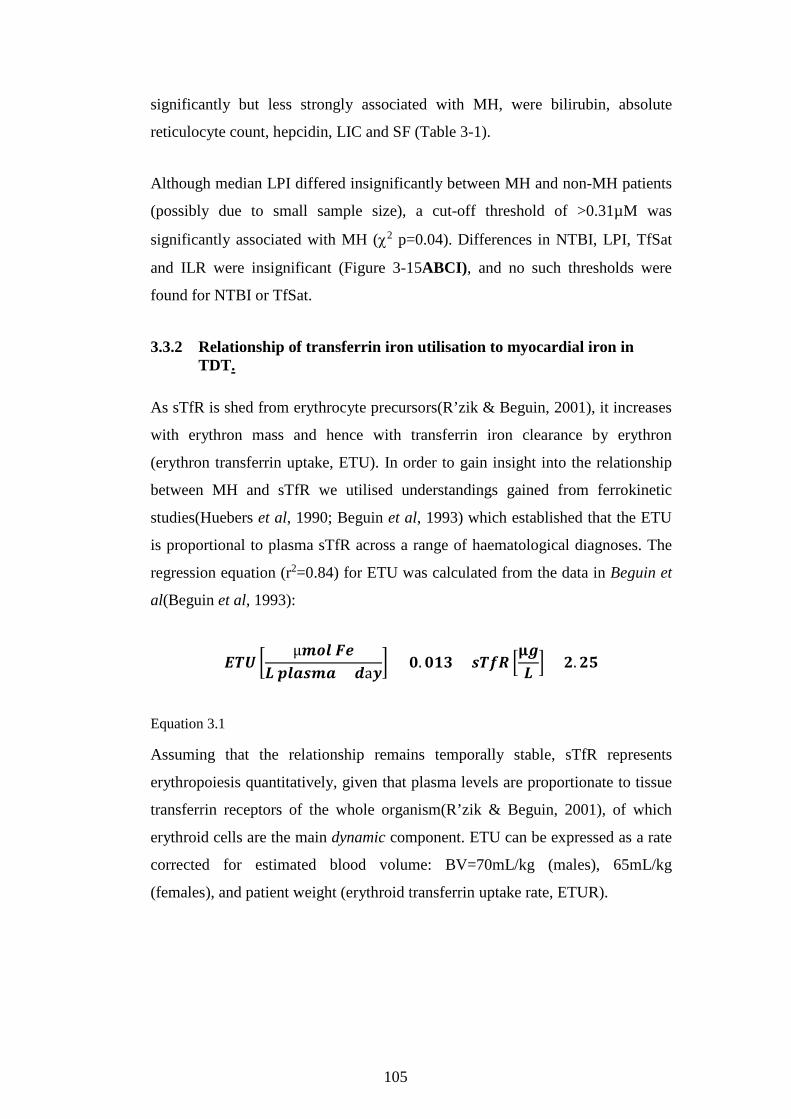
105
significantly but less strongly associated with MH, were bilirubin, absolute
reticulocyte count, hepcidin, LIC and SF (Table 3-1).
Although median LPI differed insignificantly between MH and non-MH patients
(possibly due to small sample size), a cut-off threshold of >0.31µM was
significantly associated with MH (χ2 p=0.04). Differences in NTBI, LPI, TfSat
and ILR were insignificant (Figure 3-15ABCI), and no such thresholds were
found for NTBI or TfSat.
3.3.2 Relationship of transferrin iron utilisation to myocardial iron in TDT.
As sTfR is shed from erythrocyte precursors(R’zik & Beguin, 2001), it increases
with erythron mass and hence with transferrin iron clearance by erythron
(erythron transferrin uptake, ETU). In order to gain insight into the relationship
between MH and sTfR we utilised understandings gained from ferrokinetic
studies(Huebers et al, 1990; Beguin et al, 1993) which established that the ETU
is proportional to plasma sTfR across a range of haematological diagnoses. The
regression equation (r2=0.84) for ETU was calculated from the data in Beguin et
al(Beguin et al, 1993):
𝑬𝑬𝑬𝑬𝑬𝑬 �µ𝒎𝒎𝒎𝒎𝒎𝒎 𝑭𝑭𝑭𝑭
𝑳𝑳 𝒑𝒑𝒎𝒎𝒑𝒑𝒑𝒑𝒎𝒎𝒑𝒑 × 𝒅𝒅a𝒚𝒚� = 𝟎𝟎.𝟎𝟎𝟎𝟎𝟎𝟎 × 𝒑𝒑𝑬𝑬𝒔𝒔𝒔𝒔 �
𝛍𝛍𝒈𝒈𝑳𝑳� + 𝟐𝟐.𝟐𝟐𝟐𝟐
Equation 3.1
Assuming that the relationship remains temporally stable, sTfR represents
erythropoiesis quantitatively, given that plasma levels are proportionate to tissue
transferrin receptors of the whole organism(R’zik & Beguin, 2001), of which
erythroid cells are the main dynamic component. ETU can be expressed as a rate
corrected for estimated blood volume: BV=70mL/kg (males), 65mL/kg
(females), and patient weight (erythroid transferrin uptake rate, ETUR).
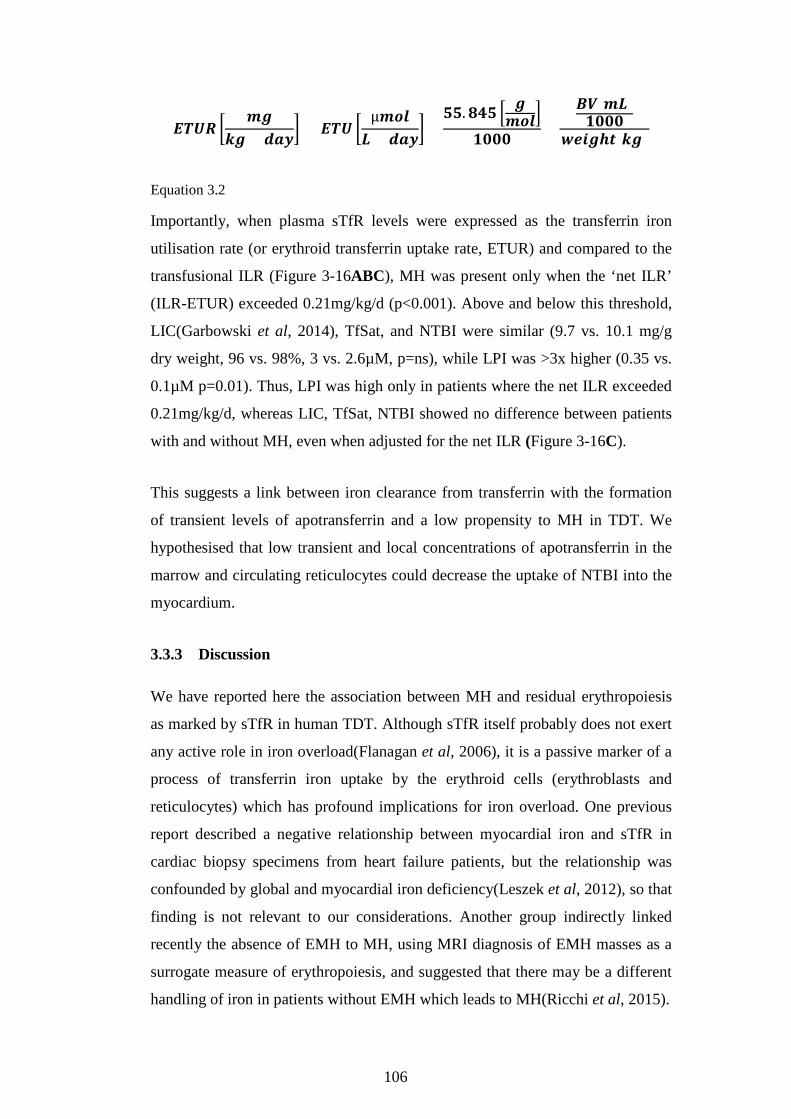
106
𝑬𝑬𝑬𝑬𝑬𝑬𝒔𝒔 �𝒎𝒎𝒈𝒈
𝒌𝒌𝒈𝒈 × 𝒅𝒅𝒑𝒑𝒚𝒚� = 𝑬𝑬𝑬𝑬𝑬𝑬 �
µ𝒎𝒎𝒎𝒎𝒎𝒎𝑳𝑳 × 𝒅𝒅𝒑𝒑𝒚𝒚
� ×𝟐𝟐𝟐𝟐.𝟖𝟖𝟖𝟖𝟐𝟐 � 𝒈𝒈
𝒎𝒎𝒎𝒎𝒎𝒎�𝟎𝟎𝟎𝟎𝟎𝟎𝟎𝟎
×𝑩𝑩𝑩𝑩[𝒎𝒎𝑳𝑳]𝟎𝟎𝟎𝟎𝟎𝟎𝟎𝟎
𝒘𝒘𝑭𝑭𝒘𝒘𝒈𝒈𝒘𝒘𝒘𝒘[𝒌𝒌𝒈𝒈]
Equation 3.2
Importantly, when plasma sTfR levels were expressed as the transferrin iron
utilisation rate (or erythroid transferrin uptake rate, ETUR) and compared to the
transfusional ILR (Figure 3-16ABC), MH was present only when the ‘net ILR’
(ILR-ETUR) exceeded 0.21mg/kg/d (p<0.001). Above and below this threshold,
LIC(Garbowski et al, 2014), TfSat, and NTBI were similar (9.7 vs. 10.1 mg/g
dry weight, 96 vs. 98%, 3 vs. 2.6µM, p=ns), while LPI was >3x higher (0.35 vs.
0.1µM p=0.01). Thus, LPI was high only in patients where the net ILR exceeded
0.21mg/kg/d, whereas LIC, TfSat, NTBI showed no difference between patients
with and without MH, even when adjusted for the net ILR (Figure 3-16C).
This suggests a link between iron clearance from transferrin with the formation
of transient levels of apotransferrin and a low propensity to MH in TDT. We
hypothesised that low transient and local concentrations of apotransferrin in the
marrow and circulating reticulocytes could decrease the uptake of NTBI into the
myocardium.
3.3.3 Discussion
We have reported here the association between MH and residual erythropoiesis
as marked by sTfR in human TDT. Although sTfR itself probably does not exert
any active role in iron overload(Flanagan et al, 2006), it is a passive marker of a
process of transferrin iron uptake by the erythroid cells (erythroblasts and
reticulocytes) which has profound implications for iron overload. One previous
report described a negative relationship between myocardial iron and sTfR in
cardiac biopsy specimens from heart failure patients, but the relationship was
confounded by global and myocardial iron deficiency(Leszek et al, 2012), so that
finding is not relevant to our considerations. Another group indirectly linked
recently the absence of EMH to MH, using MRI diagnosis of EMH masses as a
surrogate measure of erythropoiesis, and suggested that there may be a different
handling of iron in patients without EMH which leads to MH(Ricchi et al, 2015).

107
Figure 3-16. Cardiac iron relationship with sTfR, ILR, and ETUR. (A) Cardiac R2* plotted against transfusional iron load rate, yellow marks patients with cardiac iron (cR2*>50s-1), blue – patients without cardiac iron; no relationship overall. (B) Cardiac R2* (cR2*) plotted against transfusional iron load rate (ILR), yellow marks patients with cardiac iron (cR2*>50s-
1), blue – patients without cardiac iron; no relationship overall, relationship in patients with cardiac iron only, r2=0.61; points differ in size accoding to sTfR level [µg/mL], see inset. (C) same as B but x axis shows ILR corrected for utilisation rate derived from sTfR according to Beguin et al 1993 (ETU [µmol/L/day] = 0.013 * sTfR [µg/L] + 2.25; ETUR [mg/kg/d] = ETU * 55.845 [g/mol] / 1000 * Blood Volume [mL] / 1000 / body weight [kg]). Highly discriminant threshold 0.21mg/kg/d p<0.0001, 100% sensitive, 83% specific for cardiac iron (PPV 71%, NPV 100%) above and below which the LIC, TfSat and NTBI do not differ (p=ns) but LPI is 0.35µM vs. 0.1µM p=0.01 respectively. (D) same as C but points differ in size according to total body iron after Angelucci et al 2000(Angelucci et al, 2000) using LIC derived from Garbowski et al 2014(Garbowski et al, 2014).

108
This fits very well with our hypothesis, and while explaining the significance of
sTfR association with MH, we were able to establish what mechanism underlies
that finding.
3.3.3.1 Ferrokinetic considerations
In our cohort neither transfusional ILR nor number of transfusion years
distinguished between patients with and without MH, although within the former
it could relate to the degree of loading (Figure 3-16B). sTfR may be compared
with ILR by estimating what iron flux into the marrow it corresponds to, and that
flux may be represented in units of ILR (mg Fe/kg/day) as erythroid transferrin
uptake rate, ETUR, see Equation 3.2. Such comparison identifies what
proportion of ILR from transfusion is redirected via plasma iron turnover to the
variably expanded erythroid marrow (i.e. locked in the plasma>erythroid
marrow>erythroid RES>plasma iron circuit), what proportion is left to be taken
up by the liver (ILR-ETUR), or failing that, enters the NTBI pool (Figure 3-19).
The latter case is evident in Diamond-Blackfan anemia, where there is almost no
erythroid marrow uptake, so sTfR approaches zero despite very high EPO(Porter
et al, 2014), and transferrin iron uptake is mainly hepatic(Finch et al. 1970, Fig.
19D), apart from a stable uptake into peripheral tissues. This also illustrates how
slow and dynamically narrow hepatic iron uptake is in human pathology.
NTBI formation and extrahepatic NTBI uptake are highest in Diamond-Blackfan
anaemia(Glanville et al, 2006; Porter et al, 2014) most likely because the hepatic
sink for NTBI(Brissot et al, 1985) is already compromised by liver being the
predominant uptake target of transferrin iron.
Importantly, marrow iron “consumption” may exceed transfusional iron load
rate (ETUR>ILR), creating iron turnover conditions where extrahepatic
haemosiderosis is not observed even despite very often highest observed total
body iron (Figure 3-16D). Similar conditions without extrahepatic
haemosiderosis are observed when ILR exceeds ETUR below a certain threshold.
That part of the ILR-ETUR spectrum likely represents the effective hepatic
capacity of iron uptake both via transferrin and NTBI pathways which is still
protective against extrahepatic loading, however once the threshold is exceeded

109
(Figure 3-16C), it seems that the hepatic NTBI uptake is insufficient to prevent
Figure 3-17. Model of extrahepatic iron loading in TDT as a function of marrow iron utilisation. Arrow width illustrates the amount of iron flux involved. (A) High sTfR TDT shows high erythroid transferrin uptake rate (flux) from saturated transferrin with 3-4 times larger intra-marrow ineffective and effective erythropoiesis iron circuit (shaded blue) which engages the majority of the transferrin traffic. Haemolytic sequelae (grey arrows) of a larger output of thalassaemic erythrocytes and IE load kidney and hepatocytes to a lesser extent than in NTDT. Peripheral haematocrit is regularly increased with transfusion and eventually loads RES. Due to insufficient hepcidin, iron spills relatively unopposed from RES at a high rate and joins transferrin compartment inasmuch as transferrin is off-loaded by the marrow (not liver), with the remainder of RES efflux joining the NTBI pool (blue arrows) that is qualitatively different (most of the LPI engaged by de-saturated transferrin) such that no extrahepatic loading occurs. (B) Low sTfR TDT shows low erythroid transferrin uptake rate (flux) from saturated transferrin with 3-4 times smaller intra-marrow ineffective and effective erythropoiesis iron circuit (shaded blue) which engages minority of transferrin traffic. Haemolytic sequelae (grey arrows) of a smaller output of thalassaemic erythrocytes and IE do not load kidney and hepatocytes as in A. Peripheral haematocrit is regularly increased with transfusion and ends up loading RES. Due to insufficient hepcidin, iron spills from RES at a high rate and joins transferrin compartment inasmuch as transferrin is off-loaded by the marrow and more slowly by the liver, the remainder of RES efflux joining the NTBI pool (red arrows) that is qualitatively different (with more LPI) such that extrahepatic loading occurs.
cardiac iron loading. The dynamic range of ILR is similar to that of ETUR,
however, it seems that mainly the marrow iron consumption rate determines that
threshold within a patient, since it changes throughout the transfusion cycle and
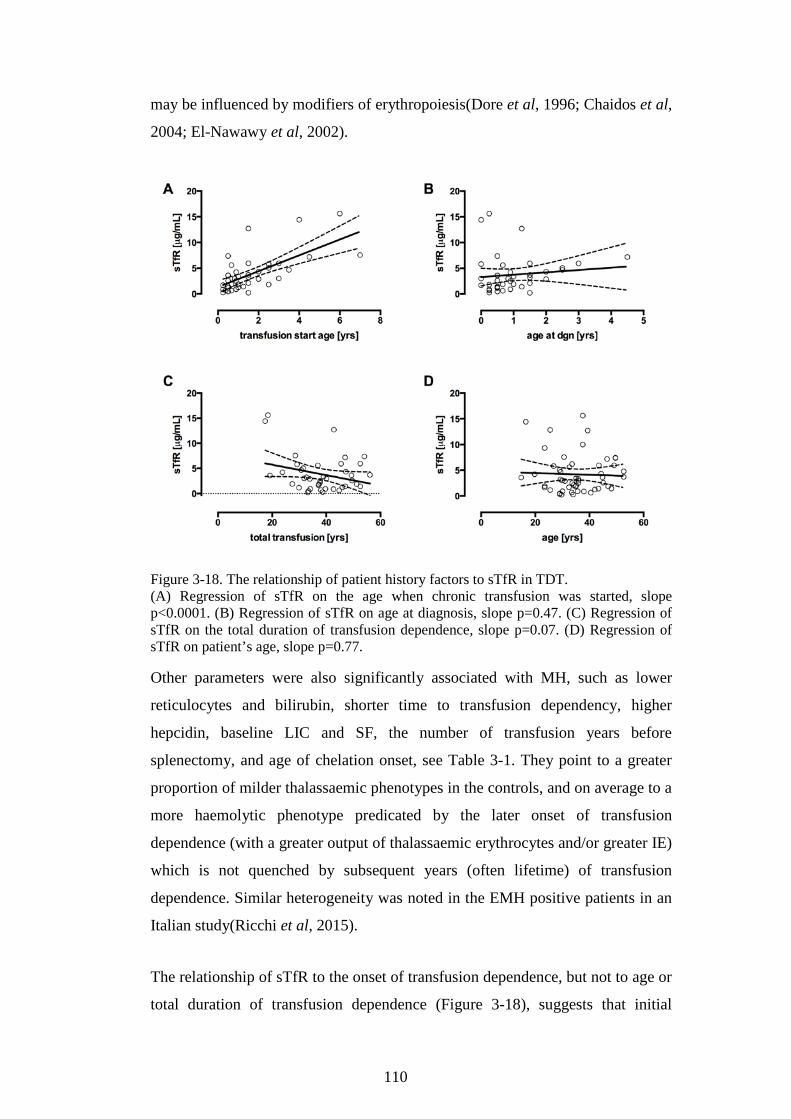
110
may be influenced by modifiers of erythropoiesis(Dore et al, 1996; Chaidos et al,
2004; El-Nawawy et al, 2002).
Figure 3-18. The relationship of patient history factors to sTfR in TDT. (A) Regression of sTfR on the age when chronic transfusion was started, slope p<0.0001. (B) Regression of sTfR on age at diagnosis, slope p=0.47. (C) Regression of sTfR on the total duration of transfusion dependence, slope p=0.07. (D) Regression of sTfR on patient’s age, slope p=0.77.
Other parameters were also significantly associated with MH, such as lower
reticulocytes and bilirubin, shorter time to transfusion dependency, higher
hepcidin, baseline LIC and SF, the number of transfusion years before
splenectomy, and age of chelation onset, see Table 3-1. They point to a greater
proportion of milder thalassaemic phenotypes in the controls, and on average to a
more haemolytic phenotype predicated by the later onset of transfusion
dependence (with a greater output of thalassaemic erythrocytes and/or greater IE)
which is not quenched by subsequent years (often lifetime) of transfusion
dependence. Similar heterogeneity was noted in the EMH positive patients in an
Italian study(Ricchi et al, 2015).
The relationship of sTfR to the onset of transfusion dependence, but not to age or
total duration of transfusion dependence (Figure 3-18), suggests that initial

111
expansion of the bone marrow and reprogramming of iron circuits is difficult to
suppress even by many years of hypertransfusion. However, our data suggest that
it could be beneficial to delay the onset of transfusion dependence where
clinically possible in order to reduce the risk of MH later in life.
Insignificant associations with MH were observed for the following factors from
patient history: years of transfusion dependence, the percentage of unchelated
transfusion years, age, weight, ILR, total body iron, and for the serum factors
incuding: total serum iron, transferrin saturation, and GDF15, see Table 3-2. The
total serum iron not being a significant marker of MH is in agreement with
neither NTBI nor TfSat having a predictive value for MH.
3.3.3.2 NTBI speciation may be influenced by ETUR
NTBI is typically formed when the iron entry exceeds iron exit from plasma
transferrin compartment. This heterogenous multispeciated pool of plasma iron,
variably bound to albumin, arises when transferrin becomes increasingly
saturated (typically above 75%). Our data suggests that ETUR may change the
speciation of NTBI before the total NTBI concentration changes. This
isindirectly in agreement with others(Pippard et al, 1982; Aydinok et al, 2012)
who have shown that chelated iron rate is inversely proportional to ILR or, we
could add, conversely – proportional to ETUR. The NTBI conduit is implicated
in extrahepatic loading; whereas having shown that total NTBI, as well as TfSat,
were indistinguishable across the ILR-ETUR threshold of 0.21 mg/kg/d, we
predicted that the quality of NTBI must change as a result of ETUR. This was
confirmed by an over threefold difference in LPI across that threshold, being
higher when marrow iron consumption is lower and patients have MH. We tested
this hypothesis further in in vitro experiments involving LPI detectability of
NTBI models, cardiac iron uptake, retention and intracellular ROS formation in a
cultured cardiomyocyte model, whilst interfering with apotransferrin and
holotransferrin. This is discussed in the subsequent chapters.
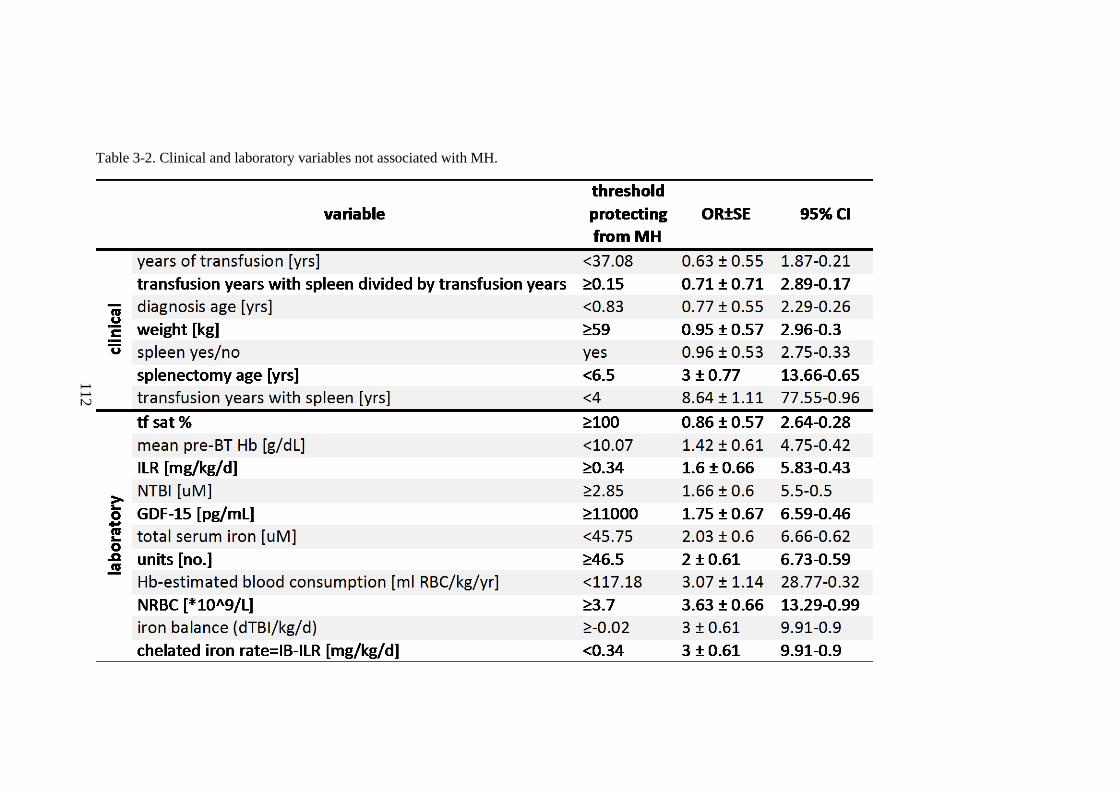
112
Table 3-2. Clinical and laboratory variables not associated with MH.
113
3.3.4 Summary of the main model of the erythroid iron sink
The results discussed in 3.3 support development of a model of apotransferrin
erythroid iron sink, which seems to operate in TDT in the following way.
1. Thalassaemic erythrocytes constitute compartmentalised store of haemoglobin, haemolyse more easily leading to appearance of free Hb in circulation (de-compartmentalisation), which easily releases heme, and undergo earlier erythro-phagocytosis by RES than transfused erythrocytes. Erythro-phagocytosis is more pronounced if higher proportion of haematocrit is taken up by thalassaemic RBC.
2. Catabolism of heme from transfused erythrocytes and thalassaemic erythrocytes produces iron stored in macrophages and/or released to the plasma via ferroportin depending on the plasma hepcidin levels.
3. Iron in plasma binds to transferrin if any mono- or apo-Tf is present or enters the NTBI pool if Tf is 70-100% saturated.
4. The rate of erythroid transferrin uptake depends ultimately on EPO, which reflects the Hb-dependent oxygenation of renal parenchyma.
5. With transferrin saturated, iron remains longer in NTBI pool if erythroid transferrin uptake is low. This may influence the kinetics of NTBI speciation.
6. High erythroid transferrin uptake entails high rate of apotransferrin nascence in bone marrow sinusoids (around erythroid foci), which avidly binds ambient iron species from NTBI pool and as holotransferrin is avidly taken up by erythroid cells (transferrin shuttle).
7. A portion of NTBI is therefore shunted to erythroid foci via transferrin shuttle. 8. If transferrin shuttle is cycling at a high rate, there is a high rate removal of
NTBI fractions from plasma. 9. This affects the kinetics of NTBI species formation: low molecular NTBI
species likely disappear quickly from circulation and may not contribute to high molecular weight NTBI formation.
10. The species likely being affected first is LPI. 11. The species that loads into cardiomyocytes is absent when transferrin shuttles at
a high rate. 12. LPI is low when transferrin shuttles at a high rate. 13. LPI is high in patients with cardiac iron. 14. High rate transferrin shuttling protects against cardiac iron retention.
The relevant aspects of the model are summarised in the Figure 3-19.
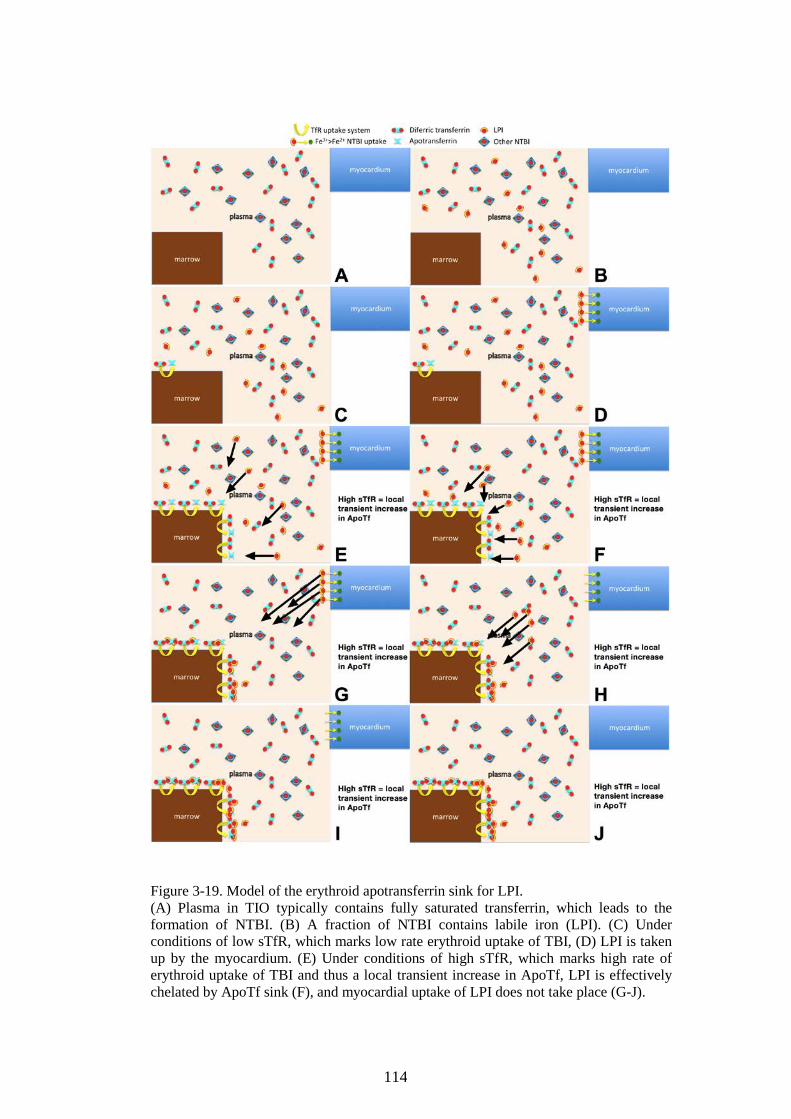
114
Figure 3-19. Model of the erythroid apotransferrin sink for LPI. (A) Plasma in TIO typically contains fully saturated transferrin, which leads to the formation of NTBI. (B) A fraction of NTBI contains labile iron (LPI). (C) Under conditions of low sTfR, which marks low rate erythroid uptake of TBI, (D) LPI is taken up by the myocardium. (E) Under conditions of high sTfR, which marks high rate of erythroid uptake of TBI and thus a local transient increase in ApoTf, LPI is effectively chelated by ApoTf sink (F), and myocardial uptake of LPI does not take place (G-J).
115
3.3.5 Rationale for continuing work
The above data (See 3.3) are descriptive and inferential, derived from
retrospective database analysis involving a data-driven approach (data dredging)
therefore there is over-fitting bias in that analysis. However, it allowed
hypothesis generation and development of the erythroid transferrin shuttle model,
which makes good physiological sense and is plausible. It is likely that soluble
transferrin receptor differences constitute a real effect despite the over-fitting
bias because the effect magnitude is high and false positive probability very low.
Nevertheless, in order to avoid over-fitting bias, it is necessary to repeat the
analysis in a hypothesis-driven approach on newly assembled data (see 3.4) from
which the model was derived and subsequently test that model experimentally.
3.4 Confirmation cohort
In collaboration with Dr Amna Abdel-Gadir and Prof James Moon at the Heart
Hospital, UCL, we have recruited 29 patients to the confirmation cohort between
2014 and 2016. Ethical approval was obtained from a local Ethics Committee,
and patients gave informed consent before study participation, all patients signed
the informed consent form. Care was ensured that the patient cardiac T2* values
would be evenly distributed below and above 20ms threshold. The mean±SD of
cardiac T2* was 22.16±12.55ms, range 3.9-44ms, cardiac R2* 74.01±61.53,
22.73-256.41s-1, respectively. All chelation modalities were accepted. Before the
MRI scan on the day of the scan, a blood sample was collected, allowed to clot
for 30 minutes then centrifuged and batch-frozen as per 2.1.3.5. The patients had
all transfusion-dependent β-Thalassaemia Major and were treated with DFX
(n=13), DFO (n=7), DFN (n=1), DFO+DFN (n=4), DFO+DFX (n=1),
DFX+DFN (n=1) or no chelation (n=2). 15 patients had mT2*>20ms (range 21-
44ms, mean 32.8ms) and 14 ≤20ms (range 3.9=20ms, mean 10.76ms). Samples
and scans took place 1-22 days post-transfusion (mean 9±5.8 days) and are
therefore a mixture of post- mid- and pre-transfusion samples. The variables
tested were hepatic T2* and T1, LIC, blood T1, myocardial T1, NTA-NTBI
using the BPT-TGA method (2.1.3.5), bead-NTBI using the flow-cytometric
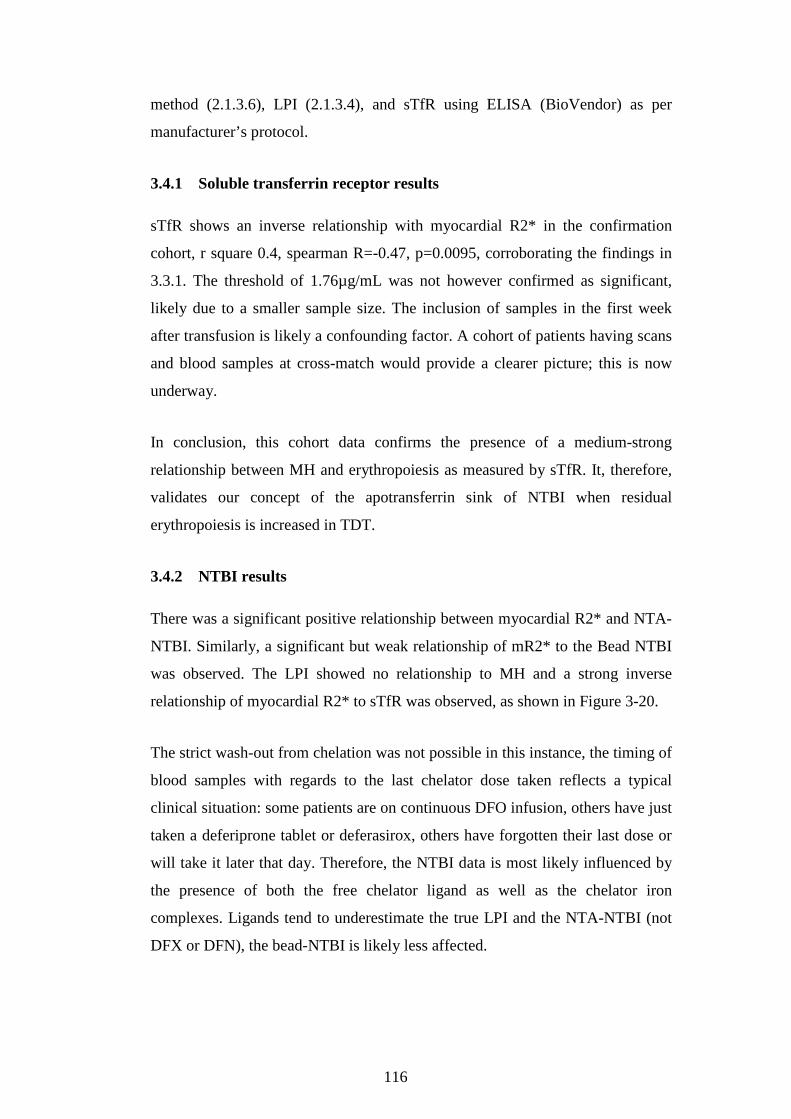
116
method (2.1.3.6), LPI (2.1.3.4), and sTfR using ELISA (BioVendor) as per
manufacturer’s protocol.
3.4.1 Soluble transferrin receptor results
sTfR shows an inverse relationship with myocardial R2* in the confirmation
cohort, r square 0.4, spearman R=-0.47, p=0.0095, corroborating the findings in
3.3.1. The threshold of 1.76µg/mL was not however confirmed as significant,
likely due to a smaller sample size. The inclusion of samples in the first week
after transfusion is likely a confounding factor. A cohort of patients having scans
and blood samples at cross-match would provide a clearer picture; this is now
underway.
In conclusion, this cohort data confirms the presence of a medium-strong
relationship between MH and erythropoiesis as measured by sTfR. It, therefore,
validates our concept of the apotransferrin sink of NTBI when residual
erythropoiesis is increased in TDT.
3.4.2 NTBI results
There was a significant positive relationship between myocardial R2* and NTA-
NTBI. Similarly, a significant but weak relationship of mR2* to the Bead NTBI
was observed. The LPI showed no relationship to MH and a strong inverse
relationship of myocardial R2* to sTfR was observed, as shown in Figure 3-20.
The strict wash-out from chelation was not possible in this instance, the timing of
blood samples with regards to the last chelator dose taken reflects a typical
clinical situation: some patients are on continuous DFO infusion, others have just
taken a deferiprone tablet or deferasirox, others have forgotten their last dose or
will take it later that day. Therefore, the NTBI data is most likely influenced by
the presence of both the free chelator ligand as well as the chelator iron
complexes. Ligands tend to underestimate the true LPI and the NTA-NTBI (not
DFX or DFN), the bead-NTBI is likely less affected.

117
Figure 3-20. Confirmation cohort results showing cardiac iron relationship to NTBI, LPI, and sTfR. 29 patients with β-Thalassaemia Major are shown with their myocardial R2* (=1/(T2*/1000)) compared to NTBI levels and sTfR. (A) Linear regression of mR2* on NTA-NTBI by BPT-TGA method, slope p=0.0071, r square=0.24, equation mR2*=9.802×NTBI+26.64. (B) Linear regression of mR2* on bead-NTBI, slope p=0.0196, r square=0.19, equation Y = 84.89*X + 55.74. (C) Linear regression on mR2* on LPI, slope p=ns. (D) Nonlinear regression of mR2* on sTfR, 124.7±14.12×sTfR-
0.7719±0.1776, r square 0.4.
Chelator-iron complexes, however, have a variable effect on the assays: DFX2Fe,
DFN3Fe are both visible using the NTA assay, DFN3Fe is visible to the bead
assay, DFX2Fe is not visible to the bead assay, DFO-Fe is predicted not to be
detectable as bead-NTBI, however, clinical samples may suggest otherwise (see
4.3.4). Thus, it is possible to estimate which clinical samples are over- or
underestimated by the presumed presence of free ligands or chelate complexes.
This analysis was based on 5 half-lives of chelators ligands and complexes,
above which a sample was considered relatively free of chelators influence,
except for deferiprone(Aydinok et al, 2012).
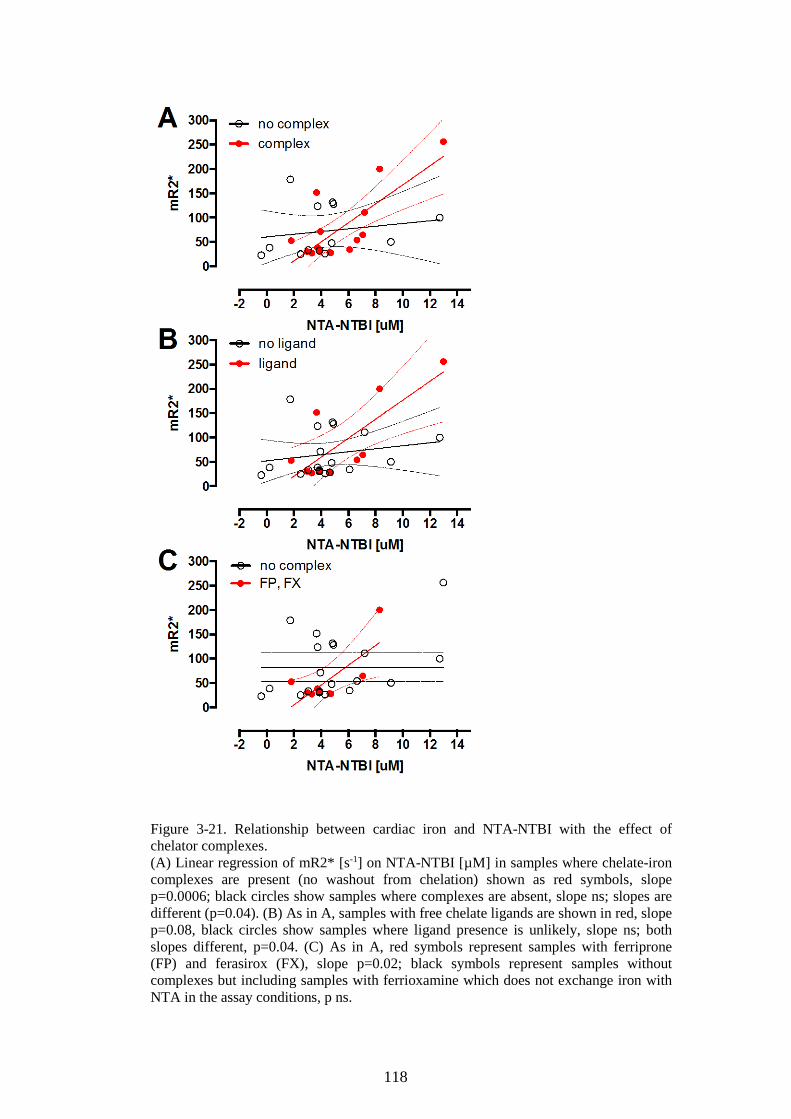
118
Figure 3-21. Relationship between cardiac iron and NTA-NTBI with the effect of chelator complexes. (A) Linear regression of mR2* [s-1] on NTA-NTBI [µM] in samples where chelate-iron complexes are present (no washout from chelation) shown as red symbols, slope p=0.0006; black circles show samples where complexes are absent, slope ns; slopes are different (p=0.04). (B) As in A, samples with free chelate ligands are shown in red, slope p=0.08, black circles show samples where ligand presence is unlikely, slope ns; both slopes different, p=0.04. (C) As in A, red symbols represent samples with ferriprone (FP) and ferasirox (FX), slope p=0.02; black symbols represent samples without complexes but including samples with ferrioxamine which does not exchange iron with NTA in the assay conditions, p ns.
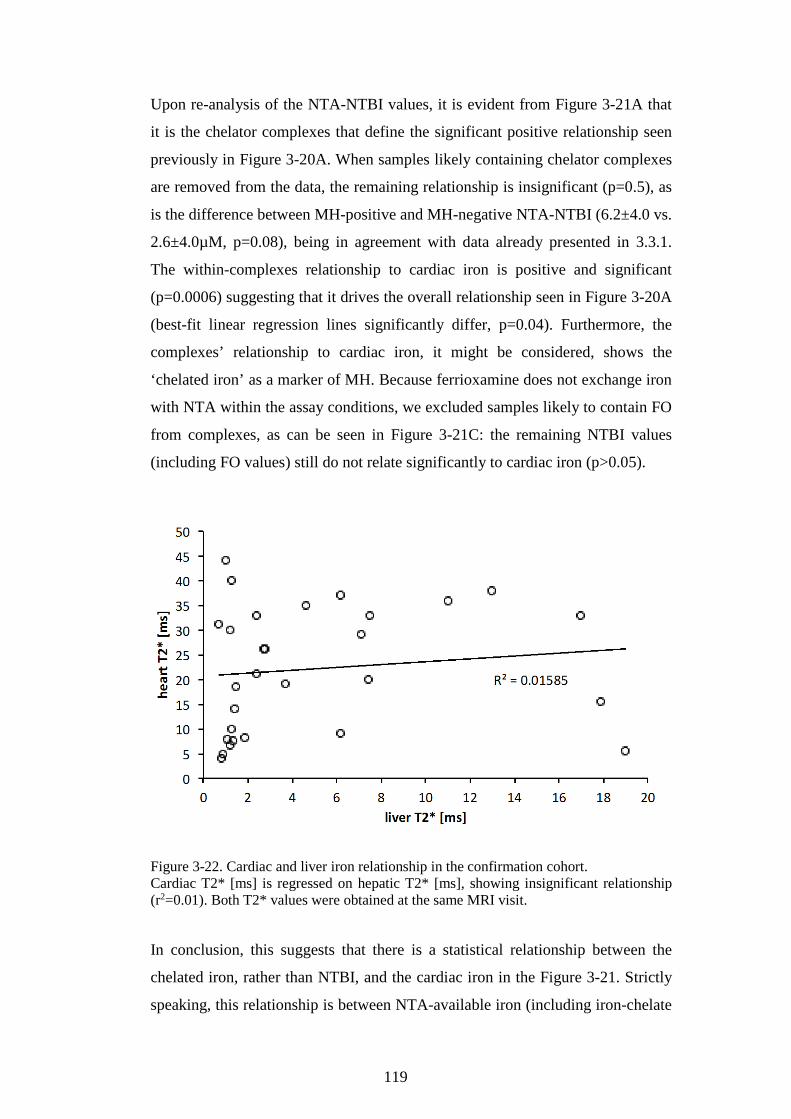
119
Upon re-analysis of the NTA-NTBI values, it is evident from Figure 3-21A that
it is the chelator complexes that define the significant positive relationship seen
previously in Figure 3-20A. When samples likely containing chelator complexes
are removed from the data, the remaining relationship is insignificant (p=0.5), as
is the difference between MH-positive and MH-negative NTA-NTBI (6.2±4.0 vs.
2.6±4.0µM, p=0.08), being in agreement with data already presented in 3.3.1.
The within-complexes relationship to cardiac iron is positive and significant
(p=0.0006) suggesting that it drives the overall relationship seen in Figure 3-20A
(best-fit linear regression lines significantly differ, p=0.04). Furthermore, the
complexes’ relationship to cardiac iron, it might be considered, shows the
‘chelated iron’ as a marker of MH. Because ferrioxamine does not exchange iron
with NTA within the assay conditions, we excluded samples likely to contain FO
from complexes, as can be seen in Figure 3-21C: the remaining NTBI values
(including FO values) still do not relate significantly to cardiac iron (p>0.05).
Figure 3-22. Cardiac and liver iron relationship in the confirmation cohort. Cardiac T2* [ms] is regressed on hepatic T2* [ms], showing insignificant relationship (r2=0.01). Both T2* values were obtained at the same MRI visit.
In conclusion, this suggests that there is a statistical relationship between the
chelated iron, rather than NTBI, and the cardiac iron in the Figure 3-21. Strictly
speaking, this relationship is between NTA-available iron (including iron-chelate
120
complexes DFX, DFN, DFO) and cardiac iron in patients on chelation. There is
no relationship overall between cardiac iron and liver iron in the same patients,
see Figure 3-22. The chelated iron represented by the complexes comes
principally from plasma iron turnover. This is suggested by urinary ferrioxamine
iron excretion being inversely related to erythropoiesis (Pippard’s mechanism
number two(Pippard et al, 1982)). The hepatocyte iron turnover contributes to
plasma ferrioxamine to a much lesser degree as suggested by Pippard’s
mechanism number one. According to Hershko and Rachmilewitz, the principal
source of urinary iron excretion, and therefore plasma FO, during DFO chelation
is plasma iron turnover(Hershko & Rachmilewitz, 1979), presumably at the point
of release of iron from macrophages. Although Pippard argued that DFO does
not compete with erythroid iron utilisation or plasma iron turnover, nor does it
directly compete with circulating transferrin (apotransferrin and the monoferric
transferrins), it is possible that at 100% TfSat the competition is different than
when holotransferrin takes up only about 10% of circulating transferrin as is the
case in normal volunteers. He quoted Walsh et al 1964 and Hallberg et al 1965 to
support this claim, but in the Hallberg paper subjects who underwent DFO
injections always had free apotransferrin present(Hallberg & Hedenberg, 1965).
The hepatocyte iron turnover relates to liver iron stores and the level of
erythropoiesis(Pippard et al, 1982). Deferiprone complexes were also increased
in relation to transfusional iron loading, so inversely to erythropoiesis (Aydinok
et al, 2012), but the degree to which hepatocyte iron turnover contributes to
deferiprone chelate complexes formation is probably larger than in the case of
ferrioxamine. Chelate-iron complexes detected in serum by the NTA-assay arise
therefore mostly in plasma in situ in case of all three chelators, with only a small
proportion of them arising from the chelate-iron complexes being transported
from tissue compartment to plasma compartment. This, therefore, indirectly
implicates plasma iron turnover in cardiac loading, given the lack of cardiac iron
relationship to liver iron in these patients. The source of iron in chelate
complexes is probably initially NTBI but after NTBI has been bound and free
chelator ligands still persist, then, under conditions of fully saturated transferrin,
they may start to compete with nascent apotransferrin for macrophage iron as it
leaves ferroportin (De Domenico et al, 2007).
121
The LPI results ranging between 0 and 0.15µM are all but one below the upper
limit of normal (0.1µM(Porter et al, 2014)), as is likely given that 16/29 samples
contain the free ligands and/or complexes of chelators (as judged from dosing),
therefore, the lack of relationship between LPI and cardiac iron is not surprising,
see Figure 3-20C. A washout from chelation is necessary before LPI levels are
tested in order to obtain a higher signal.
The bead-NTBI results are also close to the lower limit of normal (0.65µM, see
4.3.3.2), leaving too few points to analyse (Figure 3-20B). What is striking,
however, is the large discrepancy between NTA-NTBI and the bead-NTBI,
suggesting that the two methods sample NTBI pools in a different manner,
pointing perhaps to speciation differences within NTBI. This subject is covered
extensively in Chapter 4.
122
Chapter 4 Clinical and methodological factors affecting non-transferrin-bound iron (NTBI) values using a novel fluorescent bead assay.
4.1 Introduction
Plasma non-transferrin-bound iron (NTBI), first described in 1978(Hershko et al,
1978), is a pathological iron pool detectable when transferrin saturation exceeds
75%(Porter et al, 1996; Gosriwatana et al, 1999; Loréal et al, 2000). NTBI
appears when iron influx into the plasma compartment exceeds iron efflux, e.g.
with iron overload, ineffective erythropoiesis, or decreased transferrin iron
clearance in erythroid hypoplasia(Porter et al, 2014). NTBI is considered the
main conduit of hepatic(Brissot et al, 1985; Wang & Knutson, 2013;
Jenkitkasemwong et al, 2015) and extra-hepatic(Bergeron & Kovacs, 1978;
Simpson et al, 1993; Oudit et al, 2003, 2006b) iron loading of tissues, under
haemosiderotic conditions. Quantitating NTBI is of value in understanding NTBI
generation under different pathophysiological settings(Porter et al, 2014) but can
also be potentially useful in the management of iron-overloaded patients.
However using established methods for NTBI quantitation, clear consensus and
guidelines on how to use NTBI measurement in patient management have yet to
emerge. This is partly because NTBI is multi-speciated, consisting of a range of
iron-citrate(Evans et al, 2008; Silva et al, 2009), albumin-bound
complexes(Evans et al, 2008), glycated protein-iron complexes(Silva & Hider,
2009; Hider et al, 2010) or iron-chelate complexes in recently chelated
patients(Aydinok et al, 2012). Consequently, it is unlikely that NTBI assays
relying on different principles will measure different NTBI species to the same
extent. Hence, a consistent pattern of association between NTBI values and
clinical outcomes has yet to emerge.
There is, therefore, a need to identify a robust and well-characterised NTBI assay
that can be applied in a standardised manner in the management of iron–
overloaded patients. A range of NTBI methods used previously differ
considerably in their detection principles and in reported reference ranges(de
Swart et al, 2015). The most long-standing and frequently reported NTBI

123
method(Singh et al, 1990) involves iron capture from NTBI by a high
concentration of a low affinity/specificity iron chelator, nitrilotriacetic acid
(NTA, 80mM), followed by ultrafiltration and detection of NTA-iron by
HPLC(Singh et al, 1990; Porter et al, 1996) or using
spectrophotometry(Gosriwatana et al, 1999). Another approach is measuring
NTBI indirectly by quantifying the redox-active subset of NTBI, which has been
termed the ‘labile plasma iron’ (LPI) assay(Esposito et al, 2003). A further
approach is measuring the directly chelatable iron (DCI) with a fluorophore-
labelled high-affinity chelator(Breuer et al, 2001; Breuer & Cabantchik, 2001; de
Swart et al, 2015) but background fluorescence in plasma may interfere with data
interpretation. Most recently, an adaptation of this approach was described, using
a high-affinity fluorescent chelator CP851, covalently linked to magnetic beads
with fluorescence signal separated flow-cytometrically from plasma
autofluorescence(Ma et al, 2014b). This potentially circumvents the auto-
fluorescence problem in the plasma sample and problems related to the indirect
capture of NTBI by NTA.
The initial paper describing the bead method(Ma et al, 2014b) examined only 30
patients and did not, therefore, explore the variables affecting the agreement
between the NTA and the bead method systematically. In particular, the effects
of TfSat, chelators, splenectomy status and underlying diagnosis were not
explored. A recent round robin(de Swart et al, 2015) comparing various NTBI
and LPI methods on 60 patients, reported their overall lack of agreement in
absolute values despite similar correlations, but did not specifically look at the
agreement between these two methods and could not therefore comment on the
possible reasons for their poor agreement. Here, we compare levels of NTBI
detected by this assay with the NTA method in various clinical conditions,
including 122 iron-overloaded patients with approximately half (n=64) receiving
regular chelation therapy. Part of this work was presented as Abstract no. 241 at
BioIron Conference Sep 6-10, 2015 in Zhejiang University, China(Garbowski et
al, 2015a).
124
4.2 Materials and Methods
4.2.1 Patients
122 clinical blood samples from iron-overloaded patients and 13 healthy
volunteers, obtained from 3 hospitals (affiliations 2, 4 and 5), were analysed
using the CP851-NTBI assay and NTA-NTBI assay. Diagnoses included are
listed in Table 4-1. Ethical approval was obtained for the study at the respective
institutions where blood samples were collected and patients signed informed
consent forms before sample collection.
4.2.2 NTBI assays
4.2.2.1 NTA-NTBI assay
The NTA-NTBI method previously described(Singh et al, 1990) was adopted
with minor modifications. Briefly, 0.02mL of 800mM NTA (at pH=7) was added
to 0.18mL serum and allowed to stand for 30min at 22oC. The solution was
ultrafiltered using Whatman Vectaspin ultracentrifugation devices (30kDa) at
12320g. The ultrafiltrate was assayed by HPLC as described in 2.1.3.5
4.2.2.2 CP851 bead-NTBI assay
The assay was performed by Dr Yongmin Ma at King’s College London for
samples analysed in this chapter. The standards for this assay were prepared as
follows: 1mM iron-NTA complex (1:2.5 molar ratio), prepared from 100mM
NTA and 18mM atomic absorption standard iron solution, was diluted with
MilliQ water to a final concentration (f.c.) between 0-100µM. For the standard
curve, 120µL quantities of probe-labelled bead suspensions were incubated with
20µL of buffered NTA-iron solutions of known concentration for 20min at room
temperature, with subsequent addition of 20µL normal control serum (without
free iron) and 40µL paraformaldehyde (10% in MOPS) at 2% f.c. The
suspensions in sealed 96-well plates were incubated at 37oC for 16h with shaking
before fluorescence measurement by flow-cytometry. For serum samples of
unknown iron concentrations, 140µL quantities of beads were incubated with
20µL of serum samples for 20min, with subsequent addition of 40µL
paraformaldehyde at 2% (f.c.).
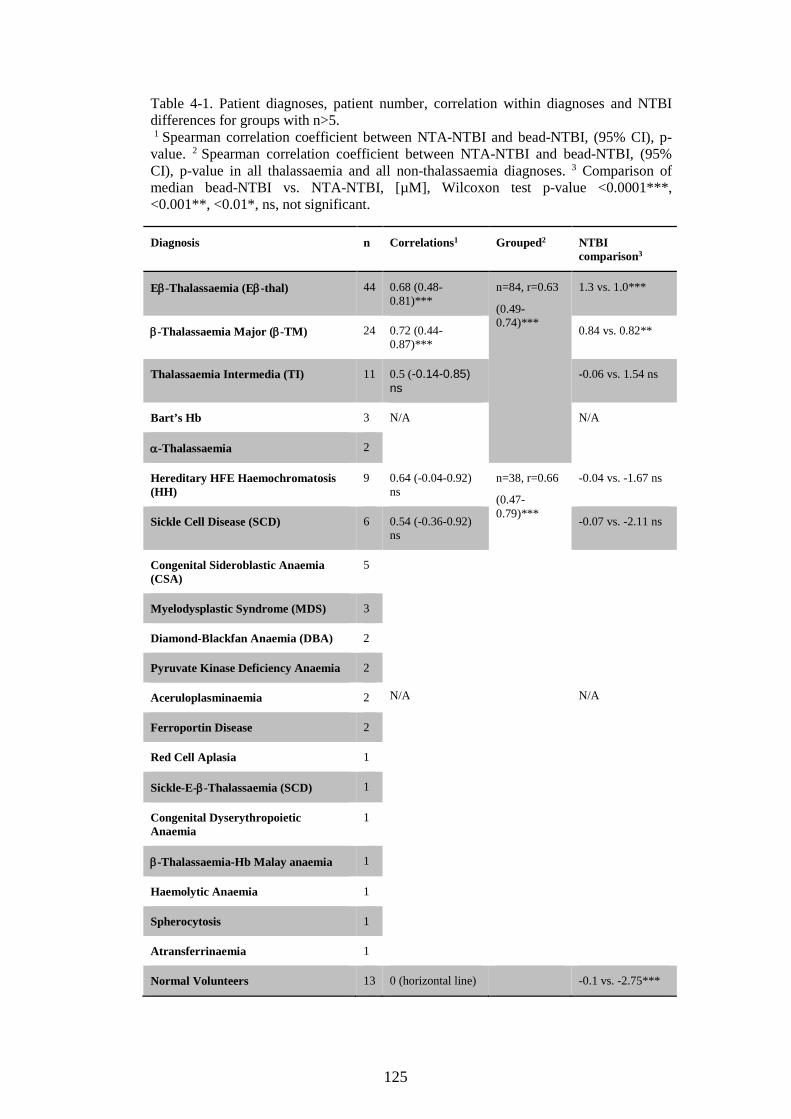
125
Table 4-1. Patient diagnoses, patient number, correlation within diagnoses and NTBI differences for groups with n>5. 1 Spearman correlation coefficient between NTA-NTBI and bead-NTBI, (95% CI), p-value. 2 Spearman correlation coefficient between NTA-NTBI and bead-NTBI, (95% CI), p-value in all thalassaemia and all non-thalassaemia diagnoses. 3 Comparison of median bead-NTBI vs. NTA-NTBI, [µM], Wilcoxon test p-value <0.0001***, <0.001**, <0.01*, ns, not significant.
Diagnosis n Correlations1 Grouped2 NTBI comparison3
Eβ-Thalassaemia (Eβ-thal) 44 0.68 (0.48-0.81)***
n=84, r=0.63
(0.49-0.74)***
1.3 vs. 1.0***
β-Thalassaemia Major (β-TM) 24 0.72 (0.44-0.87)***
0.84 vs. 0.82**
Thalassaemia Intermedia (TI) 11 0.5 (-0.14-0.85) ns
-0.06 vs. 1.54 ns
Bart’s Hb 3 N/A N/A
α-Thalassaemia 2
Hereditary HFE Haemochromatosis (HH)
9 0.64 (-0.04-0.92) ns
n=38, r=0.66
(0.47-0.79)***
-0.04 vs. -1.67 ns
Sickle Cell Disease (SCD) 6 0.54 (-0.36-0.92) ns
-0.07 vs. -2.11 ns
Congenital Sideroblastic Anaemia (CSA)
5
N/A
N/A
Myelodysplastic Syndrome (MDS) 3
Diamond-Blackfan Anaemia (DBA) 2
Pyruvate Kinase Deficiency Anaemia 2
Aceruloplasminaemia 2
Ferroportin Disease 2
Red Cell Aplasia 1
Sickle-E-β-Thalassaemia (SCD) 1
Congenital Dyserythropoietic Anaemia
1
β-Thalassaemia-Hb Malay anaemia 1
Haemolytic Anaemia 1
Spherocytosis 1
Atransferrinaemia 1
Normal Volunteers 13 0 (horizontal line) -0.1 vs. -2.75***
126
In this study, we used chelatable fluorescent beads (CFB) with normal human
mixed serum as a control to set up the fluorescence at 100% and the relative
fluorescence of CFB with patient serum was calculated accordingly.
Measurements were carried out on Beckman Coulter FC500 flow-cytometer and
analysis on Cell-Quest and FlowJo software. Gates were based on dot-plots of
untreated bead populations. Median fluorescence of 10,000 events was recorded
and corrected for bead auto-fluorescence. A standard curve was fitted with
variable-slope sigmoidal dose-response function.
4.2.3 Transferrin Saturation
TfSat was determined by the urea-gel method(Evans & Williams, 1980) with
band quantitation using Scion Image software, normal reference range 16-56%
(mean 36%). Dr P. Evans at Prof J. Porter laboratory, UCL, performed the assay.
4.2.4 Routine blood test results and standard of medical care monitoring
Haematology tests: FBC and red cell indices, reticulocytes, NRBC, serum ALT,
bilirubin, and ferritin were performed routinely in hospital laboratories, sTfR was
measured using ELISA (R&D Systems). Liver iron content (LIC) was obtained
from liver T2*(Garbowski et al, 2014) or liver R2 Ferriscan(Pierre et al, 2005),
and cardiac iron content (CIC) obtained from cardiac T2*(Carpenter et al, 2011).
Medical records review provided information about chelation therapy,
transfusion, and splenectomy status.
4.2.5 Statistics
The data was presented descriptively using mean±standard deviation (SD) or
median± interquartile range (IQR) where appropriate, differences between
subgroups were calculated using Wilcoxon test or paired t-test, dependent on
distribution assumptions. 95% confidence interval (CI) follows slope and
Spearman or Pearson correlation coefficient value in brackets. GraphPad Prism
Ver. 6.0 plots were used for slope comparison and Bland-Altman plots(Bland &
Altman, 1999) to illustrate agreement between methods. A p<0.05 was deemed
statistically significant.
127
4.3 Results
Correlations, distributions and agreement between NTA-NTBI and bead-NTBI
were first examined. The TfSat effects on measured values were compared,
followed by the effects of chelation therapy, erythropoiesis, storage iron and
splenectomy status on NTBI measured by both methods.
4.3.1 Correlation and agreement of the two assays in all samples
There was a medium-strong correlation between bead-NTBI and NTA-NTBI for
all samples (Figure 4-1A). Because negative values were obtained in the NTA
assay, the graph was re-plotted treating all negative values as zero (Figure 4-1C).
In Bland-Altman analysis (Figure 4-1B, D), the differences between methods
notably increased at mean NTBI>2.5µM being even greater above mean values
of 4µM. For mean values between <1 and 4µM the bias is not constant, being
negative at <0µM (NTA method less than bead method) and positive between 0
and 2µM (bead higher than NTA). Treating negative values as zero does not
improve agreement (Figure 4-1D), suggesting that negative values are not the
main reason for the lack of agreement.
4.3.2 The distribution of NTBI values by the two methods
The NTBI distributions for both methods differ considerably between the assays
(Figure 4-2A). With the NTA-NTBI (black) there is a clear population of
negative values that is absent with the bead-NTBI (red). There is then a second
population of positive NTA values (mode=1.5µM) that is absent with the bead-
NTBI where the mode=0µM. Finally, there is a long positive tail of high bead-
NTBI up to 14µM that is absent with the NTA method. Further analyses below
aim to determine the meaning of these distributional differences.
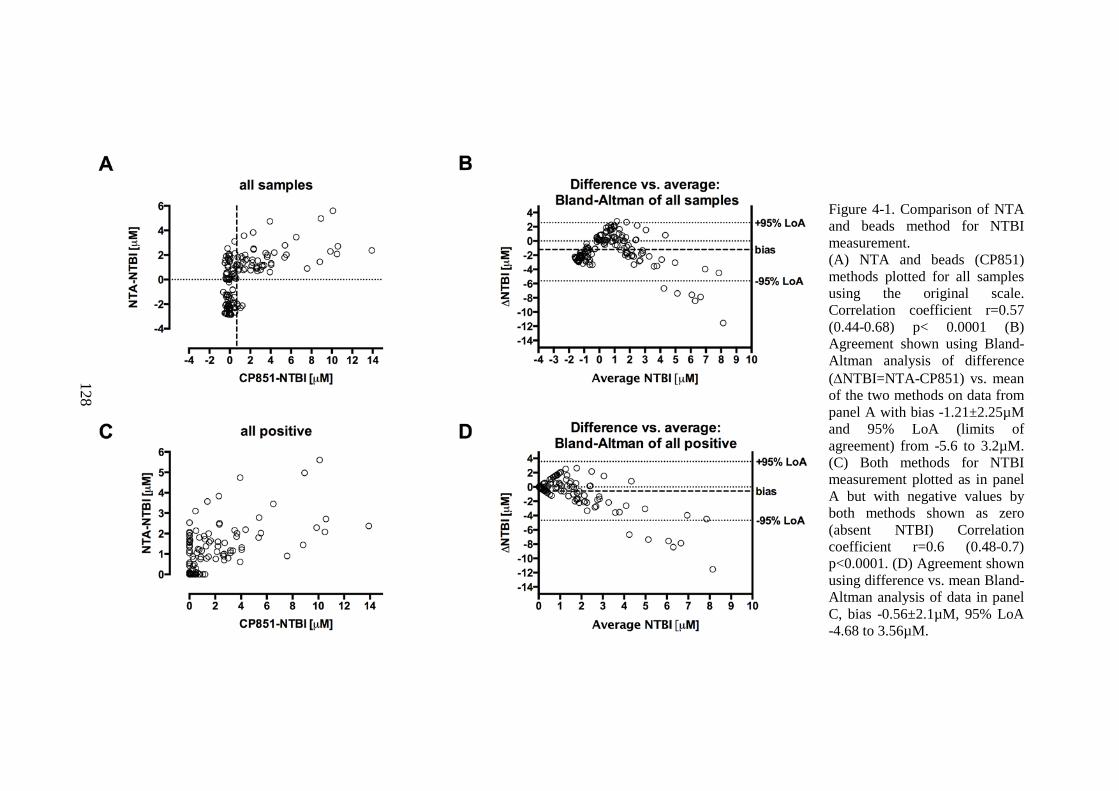
128
Figure 4-1. Comparison of NTA and beads method for NTBI measurement. (A) NTA and beads (CP851) methods plotted for all samples using the original scale. Correlation coefficient r=0.57 (0.44-0.68) p< 0.0001 (B) Agreement shown using Bland-Altman analysis of difference (∆NTBI=NTA-CP851) vs. mean of the two methods on data from panel A with bias -1.21±2.25µM and 95% LoA (limits of agreement) from -5.6 to 3.2µM. (C) Both methods for NTBI measurement plotted as in panel A but with negative values by both methods shown as zero (absent NTBI) Correlation coefficient r=0.6 (0.48-0.7) p<0.0001. (D) Agreement shown using difference vs. mean Bland-Altman analysis of data in panel C, bias -0.56±2.1µM, 95% LoA -4.68 to 3.56µM.
129
4.3.3 Relationship of TfSat to NTBI values by the two methods
4.3.3.1 NTBI values are related to TfSat by NTA assay but not bead assay.
The relationship of NTBI values by both methods to TfSat is presented in the
inset of Figure 4-2A. TfSat has a strong relationship to the NTA-NTBI over its
negative range, but not to the bead-NTBI. In particular, the NTA-NTBI values
fall with decreasing TfSat, unlike with the bead assay, with the NTA-NTBI
becoming negative for TfSat<80%, but no such effect is seen with the bead
method, which confirms previously published results on a smaller group of
patients(de Swart et al, 2015). Because of the relationship of NTBI to TfSat by
the NTA method and not the bead method, we examined the distribution of TfSat
shown in Figure 4-2B for the bead-NTBI (left) and NTA-NTBI (right) for
samples where positive (red) or negative (black) NTBI values were obtained. It
appears that whereas with the bead-NTBI TfSat has a similar (p=0.84)
distribution for patients with positive or negative NTBI values, by contrast, the
negative NTA-NTBI are largely confined to patients with TfSat<60% and the
positive values to patients with TfSat>80% (p<0.0001). This supports the
relevance of low TfSat to negative NTA-NTBI but not bead-NTBI values.
4.3.3.2 Relevance of high TfSat to false-positive values with NTA assay.
‘True-negative’ bead-NTBI values (below ULN=0.68µM i.e. 3xSD above
normal control mean=−0.1µM, SD=0.26µM, marked as dashed line in Figure
4-1A) were plotted against NTA-NTBI with the point size reflecting TfSat
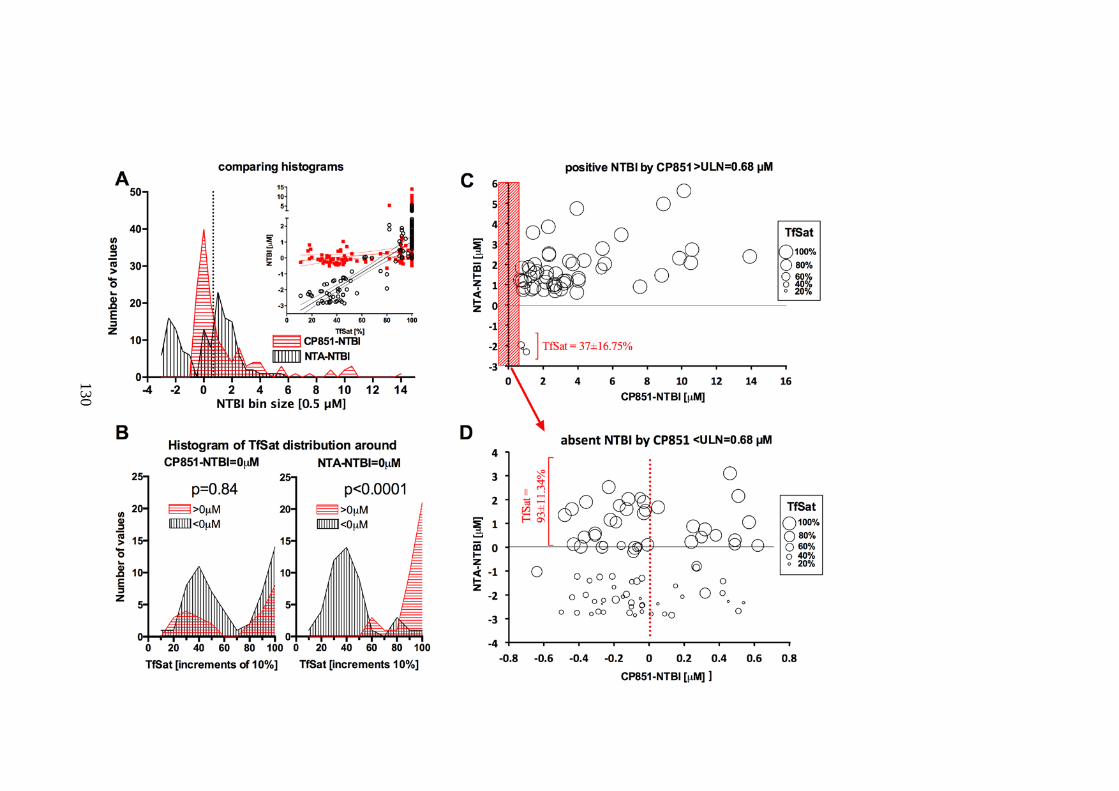
130
131
Figure 4-2. Distribution of CP851-NTBI, NTA-NTBI, and transferrin saturation values with analysis of false-positive and false-negative NTA-NTBI values (previous page). (A) Comparing frequency distribution histograms of CP851-NTBI (red) and NTA-NTBI (black) in 135 pairs; frequency (number of values) of NTBI per interval of 0.5µM(bin size) is shown. The inset shows a relationship between NTBI level and urea-gel TfSat for both methods: CP851-NTBI (red) and NTA-NTBI (black); best-fit linear regression slope differences (p<0.0001) with 100% TfSat points excluded from regression. (B) Plots of Tf saturation on x-axis (in 10% increments, bin centre) against frequency of TfSat observations (y-axis) for NTBI values < or > 0µM. The left panel shows bead method and right panel NTA method. The TfSat distributions for NTBI values > 0µM are significantly different from those under 0µM by the NTA method only (Mann-Whitney test); at low TfSat negative NTBI values are significantly more likely by NTA method and at high TfSat positive NTBI values are more likely by NTA method. These differences are not apparent by the beads method. (C) The plot of NTA-NTBI values vs. true-positive bead-NTBI values (above ULN=0.68µM - dashed line in Figure 4-1A), the size of the point reflects TfSat. Data in red-shaded box (below ULN) is shown in panel D. (D) Plot of NTA-NTBI vs. true-negative bead-NTBI (the red-shaded box in panel C corresponds to the data to the left of the dashed line in Figure 4-1A) with point size reflecting TfSat. Mean TfSat for NTA values >0µM was 93%, 19/36 were 100%, range 62-100%, median, 25th and 75th percentile: 100, 91, 100%. Mean TfSat for NTA values <0µM was 41.5%, 1/46 was 100%, range 11-100%, median, 25th and 75th percentile: 39.5, 31.5, 46%.
(Figure 4-2D, note Figure 4-2C,D are derived from Figure 4-1A). Positive NTA-
NTBI associates exclusively with high TfSat while negative NTA-NTBI almost
exclusively with low TfSat (93±11.3% vs. 41.5±18.2%, p<0.0001). This means
that the positive values by the NTA method that are negative by the bead method
associate with high TfSat and are ‘false-positive’. This is consistent with iron
being stripped off holotransferrin by NTA and not by CP851 (discussed). In
contrast, no such distributional TfSat differences were seen between the negative
and positive bead-NTBI values (on both sides of the red dotted line, Figure
4-2B,D). It is also possible that for other NTA-NTBI assays (N3 in the round
robin(de Swart et al, 2015), or using Co or Mn blocking(Breuer et al, 2000)) the
relationship with the TfSat may be different.
4.3.3.3 Relevance of low TfSat to false-negative values with NTA assay.
The NTA-NTBI values were plotted against ‘true-positive’ bead-NTBI values
(above ULN, Figure 4-2C, mark the range change on the x-axis in Figure 4-2C
vs. Figure 4-2D) with the point size reflecting TfSat. It appears that the ‘true-
positive’ bead-NTBI is also typically positive by the NTA method only when
associated with high TfSat. In the small number of values where the NTA-NTBI
is negative, TfSat is low. Thus ‘false-negative’ NTA-NTBI values occur only in
the presence of apotransferrin.
132
4.3.4 Relationship of chelation therapy and NTBI values by both methods
The presence of iron-chelate complexes or iron-free chelator, could in principle
influence the assay behaviour in vitro (Ma et al, 2014b; Aydinok et al, 2012;
Walter et al, 2008). We examined these potential effects by comparing values in
regularly chelated patients with those not receiving chelation. Both NTBI assays
are plotted for chelated and un-chelated patients in Figure 4-3A. The range of
values differs in the upper (no chelation) and lower panels (recent chelation),
particularly for the bead-NTBI (red), where there is a ‘tail’ of high values (5-
15µM) in chelated patients (Figure 4-3B,D). In principle, this could represent
iron-chelate complexes detected as bead-NTBI. With the NTA-NTBI (black), the
difference between chelated and un-chelated patients is subtler, but it appears
that the proportion of patients with negative values decreases while that of
patients with slightly positive values (up to 2µM) increases on chelation (Figure
4-3B,E). This could again represent the effects of iron-chelate complexes on the
assays.
In order to investigate this in more detail, the values obtained with both assays
were plotted for patients on different chelation regimens (Figure 4-3F,G,H,I).
Notably, values obtained on the same samples with the bead assay (max. 15µM)
are about 3-fold higher than with the NTA assay (max. 5µM) for deferiprone or
combination (desferrioxamine+deferiprone) treated patients but not for
deferasirox, where bead-NTBI values are actually lower than NTA-NTBI.
Patients receiving desferrioxamine usually show about 2-3-fold higher values
with the bead assay than the NTA-NTBI. NTBI levels correlated within the
desferrioxamine (0.47 (0.01, 0.77), p=0.05), and the deferiprone (0.62, (0.34,
0.81) p=0.0003) groups, but without agreement of absolute values, while in the
deferasirox patients correlation was absent.
Differences in patient sampling on deferasirox and deferiprone offer a partial
explanation. All patients receiving deferasirox had a 72h chelation washout,
strictly observed before sampling, making the presence of the contaminating
iron-deferasirox complexes unlikely. By contrast, in most of the deferiprone-
treated patient samples, where 72h washout was not observed, the iron-chelate

133
134
Figure 4-3. Effect of chelation on method agreement. (A). Comparison of NTBI distributions in patients not chelated (upper panel) and chelated (lower panel), red symbols show the bead CP851 assay and black symbols the NTA assay. (B) Comparison of NTA method vs. bead method in patients with (black) and without (red) chelation, of the outliers marked only the chelation ones were excluded from analysis in CDE. (C) Comparison of TfSat distributions in chelated and unchelated patients seen in B, Mann-Whitney test. (D) Comparison of CP851-NTBI in cheated and unchelated patients seen in B, Mann-Whitney test (E) Comparison of NTA-NTBI in chelated and unchelated patients seen in B, Mann-Whitney test. (F) NTA method vs. bead method in patients on deferasirox, no correlation (ns) (G) NTA method vs. bead method in patients on desferrioxamine, correlation coefficient r=0.47 (0.01-0.77), p=0.05. (H) NTA method vs. bead method in patients on deferiprone, correlation coefficient r=0.63 (0.34-0.81), p=0.0003. (I) NTA method vs. bead method in patients on combination therapy of deferiprone and Desferrioxamine, correlation coefficient r=0.78 (0.3-0.95), p=0.0076.
complexes would be expected to be present(Ma et al, 2014b; Aydinok et al,
2012). It appears that the complexes of deferiprone are more readily detectable as
bead-NTBI than NTA-NTBI but different incubation times within the assay
procedure are probably partly responsible for it. The detection of high levels by
the bead assay in 2 patients on desferrioxamine (Figure 4-3G) is not predicted
from in vitro evaluation of the bead assay(Ma et al, 2014b) and is difficult to
explain unless patients were taking deferiprone.
4.3.4.1 Deferasirox complexes are not available to the bead chelator.
The striking difference in CP851-NTBI values in patients on chelation invites
further research. The NTBI values by the bead method show much lower values
in deferasirox patients than in deferiprone or deferoxamine. It is likely that in the
latter two cases it is the chelate complexes with iron that are detected as NTBI,
although feroxamine should not donate iron to CP851 even in acidic pH (Ma et
al, 2014a). That complexes are not visible for deferasirox cases, as judged from
Figure 4-3F, despite the fact that the iron in DFX2Fe is completely available to
CP851 in vitro(Ma et al, 2014a), suggests that in vivo their availability to the
bead chelator is compromised and this may be an important observation that
needs to be made. If that were indeed the case, DFX patients would provide an
excellent control for NTBI measurement in chelated patients using the bead
assay, as it would detect the real NTBI, unadulterated by the iron in the chelates
complexes. We have hypothesised therefore that in vivo plasma albumin binding
of dfx2Fe prevents CP851 from accessing the chelate iron. This is probably
through a steric hindrance, CP851 being a hexadentate, and the albumin groove
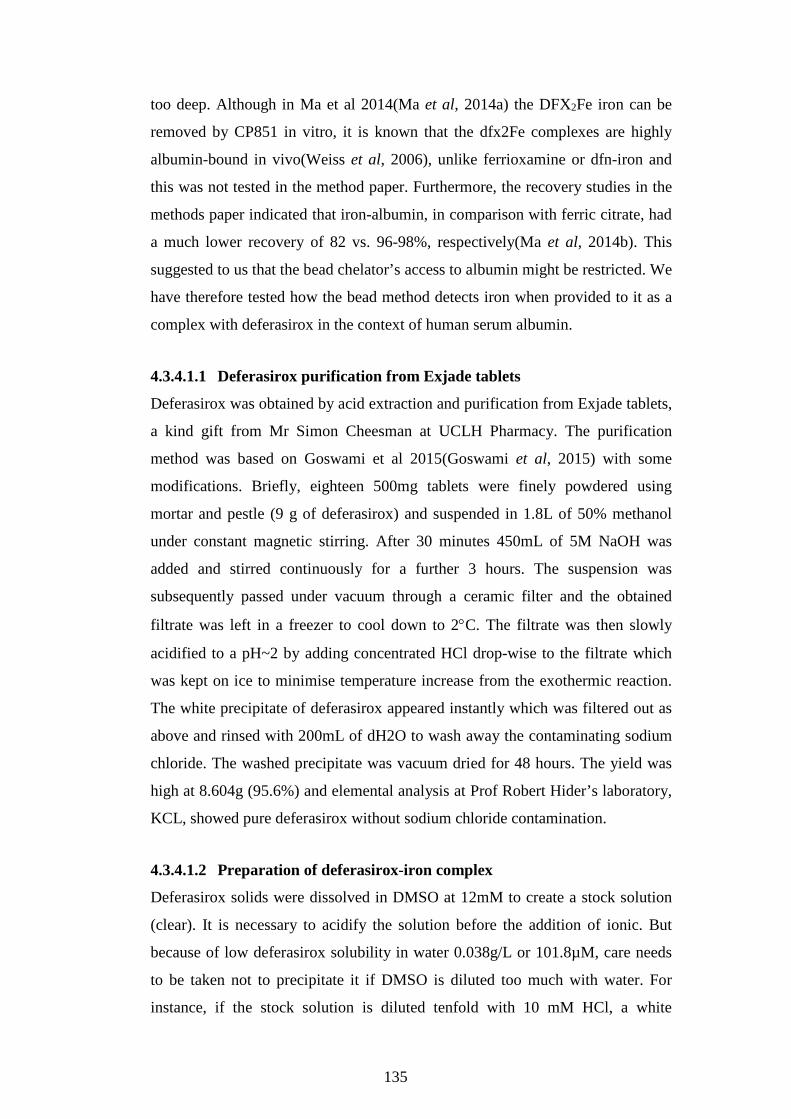
135
too deep. Although in Ma et al 2014(Ma et al, 2014a) the DFX2Fe iron can be
removed by CP851 in vitro, it is known that the dfx2Fe complexes are highly
albumin-bound in vivo(Weiss et al, 2006), unlike ferrioxamine or dfn-iron and
this was not tested in the method paper. Furthermore, the recovery studies in the
methods paper indicated that iron-albumin, in comparison with ferric citrate, had
a much lower recovery of 82 vs. 96-98%, respectively(Ma et al, 2014b). This
suggested to us that the bead chelator’s access to albumin might be restricted. We
have therefore tested how the bead method detects iron when provided to it as a
complex with deferasirox in the context of human serum albumin.
4.3.4.1.1 Deferasirox purification from Exjade tablets
Deferasirox was obtained by acid extraction and purification from Exjade tablets,
a kind gift from Mr Simon Cheesman at UCLH Pharmacy. The purification
method was based on Goswami et al 2015(Goswami et al, 2015) with some
modifications. Briefly, eighteen 500mg tablets were finely powdered using
mortar and pestle (9 g of deferasirox) and suspended in 1.8L of 50% methanol
under constant magnetic stirring. After 30 minutes 450mL of 5M NaOH was
added and stirred continuously for a further 3 hours. The suspension was
subsequently passed under vacuum through a ceramic filter and the obtained
filtrate was left in a freezer to cool down to 2°C. The filtrate was then slowly
acidified to a pH~2 by adding concentrated HCl drop-wise to the filtrate which
was kept on ice to minimise temperature increase from the exothermic reaction.
The white precipitate of deferasirox appeared instantly which was filtered out as
above and rinsed with 200mL of dH2O to wash away the contaminating sodium
chloride. The washed precipitate was vacuum dried for 48 hours. The yield was
high at 8.604g (95.6%) and elemental analysis at Prof Robert Hider’s laboratory,
KCL, showed pure deferasirox without sodium chloride contamination.
4.3.4.1.2 Preparation of deferasirox-iron complex
Deferasirox solids were dissolved in DMSO at 12mM to create a stock solution
(clear). It is necessary to acidify the solution before the addition of ionic. But
because of low deferasirox solubility in water 0.038g/L or 101.8µM, care needs
to be taken not to precipitate it if DMSO is diluted too much with water. For
instance, if the stock solution is diluted tenfold with 10 mM HCl, a white

136
precipitate of deferasirox is obtained, in accordance with the acid precipitation
method, see above. Thus 1mL of the DFX stock solution was diluted two-fold
with 0.66mL of 30mM HCl and 0.33mL of 18.036mM atomic absorption
standard FeCl3 in 1wt% HCl. The iron solution was added drop-wise whilst
vortexing. An indigo colour develops instantaneously and 2mL of 3mM DFX2Fe
in 50% DMSO and 10.45mM HCl is obtained (complex stock solution). This was
further diluted 50-fold to 60µM DFX2Fe in 20mM MOPS at pH 7.4 which was
chelexed overnight prior to the experiment. The final concentration of DMSO
was 1%. At the same time, human serum albumin was dissolved in double PBS
at 80g/L and chelexed overnight, a part of it was diluted to 20g/L with double
PBS. In order to bind DFX2Fe with albumin, a 1:1 vol/vol mix of chelexed
solutions of 60µM DFX2Fe in 20mM MOPS and 80g/L or 20g/L HSA in 2xPBS
was prepared and incubated at 37°C for one hour in a water bath. A blank control
(DFX2Fe in MOPS and PBS without albumin) was also prepared. The final
solutions obtained were 30µM DFX2Fe/10mM MOPS/40g/L HSA/PBS, 30µM
DFX2Fe/10mM MOPS/10g/L HSA/PBS, or 30µM DFX2Fe/10mM MOPS/PBS.
These solutions were then used as the unknowns in the bead-NTBI assay, see
2.1.3.6.
CP851 beads detected approximately 5µM iron as NTBI, which is almost
16.6±7.0% of the DFX2Fe iron control (30µM). This is in contrast to the original
Ma et al 2014 paper(Ma et al, 2014b) where the recovery was approx. 96%.
Albumin binding of DFX2Fe markedly inhibited (to 1.9±0.33%) the iron
exchange between DFX and CP851. Moreover, albumin showed dose response at
10g/L to 1.9±0.33% iron recovery, and at 40g/L to 1.1±0.12%, as seen in Figure
4-4.
We have demonstrated that albumin binding of the deferasirox-iron complexes
makes them inaccessible to the CP851 chelator in the bead assay. It is very likely
that this is the reason behind the results seen in Figure 4-3F, and that therefore
any NTBI detected in patients on DFX by the bead assay is much more likely to
represent the ‘true’ NTBI. This finding has implications for the measurement of
the DFX-iron complexes using the bead assay if it becomes possible to remove
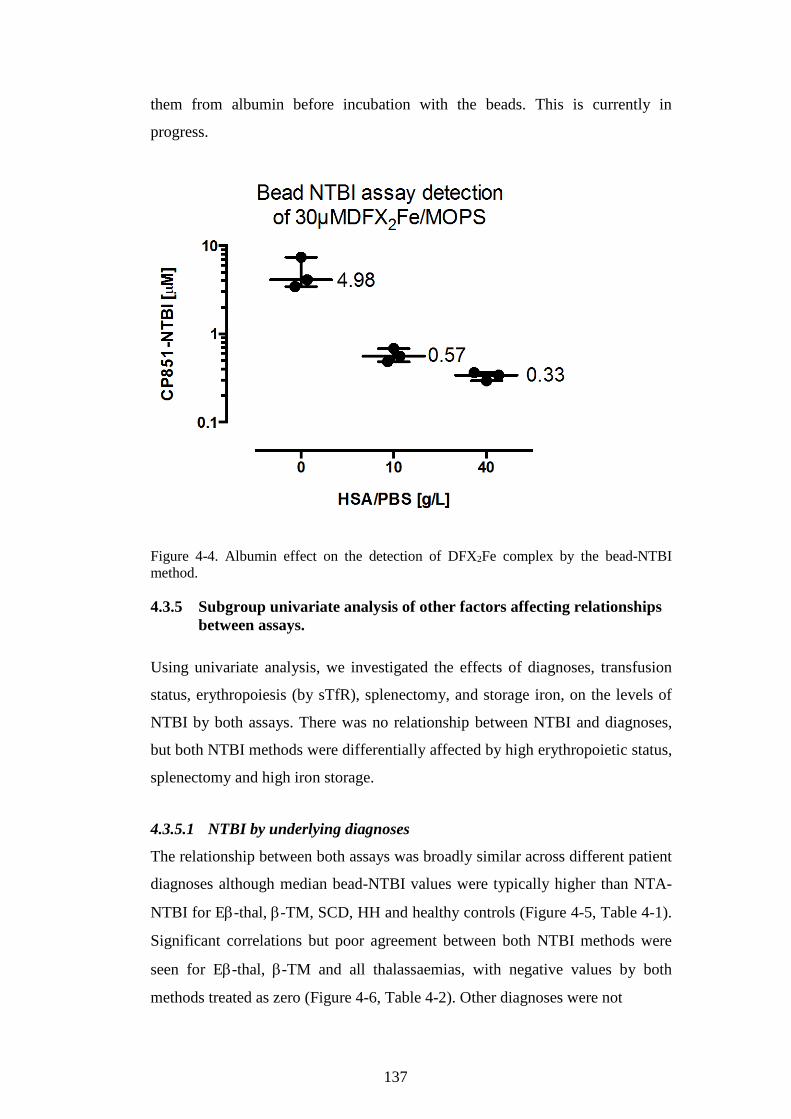
137
them from albumin before incubation with the beads. This is currently in
progress.
Figure 4-4. Albumin effect on the detection of DFX2Fe complex by the bead-NTBI method.
4.3.5 Subgroup univariate analysis of other factors affecting relationships between assays.
Using univariate analysis, we investigated the effects of diagnoses, transfusion
status, erythropoiesis (by sTfR), splenectomy, and storage iron, on the levels of
NTBI by both assays. There was no relationship between NTBI and diagnoses,
but both NTBI methods were differentially affected by high erythropoietic status,
splenectomy and high iron storage.
4.3.5.1 NTBI by underlying diagnoses
The relationship between both assays was broadly similar across different patient
diagnoses although median bead-NTBI values were typically higher than NTA-
NTBI for Eβ-thal, β-TM, SCD, HH and healthy controls (Figure 4-5, Table 4-1).
Significant correlations but poor agreement between both NTBI methods were
seen for Eβ-thal, β-TM and all thalassaemias, with negative values by both
methods treated as zero (Figure 4-6, Table 4-2). Other diagnoses were not
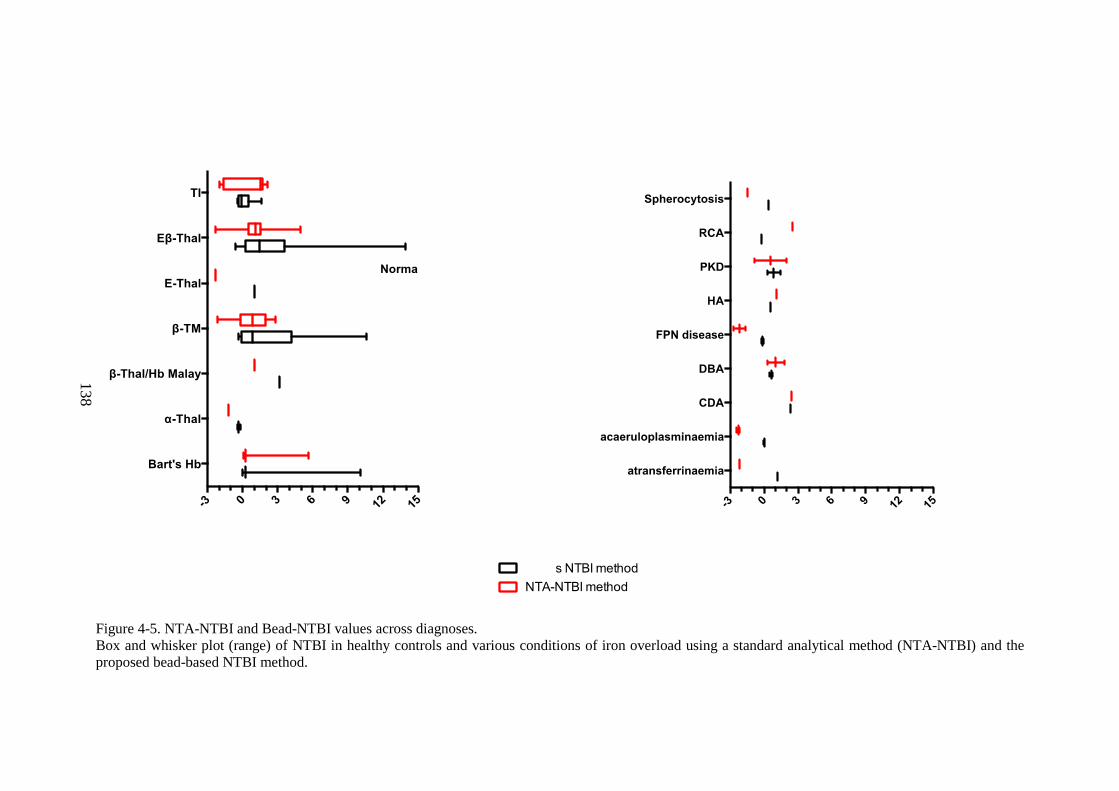
138
Figure 4-5. NTA-NTBI and Bead-NTBI values across diagnoses. Box and whisker plot (range) of NTBI in healthy controls and various conditions of iron overload using a standard analytical method (NTA-NTBI) and the proposed bead-based NTBI method.

139
sufficiently represented to draw correlation or agreement conclusions, however
in the non-thalassaemic group as a whole, the correlation was significant (Table
4-1). Normal control samples neither correlated nor agreed between the two
assays but their bias could be corrected for ( Figure 4-6L).

140
Figure 4-6. Comparison and Bland-Altman analysis of agreement of NTA and CP851-NTBI methods in different diagnosis groups.
Negative values by both methods have been treated as zero. (A-B) all diagnoses; slope p<0.0001. (C-D) beta-Thalassaemia Major; slope p<0.0001. (E-F) Eβ-Thalassamia; slope p<0.0001. (G-H) thalassaemia intermedia; slope not significant. (I-J) all thalassaemias; slope p<0.0001. (K-L) normal volunteers; slope not significant. All
Bland-Altman analyses show lack of acceptable agreement except for the normal samples where the low scatter systematic bias could be corrected for using the formula (239.1±35.12[%]*avgNTBI[µM]+527.3±50[%])(Bland & Altman, 1999).
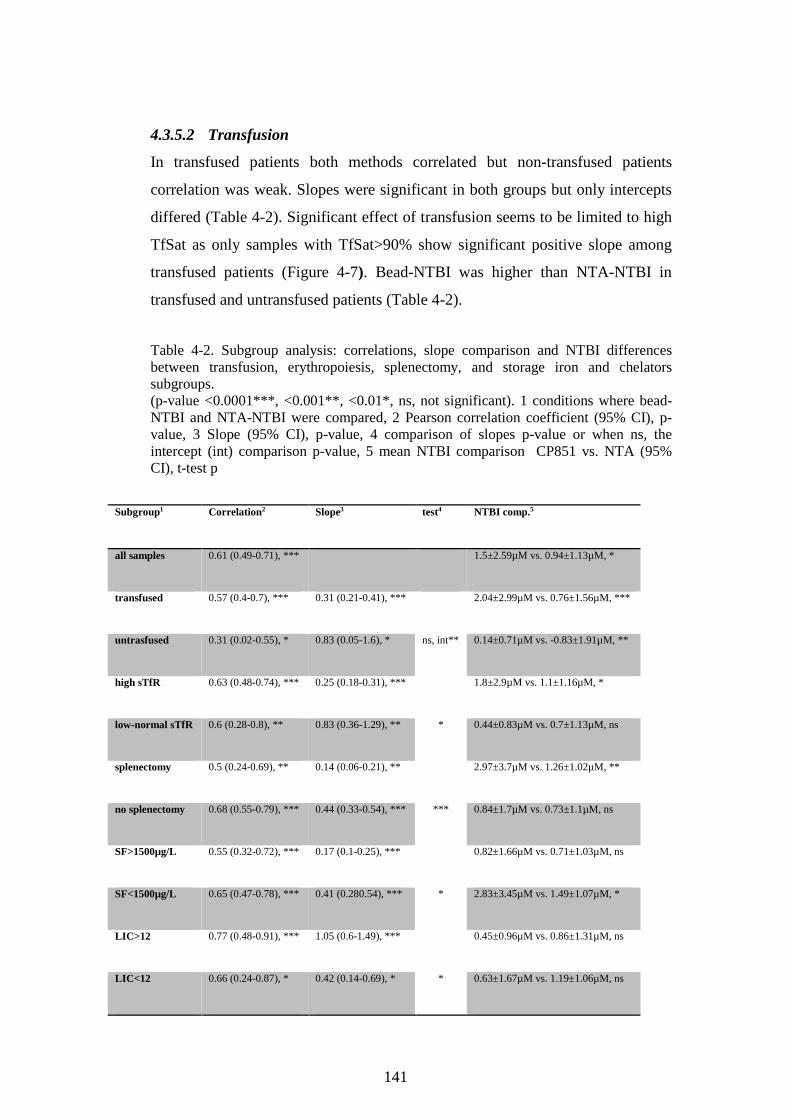
141
4.3.5.2 Transfusion
In transfused patients both methods correlated but non-transfused patients
correlation was weak. Slopes were significant in both groups but only intercepts
differed (Table 4-2). Significant effect of transfusion seems to be limited to high
TfSat as only samples with TfSat>90% show significant positive slope among
transfused patients (Figure 4-7). Bead-NTBI was higher than NTA-NTBI in
transfused and untransfused patients (Table 4-2).
Table 4-2. Subgroup analysis: correlations, slope comparison and NTBI differences between transfusion, erythropoiesis, splenectomy, and storage iron and chelators subgroups. (p-value <0.0001***, <0.001**, <0.01*, ns, not significant). 1 conditions where bead-NTBI and NTA-NTBI were compared, 2 Pearson correlation coefficient (95% CI), p-value, 3 Slope (95% CI), p-value, 4 comparison of slopes p-value or when ns, the intercept (int) comparison p-value, 5 mean NTBI comparison CP851 vs. NTA (95% CI), t-test p
Subgroup1 Correlation2 Slope3 test4 NTBI comp.5
all samples 0.61 (0.49-0.71), *** 1.5±2.59µM vs. 0.94±1.13µM, *
transfused 0.57 (0.4-0.7), *** 0.31 (0.21-0.41), ***
ns, int**
2.04±2.99µM vs. 0.76±1.56µM, ***
untrasfused 0.31 (0.02-0.55), * 0.83 (0.05-1.6), * 0.14±0.71µM vs. -0.83±1.91µM, **
high sTfR 0.63 (0.48-0.74), *** 0.25 (0.18-0.31), ***
*
1.8±2.9µM vs. 1.1±1.16µM, *
low-normal sTfR 0.6 (0.28-0.8), ** 0.83 (0.36-1.29), ** 0.44±0.83µM vs. 0.7±1.13µM, ns
splenectomy 0.5 (0.24-0.69), ** 0.14 (0.06-0.21), **
***
2.97±3.7µM vs. 1.26±1.02µM, **
no splenectomy 0.68 (0.55-0.79), *** 0.44 (0.33-0.54), *** 0.84±1.7µM vs. 0.73±1.1µM, ns
SF>1500µg/L 0.55 (0.32-0.72), *** 0.17 (0.1-0.25), ***
*
0.82±1.66µM vs. 0.71±1.03µM, ns
SF<1500µg/L 0.65 (0.47-0.78), *** 0.41 (0.280.54), *** 2.83±3.45µM vs. 1.49±1.07µM, *
LIC>12 0.77 (0.48-0.91), *** 1.05 (0.6-1.49), ***
*
0.45±0.96µM vs. 0.86±1.31µM, ns
LIC<12 0.66 (0.24-0.87), * 0.42 (0.14-0.69), * 0.63±1.67µM vs. 1.19±1.06µM, ns
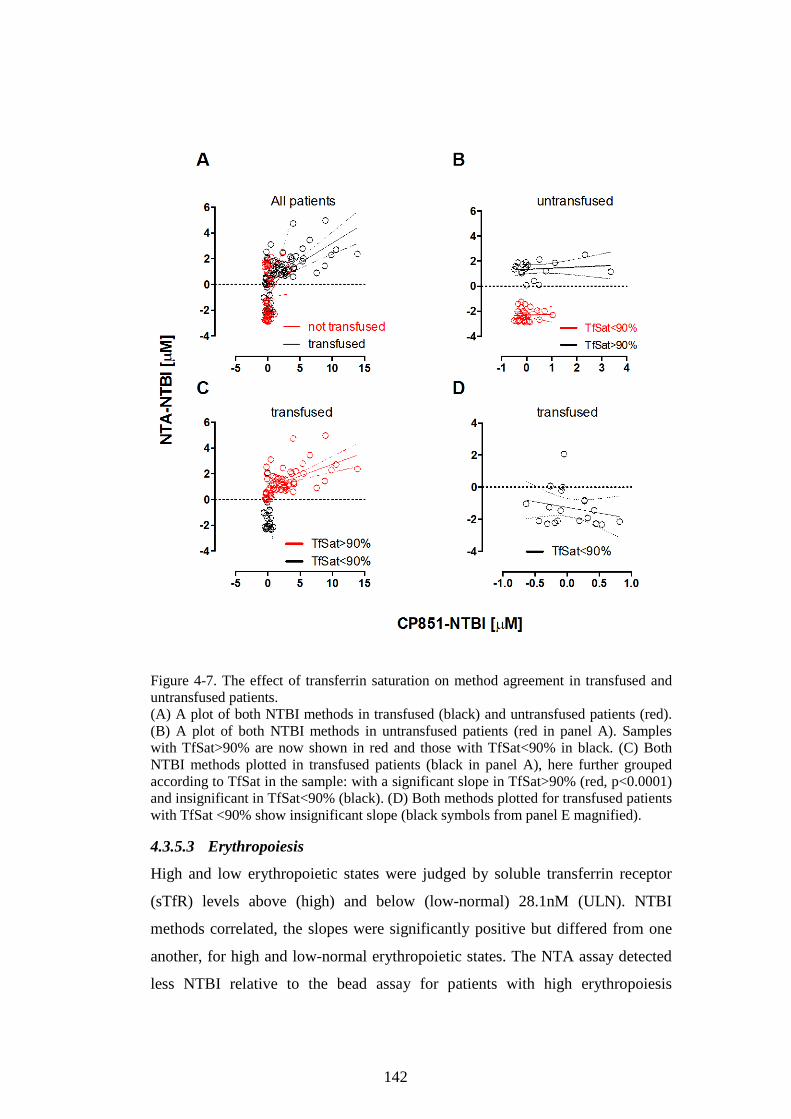
142
Figure 4-7. The effect of transferrin saturation on method agreement in transfused and untransfused patients. (A) A plot of both NTBI methods in transfused (black) and untransfused patients (red). (B) A plot of both NTBI methods in untransfused patients (red in panel A). Samples with TfSat>90% are now shown in red and those with TfSat<90% in black. (C) Both NTBI methods plotted in transfused patients (black in panel A), here further grouped according to TfSat in the sample: with a significant slope in TfSat>90% (red, p<0.0001) and insignificant in TfSat<90% (black). (D) Both methods plotted for transfused patients with TfSat <90% show insignificant slope (black symbols from panel E magnified).
4.3.5.3 Erythropoiesis
High and low erythropoietic states were judged by soluble transferrin receptor
(sTfR) levels above (high) and below (low-normal) 28.1nM (ULN). NTBI
methods correlated, the slopes were significantly positive but differed from one
another, for high and low-normal erythropoietic states. The NTA assay detected
less NTBI relative to the bead assay for patients with high erythropoiesis
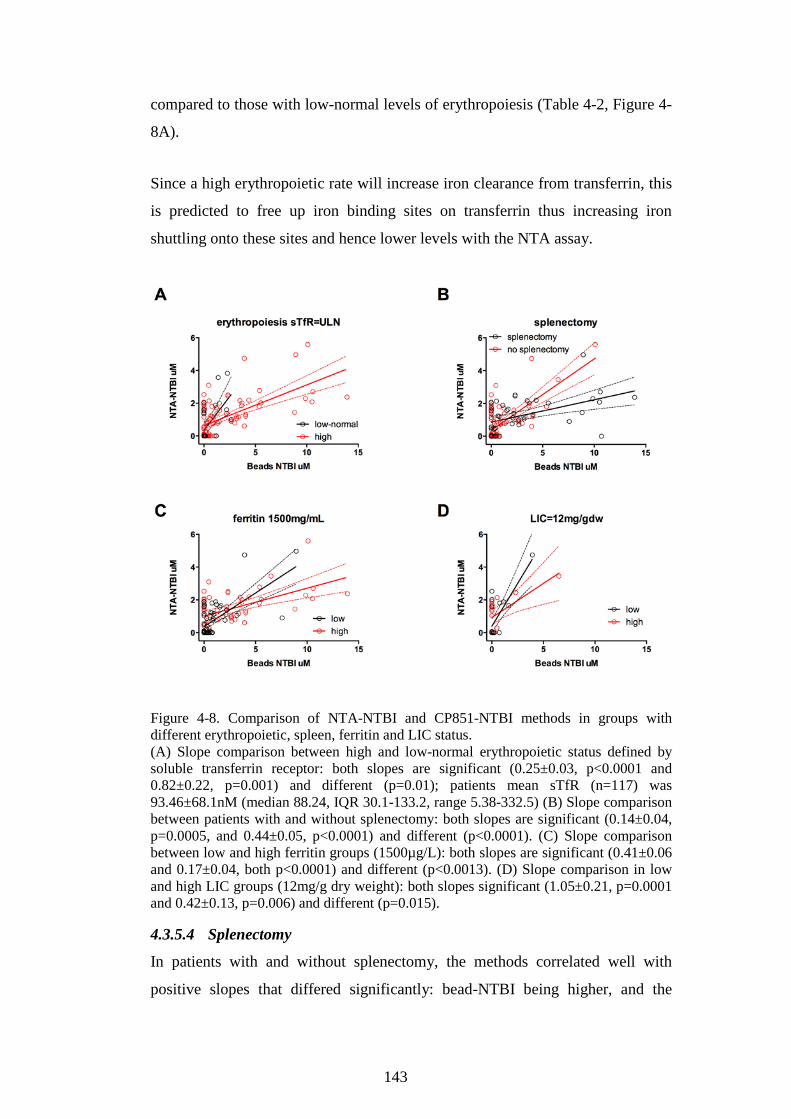
143
compared to those with low-normal levels of erythropoiesis (Table 4-2, Figure 4-
8A).
Since a high erythropoietic rate will increase iron clearance from transferrin, this
is predicted to free up iron binding sites on transferrin thus increasing iron
shuttling onto these sites and hence lower levels with the NTA assay.
Figure 4-8. Comparison of NTA-NTBI and CP851-NTBI methods in groups with different erythropoietic, spleen, ferritin and LIC status. (A) Slope comparison between high and low-normal erythropoietic status defined by soluble transferrin receptor: both slopes are significant (0.25±0.03, p<0.0001 and 0.82±0.22, p=0.001) and different (p=0.01); patients mean sTfR (n=117) was 93.46±68.1nM (median 88.24, IQR 30.1-133.2, range 5.38-332.5) (B) Slope comparison between patients with and without splenectomy: both slopes are significant (0.14±0.04, p=0.0005, and 0.44±0.05, p<0.0001) and different (p<0.0001). (C) Slope comparison between low and high ferritin groups (1500µg/L): both slopes are significant (0.41±0.06 and 0.17±0.04, both p<0.0001) and different (p<0.0013). (D) Slope comparison in low and high LIC groups (12mg/g dry weight): both slopes significant (1.05±0.21, p=0.0001 and 0.42±0.13, p=0.006) and different (p=0.015).
4.3.5.4 Splenectomy
In patients with and without splenectomy, the methods correlated well with
positive slopes that differed significantly: bead-NTBI being higher, and the

144
difference between methods being greater in splenectomised than un-
splenectomised patient (Figure 4-8B, Table 4-2).
4.3.5.5 Storage iron
For high- and low-ferritin patient groups (above or below 1500 µg/L), methods
correlated well with significantly different positive slopes. There was a greater
discrepancy between NTBI levels in the high ferritin than the low ferritin group
(Figure 4-8C, Table 4-2): for similar CP851-NTBI values, NTA method gives
lower NTBI values in the former and higher in the latter group above about 2µM
bead-NTBI threshold. Methods were also compared in LIC groups below and
above 12mg/g dry weight (SF=1500µg/L corresponds in our study to
LIC=12mg/g dry weight) showing medium correlation and significantly different
positive slopes. In high LIC group, the discrepancy between methods was greater
(Figure 4-8D, Table 4-2). NTBI differences were insignificant on direct
comparison: not all patients had LIC available (n=35 vs. n=109 for ferritin), so
the comparison may be underpowered to detect differences. Taken together these
findings show that at high storage iron (LIC or SF) the extent to which bead-
NTBI values exceed NTA-NTBI is increased.
4.3.6 Multiple regression
Multiple linear regression models were built to test which predictors explain
differences between the NTA-NTBI and the bead-NTBI. The same or additional
predictors may resurface as relevant when the absolute difference (bias) between
methods is modelled and this was attempted as a control analysis. Furthermore,
we have modelled transferrin saturation using the same set of potential predictors
as for the other models (Table 4-3). The bead-NTBI model explained 25% of the
variability in NTBI using TfSat, splenectomy, and DFO+DFP as positive
predictors. The NTA-NTBI model explained >75% of the variability in NTBI,
with TfSat, splenectomy as positive, and sTfR as negative predictors. The bias
model, i.e. the difference CP851-NTBI less NTA-NTBI, was predicted
negatively by TfSat and DFX, and positively by splenectomy, DFO+DFP,
chelation (yes/no), and “normal”, in a model explaining 24% of the NTBI
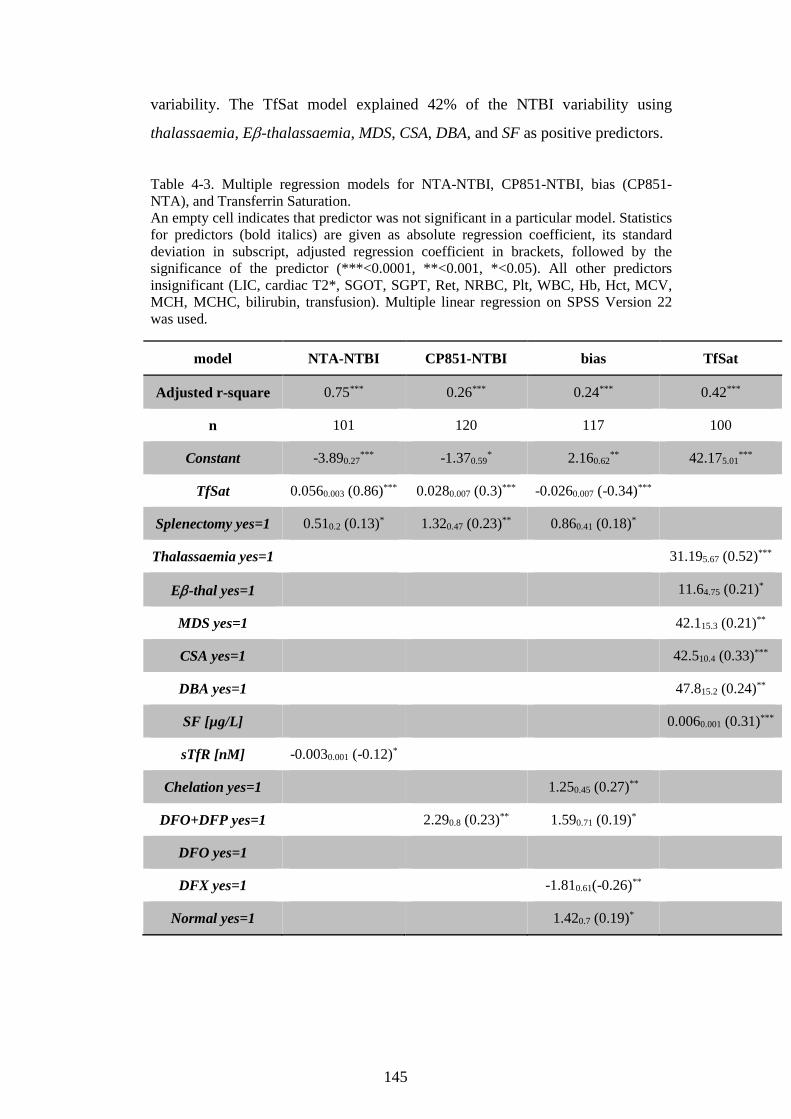
145
variability. The TfSat model explained 42% of the NTBI variability using
thalassaemia, Eβ-thalassaemia, MDS, CSA, DBA, and SF as positive predictors.
Table 4-3. Multiple regression models for NTA-NTBI, CP851-NTBI, bias (CP851-NTA), and Transferrin Saturation. An empty cell indicates that predictor was not significant in a particular model. Statistics for predictors (bold italics) are given as absolute regression coefficient, its standard deviation in subscript, adjusted regression coefficient in brackets, followed by the significance of the predictor (***<0.0001, **<0.001, *<0.05). All other predictors insignificant (LIC, cardiac T2*, SGOT, SGPT, Ret, NRBC, Plt, WBC, Hb, Hct, MCV, MCH, MCHC, bilirubin, transfusion). Multiple linear regression on SPSS Version 22 was used.
model NTA-NTBI CP851-NTBI bias TfSat
Adjusted r-square 0.75*** 0.26*** 0.24*** 0.42***
n 101 120 117 100
Constant -3.890.27*** -1.370.59
* 2.160.62** 42.175.01
***
TfSat 0.0560.003 (0.86)*** 0.0280.007 (0.3)*** -0.0260.007 (-0.34)***
Splenectomy yes=1 0.510.2 (0.13)* 1.320.47 (0.23)** 0.860.41 (0.18)*
Thalassaemia yes=1 31.195.67 (0.52)***
Eβ-thal yes=1 11.64.75 (0.21)*
MDS yes=1 42.115.3 (0.21)**
CSA yes=1 42.510.4 (0.33)***
DBA yes=1 47.815.2 (0.24)**
SF [µg/L] 0.0060.001 (0.31)***
sTfR [nM] -0.0030.001 (-0.12)*
Chelation yes=1 1.250.45 (0.27)**
DFO+DFP yes=1 2.290.8 (0.23)** 1.590.71 (0.19)*
DFO yes=1
DFX yes=1 -1.810.61(-0.26)**
Normal yes=1 1.420.7 (0.19)*
146
4.4 Discussion
This study examined a range of iron-overloaded patients with and without iron
chelation, which allowed comparison of the established NTA-based NTBI assay
(NTA-NTBI) with a novel fluorescent bead-based assay (bead-NTBI) under a
wide range of clinical conditions. Overall, while significant correlations exist
between both methods, absolute values differ with wide 95% limits of
agreement, consistent with the recent round-robin of NTBI assays(de Swart et al,
2015). Here, by comparing values in a large number of iron-overloaded patients,
we examine how both assays are differently affected by identifiable variables.
These are relevant to the application and interpretation of both NTBI assays in
specific patient populations. Two systematic differences between the assays have
been identified. Firstly, the NTA-NTBI is highly affected by TfSat, leading to
under-estimations at low TfSat and over-estimation once transferrin is saturated.
By contrast, the bead-NTBI is less dependent on either high or low TfSat.
Secondly, while both assays give increased NTBI values in recently deferiprone-
treated patients, due to detection of chelate-iron complexes, this effect is more
pronounced with the bead-NTBI, leading to a further lack of agreement between
the two assays.
Inspection of the NTBI distribution histograms for both assays, combined with
the knowledge of the contrasting chelating properties of NTA and the
hexadentate CP851 used in the bead method, provides insight into why the
agreement is not high. With the NTA-NTBI, two major peaks are seen, first
centring on -2.5µM, and the second peak on 1.5µM skewed rightwards. With the
bead-NTBI, these peaks are essentially absent with most low values clustered
around zero and with a much more pronounced right skew for positive NTBI.
These differences are consistent with the known properties of the ‘capture’
mechanisms of the assay chelators. Negative NTBI values obtained with the
NTA method have been attributed to shuttling of iron present in 80mM NTA
onto apotransferrin during the initial incubation(Porter et al, 1996; Evans et al,
2010; Srichairatanakool, S., Kemp, P. and Porter, 1997). This shuttling iron
donation effect, due the greater stability of the hexadentate bead chelators, is
absent in the bead method(Ma et al, 2014b). 80mM NTA not only donates

147
chelated iron to iron-binding apotransferrin sites but also removes iron from
holotransferrin in a time- and concentration-dependent manner(Gosriwatana et
al, 1999), so that at 30 minutes 80mM NTA mobilised 1-2% of transferrin iron
(physiological concentration, TfSat=50%). This represents 0.35-0.7µM
transferrin-bound iron potentially detected as ‘NTBI’ but could be as much as
1.4µM with TfSat=100% in our patients. Others noted similar effects(Ito et al,
2014; Makino et al, 2014).
The impact of such high iron removal from transferrin has not been previously
characterised and here the comparison with the bead method, where iron is not
stripped from holotransferrin (<0.2%) by the hexadentate chelator(Ma et al,
2014b), demonstrates this effect more clearly. Given the robustness towards
transferrin of the bead-assay, it can be used as a reference in an attempt to
examine transferrin dependence of the NTA-method. Closer inspection of the
normal and pathological bead-NTBI distributions suggests a cut-off above which
values can be regarded as ‘true-positive’ and provides supportive evidence for
the mechanisms underlying ‘false-positive’ and ‘false-negative’ values obtained
with the NTA assay. With the bead-NTBI, values centring in the narrow
dominant peak around the mode -0.04µM (Figure 4-2A) are likely to represent
an absence of true NTBI, given the comparable spread around the mean of the
normal serum samples (-0.1±0.26µM with ULN of 0.68µM mean+3SD,
SD=0.26µM, Figure 4-2A, Figure 4-6K). Bead-NTBI values >0.68µM are
therefore likely to represent ‘true-positive’ NTBI. Clearly ‘false-negative’ values
by the NTA method would then be those negative values obtained when the bead
assay gives positive values >0.68µM. When this was checked, all the ‘false-
negative’ NTA values occurred in samples with non-saturated transferrin (45, 18,
48%, Figure 4-2C) where the predicted percentage of apotransferrin, that can act
as acceptor for iron shuttled by NTA, approaches 30%, 65% and 28%
respectively(Huebers & Finch, 1987). By contrast, ‘false-positive’ NTA-NTBI
would be those positive values that correspond to bead-NTBI<0.68µM. All such
‘false-positive’ NTA values had highly saturated transferrin (mean 93%, range
62-100%) supporting the concept that such ‘false-positive’ NTBI values are
obtained from the scavenging of iron from highly saturated transferrin.

148
The second factor, contributing to differences between both assays, is the effect
of iron chelators or their iron complexes. With the NTA-NTBI, iron-free
chelators present in plasma can act as acceptors for NTA-bound iron, potentially
leading to the NTBI underestimation(Evans et al, 2010; Srichairatanakool, S.,
Kemp, P. and Porter, 1997). This donation can be blocked in the NTA assay by
adding an excess of aluminium to samples before processing (Walter et al, 2008;
Srichairatanakool, S., Kemp, P. and Porter, 1997). This is not a problem for the
bead-NTBI, as the greater stability of the CP851-iron complex prevents iron
donation to iron-free chelators in samples(Ma et al, 2014b). The iron complexes
of some chelators can also potentially interfere with the NTBI determination:
with the NTA-method, the deferiprone-iron complexes are detected as ’NTBI’ up
to 1 week following drug cessation(Aydinok et al, 2012). In principle, the bead
assay can also detect such complexes of deferiprone(Ma et al, 2014b), and
indeed, our findings here suggest that these are detected to a greater extent than
with the NTA assay (Figure 4-3G,H,I).
Due to the high stability of feroxamine (1:1 iron(III):deferoxamine), the bead-
assay removes only a negligible amount of iron from DFO-iron complexes(Ma et
al, 2014b). Given this observation, it is difficult to explain the presence of two
outliers in Figure 4-3G and perhaps the iron-binding DFO metabolites should be
considered. In the deferasirox-treated patients, NTBI is lower than in the other
chelators using both assays but especially with the bead-assay, with values <1µM
(Figure 4-3F). This may reflect superior NTBI removal with deferasirox or that
patients in this group had 72h washout from chelators, allowing full clearance of
deferasirox-iron complexes. These complexes may clear more rapidly than those
of deferiprone which are measurable >1 week after the last chelation
dose(Aydinok et al, 2012). Thus in patients who are on regular chelation therapy,
interpretation of NTBI values needs to be made with reference to the timing of
sampling, particularly with the bead-assay which has a high affinity for iron-
deferiprone and iron-deferasirox complexes(Ma et al, 2014b).
Clinical factors potentially affecting the detection levels of both NTBI assays
were examined. Underlying diagnoses in themselves did not show significant
differences between assays (Table 4-3) but the extent of erythropoiesis did
149
(Figure 4-8A): higher sTfR levels (and hence greater erythropoiesis and iron
removal from transferrin) reduce NTA-NTBI, but not bead-NTBI values. As
lower TfSat associates with decreased NTBI values due to NTA shuttling iron
onto transferrin, clearance of transferrin-bound iron by enhanced erythropoiesis
may increase iron shuttling by NTA and hence lower measured values. Negative
prediction of the bias by TfSat suggests that the methods are differentially
affected by TfSat, consistent with the methodological dependence of the NTA
method on TfSat where NTA strips iron from transferrin, with NTBI
overestimation rendering the bias lower. Likewise, DFX negatively predicts the
bias because it affects only the bead-NTBI (Figure 4-3F), and this is a key issue
we are currently investigating. Normal status increases the bias by rendering
NTA values negative (ApoTf). Chelation increases the difference because it
increases the bead-NTBI more than the NTA-NTBI when detecting deferiprone-
iron complexes. Splenectomy predicts NTBI by either method using multivariate
analysis and also associates with higher NTBI (by 0.5 or 1.3µM, Table 4-3). That
splenectomy predicts bias is interesting while at the same time being a positive
predictor of both methods separately, because it implies that bead assay detects
more NTBI in splenectomised patients rather than that the NTA method detects
less (Figure 4-8B), suggesting it differentially affects the manner in which both
methods may detect NTBI (splenectomy-dependent NTBI speciation
differences). Higher NTA-NTBI in splenectomised TI patients was
reported(Taher et al, 2009), as was a greater risk of myocardial iron deposition
post-splenectomy(Aydinok et al, 2011). The mechanism for higher NTBI post-
splenectomy is unclear but we suggest may relate to erythrocyte destruction
being diverted from the spleen to the bone marrow. With relatively hypoxic bone
marrow environment, oxidation from Fe2+ to Fe3+ will have slower kinetics,
hence slower iron binding to transferrin, and a greater propensity to plasma
NTBI formation. Similarly, higher levels of iron overload (SF or LIC) are
associated with higher bead-NTBI than NTA-NTBI values, suggesting the bead
method may detect some iron species associated with iron overload that are
relatively unavailable for capture using the NTA method.
Unlike the NTBI values by either method, the TfSat is notably predicted by
diagnoses and ferritin in our cohort. In the explanation of the ferritin effect on
150
TfSat but not on NTBI (the latter also reported recently(de Swart et al, 2015)),
we distinguished plasma iron compartment into the transferrin part, changing
dynamically below 100% (TBI), and into NTBI part, typically present when
transferrin is 100% saturated (TfSat is not changing dynamically anymore). This
means that ferritin as a predictor of TfSat marks the independent effect of the
degree of tissue iron overload on the changes in the transferrin part of plasma
iron compartment (i.e. TfSat increases when ferritin increases), but such
independent effect on the level of NTBI, once TfSat is saturated, is absent. In
other words, if NTBI is considered in a continuum with TBI above the saturation
point of Tf, it is evident that that plasma iron above the saturation point of Tf
(NTBI) does not associate with ferritin (and therefore with iron overload) while
the plasma iron on transferrin does. This is very interesting to us because it may
suggest that regulation of serum iron varies by compartment: NTBI is less
dependent for its generation and persistence on iron overload per se, and likely
more dependent on other factors such as those that determine its removal rather
than generation (tissue uptake – erythroid, hepatic)(Porter et al, 2014; Garbowski
et al, 2015b). Finally, that sTfR does not predict TfSat but does negatively
predict NTBI implies that the rate of transferrin off-loading in the marrow may
affect the NTBI compartment without apotransferrin being detected
peripherally(Garbowski et al, 2015b).
In conclusion, we have identified that the TfSat in the blood sample affects
values obtained with the NTA assay to a greater extent than with the bead assay.
This results from iron donation to apotransferrin by NTA and/or stripping of iron
from saturated transferrin by NTA. Neither of these effects is significant with the
bead assay, which may, therefore, be more specific for true NTBI determination.
These findings are consistent with first principles, namely differential access to
transferrin iron of both methods, but other mechanisms may be involved, which
require further systematic study. The presence of iron-chelate complexes in
patients on chelation, particularly with deferiprone, increases values obtained
with the bead assay more than with the NTA assay. Recent chelation history
(minimum a week before blood sampling) needs accounting for when
interpreting NTBI values obtained with either method. Other differences between
the assays regarding the effects of splenectomy, levels of iron overload and

151
endogenous erythropoiesis are consistent with both assays differentially
accessing NTBI pools that vary with these clinical variables. Future work will
need to identify whether NTBI values obtained with the bead assay are more
clinically predictive of trends, such as myocardial iron deposition than with the
NTA assay. The effects of sample timing in relation to currently available
chelation therapies need to be further defined with both assays.
152
Chapter 5 Effect of NTBI speciation (Fe:citrate ratio) and apotransferrin on iron uptake into cultured cardiomyocytes.
In this chapter, it was examined how in a cardiomyocytes model, using murine
HL-1 atrial sarcoma cell line, the process of iron uptake depends on the iron
source in the culture media. In order to model NTBI iron uptake into
cardiomyocytes, we have used NTBI models such as ferric ammonium citrate
and the more physiological buffered ferric citrate. The uptake was measured as
total cellular iron after 24 hours, which represents iron taken up and retained.
Part of this work was presented at 2015 ASH Conference as an oral
abstract(Garbowski et al, 2015b).
5.1 Viability of HL-1 cardiomyocytes in buffered ferric citrate media
In order to assess the viability of HL-1 cardiomyocytes in the presence of ferric
citrate, cells were plated in 75cm2 flasks, coated with gelatin/fibronectin, at
2.05x10³/mL in 16mL of growth Claycomb Medium. The medium was changed
two days later to ensure that the cells reach confluence. After additional 24h-
incubation, monolayers reached confluence and were rinsed with HBBS
20mL/flask, then constant citrate (100µM) ferric citrate was added at 0, 1, 3, 10
and 30µM in 10mM MOPS pH 7.4 with or without 5µM apotransferrin in 15mL
Claycomb medium supplemented with penicillin, streptomycin, norepinephrine
in ascorbic acid, and glutamine (no FBS). After 24h incubation cell monolayers
were rinsed with 20mL PBS/flask and trypsynised (5mL trypsin/EDTA for 2
minutes followed by 5mL trypsin inhibitor). The viability of HL-1
cardiomyocytes, in the presence of 0-30µM ferric citrate with or without 5µM
apotransferrin, was 96.6±0.7% (mean±SD), as assessed by the electric current
exclusion method on CASY Model TT Cell Counter and Analyzer (Roche), see
Figure 5-1. There was no dose response in viability within the ferric citrate range
selected either for control or for the apotransferrin data.

153
Figure 5-1. Viability of HL-1 cardiomyocytes after 24h-incubation with ferric citrate with or without apotransferin. (A) Dose response of viability (percentage of viable cells) versus ferric citrate concentration in MOPS pH=7.4 and supplemented Claycomb medium without FBS. Control and 5µM apotransferrin data shown in duplicates. (B) Example distribution of HL-1 cardiomyocytes on CASY Model TT Cell Counter and Analyzer (Roche). (C) Example results from the analysis of viability of one sample, corresponding to the distribution in B. (D) The assay principle, the Electrical Current Exclusion, shown on a schematic (from the brochure of the instrument).
5.2 Iron uptake into HL-1 cardiomyocytes from buffered ferric citrate measured by total cellular iron.
In order to test whether apotransferrin concentration significantly impacted on
iron uptake from NTBI into myocardial cells, an in vitro model was developed.

154
Firstly, intracellular iron was quantified in HL-1 cells after 24h-incubation with
increasing iron concentrations (0-10µM iron) at constant citrate concentration
(100µM). For these experiments, HL-1 cells were plated at 1x10⁶/mL in 80cm2
flasks coated with fibronectin and grown to confluence overnight. Next day
growth medium was removed and cell monolayers were rinsed 3 times with un-
supplemented Claycomb medium, then incubated with Claycomb medium
supplemented with ferric citrate buffered in MOPS pH 7.4, prepared as described
in 2.1.2. After 24h-incubation with ferric citrate, monolayers were washed 3-4
times with ice-cold PBS including one wash with DFO or DTPA in PBS to
remove membrane-bound iron. Cells were lysed and subjected to ferrozine assay
for total cellular iron as described in Methodology, see 2.1.3.1. The results are
shown in Figure 5-2A. Cellular iron concentration increased up to 3-4 times
above baseline with rising total iron concentrations between 0.1 and 1µM ferric
citrate and reaching plateau above this concentration (EC90=1.09µM, Figure
5-2A). Importantly, this plateau occurred below Fe:citrate ratio of 1:100, this
means that higher ratios (with a lower molar excess of citrate) did not result in
additional uptake (Figure 5-2A). On the other hand, for constant Fe:citrate ratios
of 1:10 and 1:100, initially overlapping trajectories diverged, with the 1:100
reflecting uptake inhibition (consistent with trapping of iron in ferric dicitrate
which is not taken up), while 1:10 – saturation at supra-physiological levels of
citrate (Figure 5-2B), which compounds the applicability of this model. These
results suggest that high concentrations of NTBI are not taken into
cardiomyocytes as fast as low concentrations ≤1µM and that the Fe:citrate ratio
determines which species are a better candidate for cellular uptake.
5.3 Apotransferrin inhibition of iron uptake from ferric citrate in HL-1 cardiomyocytes
To test if apotransferrin is able to modulate cardiomyocyte iron uptake from
NTBI, cells were plated as above and apotransferrin was introduced to the
supernatant together with FAC for 24h incubation in Claycomb media without
FCS. Apotransferrin (1µM) inhibited iron accumulation from 1µM FAC, Figure
5-2C, with IC50=0.81µM (95% CI 0.56-1.17µM) at 24h. Next it was examined
whether physiological transferrin concentration (37µM), saturated with iron
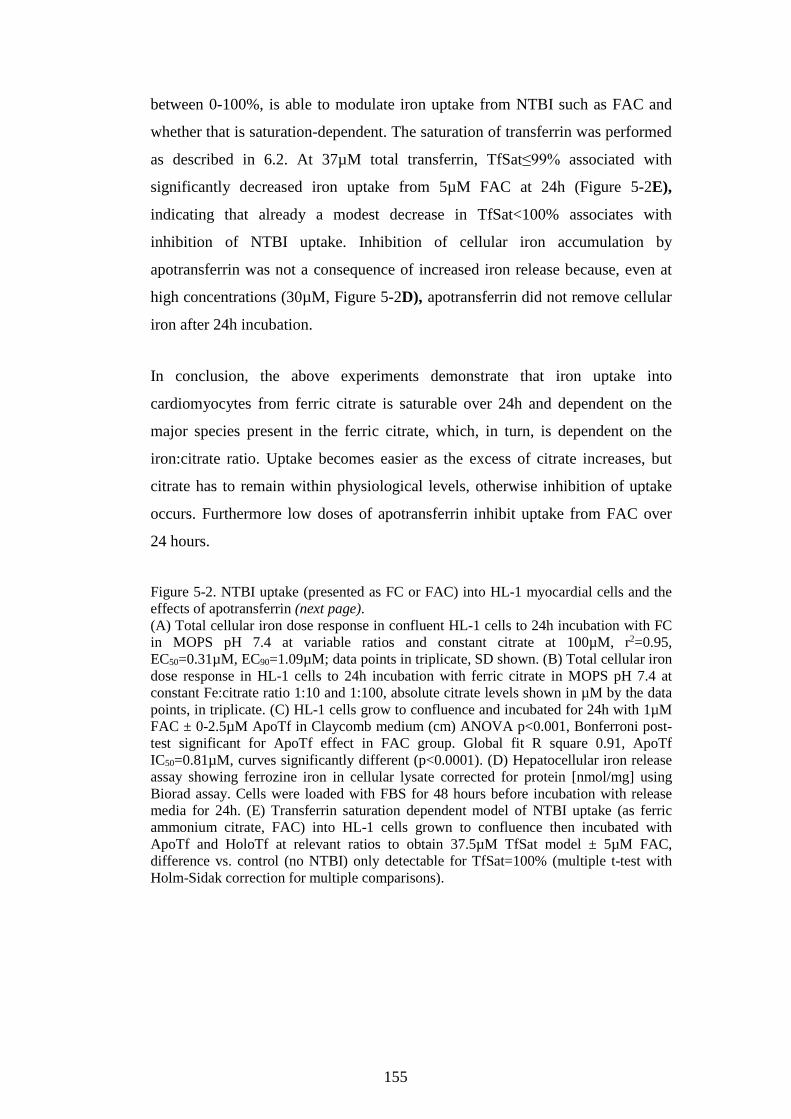
155
between 0-100%, is able to modulate iron uptake from NTBI such as FAC and
whether that is saturation-dependent. The saturation of transferrin was performed
as described in 6.2. At 37µM total transferrin, TfSat≤99% associated with
significantly decreased iron uptake from 5µM FAC at 24h (Figure 5-2E),
indicating that already a modest decrease in TfSat<100% associates with
inhibition of NTBI uptake. Inhibition of cellular iron accumulation by
apotransferrin was not a consequence of increased iron release because, even at
high concentrations (30µM, Figure 5-2D), apotransferrin did not remove cellular
iron after 24h incubation.
In conclusion, the above experiments demonstrate that iron uptake into
cardiomyocytes from ferric citrate is saturable over 24h and dependent on the
major species present in the ferric citrate, which, in turn, is dependent on the
iron:citrate ratio. Uptake becomes easier as the excess of citrate increases, but
citrate has to remain within physiological levels, otherwise inhibition of uptake
occurs. Furthermore low doses of apotransferrin inhibit uptake from FAC over
24 hours.
Figure 5-2. NTBI uptake (presented as FC or FAC) into HL-1 myocardial cells and the effects of apotransferrin (next page). (A) Total cellular iron dose response in confluent HL-1 cells to 24h incubation with FC in MOPS pH 7.4 at variable ratios and constant citrate at 100µM, r2=0.95, EC50=0.31µM, EC90=1.09µM; data points in triplicate, SD shown. (B) Total cellular iron dose response in HL-1 cells to 24h incubation with ferric citrate in MOPS pH 7.4 at constant Fe:citrate ratio 1:10 and 1:100, absolute citrate levels shown in µM by the data points, in triplicate. (C) HL-1 cells grow to confluence and incubated for 24h with 1µM FAC ± 0-2.5µM ApoTf in Claycomb medium (cm) ANOVA p<0.001, Bonferroni post-test significant for ApoTf effect in FAC group. Global fit R square 0.91, ApoTf IC50=0.81µM, curves significantly different (p<0.0001). (D) Hepatocellular iron release assay showing ferrozine iron in cellular lysate corrected for protein [nmol/mg] using Biorad assay. Cells were loaded with FBS for 48 hours before incubation with release media for 24h. (E) Transferrin saturation dependent model of NTBI uptake (as ferric ammonium citrate, FAC) into HL-1 cells grown to confluence then incubated with ApoTf and HoloTf at relevant ratios to obtain 37.5µM TfSat model ± 5µM FAC, difference vs. control (no NTBI) only detectable for TfSat=100% (multiple t-test with Holm-Sidak correction for multiple comparisons).
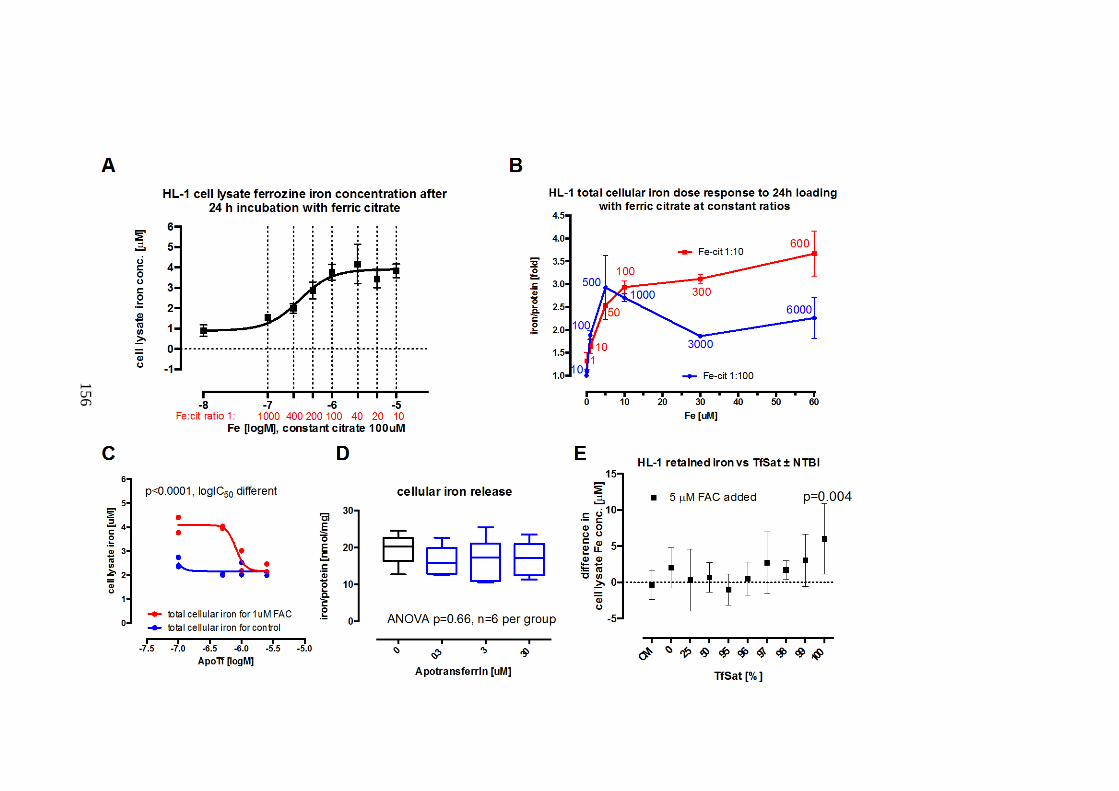
156

157
5.4 Effect of hepcidin on total cellular iron in the cardiomyocyte
We have found a significant cross-sectional association of hepcidin with the
presence of MH in our clinical data. Average levels of hepcidin were,
paradoxically, higher in patients with MH in comparison to those without MH;
see 3.3 and Table 3-1. From first principles, it would appear that lower hepcidin
should associate with more extra-hepatic iron distribution because of greater
expression of ferroportin permitting more iron entry into the plasma
compartment. However increased hepcidin could be a secondary effect of
marrow quiescence during hypertransfusion. Increased hepcidin might also affect
the iron exit from cells expressing ferroportin, and this may impact the iron
retention in the myocardium. We have tested therefore whether in our system
hepcidin has an effect on HL-1 cardiomyocyte iron retention during uptake from
NTBI.
For the experiment confluent HL-1 cardiomyocytes monolayers were seeded at
1x10⁶/mL at 2.4 mL of growth Claycomb medium per well in a 6-well plate
coated with gelatin/fibronectin (800µL/well). After rinsing the monolayers with
Claycomb medium without FBS, 20µM FAC or control was added with 70nM or
700nM hepcidin in Claycomb medium without FBS (Pen-Strep, Glutamine,
norepinephrine) and incubated for 5 hours at 37°C, 5% CO2 in the tissue culture
incubator. Hepcidin solutions were obtained from appropriate dilutions of the
stock solution of 1 mg/mL (Sigma). The purpose of this experiment was to
establish whether hepcidin could affect iron retention. If that were the case
clearly ferroportin patency would be crucial in loading cells with iron. In
addition culture media were retained for iron analysis both before and after
incubation to establish iron uptake by the difference in media iron content. Iron
in the media was assayed by extraction using aqua regia (1:3 vol/vol of
HNO3:HCl) (400µL of media or supernatant and 800µL of aqua regia) and left
overnight at 60°C in a fume hood for evaporation on the Eppendorf tube heater.
Solids were dissolved in 10mM HCl and assayed by ferrozine assay. Cell
monolayers after 5h incubation were rinsed twice with PBS and assayed for total
cellular iron using ferrozine (see 2.1.3.1).
158
There is an increase in total cellular iron after 5h incubation with 20µM FAC, as
expected. Furthermore, an additional increase in total cellular iron was observed
when hepcidin was added to the FAC media; see Figure 5-3. The supernatant
iron content decreases with increasing hepcidin level in the FAC media
significantly more than it does in the control media; see Figure 5-4. This suggests
that the level of cellular iron retained increases if there is high hepcidin level in
the media. This is in parallel to the reduction of iron content in the supernatant
after 5h of incubation above the HL-1 monolayers. The conclusion is that during
iron loading of cells there is equilibrium of iron across cellular membrane, which
is ferroportin-dependent, and it can be perturbed significantly if ferroportin is
down-regulated by hepcidin so that the level of iron retained in the cell increases
markedly. This effect appears significant only when FAC is added to the
supernatant and absent for the control media, further supporting that it is iron-
specific. The effect is sufficiently large to be reflected as change in iron
consumption from the supernatant. Similar data was obtained by Isoda and co-
workers, Qian and co-workers as well as Ge and co-workers(Isoda et al, 2010;
Qian et al, 2007; Ge et al, 2009). Recent reports have shown that cardiac-specific
ferroportin deletion results in fatal cardiac iron overload and that cardiac specific
deletion of hepcidin or knock-in Fpn-resistant mutation lead to iron deficiency
despite normal systemic iron homoeostasis(Lakhal-Littleton et al, 2016, 2015).
The significance of this finding is that in cell culture and in vivo, a constant iron
exit via ferroportin occurs also during loading, which constitutes a safety valve
during overload. But is also sufficiently active to deplete the cells of iron despite
normal systemic levels, therefore, the local synthesis of hepcidin prevents
ferroportin dependent removal of iron under systemic demand. It is likely that
because ferritin synthesis has not caught up with an increase in LIP over the
period in question, iron may exit via ferroportin whose translation is IRP
dependent, as long as ferroportin is not down-regulated by hepcidin. In other
words, the rate of uptake of iron into the cytosol likely exceeds the rate of iron
incorporation into empty ferritin cages, and/or the rate of synthesis of new
ferritin, such that the transient excess of iron in LIP permits ferroportin
translation and iron egress from cells.

159
Figure 5-3. Hepcidin modulates iron loading of HL-1 cells with FAC. HL-1 cardiomyocytes were incubated with 20µM FAC and 70 or 700nM hepcidin in Claycomb medium with Pen-Strep, Glutamine, norepinephrine (without FBS) for 5h in tissue culture incubator. Two-way ANOVA: FAC effect p<0.0001, interaction effect p=0.03, hepcidin effect p=0.0509. Tukey’s multiple comparison tests: p=ns for hepcidin within control (0µM FAC) and the control vs. 70nM hepcidin (within the FAC group), and for the FAC group: p=0.026 for control vs. 700nM hepcidin and p=0.003 for 70nM vs. 700nM. Shown mean±SD for n=6.
That egress rate, however, remains sufficiently lower than the uptake rate for the
loading and retention to be observed. It would be of interest to examine the time
course (pulse-chase?) of this effect of hepcidin on iron retention, which probably
decreases with time, but this was beyond the scope of this work. Further work
will be performed on how this phenomenon affects iron chelation with
deferasirox in HL-1 cardiomyocyte model. It is very likely that given the effect
of hepcidin just described, and the clinical relevance of hepcidin in MH
established in our cohort, see 3.3, the removal of cardiomyocyte iron by DFX has
two-fold mechanism: (1) the ligand crossing the membrane, binding to LIP and
leaving the cell as a chelate, and (2) the ligand remaining extracellularly and
acting as a sink for iron exiting via Fpn thus preventing its further uptake. The
2nd mechanism is probably not insignificant given the tight binding of DFX to
albumin(Weiss et al, 2006), but see also 4.3.4.1.
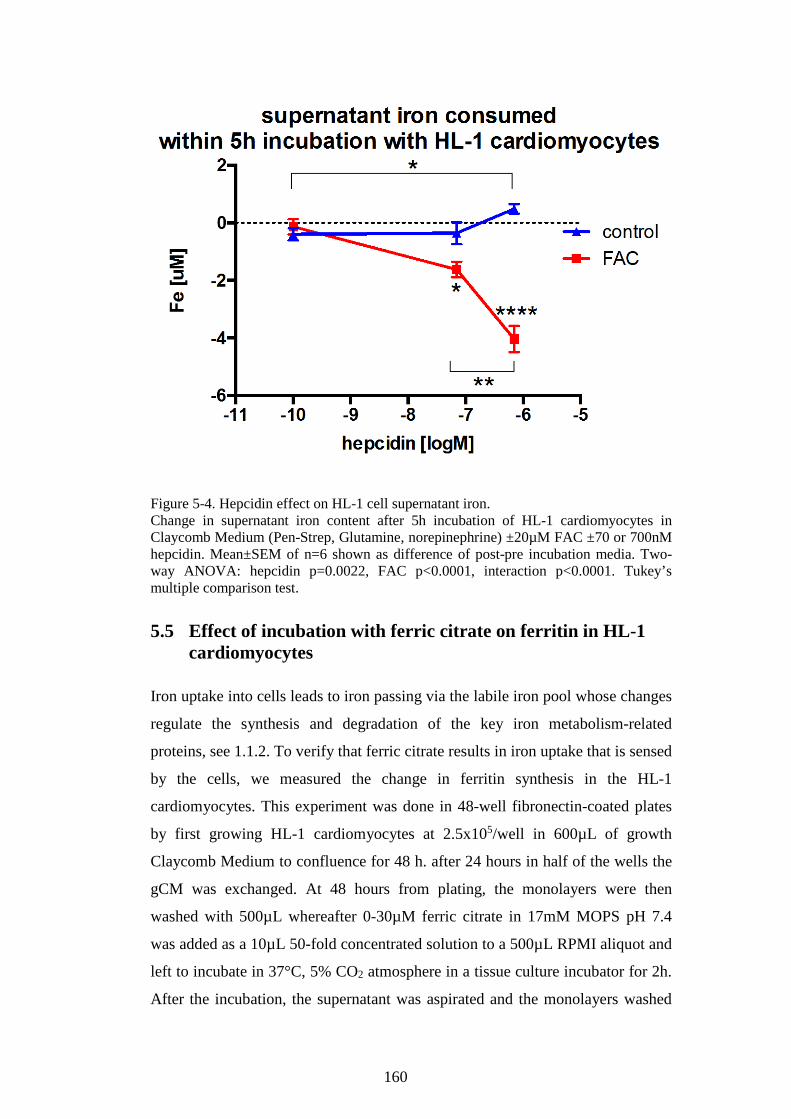
160
Figure 5-4. Hepcidin effect on HL-1 cell supernatant iron. Change in supernatant iron content after 5h incubation of HL-1 cardiomyocytes in Claycomb Medium (Pen-Strep, Glutamine, norepinephrine) ±20µM FAC ±70 or 700nM hepcidin. Mean±SEM of n=6 shown as difference of post-pre incubation media. Two-way ANOVA: hepcidin p=0.0022, FAC p<0.0001, interaction p<0.0001. Tukey’s multiple comparison test.
5.5 Effect of incubation with ferric citrate on ferritin in HL-1 cardiomyocytes
Iron uptake into cells leads to iron passing via the labile iron pool whose changes
regulate the synthesis and degradation of the key iron metabolism-related
proteins, see 1.1.2. To verify that ferric citrate results in iron uptake that is sensed
by the cells, we measured the change in ferritin synthesis in the HL-1
cardiomyocytes. This experiment was done in 48-well fibronectin-coated plates
by first growing HL-1 cardiomyocytes at 2.5x10⁵/well in 600µL of growth
Claycomb Medium to confluence for 48 h. after 24 hours in half of the wells the
gCM was exchanged. At 48 hours from plating, the monolayers were then
washed with 500µL whereafter 0-30µM ferric citrate in 17mM MOPS pH 7.4
was added as a 10µL 50-fold concentrated solution to a 500µL RPMI aliquot and
left to incubate in 37°C, 5% CO2 atmosphere in a tissue culture incubator for 2h.
After the incubation, the supernatant was aspirated and the monolayers washed
161
four times with ice-cold PBS, then frozen at -20°C for lysis at a later stage. Lysis
of HL-1 monolayers with non-denaturing lysis buffer was performed according
to the Methodology, see 2.1.3.7, and ferritin was assayed in the lysates using a
murine ferritin ELISA kit (Abnova, cat. no. KA1941). Results of the ELISA
were corrected for protein levels using Bio-Rad Dc Protein Assay.
The results show the short-term (2h) effect of incubation with ferric citrate on
cellular ferritin in HL-1 cardiomyocytes. It is evident that there is no well-
defined dose-response for such a relatively short incubation period but it seems
likely that there is no increase in cellular ferritin levels above 1µM ferric citrate
in controls. The time point may be too early for cellular ferritin to be synthesised
in response to iron being taken up. Previous incubation with iron (as FCS) for
double the time in comparison to control (48 vs. 24h) may sensitize the system
more to subsequent short-term challenge with ferric citrate, however even then
the dose-response effect is not well defined and the effect of higher (10-30µM)
concentrations of ferric citrate is not vastly different from that of lower
concentrations. In other words, the experiment shown above is consistent with
the results for ROS assay or the LIP assay for comparable incubation periods in
that it does not show that oligomeric ferric citrate leads to greater iron uptake
than monomeric FC, and that the plateau seen at 1:100 Fe:citrate ratio in Figure
5-2A seems to agree with Figure 5-5A.
The parallel experiment for the ferritin assay was performed with the LIP assay
as a read-out; see Figure 5-6. It suggests that a similar species is being taken up
from ferric citrate during the 2h incubation period, without any change in
kinetics of uptake as a result of previous loading with iron (48h vs. 24h of FCS
loading) during the exponential growth phase of the monolayer (when the
dividing cells take up transferrin iron avidly from FCS). The LIP change
however is interesting, because it clearly shows increased baseline LIP and
parallel increases in LIP in response to ferric citrate dose, both in the control and
the gCM change (48h FCS) data. This suggests that storage iron (as ferritin) after
longer loading with FCS leads to greater LIP due to constant ferritin turnover.
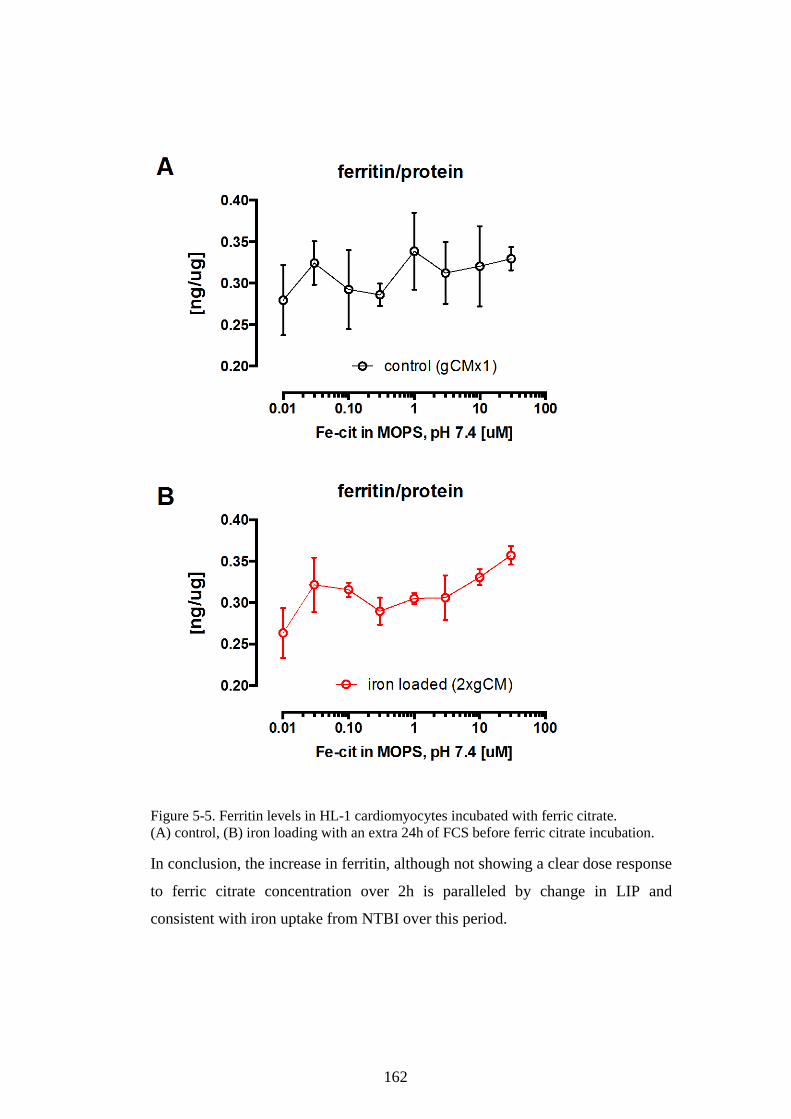
162
Figure 5-5. Ferritin levels in HL-1 cardiomyocytes incubated with ferric citrate. (A) control, (B) iron loading with an extra 24h of FCS before ferric citrate incubation.
In conclusion, the increase in ferritin, although not showing a clear dose response
to ferric citrate concentration over 2h is paralleled by change in LIP and
consistent with iron uptake from NTBI over this period.

163
Figure 5-6. LIP assay in parallel to ferritin assay in Figure 5-5. LIP assay was performed as described in 2.1.3.2. Left panel shows iron uptake modelled by the constant k of the exponential decay of calcein fluorescence, no difference vs. control p=ns. Right panel shows LIP values (as span of exponential association fitted to de-quenching of calcein fluorescence following SIH addition), with a significant difference vs. control p= 0.0001. Control is shown in black, incubation with additional 24h of FCS in red.

164
Chapter 6 Labile plasma iron assay for the assessment of iron speciation in an NTBI model.
In this chapter, we have looked at how NTBI is detected using an LPI assay.
Since the clinical data suggested that patients with and without MH have similar
total NTBI (NTA-NTBI) values but different LPI sub-fractions of NTBI, we
wanted to establish what is the relationship between LPI and NTBI using
buffered ferric citrate as a physiological model of NTBI. We tried to understand
how controlling the conditions of ferric citrate speciation might affect the level of
LPI detected in ferric citrate. This indirectly can provide information about the
speciation of NTBI. This is important because the availability of FC for binding
to transferrin, may vary according to the speciation of FC, see Figure 1-5, as the
greater the excess of citrate, the greater the proportion of monomeric species
available both for cellular iron uptake and for redox-cycling(Silva et al, 2009;
Evans et al, 2008). Part of this work was presented at 2015 ASH Conference as
an oral abstract(Garbowski et al, 2015b)
6.1 Effects of NTBI speciation (iron:citrate ratio) on LPI levels
Buffered ferric citrate was prepared 24 hours before the experiments as described
in 2.1.2, and the buffered solutions were then assessed by LPI assay, as described
in 2.1.3.4 in the same manner as if they were unknown serum samples. The
redox-active sub-fraction of NTBI, as detected by the LPI assay(Esposito et al,
2003) was therefore measured at increasing concentrations of iron in the
presence of a constant concentration of citrate and compared with the constant
iron:NTA ratio of 1:7 in the standards. At equivalent iron concentrations, more
NTA iron was detected than citrate iron and this difference increased as the iron
concentration increased (Figure 6-1A). Thus, citrate iron at the ratios used is less
detectable by the LPI assay than NTA iron. In order to determine whether the
molar excess of citrate to iron is the critical factor affecting LPI detection, we
measured LPI at constant iron concentration but with varying molar excess of
citrate which shows a dose-dependent bell-shape curve in LPI detectability
(Figure 6-2).

165
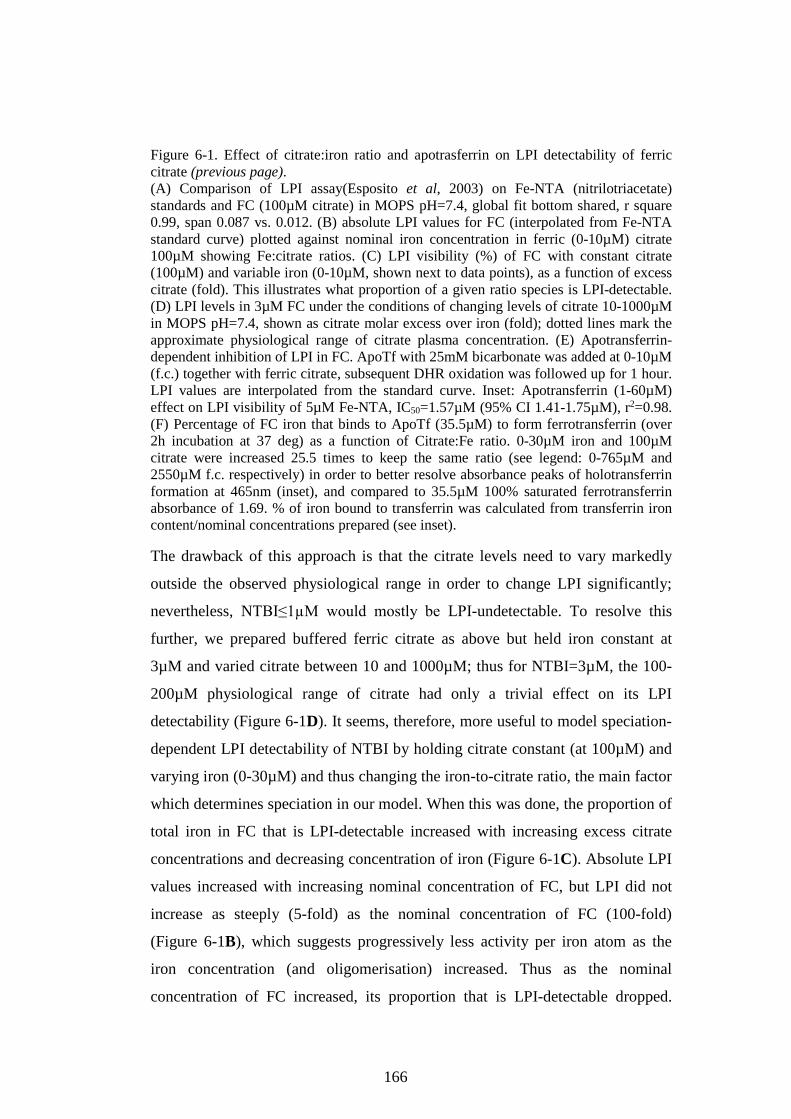
166
Figure 6-1. Effect of citrate:iron ratio and apotrasferrin on LPI detectability of ferric citrate (previous page). (A) Comparison of LPI assay(Esposito et al, 2003) on Fe-NTA (nitrilotriacetate) standards and FC (100µM citrate) in MOPS pH=7.4, global fit bottom shared, r square 0.99, span 0.087 vs. 0.012. (B) absolute LPI values for FC (interpolated from Fe-NTA standard curve) plotted against nominal iron concentration in ferric (0-10µM) citrate 100µM showing Fe:citrate ratios. (C) LPI visibility (%) of FC with constant citrate (100µM) and variable iron (0-10µM, shown next to data points), as a function of excess citrate (fold). This illustrates what proportion of a given ratio species is LPI-detectable. (D) LPI levels in 3µM FC under the conditions of changing levels of citrate 10-1000µM in MOPS pH=7.4, shown as citrate molar excess over iron (fold); dotted lines mark the approximate physiological range of citrate plasma concentration. (E) Apotransferrin-dependent inhibition of LPI in FC. ApoTf with 25mM bicarbonate was added at 0-10µM (f.c.) together with ferric citrate, subsequent DHR oxidation was followed up for 1 hour. LPI values are interpolated from the standard curve. Inset: Apotransferrin (1-60µM) effect on LPI visibility of 5µM Fe-NTA, IC50=1.57µM (95% CI 1.41-1.75µM), r2=0.98. (F) Percentage of FC iron that binds to ApoTf (35.5µM) to form ferrotransferrin (over 2h incubation at 37 deg) as a function of Citrate:Fe ratio. 0-30µM iron and 100µM citrate were increased 25.5 times to keep the same ratio (see legend: 0-765µM and 2550µM f.c. respectively) in order to better resolve absorbance peaks of holotransferrin formation at 465nm (inset), and compared to 35.5µM 100% saturated ferrotransferrin absorbance of 1.69. % of iron bound to transferrin was calculated from transferrin iron content/nominal concentrations prepared (see inset).
The drawback of this approach is that the citrate levels need to vary markedly
outside the observed physiological range in order to change LPI significantly;
nevertheless, NTBI≤1µM would mostly be LPI-undetectable. To resolve this
further, we prepared buffered ferric citrate as above but held iron constant at
3µM and varied citrate between 10 and 1000µM; thus for NTBI=3µM, the 100-
200µM physiological range of citrate had only a trivial effect on its LPI
detectability (Figure 6-1D). It seems, therefore, more useful to model speciation-
dependent LPI detectability of NTBI by holding citrate constant (at 100µM) and
varying iron (0-30µM) and thus changing the iron-to-citrate ratio, the main factor
which determines speciation in our model. When this was done, the proportion of
total iron in FC that is LPI-detectable increased with increasing excess citrate
concentrations and decreasing concentration of iron (Figure 6-1C). Absolute LPI
values increased with increasing nominal concentration of FC, but LPI did not
increase as steeply (5-fold) as the nominal concentration of FC (100-fold)
(Figure 6-1B), which suggests progressively less activity per iron atom as the
iron concentration (and oligomerisation) increased. Thus as the nominal
concentration of FC increased, its proportion that is LPI-detectable dropped.
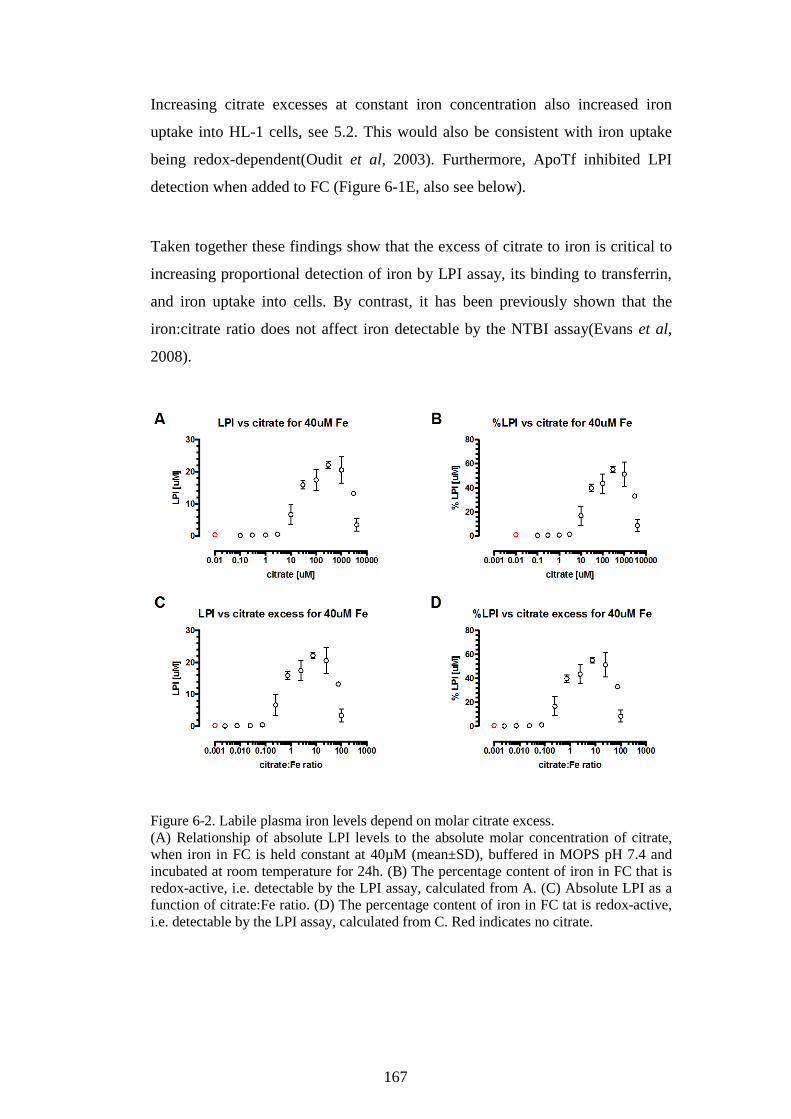
167
Increasing citrate excesses at constant iron concentration also increased iron
uptake into HL-1 cells, see 5.2. This would also be consistent with iron uptake
being redox-dependent(Oudit et al, 2003). Furthermore, ApoTf inhibited LPI
detection when added to FC (Figure 6-1E, also see below).
Taken together these findings show that the excess of citrate to iron is critical to
increasing proportional detection of iron by LPI assay, its binding to transferrin,
and iron uptake into cells. By contrast, it has been previously shown that the
iron:citrate ratio does not affect iron detectable by the NTBI assay(Evans et al,
2008).
Figure 6-2. Labile plasma iron levels depend on molar citrate excess. (A) Relationship of absolute LPI levels to the absolute molar concentration of citrate, when iron in FC is held constant at 40µM (mean±SD), buffered in MOPS pH 7.4 and incubated at room temperature for 24h. (B) The percentage content of iron in FC that is redox-active, i.e. detectable by the LPI assay, calculated from A. (C) Absolute LPI as a function of citrate:Fe ratio. (D) The percentage content of iron in FC tat is redox-active, i.e. detectable by the LPI assay, calculated from C. Red indicates no citrate.

168
6.2 Ferric citrate speciation-dependent formation of holotransferrin
In order to find out how the speciation of ferric citrate (and therefore of NTBI)
affects the iron exchange between citrate and transferrin, we have prepared
apotransferrin solutions in physiological concentration of sodium bicarbonate
(25mM) containing ferric citrate, prepared as described in 2.1.2. We then
measured holotransferrin formation, which was assessed spectrophotometrically
over time. Ferric citrate and iron-free transferrin where added together at the
beginning of the time course assay followed up for two hours and then up to 24
hours. In order to obtain ferrotransferrin control, saturation of transferrin was
performed using Fe-NTA in excess of transferrin binding (or to 95%) with
subsequent 24h dialysis against 2L of PBS using 10,000 MWCO Slide-A-Lyzer
Dialysis Cassette (Thermo Scientific).
In 96-well plate 150µL of ferric citrate in 1M MOPS pH 7.4 (as in methods) was
mixed with 150µL of 71µM ApoTf in 50mM bicarbonate sodium giving a final
concentration of Fe(III) 0-765µM 2250µM citrate, 35.5µM Apotransferrin in
25mM bicarbonate. The plate was then incubated for 3 hours at 37°C 5% CO2 in
a cell culture incubator. Subsequently, absorbance spectra were taken between
280 to 700nm on a Varioscan Flash plate reader. In another version of this
experiment, immediately upon mixture, the plate was left in the plate reader at
37°C and the absorbance at 465 nm was followed for two hours in two minutes
intervals in order to follow the immediate kinetics of diferric transferrin
formation.
The results in Figure 6-3 showed that as the concentration of iron in ferric citrate
increases so does the absolute amount of iron bound to transferrin (presented as
35.5µM apotransferrin), as calculated from the absorbance of the same
concentration of holotransferrin control (35.5µM). However when the point of
molar equivalence of iron in ferric citrate to free iron binding sites on transferrin
is reached (dotted line in Figure 6-3D), we observe no further increase in
absorbance (transferrin-bound iron), the ferrotransferrin-specific absorbance is
actually lower when citrate absorbance is subtracted, suggesting that the

169
formation of ferrotransferrin falls as the ratio of citrate to iron falls (more
oligomeric species, Figure 6-3E). Over 3h incubation, only a fraction of
transferrin sites is bound by iron to just over 10% saturation when the iron source
is the predominantly oligomeric ferric citrate with molar excess of citrate <100,
and this is despite an over 10-fold excess of molar iron concentration above that
of transferrin. Monomeric species of ferric citrate, such as ferric monocitrate (in
equilibrium with ferric dicitrate) exchange iron with apotransferrin in a more
facile manner because a greater proportion of iron exchanges with transferrin,
Figure 6-3E. This suggests that monomeric ferric citrate over the time studied is
a better candidate species for loading transferrin than the more oligomeric
species. Additionally, as can be seen in Figure 6-3 lower right panel, the
availability of iron for exchange with apotransferrin depends on the ratio of
citrate to iron, such that the greater the excess of citrate, the greater the
proportion of iron presented to transferrin ends up bound to transferrin.
In this experiment, when the citrate level remains constant, the ratio of citrate to
iron, and hence the speciation, depend on increasing concentration of iron in
solution. This parallels the physiological condition, where citrate remains
relatively constant (approximately 100µM), whereas the iron levels in the NTBI
pool vary over two orders of magnitude (up to about 10µM). Against a constant
physiological concentration of transferrin, formation of ferrotransferrin increases
with the iron concentration in absolute terms, however for more oligomeric
species (citrate:Fe<100), a three-fold increase of iron does not lead to a similar
increase in bound iron, which suggests that the species present is not exchanging
easily with transferrin. If concentrations are scaled down to physiologically
relevant levels in transfusional siderosis (25.5 times, a factor by which
concentrations were increased to improve spectral resolution), we obtain 0-30µM
Fe(III) and 100µM citrate against 1.4µM ApoTf.
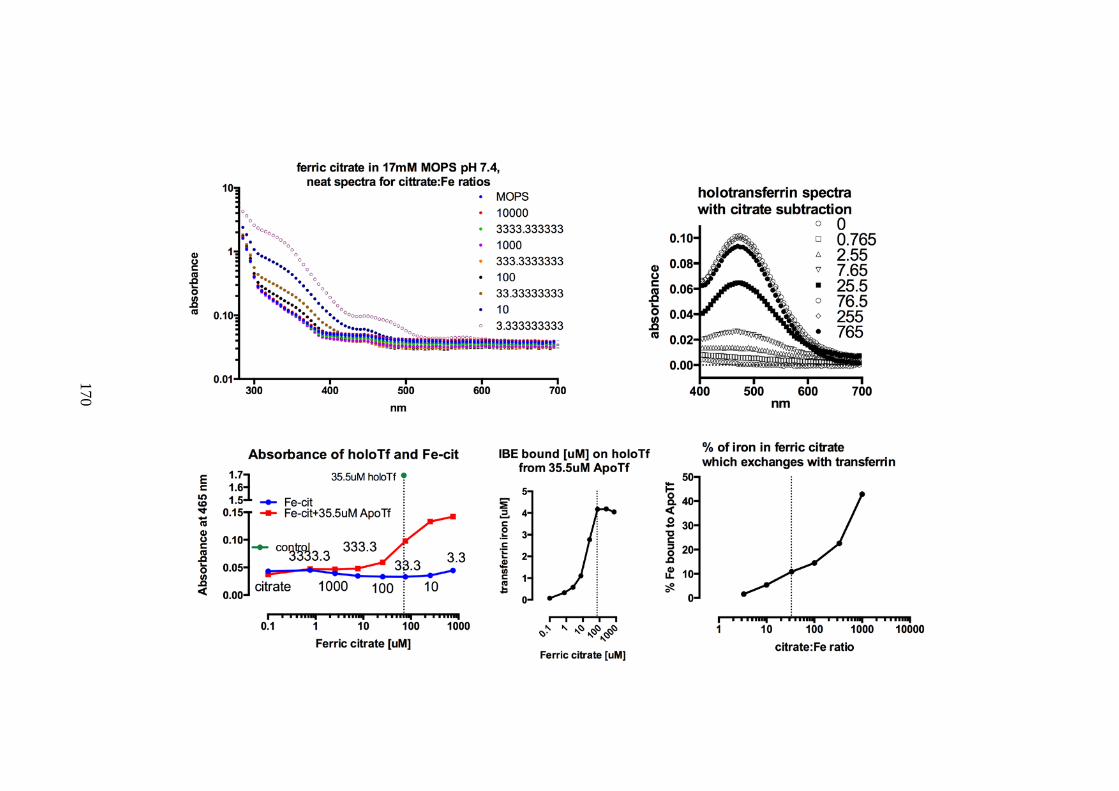
170
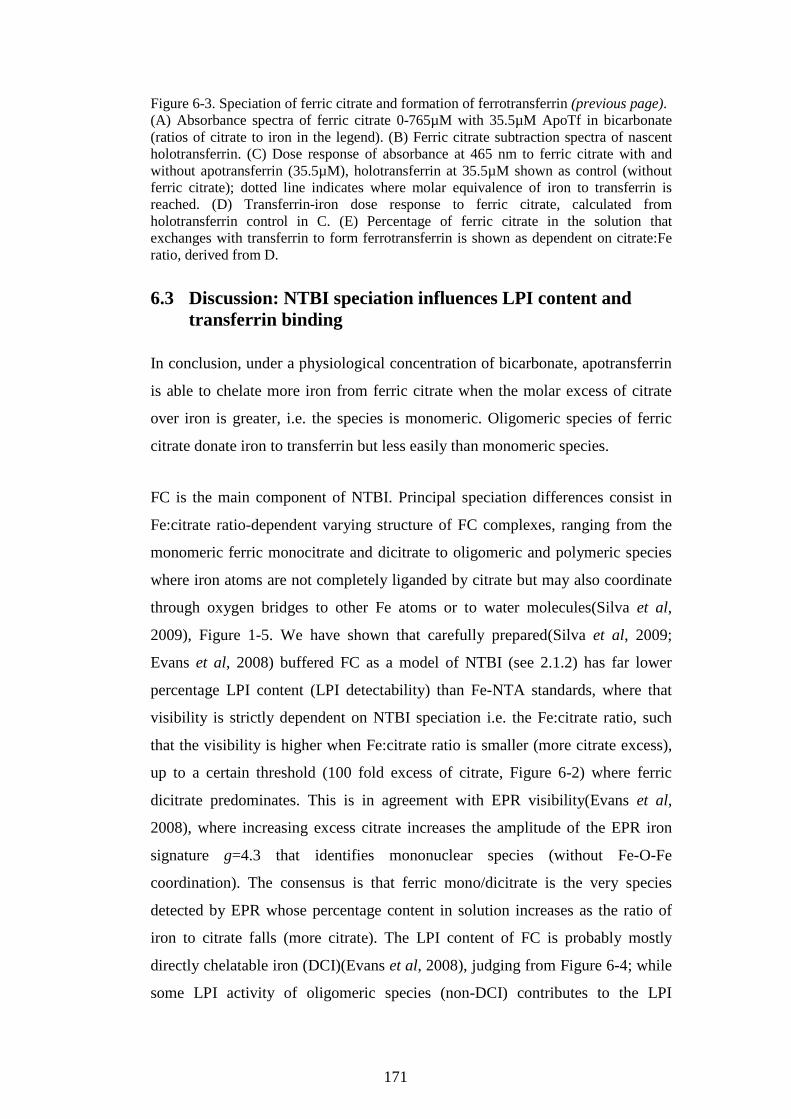
171
Figure 6-3. Speciation of ferric citrate and formation of ferrotransferrin (previous page). (A) Absorbance spectra of ferric citrate 0-765µM with 35.5µM ApoTf in bicarbonate (ratios of citrate to iron in the legend). (B) Ferric citrate subtraction spectra of nascent holotransferrin. (C) Dose response of absorbance at 465 nm to ferric citrate with and without apotransferrin (35.5µM), holotransferrin at 35.5µM shown as control (without ferric citrate); dotted line indicates where molar equivalence of iron to transferrin is reached. (D) Transferrin-iron dose response to ferric citrate, calculated from holotransferrin control in C. (E) Percentage of ferric citrate in the solution that exchanges with transferrin to form ferrotransferrin is shown as dependent on citrate:Fe ratio, derived from D.
6.3 Discussion: NTBI speciation influences LPI content and transferrin binding
In conclusion, under a physiological concentration of bicarbonate, apotransferrin
is able to chelate more iron from ferric citrate when the molar excess of citrate
over iron is greater, i.e. the species is monomeric. Oligomeric species of ferric
citrate donate iron to transferrin but less easily than monomeric species.
FC is the main component of NTBI. Principal speciation differences consist in
Fe:citrate ratio-dependent varying structure of FC complexes, ranging from the
monomeric ferric monocitrate and dicitrate to oligomeric and polymeric species
where iron atoms are not completely liganded by citrate but may also coordinate
through oxygen bridges to other Fe atoms or to water molecules(Silva et al,
2009), Figure 1-5. We have shown that carefully prepared(Silva et al, 2009;
Evans et al, 2008) buffered FC as a model of NTBI (see 2.1.2) has far lower
percentage LPI content (LPI detectability) than Fe-NTA standards, where that
visibility is strictly dependent on NTBI speciation i.e. the Fe:citrate ratio, such
that the visibility is higher when Fe:citrate ratio is smaller (more citrate excess),
up to a certain threshold (100 fold excess of citrate, Figure 6-2) where ferric
dicitrate predominates. This is in agreement with EPR visibility(Evans et al,
2008), where increasing excess citrate increases the amplitude of the EPR iron
signature g=4.3 that identifies mononuclear species (without Fe-O-Fe
coordination). The consensus is that ferric mono/dicitrate is the very species
detected by EPR whose percentage content in solution increases as the ratio of
iron to citrate falls (more citrate). The LPI content of FC is probably mostly
directly chelatable iron (DCI)(Evans et al, 2008), judging from Figure 6-4; while
some LPI activity of oligomeric species (non-DCI) contributes to the LPI
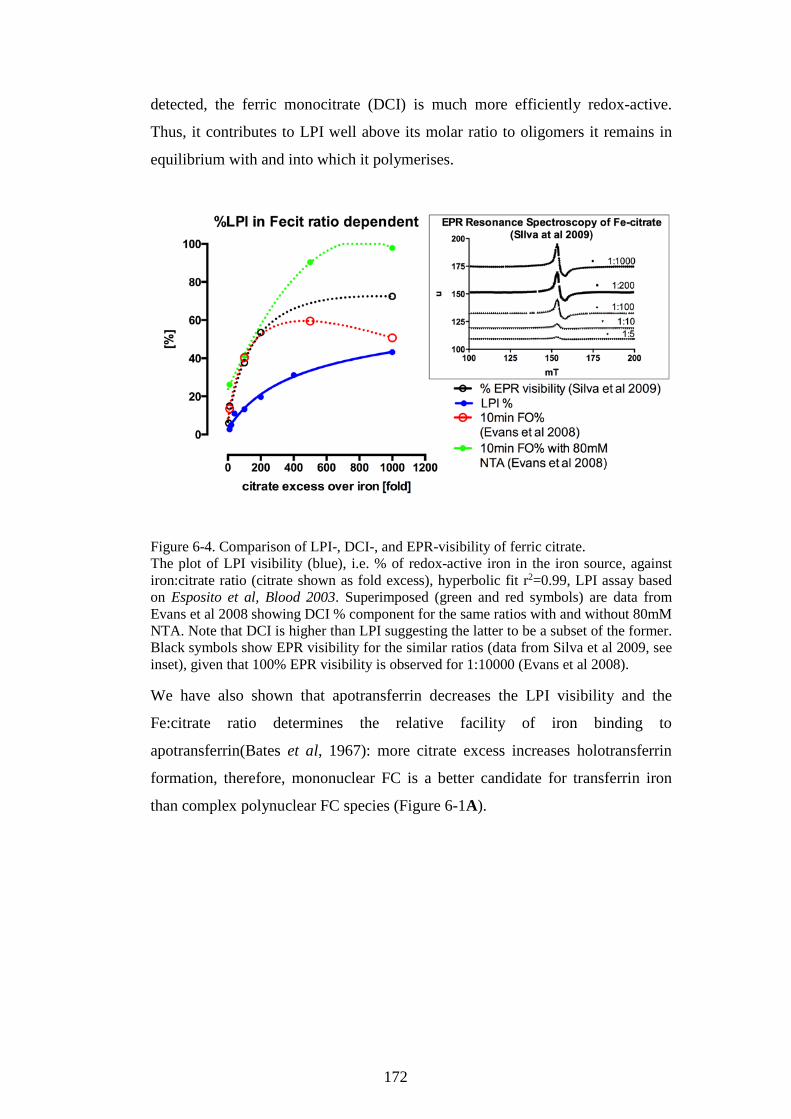
172
detected, the ferric monocitrate (DCI) is much more efficiently redox-active.
Thus, it contributes to LPI well above its molar ratio to oligomers it remains in
equilibrium with and into which it polymerises.
Figure 6-4. Comparison of LPI-, DCI-, and EPR-visibility of ferric citrate. The plot of LPI visibility (blue), i.e. % of redox-active iron in the iron source, against iron:citrate ratio (citrate shown as fold excess), hyperbolic fit r2=0.99, LPI assay based on Esposito et al, Blood 2003. Superimposed (green and red symbols) are data from Evans et al 2008 showing DCI % component for the same ratios with and without 80mM NTA. Note that DCI is higher than LPI suggesting the latter to be a subset of the former. Black symbols show EPR visibility for the similar ratios (data from Silva et al 2009, see inset), given that 100% EPR visibility is observed for 1:10000 (Evans et al 2008).
We have also shown that apotransferrin decreases the LPI visibility and the
Fe:citrate ratio determines the relative facility of iron binding to
apotransferrin(Bates et al, 1967): more citrate excess increases holotransferrin
formation, therefore, mononuclear FC is a better candidate for transferrin iron
than complex polynuclear FC species (Figure 6-1A).
173
Chapter 7 NTBI uptake into cultured cardiomyocytes and the effect of transferrin using labile intracellular iron pool assay
In this chapter, we show how iron uptake may be monitored using a probe that
reports the changes in the labile intracellular iron pool (LIP), the cytosolic
regulatory pool of iron. Iron enters that pool e.g. after uptake and increases its
concentration which further signals to ferritin or ferroportin synthesis in order to
restore the equilibrium. A constant turnover of ferritin, however, increases LIP in
proportion to stored iron. LIP assay, therefore, by reflecting iron levels in this
transient pool is a sensitive marker of iron uptake when monitored in the short
term (1-2 hours).
7.1 The effect of transferrin
In preparation for LIP assay experiments, a 48-well plate was seeded with 2.5-
3.0x10⁵ HL-1 cardiomyocytes per well in 600µL growth Claycomb medium and
grown to confluence over 24-48 hours. Cells were loaded with calcein as per LIP
assay procedure explained in the Methods, see 2.1.3.2 and subjected to
experimental media at the beginning of the LIP assay. The experimental media
were either control or 5µM FAC followed in 30 minutes by apotransferrin or
recombinant human serum albumin (Sigma) at 0, 0.125, 0.25 or 0.5µM. After 45
minutes DTPA and SIH were added to de-quench calcein fluorescence. The
results in Figure 7-2 show that 5µM FAC causes quenching of calcein
fluorescence whereas control well fluorescence remains relatively stable.
Halfway through the quenching process, the addition of apotransferrin causes, in
a dose-response manner, a rapid and partial de-quenching of calcein fluorescence
in FAC-treated wells, but not in controls. Upon de-quenching, the span (i.e. the
difference between the quenching plateau and the de-quenching plateau which is
a measure for LIP) can be observed to differ significantly for each particular dose
of apotransferrin in the FAC-treated wells but not in the control wells. This
shows a dose response of intracellular LIP to extracellular apotransferrin under
conditions of continuous uptake of iron from NTBI presented as FAC. This
suggests that apotransferrin is able to actively interfere with iron uptake from
174
NTBI while that is not yet saturated. It is also evident that small molar quantities
of apotransferrin are sufficient to abrogate the uptake in comparison to the
quantities of FAC presented to the cells: the titration from high doses of
apotransferrin (10µM), see Figure 7-1, to low doses (0.125µM), see Figure 7-2
top panel, gives an EC50=0.63µM, 0.37-1.08µM (95% CI), see also Figure 7-4.
The recombinant human serum albumin (rHSA) as a protein control at similar
concentrations showed lack of modulatory effect on iron uptake from NTBI, see
Figure 7-2 bottom panel and Figure 7.4. A lack of such effect was noted also for
holotransferrin (not shown, but see Figure 7-5). Similar experiments were
performed with 1µM buffered ferric citrate in MOPS, pH 7.4 with 1:100 ratio of
Fe:citrate, see Figure 7-3. This experiment shows that comparable uptake may be
obtained using either 5µM FAC or 1µM ferric citrate and that the latter is equally
efficiently inhibited by apotransferrin; see Figure 7-3, inset.
From the above experiments, we can conclude that apotransferrin has a rapid
inhibitory effect on cardiac uptake of iron from NTBI sources such as FAC or
buffered ferric citrate. Analogous time for buffered ferric citrate is 800 seconds
for the ApoTf dose of 2µM while for 0.5µM that time approaches about 1000s.
Therefore, the time of uptake inhibition must be relatively short in order for the
four processes listed above to have occurred within 800-1000s.
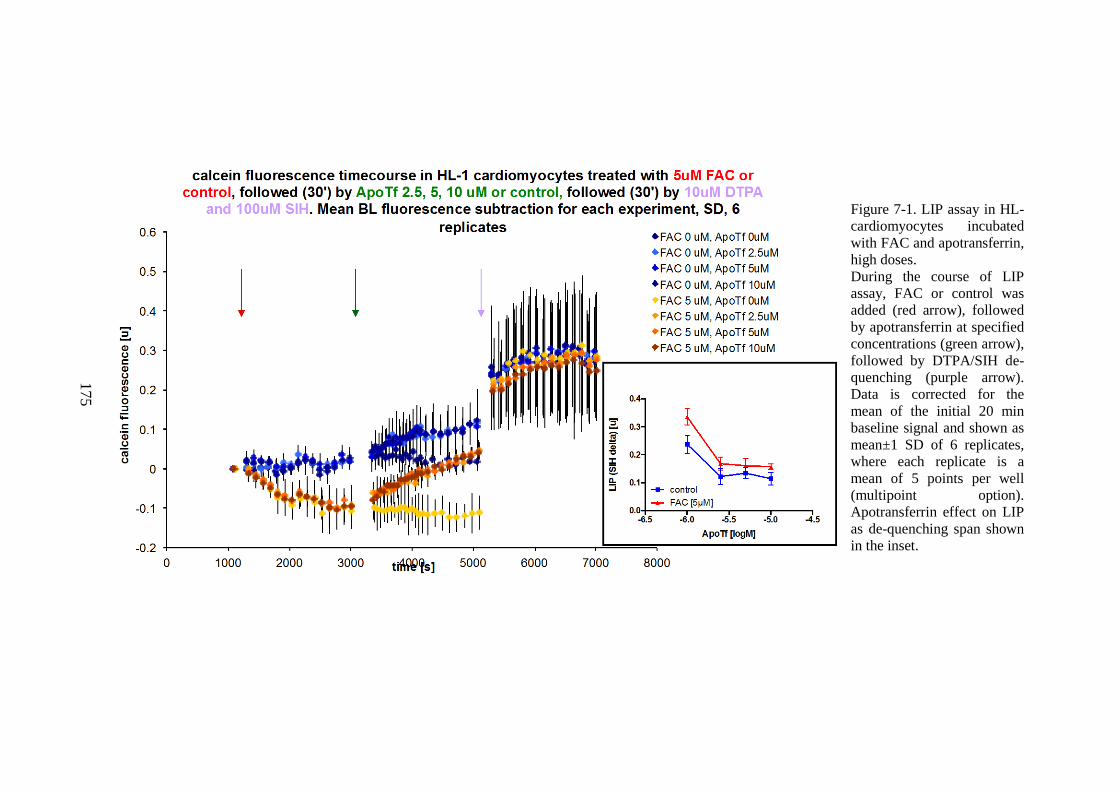
175
Figure 7-1. LIP assay in HL-cardiomyocytes incubated with FAC and apotransferrin, high doses. During the course of LIP assay, FAC or control was added (red arrow), followed by apotransferrin at specified concentrations (green arrow), followed by DTPA/SIH de-quenching (purple arrow). Data is corrected for the mean of the initial 20 min baseline signal and shown as mean±1 SD of 6 replicates, where each replicate is a mean of 5 points per well (multipoint option). Apotransferrin effect on LIP as de-quenching span shown in the inset.
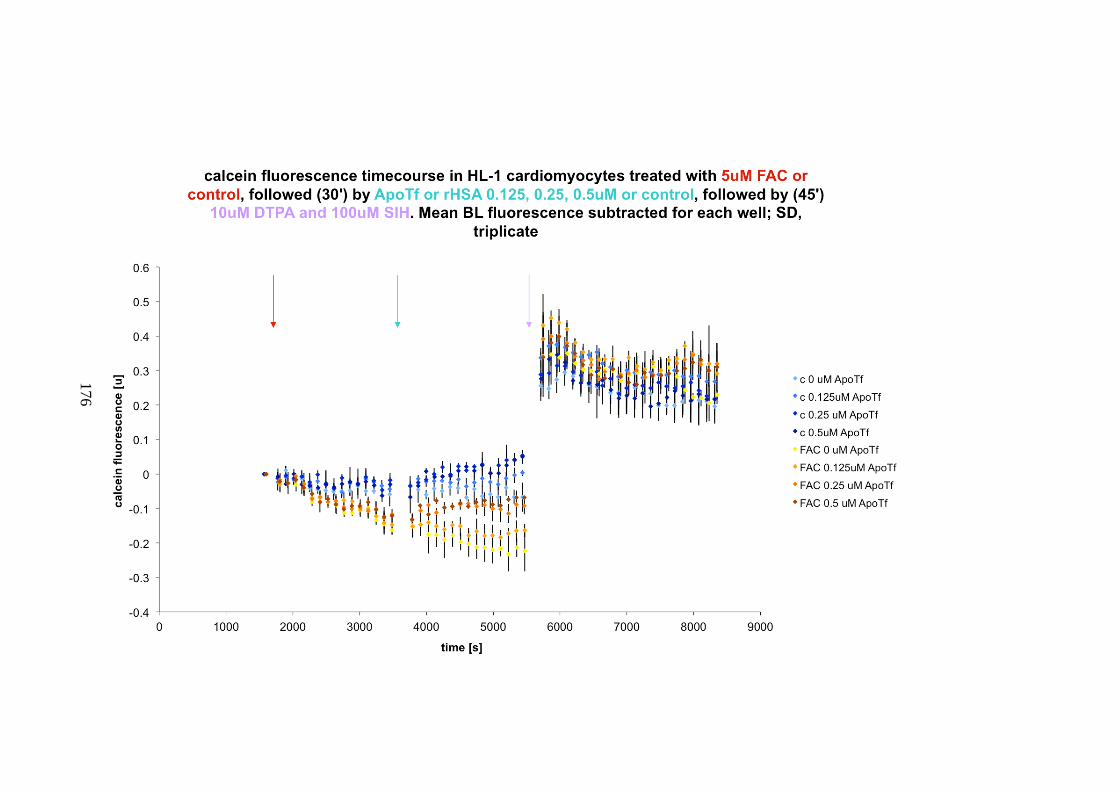
176

177
Figure 7-2. LIP assay in HL-cardiomyocytes incubated with FAC and apotransferrin or rHSA (previous and current page). During the course of LIP assay, FAC or control was added (red arrow), followed by apotransferrin (top) or rHSA (bottom) at specified concentrations (green arrow), followed by DTPA/SIH de-quenching (purple arrow). Data is corrected for the mean of initial 20 min baseline signal and shown as mean±1 SD of triplicates, where each replicate is a mean of 5 points per well (multipoint option). Similar lack of effect as for rHSA was seen with holotransferrin, not shown.
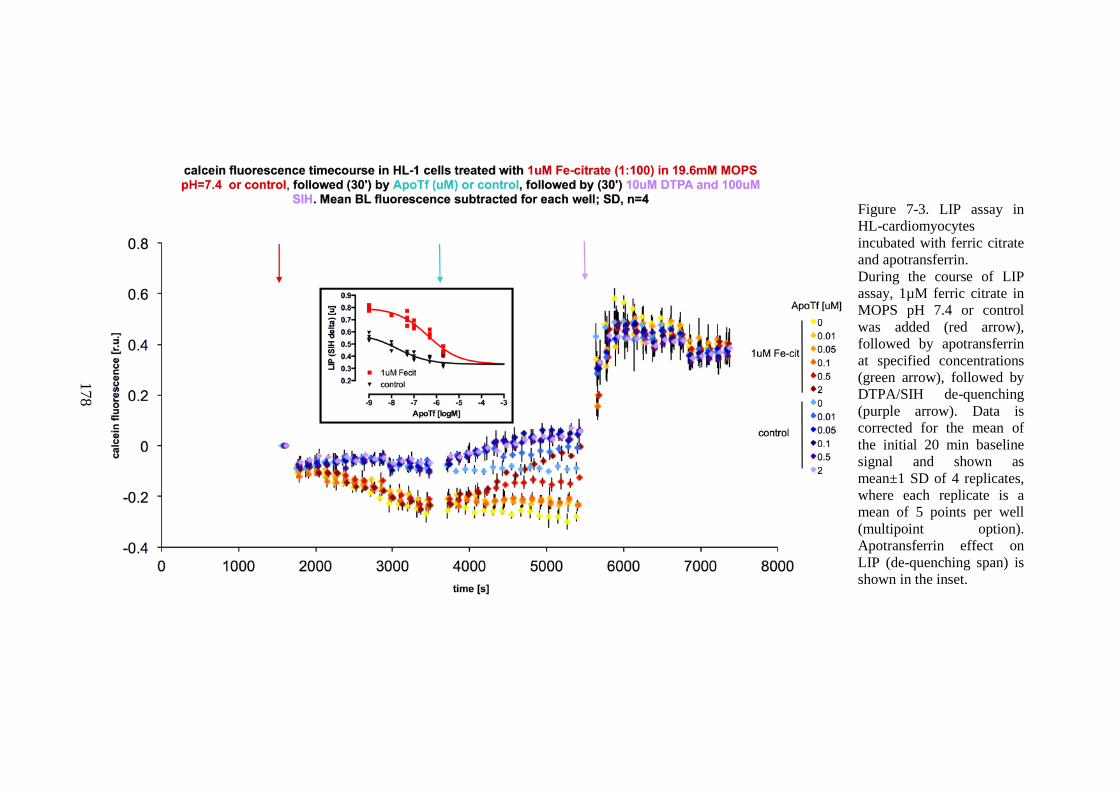
178
Figure 7-3. LIP assay in HL-cardiomyocytes incubated with ferric citrate and apotransferrin. During the course of LIP assay, 1µM ferric citrate in MOPS pH 7.4 or control was added (red arrow), followed by apotransferrin at specified concentrations (green arrow), followed by DTPA/SIH de-quenching (purple arrow). Data is corrected for the mean of the initial 20 min baseline signal and shown as mean±1 SD of 4 replicates, where each replicate is a mean of 5 points per well (multipoint option). Apotransferrin effect on LIP (de-quenching span) is shown in the inset.
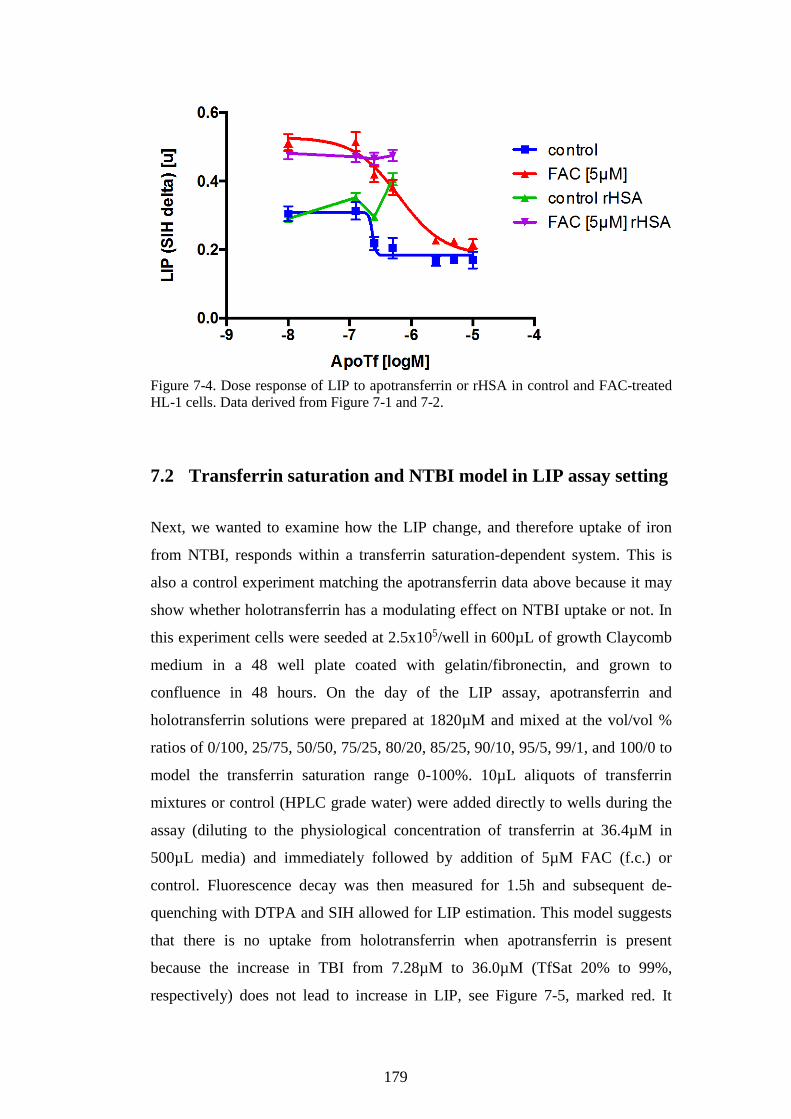
179
Figure 7-4. Dose response of LIP to apotransferrin or rHSA in control and FAC-treated HL-1 cells. Data derived from Figure 7-1 and 7-2.
7.2 Transferrin saturation and NTBI model in LIP assay setting
Next, we wanted to examine how the LIP change, and therefore uptake of iron
from NTBI, responds within a transferrin saturation-dependent system. This is
also a control experiment matching the apotransferrin data above because it may
show whether holotransferrin has a modulating effect on NTBI uptake or not. In
this experiment cells were seeded at 2.5x10⁵/well in 600µL of growth Claycomb
medium in a 48 well plate coated with gelatin/fibronectin, and grown to
confluence in 48 hours. On the day of the LIP assay, apotransferrin and
holotransferrin solutions were prepared at 1820µM and mixed at the vol/vol %
ratios of 0/100, 25/75, 50/50, 75/25, 80/20, 85/25, 90/10, 95/5, 99/1, and 100/0 to
model the transferrin saturation range 0-100%. 10µL aliquots of transferrin
mixtures or control (HPLC grade water) were added directly to wells during the
assay (diluting to the physiological concentration of transferrin at 36.4µM in
500µL media) and immediately followed by addition of 5µM FAC (f.c.) or
control. Fluorescence decay was then measured for 1.5h and subsequent de-
quenching with DTPA and SIH allowed for LIP estimation. This model suggests
that there is no uptake from holotransferrin when apotransferrin is present
because the increase in TBI from 7.28µM to 36.0µM (TfSat 20% to 99%,
respectively) does not lead to increase in LIP, see Figure 7-5, marked red. It
180
became apparent that the preparation of holotransferrin is contaminated with
stray, loosely bound iron whose effect on LIP may be titrated with low
concentrations of apotransferrin (here 1% i.e. 0.36µM) and/or CP40 chelator (see
below). On the other hand, lower LIP for TfSat values up to 90%, in comparison
to transferrin-negative FAC-negative control, suggests that the LIP difference
exerted by contamination iron amounts to 0.07 LIP units (12% of the LIP range).
NTBI uptake from FAC is only detected as a change in LIP when transferrin is
nearly completely saturated at 95% or above, indicating that in the LIP-based
mode of uptake 5% ApoTf or ~1.8µM will reduce NTBI uptake from 5µM FAC
to about 50% while 3.6µM will abrogate it completely (TfSat=90%). This is in
agreement with Figure 5-2E, which showed parallel data for total cellular iron-
based uptake model.

181
Figure 7-5. LIP change in HL-1 cardiomyocytes after iron uptake from NTBI is dependent on transferrin saturation. During the LIP assay, HL-1 cells were exposed to variable ratios of holotransferrin and apotransferrin to model transferrin saturation at physiological total transferrin concentration (~36µM). At the same time control (red) or NTBI was introduced into each well as 5µM FAC (black). LIP values (f.u.) were derived from exponential association span fitted to post-SIH de-quenching of calcein fluorescence. Data presented as mean±1SD of duplicates where each replicate is a mean of 5 points per well (multipoint option).

182
7.2.1 Ferrotransferrin does not affect NTBI uptake and is not a donor of iron in confluent HL-1 cells: CP40 chelator control.
Because of the likely contamination of holotransferrin with stray iron during
saturation, we further tested the model using holotransferrin with 100µM of
CP40, an extra-cellular non-permeable chelator. The chelator was added
immediately before the addition of FAC during the assay. We have also included
NTBI in the system as FAC in a dose-response design. The results show that iron
uptake from FAC into cardiomyocytes is saturable, from the perspective of both
the LIP dose response (EC50=0.798µM, Figure 7-6A) and the dose response
based on the constant k of calcein fluorescence decay (EC50=3.2µM, Figure
7-6F). The effect of CP40 shows that the background iron in media is about
1µM, the difference in LIP between control and CP40 being equivalent to that
resulting from 1µM FAC in control in Figure 7-6A. 100%-saturated transferrin at
35.6µM concentration of holotransferrin seemingly introduces more iron to the
cells (Figure 7-6B), but under CP40 control, this is shown to be only
contamination iron in transferrin preparation (Figure 7-6C). This approach also
confirms that apotransferrin 35.6µM acts like a chelator for the extracellular
NTBI across the whole range 0-30µM. There is also no difference between the
effects of ApoTf with CP40 and holoTf with CP40 on uptake from FAC. The
difference between the effect of Apotf and ApoTf+CP40 on uptake from FAC,
trivial but significant (Figure 7-6D) may stem from the IBE difference (71.2 vs.
171.2µM), but in the latter case it is possible that some CP40 (there being more
CP40 un-complexed with iron, in comparison with control+CP40) enter the cells
and compete with calcein for LIP iron. However, this is unlikely, given that
CP40 has one of the lowest partition coefficient among hydroxypyridinone
chelators(Porter et al, 1990); this validates in its own right the use of CP40 as a
control. Nevertheless, we have also attempted to purify the holotransferrin
formation to address the issue of contamination iron.

183
Figure 7-6. The effect of apotransferrin, holotransferrin and CP40 on the NTBI uptake from FAC shown as LIP levels in confluent HL-1 cardiomyocytes. (A) The control (blue) or control with 100µM CP40 (red) is shown as dose response of LIP to FAC; CP40 abrogates uptake of iron from FAC. Control dose-response EC50=0.8µM, 95% CI 0.24-2.69µM. (B) The control (blue) is shown together with 35.6µM holotransferrin (orange) and 35.6µM apotransferrin (green) where apotransferrin abrogates uptake from FAC. (C) Comparison of uptake from FAC in the presence of 35.6µM holotransferrin with (black) or without (yellow) 100µM CP40. (D) Comparison of iron uptake from FAC in the presence of 35.6µM apotransferrin with (purple) or without (green) 100µM CP40. (E) Comparison of uptake from FAC in the presence of 100µM CP40 alone (red) or with 35.6µM holotransferrin (black) or with 35.6µM apotransferrin (purple). (F) Uptake of iron from FAC shown as k of exponential decay in calcein fluorescence, EC50=3.23µM, 95% CI 2.54-4.11µM.
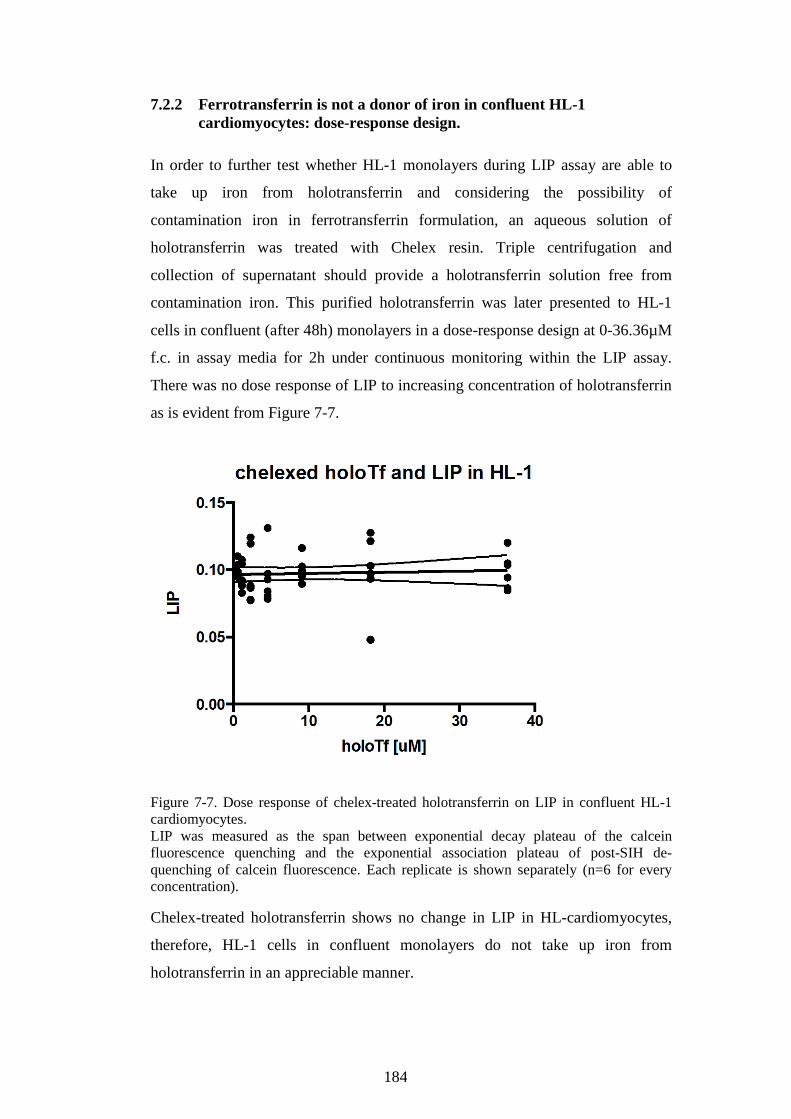
184
7.2.2 Ferrotransferrin is not a donor of iron in confluent HL-1 cardiomyocytes: dose-response design.
In order to further test whether HL-1 monolayers during LIP assay are able to
take up iron from holotransferrin and considering the possibility of
contamination iron in ferrotransferrin formulation, an aqueous solution of
holotransferrin was treated with Chelex resin. Triple centrifugation and
collection of supernatant should provide a holotransferrin solution free from
contamination iron. This purified holotransferrin was later presented to HL-1
cells in confluent (after 48h) monolayers in a dose-response design at 0-36.36µM
f.c. in assay media for 2h under continuous monitoring within the LIP assay.
There was no dose response of LIP to increasing concentration of holotransferrin
as is evident from Figure 7-7.
Figure 7-7. Dose response of chelex-treated holotransferrin on LIP in confluent HL-1 cardiomyocytes. LIP was measured as the span between exponential decay plateau of the calcein fluorescence quenching and the exponential association plateau of post-SIH de-quenching of calcein fluorescence. Each replicate is shown separately (n=6 for every concentration).
Chelex-treated holotransferrin shows no change in LIP in HL-cardiomyocytes,
therefore, HL-1 cells in confluent monolayers do not take up iron from
holotransferrin in an appreciable manner.

185
In conclusion, it was established that LIP based iron uptake from NTBI source
such as FAC is saturable and that apotransferrin is capable of inhibiting loading
from FAC at low concentrations whereas ferrotransferrin has no effect on uptake
from NTBI.

186
Chapter 8 Intracellular ROS levels in HL-1 cardiomyocytes as a measure of iron uptake
In this chapter, the NTBI uptake into cardiomyocytes is monitored using an
intracellular ROS assay. Because of the high sensitivity of the assay, it is
possible to study short-term effect of uptake, for which the ferrozine total cellular
iron assay is not well suited, given the relatively small amount of cells in wells.
The cytosolic ROS is produced in response to increased iron in the labile iron
pool; it shows therefore indirectly the amount of iron that is available for
metabolic utilisation, incorporation into ferritin storage or exit via ferroportin.
Part of this work was presented at 2015 ASH Conference as an oral
abstract(Garbowski et al, 2015b)
8.1 Apotransferrin effects on iron-dependent ROS levels in cardiomyocytes
For these experiments, cells were grown in 48-well or 96-well plates in growth
Claycomb media until confluence was achieved and processed for the assay as
described in Methodology chapter, see 2.1.3.3. Experimental media were
prepared as 50-fold concentrated solutions to be added directly to the wells
immediately before the assay as 10µL aliquots. It was shown in 2.1.3.3 that ROS
assay in our model reflects iron uptake into the cardiomyocytes with high
sensitivity and specificity for iron. Therefore, cellular iron accumulation may
exert an effect on intracellular ROS generation. When HL-1 cells were incubated
with increasing concentrations of buffered ferric citrate, intracellular ROS levels
increased Figure 8-1A) in a dose-response fashion. The increase in ROS levels
representing uptake of iron from ferric citrate over the duration of the assay (90
minutes) highly correlated (Pearson, r=0.91, p<0.0001) with the increase in total
cellular iron by ferrozine assay following 24h uptake from the same
concentrations of ferric citrate (Figure 8-1C). The extracellular iron chelator
CP40 (100µM) inhibited ROS formation for all FC concentrations tested,
consistent with inhibition of cellular iron uptake from FC by the excess of this
iron chelator. Apotransferrin also inhibited ROS formation at FC concentrations
up to 5µM but at higher ferric citrate concentrations, ROS increased above
control, implying increased iron uptake. This may indicate that when the

187
concentration of ferric citrate exceeds the binding capacity of apotransferrin, then
iron is taken into cells and ROS generated. However, this does not explain why
ROS values under these conditions actually exceed those obtained with the same
concentration of FC alone (Figure 8-1A, in purple).
8.2 Apotransferrin outweighs holotransferrin in its modulatory effect on uptake from NTBI
We explored the intracellular ROS effect of iron uptake as a marker of
intracellular delivery of iron that is metabolically active within 90 minutes from
uptake onset. Thus, the dose response of ROS to FC confirms that NTBI
contributes to the cytoplasmic labile iron pool and may be a sensitive and
specific indirect measure of uptake, under the control of high-affinity specific
iron chelators that withhold iron from uptake (such as membrane-impermeable
CP40) and from partaking in ROS catalysis intracellularly (membrane-permeable
deferiprone). It also shows that diferric transferrin is capable of delivering a
negligible amount of iron from retention and intracellular ROS formation
perspective, mouse and human both being eutherian(Huebers & Finch, 1987;
Lim et al, 1987). Diferric transferrin does not, however, interfere with NTBI
uptake. Apotransferrin, in a dose-response fashion, inhibits NTBI uptake and
NTBI-dependent ROS formation intracellularly, although at extremely high
NTBI concentrations (here: 10 and 30µM), that are rarely observed in
transfusional haemosiderosis, sub-stoichiometric concentration of ApoTf may
induce conditions where, paradoxically, iron uptake from these polymeric NTBI
species is higher than when apotransferrin is absent, but abrogated at equivalent
of holotransferrin on intracellular ROS is counterintuitive, but it can be explained as
follows: holotransferrin preparation was 95% (5% apotransferrin), so as its dose

188

189
Figure 8-1. Intracellular ROS levels reflect the uptake of FC into cardiomyocytes within 45 minutes (previous page). (A) ROS levels in HL-1 cardiomyocytes using DCF assay shown as slopes of DCF fluorescence units over time (fu/s, 90min) as a function of control (blue) ferric (0-30µM) citrate (100µM) in MOPS pH 7.4 in supplemented Claycomb medium (without FCS), added immediately after 100µM IBE CP40 (red) and deferiprone (green), as well as 5µM ApoTf (purple) and 3.57µM 95% saturated transferrin (orange) were added at the onset of 90 min incubation in the plate reader. (B) As in A but 100µM IBE CP40 ± 95% saturated transferrin tracings are shown where ROS formation is increased with holotransferrin independently of NTBI (FC) (note that absolute increase in ROS is small compared to increased due to NTBI, see A). (C) The relationship of intracellular ROS levels by DCF method and the total cellular iron by ferrozine method, r=0.91, p<0.0001; Deming regression slope 1.14*10-5±1.68*10-6, intercept 2.69*10-5±5.08*10-6 (D) Dose response of intracellular HL-1 ROS to 95% saturated transferrin ± 100µM IBE CP40. The amount of corresponding ApoTf (nM) is shown in italics. (E) Intracellular ROS formation from the recent uptake of iron from predominantly oligomer species (10 and 30µM iron and 100µM citrate) control under dose response effect of apotransferrin 0-16µM in 30mM bicarbonate/PBS.
increases, so does the dose of apotransferrin, Figure 8-1D. It is remarkable
therefore that the increase in absolute apotransferrin levels has a greater
influence on intracellular ROS than the increase in holotransferrin, where the
latter is 20-fold higher. This, in turn, suggests that the iron uptake from
holotransferrin is small compared with that of NTBI (or, here, background iron),
and further, that apotransferrin has the capacity to inhibit iron uptake and ROS
formation when NTBI is present.
8.3 Which species is taken up into the cardiomyocytes?
The ApoTf-dependent paradoxical increase and subsequent abrogation of iron
uptake from polymeric FC in Figure 8-1E help explain the increase in ROS
levels for ≥5µM apotransferrin+10µM FC in Figure 8-1A and can be attributed
to cardiac uptake of a nascent monomer (ferric monocitrate) released from FC
oligomers by the apotransferrin-bicarbonate system. Bates et al showed that the
rate-limiting step of polymeric FC iron exchange with apotransferrin is the de-
polymerization and release of monomeric (mononuclear) FC(Bates et al, 1967).
Whether that is ferric monocitrate or dicitrate is further suggested by his
observation that dicitrate is nonreactive with apotransferrin unless it is converted
to an active intermediate he supposed to be the monocitrate. We now know that it
must be monocitrate because it and not the dicitrate is relatively more redox-
active, and apotransferrin reduces LPI at 1:100 Fe:citrate ratio where oligomers
190
are absent (Figure 6-1E). Ferric monocitrate as an intermediate is present in
speciation plots of FC, but under physiological pH is so low at thermodynamic
equilibrium that it is not graphically apparent(Silva et al, 2009). However, we are
considering here an open dynamic system where this intermediate undertakes
significant concentration changes when the equilibrium is perturbed in both
directions by apotransferrin or uptake systems or oligomer decomposition. That
ApoTf inhibits cardiomyocyte uptake from FC identifies the species being taken
up as ferric monocitrate because apotransferrin does not bind ferric dicitrate and
binds oligomer species very slowly, dependent upon their depolymerisation
rate(Bates et al, 1967). Therefore the species being taken up and increasing
myocardial ROS in Figure 8-1E is the monocitrate which is present in small
quantities in equilibrium with the oligomers (control) and then undergoes delayed
release in molar excess of the disrupting apotransferrin in the course of the
bicarbonate-apotransferrin dependent breakdown (re-speciation) of oligomer FC
complexes – initially - above the chelating capacity of ApoTf. Furthermore, these
polymers are built solely from ferric monocitrate monomer ‘bricks’ (polymerization)
since sufficient amount of apotransferrin can chelate away the entire pool of iron in
the complexes. Hexa-coordinated iron in the dicitrate is relatively oxido-reductively
inert in contrast to the monocitrate (tri-coordinated), but polymeric FC can also
redox-cycle not being fully coordinated by citrate and having fewer catalytic sites
per iron atom compared to the ferric monocitrate. Hence, the LPI-detectable FC is a
mixture of both the highly active monocitrate and less active polymers but not of
ferric dicitrate. Dicitrate remains in equilibrium with monocitrate and can be taken
up into the cardiomyocyte through the mediation of the latter, the uptake requiring a
reduction step. It is easier thermodynamically for the dicitrate than the oligomers to
be a source of monocitrate, as the uptake from dicitrate is faster than from the
oligomers (1:100 vs. 1:10 in Figure 5-2A, see also Figure 8-2). The competition of
apotransferrin with the uptake mechanism for the ferric monocitrate explains why
apotransferrin can abolish ROS formation from FC in cardiomyocytes. Therefore,
we can conclude from the above that the species being taken up by the
cardiomyocytes is the ferric monocitrate.

191

192
Figure 8-2. Delay of uptake from oligomer FC after apotransferrin-bicarbonate-dependent depolymerisation (previous page). Intracellular ROS as a measure of iron uptake, regressed on time [s], shows increased uptake from 10µM FC (1:10) as a function of added apotransferrin (arrow) at a concentration ranging from 0 to 16µM (A-H). Subsequent plateau represents delayed uptake, marked with a red dashed line with 95% CI lines (black dotted) was fitted to the data using plateau followed by one phase association. (J) The relationship between the delay plateau duration (from A-I) and the concentration of apotransferrin.
Why is there a transient delay in uptake from polymeric ferric citrate in Figure
8-2 after apotransferrin addition, which is dependent upon apotransferrin dose?
The explanation should be sought for in the capacity of apotransferrin to “break
down” the oligomer structure of the ferric citrate species present at 1:10 ratio of
iron to citrate. One explanation is that as the Fe-O-Fe bond is disrupted in
oligomer species by apotransferrin in order to bind a monomeric ferric
monocitrate with the assistance of bicarbonate, the remaining ferric monocitrate
monomers released from the oligomer will either undergo uptake via reduction or
binding to citrate to form ferric dicitrate. The latter is not taken up (being much
less labile therefore not a likely substrate for uptake). When apotransferrin is
absent, there exists a dynamic equilibrium between oligomers and the monomer
ferric monocitrate (polymer-monomer equilibrium), which is taken up so the
equilibrium is perturbed and increased depolymerisation ensues until equilibrium
is reached again. It is further complicated by the equilibrium between ferric
monocitrate and ferric dicitrate depending on the ratio of iron to citrate in the
solution. When a given concentration of apotransferrin disturbs the equilibrium
by selectively removing ferric monocitrate, uptake is transiently stopped or
reduced to a rate at which ROS formation rate is lower than ROS scavenging rate
in the cytosol (a matter of few minutes, the plateau flat line in Figure 8-2A-H).
At the same time, more FC depolymerisation occurs to regain the equilibrium
and this continues until all transferrin sites are engaged. The rate of
depolymerisation apparently depends on the concentration of apotransferrin
introduced, the higher the latter, the higher the former, up to a point seen in
Figure 8-2J. However, it is also more likely that e.g trimers depolymerise into
three monomers only rather than to dimers and a monomer, which creates an
accelerated release of monomers exceeding the IBE of the apotransferrin
introduced. In such conditions a new equilibrium will be reached but it involves
more pathways: re-polymerisation of monomers into oligomers dependent on the
193
new ratio of iron to citrate after some iron has been chelated by transferrin (this
being now increasingly less favourable), or conversely: binding of citrate to form
ferric dicitrate, or finally cellular uptake via reductive process. It is evident from
our data that regaining the new equilibrium favours uptake (Figure 8-1E). We
can see that when apotransferrin is increased to a certain level, the delay does not
change any further (Figure 8-2J) which for 10µM ferric citrate is just under 5µM
ApoTf (or 10µM IBE). This suggests that close to an effective chelating dose of
apotransferrin and above, the delay having reached its maximum, the substrate
for uptake approaches the levels equivalent to pFe of transferrin (well below the
sensitivity of the assay) and the ROS values return to baseline levels. A good
way to test this further will be to introduce specific inhibitors of ferrireductase in
order to interfere with uptake from the accelerated release of monomers from FC
depolymerisation inferred above; we plan to do this at a later stage.
8.4 Model of ferric citrate speciation
A model of ferric citrate speciation can now be proposed based on the findings in
this work. It is summarised in Figure 8-3, where the interrelationship of the
principal ferric citrate species is tentatively shown.
The advantage of this model is that it builds on the significance of ferric
monocitrate in the complex equilibrium between species, and thus sheds some
light on NTBI uptake mechanisms in cardiomyocytes, and potentially other cells.
At the same time, it explains how apotransferrin binds multi-speciated NTBI.
The disadvantage of this model is that it omits the effect of albumin. While work
towards that goal has been underway, the expostion and explanation of these
results are currently beyond the scope of this thesis.
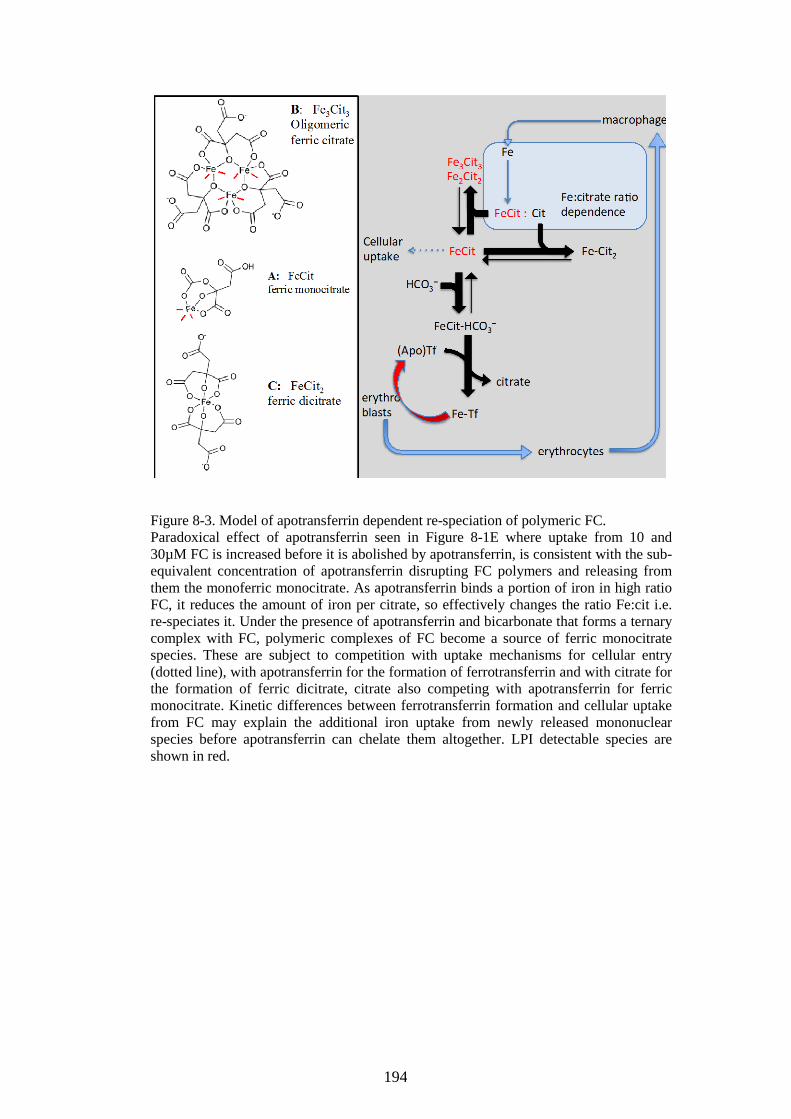
194
Figure 8-3. Model of apotransferrin dependent re-speciation of polymeric FC. Paradoxical effect of apotransferrin seen in Figure 8-1E where uptake from 10 and 30µM FC is increased before it is abolished by apotransferrin, is consistent with the sub-equivalent concentration of apotransferrin disrupting FC polymers and releasing from them the monoferric monocitrate. As apotransferrin binds a portion of iron in high ratio FC, it reduces the amount of iron per citrate, so effectively changes the ratio Fe:cit i.e. re-speciates it. Under the presence of apotransferrin and bicarbonate that forms a ternary complex with FC, polymeric complexes of FC become a source of ferric monocitrate species. These are subject to competition with uptake mechanisms for cellular entry (dotted line), with apotransferrin for the formation of ferrotransferrin and with citrate for the formation of ferric dicitrate, citrate also competing with apotransferrin for ferric monocitrate. Kinetic differences between ferrotransferrin formation and cellular uptake from FC may explain the additional iron uptake from newly released mononuclear species before apotransferrin can chelate them altogether. LPI detectable species are shown in red.

195
Chapter 9 Conclusion
Based on the transferrin sink model derived from our clinical data (3.3.4) which
is supported by the conclusions from experimental chapters (Chapter 5, Chapter
6, Chapter 7, and Chapter 8) we state the principal conclusion of this thesis:
Small amount of apotransferrin withholds that NTBI species from NTBI pool
which is otherwise most readily taken up by cardiomyocytes (monoferric LPI i.e.
ferric monocitrate). It is apparent from our data that this withholding can take
place anywhere in the plasma compartment i.e. in the marrow sinusoids or
around reticulocytes where a transient local increase in apotransferrin (high
surface layer vs. bulk concentration), implied by high ETUR, forms a sink for
LPI subspecies of NTBI thereby protecting against MH. In other words, high
local apotransferrin around marrow sinusoids and reticulocytes can affect the
speciation of NTBI in the bulk phase. In DFO-chelated TDT, studied before the
NTBI and cardiac MRI measurement could be employed(Cazzola et al, 1997),
the background erythropoiesis, increased by lowering transfusion thresholds,
reduced ILR, which led to lower extrahepatic haemosiderosis, as judged from
spontaneous puberty rate differences and lack of clinical cardiac complications.
That study suggested similar insights to the ones we experimentally present here.
Moreover, it also strengthens the implication of our conclusion that, in light of
the findings presented in this thesis, a review of transfusion policy in TDT is
needed. Namely, that the patients with MH could potentially benefit from a more
liberal transfusion regimen in order to increase their residual erythropoiesis.
Taken together our data suggest that the risk of MH in TDT is critically
dependent on the degree of residual erythropoiesis and the net balance between
the transfusional iron delivery (ILR) and the iron utilisation rate by the erythron
(ETUR). MH occurs when the net ILR-ETUR exceeds 0.21 mg/kg/day, the same
threshold above which LPI significantly increased. The likely mechanism is that
higher ILR-ETUR allows transiently formed apotransferrin to decrease LPI. This
mechanism is supported by the findings that as little as 1µM apotransferrin
inhibits NTBI uptake into cardiomyocytes in culture while also decreasing LPI.
196
Summary
This thesis aims to identify factors that affect the propensity to extra-hepatic iron
deposition, particularly myocardial haemosiderosis (MH), in transfusional iron
overload. This has been achieved in two ways: firstly by analysis of clinical data
in order to compare myocardial iron (estimated by MRI using mR2*) to clinical
markers of iron metabolism and erythropoiesis. Secondly, an in vitro cell culture
of a cardiomyocyte cell line (HL-1) was used to test hypotheses about factors
that determine uptake and iron retention by these cells.
Analysis of clinical data in 73 transfusionally iron overloaded patients with
transfusion-dependent thalassaemia (TDT) has thus far identified that the level of
soluble transferrin receptors (sTfR) is the most significant novel factor associated
with MH, rather than non-transferrin-bound iron (NTBI). Analysis of the data
also shows that MH is most likely when the transfusional iron-loading rate (ILR)
exceeds the erythroid iron consumption (the erythroid transferrin iron uptake
rate, ETUR, as derived from sTfR). MH occurred only when ILR exceeded the
ETUR by >0.21mg/kg/d. Labile plasma iron (LPI) was >3-fold higher above this
ETUR threshold, while NTBI and transferrin saturation (TfSat) showed no
difference, implicating the LPI fraction of NTBI in MH. We hypothesised that
high ETUR decreases MH through increased generation of apotransferrin by the
erythron.
Other variables that show significant associations with MH are bilirubin,
reticulocytes, hepcidin, liver iron concentration (LIC), serum ferritin, LPI, and
underlying genetic cause of anaemia. However, NTBI, pre-transfusion
haemoglobin, TfSat, and years of transfusion did not show significant
associations. All TDT patients analysed here were receiving chelation therapy
with deferasirox so that the variability of myocardial iron loading observed is
largely independent of chelation.
In order to study iron uptake and retention within cardiomyocytes, systems for
determining labile intracellular iron pool (LIP), cytosolic reactive oxygen species
(ROS), and total cellular iron have been developed and adapted from published

197
methods. We used a cardiomyocyte (HL-1) cell line to explore the effects of
NTBI speciation (iron:citrate ratio) and apotransferrin on the iron uptake. Uptake
was most efficient when citrate exceeded iron >100-fold, as was intracellular
ROS formation and extracellular iron detectability using the labile plasma iron
(LPI) assay. Apotransferrin, when in excess, inhibited iron uptake, decreased
intracellular ROS and decreased NTBI species detectable by LPI assay.
However, at very high NTBI concentrations (≥10µM), when the iron content of
ferric citrate (FC) exceeded the binding capacity of ApoTf, iron uptake was
increased above that seen without transferrin present. We have suggested that at
these conditions oligomeric ferric citrate breaks down into monomers of ferric
monocitrate that are both LPI-detectable and enter myocardium. We propose that
in TDT, transient generation of ApoTf under conditions of high residual
erythropoiesis decreases MH by binding LPI-detectable species of NTBI.
NTBI is a heterogeneously speciated plasma iron, typically detectable when
TfSat exceeds 75%. Given the importance of ferric citrate speciation for
myocardial uptake, as part of this thesis, it was investigated how examining
NTBI from the perspective of two different assays with different assay principles
might inform our knowledge of NTBI speciation in vivo. Here we examined
factors affecting NTBI levels by a recently discovered direct chelator-based
(CP851) fluorescent bead-linked flow-cytometric assay (bead-NTBI), compared
with the established indirect nitrilotriacetate (NTA) assay in 122 iron-overloaded
patients, including 64 on recent iron chelation therapy and 13 healthy volunteers.
Both methods correlated (r=0.57, p<0.0001) but with low agreement, attributable
to two major factors: (1) the NTA method, unlike the bead method, is highly
dependent on TfSat, with NTBI under-estimation at low TfSat and over-
estimation once Tf is saturated, (2) the bead method detects <3-fold higher
values than the NTA assay in patients on recent deferiprone-containing chelation
due to greater detection of chelate complexes but lower values for patients on
deferasirox. The optimal timing of sample collection relative to chelation dosing
requires further study. Patients with splenectomy, high storage iron and increased
erythropoiesis had the greater discrepancy between assays, consistent with
differential access by both methods to the NTBI pools associated with these
clinical variables. The bead-NTBI assay has advantages over the NTA assay,
198
being less dependent on TfSat, hence of less tendency for false-negative or false-
positive values at low and high TfSat, respectively. Comparison of NTBI values
by these two methods suggests that different methods may have access to
different species of NTBI in vivo. Further work is, however, necessary to model
NTBI speciation in vivo and identification of species that best predicts extra-
hepatic iron distribution.
In conclusion, this thesis establishes that MH is less likely when residual
erythropoiesis in TDT is maintained at a level that allows the locally formed
apotransferrin to recycle at a sufficient rate to remove LPI detectable ferric
monocitrate, which otherwise is taken up into the heart. This highlights
qualitative differences in NTBI as crucial to understanding which patients are
likely to have MH and which are not. There is a need to directly demonstrate
such clinically relevant speciation differences in NTBI, for example by
comparing how two NTBI methods detect NTBI clinically. This approach,
however, highlighted certain drawbacks of methods rather than positive
identification of relevant species, therefore, further work is necessary for method
development to better address that task.
199
Chapter 10 Appendix: PUBLICATIONS
10.1 Publications from this thesis
Garbowski M, Eleftheriou P, Pennell D, Tanner M, Porter JB. Impact of
Compliance, Ferritin and LIC on Long-Term Trends in Myocardial T2* with
Deferasirox. Blood. 2008;112(11):116.
Sarantos K, Evans P, Garbowski M, Davis B, Porter JB. Vitamin C Deficiency
in Patients on Long-Term Deferasirox without Supplementation. Blood.
2008;112(11):1858.
Garbowski MW, Fabre M, Evans P, Porter JB. Vitamin C Status in
Transfusionally Iron-Overloaded Patients On Long-Term Deferasirox and Its
Relationship to Myocardial Iron Removal. Blood. 2009;114(22):2005.
Garbowski MW, Carpenter J-P, Smith G, Pennell DJ, Porter JB. Calibration of
Improved T2* Method for the Estimation of Liver Iron Concentration in
Transfusional Iron Overload. Blood. 2009;114(22):2004.
Garbowski MW, Porter JB. Trends in myocardial haemosiderosis relate to
vitamin D status in transfusionally iron overloaded patients
British Journal of Haematology, 2010, 149, (Suppl. 1), 1-96, Abstract 242
Thomas AS, Garbowski M, Ang AL, et al. A Decade Follow-up of a
Thalassemia Major (TM) Cohort Monitored by Cardiac Magnetic Resonance
Imaging (CMR): Significant Reduction In Patients with Cardiac Iron and In
Total Mortality. Blood. 2010;116(21):1011.
Ang AL, Shah FT, Davis BA, Thomas AS, Murugachandran G, Kumuradevan J,
Garbowski MW, Porter, JB. Deferiprone Is Associated with Lower Serum
Ferritin (SF) Relative to Liver Iron Concentration (LIC) Than Deferoxamine and
Deferasirox- Implications for Clinical Practice. Blood. 2010;116(21):4246.
200
Evans P, Shah F, Sayani F, Bansal S, Garbowski M, Weljie A, Walter P, Hider
R, Porter J. Contrasting relationships of serum non-transferrin bound iron and
transferrin saturation to iron overload, ineffective erythropoiesis and serum
hepcidin in sickle cell and thalassaemia disorders. Am. J. Hematol.
2013;88(5):E152. Poster Abstract no 189. 2013 BioIron Conf. London 2013.
2013;E152
Porter J, Garbowski M. Consequences and management of iron overload in
sickle cell disease. Hematology Am. Soc. Hematol. Educ. Program.
2013;2013:447–56.
Garbowski MW, Carpenter JP, Smith G, et al. Biopsy-based calibration of T2*
magnetic resonance for estimation of liver iron concentration and comparison
with R2 Ferriscan. J Cardiovasc Magn Reson. 2014;16:40.
Porter JB, Garbowski M. The pathophysiology of transfusional iron overload.
Hematol. Oncol. Clin. North Am. 2014;28(4):683–701.
Porter JB, Walter PB, Neumayr LD, Evans P, Bansal S, Garbowski M, et al.
Mechanisms of plasma non-transferrin bound iron generation: Insights from
comparing transfused Diamond-Blackfan anaemia with sickle cell and
thalassaemia patients. Br. J. Haematol. 2014;167(5):692–696.
Porter JB, Garbowski MW. Novel Erythropoiesis Stimulating Agents in
Thalassaemia. 20th Congress of the European Hematology Association Vienna,
Austria, June 11-14, 2015, Education Session, EHA Learning Center, Jun 13,
2015, 103616
Garbowski M, Ma Y, Evans P, et al. Clinical factors affecting the NTBI levels:
insights from differences between a novel fluorescent bead method and the
established NTA method. 2015 BioIron Meet. Abstr. 2015;E180.
Garbowski MW, Evans P, Porter JB. Residual Erythropoiesis Protects Against
Cardiac Iron Loading in Transfusion Dependent Thalassaemia (TDT) By

201
Lowering Labile Plasma Iron (LPI) through Transient Apotransferrin Generation.
Blood. 2015;126(23):539.
Garbowski MW, Ma Y, Fucharoen S, Srichairatanakool S, Hider R, Porter JB.
Clinical and methodological factors affecting non-transferrin-bound iron (NTBI)
values using a novel fluorescent bead assay. Manuscript accepted with
corrections to Translational Research 2016
10.2 Other abstracts or articles published in the course of the work towards this Ph.D. but not included in the thesis.
Carpenter J-P, Alpendurada F, Deac M, Maceira A, Garbowski M, et al. Right
ventricular volumes and function in thalassemia major patients in the absence of
myocardial iron overload. J. Cardiovasc. Magn. Reson. 2010;12:24.
Hasleton J, Pasquale F, Garbowski M, et al. Images in cardiovascular medicine.
Superior vena cava occlusion by cardiovascular magnetic resonance. Circulation.
2010;122(8):853.
Wiener E, Chennell G, Garbowski M, Porter J. Non-transferrin-bound iron
(NTBI) and apotransferrin stimulate the expression of L-type voltage-gated
calcium channles of cardiomyocytes. 2013 BioIron Conf. London 2013.
2013;E75.
Vlachodimitropoulou E, Garbowski MW, Porter JB. Modeling Combination
Chelation Regimes To Optimize Cellular Iron Removal and Explore Mechanisms
Of Enhanced Chelation. Blood. 2013;122(21):2200.
Porter J, Origa R, Forni GL, Laadem A, Galacteros F, Miteva D, Sung V, Chopra
R, Arlet JB, Ribeil JA, Klesczewski K, Attie K, Garbowski M, Hermine O. A
Phase 2a, Open-Label, Dose-Finding Study To Determine The Safety and
Tolerability Of Sotatercept (ACE-011) In Adults With Beta (β)-Thalassemia:
Interim Results. Blood. 2013;122(21):3448.

202
Porter J, Cappellini M, Origa R, Forni GL, Laadem A, Galactéros F, Voskaridou
E, Miteva D, Sung V, Chopra R, Arlet JB, Ribeil J, Klesczewski K, Attie KM,
Garbowski M, Graziadei G, Balocco M, Hermine O. Interim results from a
Phase 2A, open-label, dose-finding study to determine the safety, efficacy, and
tolerability of Sotatercept (ACE-011) in adults with beta-thalassaemia.
Haematologica. 2014;99(supplement 1):230 (S662).
Vlachodimitropoulou Koumoutsea E, Garbowski M, Porter J. Synergistic
intracellular iron chelation combinations: mechanisms and conditions for
optimizing iron mobilization. Br J Haematol. 2015;170(6):874–883.
Cappellini M, Porter J, Origa R, Forni GL, Voskaridou E, Taher AT, Laadem A,
Galactéros F, Miteva D, Sung V, Chopra R, Arlet JB, Ribeil JA, Zou J, Chen N,
Attie KM, Garbowski M, Graziadei G, Balocco M, Hermine O. Interim results
from a Phase 2A, open-label, dose-finding study of Sotatercept (ACE-011) in
adult patients (pts) with beta-thalassaemia. Haematologica.
2015;100(supplement 1):17.
203
Chapter 11 References
Adams, R.J. & Brambilla, D. (2005) Discontinuing Prophylactic Transfusions
Used to Prevent Stroke in Sickle Cell Disease. New England Journal of
Medicine, 353, 2769–2778.
Aggarwal, B.B. (2004) Nuclear factor-κB: The enemy within. Cancer Cell, 6,
203–208.
Altamura, S., Kessler, R., Groene, H.J., Gretz, N., Hentze, M.W., Galy, B. &
Muckenthaler, M.U. (2014) Resistance of ferroportin to hepcidin binding
causes exocrine pancreatic failure and fatal iron overload. Cell Metabolism,
20, 359–367.
Anderson, L.J., Holden, S., Davis, B., Prescott, E., Charrier, C.C., Bunce, N.H.,
Firmin, D.N., Wonke, B., Porter, J., Walker, J.M. & Pennell, D.J. (2001)
Cardiovascular T2-star (T2*) magnetic resonance for the early diagnosis of
myocardial iron overload. European Heart Journal, 22, 2171–2179.
Anderson, L.J., Westwood, M.A., Holden, S., Davis, B., Prescott, E., Wonke, B.,
Porter, J.B., Walker, J.M. & Pennell, D.J. (2004) Myocardial iron clearance
during reversal of siderotic cardiomyopathy with intravenous
desferrioxamine: A prospective study using T2* cardiovascular magnetic
resonance. British Journal of Haematology, 127, 348–355.
Anderson, L.J., Westwood, M.A., Prescott, E., Walker, J.M., Pennell, D.J. &
Wonke, B. (2006) Development of thalassaemic iron overload
cardiomyopathy despite low liver iron levels and meticulous compliance to
desferrioxamine. Acta Haematologica, 115, 106–108.
Angelucci, E., Brittenham, G.M., McLaren, C.E., Ripalti, M., Baronciani, D.,
Giardini, C., Galimberti, M., Polchi, P. & Lucarelli, G. (2000) Hepatic iron
concentration and total body iron stores in thalassemia major. The New
England Journal of Medicine, 343, 327–31.
204
Aydinok, Y., Bayraktaroglu, S., Yildiz, D. & Alper, H. (2011) Myocardial iron
loading in patients with thalassemia major in Turkey and the potential role
of splenectomy in myocardial siderosis. Journal of Pediatric Hematology
and Oncology, 33, 374–8.
Aydinok, Y., Evans, P., Manz, C.Y. & Porter, J.B. (2012) Timed non-transferrin
bound iron determinations probe the origin of chelatable iron pools during
deferiprone regimens and predict chelation response. Haematologica, 97,
835–841.
Bacon, B.R., Tavill, A.S., Brittenham, G.M., Park, C.H. & Recknagel, R.O.
(1983) Hepatic lipid peroxidation in vivo in rats with chronic iron overload.
J. Clin. Invest., 71, 429–439.
Barry, M., Flynn, D.M., Letsky, E. a & Risdon, R. a (1974) Long-term chelation
therapy in thalassaemia major: effect on liver iron concentration, liver
histology, and clinical progress. British medical journal, 2, 16–20.
BARTFAY, W.J., HOU, D., BRITTENHAM, G.M., BARTFAY, E., SOLE,
M.J., LEHOTAY, D. & LIU, P.P. (1998) the Synergistic Effects of Vitamin
E and Selenium in Iron-Overloaded Mousehearts. Canadian Journal of
Cardiology, 14, 937–941.
Bates, G.W., Billups, C. & Saltman, P. (1967) The Kinetics and Mechanism of
Iron(III) Exchange between Chelates and Transferrin. I. THE
COMPLEXES OF CITRATE AND NITRILOTRIACETIC ACID. J. Biol.
Chem., 242, 2810–2815.
Beguin, Y., Clemons, G.K., Pootrakul, P. & Fillet, G. (1993) Quantitative
assessment of erythropoiesis and functional classification of anemia based
on measurements of serum transferrin receptor and erythropoietin. Blood,
81, 1067–1076.
Bergeron, C. & Kovacs, K. (1978) Pituitary siderosis. A histologic,

205
immunocytologic, and ultrastructural study. The American journal of
pathology, 93, 295–309.
El Beshlawy, A., El Tagui, M., Hamdy, M., El Ghamrawy, M., Azim, K.A.,
Salem, D., Said, F., Samir, A., Pierre, T.S. & Pennell, D.J. (2014) Low
prevalence of cardiac siderosis in heavily iron loaded Egyptian thalassemia
major patients. Annals of Hematology, 93, 375–379.
Bissell, D.M., Wang, S.S., Jarnagin, W.R. & Roll, F.J. (1995) Cell specific
expression of transforming growth factor-ß in the rat liver. Journal of
Clinical Investigation, 96, 447–455.
Bland, J.M. & Altman, D.G. (1999) Measuring agreement in method comparison
studies. Statistical methods in medical research, 8, 135–160.
Borgna-Pignatti, C., Rugolotto, S., De Stefano, P., Zhao, H., Cappellini, M.D.,
Del Vecchio, G.C., Romeo, M.A., Forni, G.L., Gamberini, M.R., Ghilardi,
R., Piga, A. & Cnaan, A. (2004a) Survival and complications in patients
with thalassemia major treated with transfusion and deferoxamine.
Haematologica, 89, 1187–1193.
Borgna-Pignatti, C., Vergine, G., Lombardo, T., Cappellini, M.D., Cianciulli, P.,
Maggio, A., Renda, D., Lai, M.E., Mandas, A., Forni, G., Piga, A. &
Bisconte, M.G. (2004b) Hepatocellular carcinoma in the thalassaemia
syndromes. British Journal of Haematology, 124, 114–117.
Bradley, S.J., Gosriwitana, I., Srichairatanakool, S., Hider, R.C. & Porter, J.B.
(1997) Non-transferrin-bound iron induced by myeloablative chemotherapy.
British journal of haematology, 99, 337–43.
Breuer, W. & Cabantchik, Z.I. (2001) A Fluorescence-Based One-Step Assay for
Serum Non-Transferrin-Bound Iron. Analytical Biochemistry, 299, 194–
202.
206
Breuer, W., Epsztejn, S., Millgram, P. & Cabantchik, I.Z. (1995) Transport of
iron and other transition metals into cells as revealed by a fluorescent probe.
The American journal of physiology, 268, C1354–C1361.
Breuer, W., Ermers, M.J.J., Pootrakul, P., Abramov, A., Hershko, C. &
Cabantchik, Z.I. (2001) Desferrioxamine-chelatable iron, a component of
serum non-transferrin-bound iron, used for assessing chelation therapy.
Blood, 97, 792–798.
Breuer, W., Ronson, a, Slotki, I.N., Abramov, a, Hershko, C. & Cabantchik, Z.I.
(2000) The assessment of serum nontransferrin-bound iron in chelation
therapy and iron supplementation. Blood, 95, 2975–2982.
Brissot, P., Wright, T.L., Ma, W.L. & Weisiger, R.A. (1985) Efficient clearance
of non-transferrin-bound iron by rat liver. Implications for hepatic iron
loading in iron overload states. Journal of Clinical Investigation, 76, 1463–
1470.
Brittenham, G.M., Griffith, P.M., Nienhuis, A.W., McLaren, C.E., Young, N.S.,
Tucker, E.E., Allen, C.J., Farrell, D.E. & Harris, J.W. (1994) Efficacy of
deferoxamine in preventing complications of iron overload in patients with
thalassemia major. The New England journal of medicine, 331, 567–73.
Brown, K., Subramony, C., May, W., Megason, G., Liu, H., Bishop, P., Walker,
T. & Nowicki, M.J. (2009) Hepatic iron overload in children with sickle cell
anemia on chronic transfusion therapy. Journal of pediatric
hematology/oncology, 31, 309–12.
Brunt, K.R., Tsuji, M.R., Lai, J.H., Kinobe, R.T., Durante, W., Claycomb, W.C.,
Ward, C.A. & Melo, L.G. (2009) Heme Oxygenase-1 Inhibits Pro-Oxidant
Induced Hypertrophy in HL-1 Cardiomyocytes. Experimental Biology and
Medicine, 234, 582–594.
Buja, L.M. & Roberts, W.C. (1971) Iron in the heart. Etiology and clinical
207
significance. The American Journal of Medicine, 51, 209–221.
Cabantchik, Z.I. (2014) Labile iron in cells and body fluids: Physiology,
pathology, and pharmacology. Frontiers in Pharmacology, 5 MAR, 45.
Caffrey, J.M. & Farach-Carson, M.C. (1989) Vitamin D3 metabolites modulate
dihydropyridine-sensitive calcium currents in clonal rat osteosarcoma cells.
Journal of Biological Chemistry, 264, 20265–20274.
Cappellini, M.D., Cohen, A., Piga, A., Bejaoui, M., Perrotta, S., Agaoglu, L.,
Aydinok, Y., Kattamis, A., Kilinc, Y., Porter, J., Capra, M., Galanello, R.,
Fattoum, S., Drelichman, G., Magnano, C., Verissimo, M., Athanassiou-
Metaxa, M., Giardina, P., Kourakli-Symeonidis, A., Janka-Schaub, G., et al
(2006) A phase 3 study of deferasirox (ICL670), a once-daily oral iron
chelator, in patients with β-thalassemia. Blood, 107, 3455–3462.
Carpenter, J.P., He, T., Kirk, P., Roughton, M., Anderson, L.J., De Noronha, S.
V., Sheppard, M.N., Porter, J.B., Walker, J.M., Wood, J.C., Galanello, R.,
Forni, G., Catani, G., Matta, G., Fucharoen, S., Fleming, A., House, M.J.,
Black, G., Firmin, D.N., St. Pierre, T.G., et al (2011) On T2* magnetic
resonance and cardiac iron. Circulation, 123, 1519–1528.
Cazzola, M., Borgna-Pignatti, C., Locatelli, F., Ponchio, L., Beguin, Y. & De
Stefano, P. (1997) A moderate transfusion regimen may reduce iron loading
in beta-thalassemia major without producing excessive expansion of
erythropoiesis. Transfusion, 37, 135–40.
Cazzola, M., De Stefano, P., Ponchio, L., Locatelli, F., Beguin, Y., Dessi, C.,
Barella, S., Cao, a & Galanello, R. (1995) Relationship between transfusion
regimen and suppression of erythropoiesis in beta-thalassaemia major.
British journal of haematology, 89, 473–8.
Ceccarelli, D., Gallesi, D., Giovannini, F., Ferrali, M. & Masini, A. (1995)
Relationship between free iron level and rat liver mitochondrial dysfunction
208
in experimental dietary iron overload. Biochem Biophys Res Commun, 209,
53–59.
Chaidos, A., Makis, A., Hatzimichael, E., Tsiara, S., Gouva, M., Tzouvara, E. &
Bourantas, K.L. (2004) Treatment of beta-thalassemia patients with
recombinant human erythropoietin: effect on transfusion requirements and
soluble adhesion molecules. Acta haematologica, 111, 189–95.
Chan, K.H. & Chu, W. (2003) Modeling the reaction kinetics of Fenton’s process
on the removal of atrazine. Chemosphere, 51, 305–311.
Claycomb, W.C., Lanson, N. a, Stallworth, B.S., Egeland, D.B., Delcarpio, J.B.,
Bahinski, A. & Izzo, N.J. (1998) HL-1 cells: a cardiac muscle cell line that
contracts and retains phenotypic characteristics of the adult cardiomyocyte.
Proceedings of the National Academy of Sciences of the United States of
America, 95, 2979–2984.
Cohen, A., Masera, G., Zoumbos, N., Uysal, Z., Boulet, D., Watman, N.,
Loggetto, S., Opitz, H., Gathmann, I. & Alberti, D. (2005) Effect of iron
intake on control of body iron in patients with thalassemia major treated
with deferasisox. Blood, 106, Abstract 622.
Comer, G.M., Ozick, L.A., Sachdev, R.K., Kumar, S., Taunk, J.L., Smith, J.A.,
Lee, T.P. & Clain, D.J. (1991) Transfusion-related chronic liver disease in
sickle cell anemia. American Journal of Gastroenterology, 86, 1232–1234.
Cooper, C.E., Lynagh, G.R., Hoyes, K.P., Hider, R.C., Cammack, R. & Porter,
J.B. (1996) The relationship of intracellular iron chelation to the inhibition
and regeneration of human ribonucleotide reductase. Journal of Biological
Chemistry, 271, 20291–20299.
Cooper, C.E. & Porter, J.B. (1997) Ribonucleotide reductase, lipoxygenase and
the intracellular low-molecular-weight iron pool. Biochem Soc Trans, 25,
75–80.
209
Cooperman, S.S., Meyron-Holtz, E.G., Olivierre-Wilson, H., Ghosh, M.C.,
McConnell, J.P. & Rouault, T.A. (2005) Microcytic anemia, erythropoietic
protoporphyria, and neurodegeneration in mice with targeted deletion of
iron-regulatory protein 2. Blood, 106, 1084–1091.
Darbari, D.S., Kple-Faget, P., Kwagyan, J., Rana, S., Gordeuk, V.R. & Castro,
O. (2006) Circumstances of death in adult sickle cell disease patients. Am J
Hematol, 81, 858–863.
Darshan, D. & Anderson, G.J. (2009) Interacting signals in the control of
hepcidin expression. BioMetals, 22, 77–87.
Delaby, C., Pilard, N., Goncalves, A.S., Beaumont, C. & Canonne-Hergaux, F.
(2005) Presence of the iron exporter ferroportin at the plasma membrane of
macrophages is enhanced by iron loading and down-regulated by hepcidin.
Blood, 106, 3979–3984.
Dimitriadou, M., Christoforidis, A., Economou, M., Tsatra, I., Vlachaki, E.,
Fidani, L., Katzos, G. & Athanassiou-Metaxa, M. (2010) Elevated serum
parathormone levels are associated with myocardial iron overload in
patients with beta-thalassaemia major. Eur J Haematol, 84, 64–71.
Dissayabutra, T., Tosukhowong, P. & Seksan, P. (2005) The benefits of vitamin
C and vitamin E in children with beta-thalassemia with high oxidative
stress. Journal of the Medical Association of Thailand = Chotmaihet
thangphaet., 88 Suppl 4, S317-21.
De Domenico, I., Ward, D.M., di Patti, M.C.B., Jeong, S.Y., David, S., Musci, G.
& Kaplan, J. (2007) Ferroxidase activity is required for the stability of cell
surface ferroportin in cells expressing GPI-ceruloplasmin. The EMBO
journal, 26, 2823–31.
Dore, F., Bonfigli, S., Gaviano, E., Pardini, S. & Longinotti, M. (1996) Serum
transferrin receptor levels in patients with thalassemia intermedia during
210
rHuEPO administration. Haematologica, 81, 37–9.
Drygalski, A. Von & Adamson, J.W. (2013)Iron metabolism in man Oxford:
Blackwell.
El-Nawawy, A., Massoud, M.N., El-Bordiny, M. & Hegazy, S. (2002)
Evaluation of serum soluble transferrin receptors and erythropoietin levels
as indicators for erythropoietic activity among multi-transfused ??-
thalassemic patients. Journal of Tropical Pediatrics, 48, 33–38.
Epsztejn, S., Glickstein, H., Picard, V., Slotki, I.N., Breuer, W., Beaumont, C. &
Cabantchik, Z.I. (1999) H-ferritin subunit overexpression in erythroid cells
reduces the oxidative stress response and induces multidrug resistance
properties. Blood, 94, 3593–3603.
Epsztejn, S., Kakhlon, O., Glickstein, H., Breuer, W. & Ioav Cabantchik, Z.
(1997) Fluorescence Analysis of the Labile Iron Pool of Mammalian Cells
1. Analytical Biochemistry, 248, 31–40.
Esposito, B.P., Breuer, W., Sirankapracha, P., Pootrakul, P., Hershko, C. &
Cabantchik, Z.I. (2003) Labile plasma iron in iron overload: Redox activity
and susceptibility to chelation. Blood, 102, 2670–2677.
Evans, P., Kayyali, R., Hider, R.C., Eccleston, J. & Porter, J.B. (2010)
Mechanisms for the shuttling of plasma non-transferrin-bound iron (NTBI)
onto deferoxamine by deferiprone. Translational Research, 156, 55–67.
Evans, R.W., Rafique, R., Zarea, A., Rapisarda, C., Cammack, R., Evans, P.J.,
Porter, J.B. & Hider, R.C. (2008) Nature of non-transferrin-bound iron:
Studies on iron citrate complexes and thalassemic sera. Journal of
Biological Inorganic Chemistry, 13, 57–74.
Evans, R.W. & Williams, J. (1980) The electrophoresis of transferrins in
urea/polyacrylamide gels. The Biochemical journal, 189, 541–6.

211
Finch, C., Deubelbeiss, K. & Cook, J. (1970) Ferrokinetics in man. Medicine, 49,
17–53.
Flanagan, J.M., Peng, H., Wang, L., Gelbart, T., Lee, P., Johnson Sasu, B. &
Beutler, E. (2006) Soluble transferrin receptor-1 levels in mice do not affect
iron absorption. Acta Haematologica, 116, 249–254.
Fox, F., Kundgen, A., Nachtkamp, K., Strupp, C., Haas, R., Germing, U.,
Gattermann, N. & Kündgen, A. (2009) Matched-Pair Analysis of 186 MDS
Patients Receiving Iron Chelation Therapy or transfusion therapy only.
Blood (ASH Annual Meeting Abstracts), 114, 1747.
Frazer, D.M., Wilkins, S.J., Darshan, D., Badrick, A.C., McLaren, G.D. &
Anderson, G.J. (2012) Stimulated erythropoiesis with secondary iron
loading leads to a decrease in hepcidin despite an increase in bone
morphogenetic protein 6 expression. British Journal of Haematology, 157,
615–626.
Galanello, R., Piga, A., Alberti, D., Rouan, M.C., Bigler, H. & Sechaud, R.
(2003) Safety, tolerability, and pharmacokinetics of ICL670, a new orally
active iron-chelating agent in patients with transfusion-dependent iron
overload due to beta-thalassemia. J Clin Pharmacol, 43, 565–572.
Galaris, D., Skiada, V. & Barbouti, A. (2008) Redox signaling and cancer: The
role of ‘labile’ iron. Cancer Letters, 266, 21–29.
Gamberini, M.R., de Sanctis, V. & Gilli, G. (2008) Hypogonadism, diabetes
mellitus, hypothyroidism, hypoparathyroidism: Incidence and prevalence
related to iron overload and chelation therapy in patients with thalassaemia
major followed from 1980 to 2007 in the Ferrara centre. Pediatric
Endocrinology Reviews, 6, 158–169.
Ganz, T. (2011) Hepcidin and iron regulation, 10 years later. Blood, 117, 4425–
4433.

212
Garbowski, M., Eleftheriou, P., Pennell, D., Tanner, M. & Porter, J.B. (2008)
Impact of Compliance, Ferritin and LIC on Long-Term Trends in
Myocardial T2* with Deferasirox. Blood, 112, 116.
Garbowski, M., Ma, Y., Evans, P., Srichairatanakool, S., Fucharoen, S., Hider, R.
& Porter, J. (2015a)Clinical Factors Affecting Ntbi Levels: Insights From
Differences Between a Novel Fluorescent Bead Method and the Established
Nta Method. In 2015 BioIron Meeting Abstracts p E180.
Garbowski, M.W., Carpenter, J.-P., Smith, G., Pennell, D.J. & Porter, J.B.
(2009a) Calibration of Improved T2* method for the estimation of liver iron
concentration in transfusional iron overload. Blood (ASH Annual Meeting
Abstracts), 114, 2004.
Garbowski, M.W., Carpenter, J.P., Smith, G., Roughton, M., Alam, M.H., He, T.,
Pennell, D.J. & Porter, J.B. (2014) Biopsy-based calibration of T2*
magnetic resonance for estimation of liver iron concentration and
comparison with R2 Ferriscan. J Cardiovasc Magn Reson, 16, 40.
Garbowski, M.W., Evans, P. & Porter, J.B. (2015b) Residual Erythropoiesis
Protects Against Cardiac Iron Loading in Transfusion Dependent
Thalassaemia (TDT) By Lowering Labile Plasma Iron (LPI) through
Transient Apotransferrin Generation. Blood, 126, 539.
Garbowski, M.W., Fabre, M., Evans, P. & Porter, J.B. (2009b) Vitamin C Status
in Transfusionally Iron-Overloaded Patients On Long-Term Deferasirox and
Its Relationship to Myeocardial Iron Removal. Blood (ASH Annual Meeting
Abstracts), 114, Abstract 2005.
Garbowski, M.W. & Porter, J.B. (2010) Poster Session: Haemostasis and
Thrombosis. British Journal of Haematology, 149, 27–96.
Gattermann, N., Finelli, C., Porta, M. Della, Fenaux, P., Stadler, M., Guerci-
Bresler, A., Schmid, M., Taylor, K., Vassilieff, D., Habr, D., Marcellari, A.,

213
Roubert, B. & Rose, C. (2012) Hematologic responses to deferasirox
therapy in transfusion-dependent patients with myelodysplastic syndromes.
Haematologica, 97, 1364–1371.
Ge, X.H., Wang, Q., Qian, Z.M., Zhu, L., Du, F., Yung, W.H., Yang, L. & Ke,
Y. (2009) The iron regulatory hormone hepcidin reduces ferroportin 1
content and iron release in H9C2 cardiomyocytes. J Nutr Biochem, 20, 860–
865.
Ghoti, H., Goitein, O., Koren, A., Levin, C., Kushnir, T., Rachmilewitz, E. &
Konen, E. (2010) No evidence for myocardial iron overload and free iron
species in multitransfused patients with sickle/β0-thalassaemia. European
Journal of Haematology, 84, 59–63.
Glanville, J., Eleftheriou, P. & Porter, J.B. (2006) MRI Evidence of Cardiac Iron
Accumulation in Myelodysplasia and Unusual Anaemias. Blood (ASH
Annual Meeting Abstracts), 108, 1553.
Goldberg, S.L., Chen, E., Corral, M., Guo, A., Mody-Patel, N., Pecora, A.L. &
Laouri, M. (2010) Incidence and clinical complications of myelodysplastic
syndromes among United States Medicare beneficiaries. Journal of Clinical
Oncology, 28, 2847–2852.
Gosriwatana, I., Loreal, O., Lu, S., Brissot, P., Porter, J. & Hider, R.C. (1999)
Quantification of non-transferrin-bound iron in the presence of unsaturated
transferrin. Analytical biochemistry, 273, 212–20.
Goswami, D., Vitorino, H.A., Alta, R.Y., Silvestre, D.M., Nomura, C.S.,
Machini, M.T. & Esposito, B.P. (2015) Deferasirox-TAT(47-57) peptide
conjugate as a water soluble, bifunctional iron chelator with potential use in
neuromedicine. Biometals, 28, 869–877.
Grootveld, M., Bell, J.D., Halliwell, B., Aruoma, O.I., Bomford, A. & Sadler,
P.J. (1989) Non-transferrin-bound iron in plasma or serum from patients
214
with idiopathic hemochromatosis. Characterization by high performance
liquid chromatography and nuclear magnetic resonance spectroscopy. J Biol
Chem, 264, 4417–4422.
Gutteridge, J.M.C., Rowley, D.A., Griffiths, E. & Halliwell, B. (1985) Low
molecular weight iron complexes and oxygen radical reactions in idiopathic
haemochromatosis. Clinical Science, 68, 463–467.
Hallberg, L. & Hedenberg, L. (1965) The effect of desferrioxamine on iron
metabolism in man. Scand. J. Haematol, 2, 67–79.
Hankins, J.S., McCarville, M.B., Loeffler, R.B., Smeltzer, M.P., Onciu, M.,
Hoffer, F.A., Li, C.S., Wang, W.C., Ware, R.E. & Hillenbrand, C.M. (2009)
R2* magnetic resonance imaging of the liver in patients with iron overload.
Blood, 113, 4853–4855.
Hankins, J.S., Smeltzer, M.P., McCarville, M.B., Aygun, B., Hillenbrand, C.M.,
Ware, R.E. & Onciu, M. (2010) Patterns of liver iron accumulation in
patients with sickle cell disease and thalassemia with iron overload.
European Journal of Haematology, 85, 51–57.
Harmatz, P., Butensky, E., Quirolo, K., Williams, R., Ferrell, L., Moyer, T.,
Golden, D., Neumayr, L. & Vichinsky, E. (2000) Severity of iron overload
in patients with sickle cell disease receiving chronic red blood cell
transfusion therapy. Blood, 96, 76–9.
Hershko, C., Graham, G., Bates, G.W. & Rachmilewitz, E. a (1978) Non-specific
serum iron in thalassaemia: an abnormal serum iron fraction of potential
toxicity. British journal of haematology, 40, 255–263.
Hershko, C. & Rachmilewitz, E.A. (1979) Mechanism of desferrioxamine-
induced iron excretion in thalassaemia. Br J Haematol, 42, 125–132.
Hider, R.C. & Kong, X.L. (2011) Glutathione: A key component of the

215
cytoplasmic labile iron pool. BioMetals, 24, 1179–1187.
Hider, R.C., Silva, A.M.N., Podinovskaia, M. & Ma, Y. (2010) Monitoring the
efficiency of iron chelation therapy: The potential of nontransferrin-bound
iron. Annals of the New York Academy of Sciences, 1202, 94–99.
Hod, E.A., Zhang, N., Sokol, S.A., Wojczyk, B.S., Francis, R.O., Ansaldi, D.,
Francis, K.P., Della-Latta, P., Whittier, S., Sheth, S., Hendrickson, J.E.,
Zimring, J.C., Brittenham, G.M. & Spitalnik, S.L. (2010) Transfusion of red
blood cells after prolonged storage produces harmful effects that are
mediated by iron and inflammation. Blood, 115, 4284–4292.
Hoepelman, I.M., Bezemer, W. a., Doornmalen, E., Verhoef, J. & Marx, J.J.M.
(1989) Lipid peroxidation of human granulocytes (PMN) and monocytes by
iron complexes. British Journal of Haematology, 72, 584–588.
Houglum, K., Filip, M., Witztum, J.L. & Chojkier, M. (1990) Malondialdehyde
and 4-hydroxynonenal protein adducts in plasma and liver of rats with iron
overload. Journal of Clinical Investigation, 86(6), 1991–1998.
Huebers, H.A., Beguin, Y., Pootrakul, P., Einspahr, D. & Finch, C.A. (1990)
Intact transferrin receptors in human plasma and their relation to
erythropoiesis. Blood, 75, 102–7.
Huebers, H.A. & Finch, C.A. (1987) The physiology of transferrin and
transferrin receptors. Physiol. Rev., 67, 520–582.
Inati, A., Musallam, K.M., Wood, J.C., Sheikh-Taha, M., Daou, L. & Taher, A.T.
(2009) Absence of cardiac siderosis by MRI T2* despite transfusion burden,
hepatic and serum iron overload in Lebanese patients with sickle cell
disease. European Journal of Haematology, 83, 565–571.
Isoda, M., Hanawa, H., Watanabe, R., Yoshida, T., Toba, K., Yoshida, K.,
Kojima, M., Otaki, K., Hao, K., Ding, L., Tanaka, K., Takayama, T., Kato,
216
K., Okura, Y., Kodama, M., Ota, Y., Hayashi, J. & Aizawa, Y. (2010)
Expression of the peptide hormone hepcidin increases in cardiomyocytes
under myocarditis and myocardial infarction. Journal of Nutritional
Biochemistry, 21, 749–756.
Ito, S., Ikuta, K., Kato, D., Shibusa, K., Niizeki, N., Tanaka, H., Addo, L., Toki,
Y., Hatayama, M., Inamura, J., Shindo, M., Sasaki, K., Iizuka, N., Fujiya,
M., Torimoto, Y. & Kohgo, Y. (2014) Non-transferrin-bound iron assay
system utilizing a conventional automated analyzer. Clinica Chimica Acta,
437, 129–135.
Jacob, A.K., Hotchkiss, R.S., Swanson, P.E., Tinsley, K.W., Karl, I.E. &
Buchman, T.G. (2000) Injection of iron compounds followed by induction
of the stress response causes tissue injury and apoptosis. Shock, 14, 460–4.
Jacobs, A. (1974)The pathology of iron overload in: Iron in Biochemistry and
Medicine. Worwood AJ and M (ed) London: Academic Press.
Jaeger, M., Aul, C., Söhngen, D., Germing, U. & Schneider, W. (1992)
[Secondary hemochromatosis in polytransfused patients with
myelodysplastic syndromes]. Beiträge zur Infusionstherapie =
Contributions to infusion therapy, 30, 464–8.
Jenkitkasemwong, S., Wang, C.-Y., Coffey, R., Zhang, W., Chan, A., Biel, T.,
Kim, J.-S., Hojyo, S., Fukada, T. & Knutson, M.D. (2015) SLC39A14 Is
Required for the Development of Hepatocellular Iron Overload in Murine
Models of Hereditary Hemochromatosis. Cell metabolism, 22, 138–50.
Jensen, P.D., Jensen, F.T., Christensen, T., Eiskjaer, H., Baandrup, U. & Nielsen,
J.L. (2003) Evaluation of myocardial iron by magnetic resonance imaging
during iron chelation therapy with deferrioxamine: indication of close
relation between myocardial iron content and chelatable iron pool. Blood,
101, 4632–9.
217
Kattamis, A., Papassotiriou, I., Palaiologou, D., Apostolakou, F., Galani, A.,
Ladis, V., Sakellaropoulos, N. & Papanikolaou, G. (2006) The effects of
erythropoetic activity and iron burden on hepcidin expression in patients
with thalassemia major. Haematologica, 91, 809–812.
Kautz, L., Jung, G., Valore, E. V, Rivella, S., Nemeth, E. & Ganz, T. (2014)
Identification of erythroferrone as an erythroid regulator of iron metabolism.
Nat Genet, 46, 678–684.
Keel, S.B., Doty, R.T., Yang, Z., Quigley, J.G., Chen, J., Knoblaugh, S.,
Kingsley, P.D., De Domenico, I., Vaughn, M.B., Kaplan, J., Palis, J. &
Abkowitz, J.L. (2008) A heme export protein is required for red blood cell
differentiation and iron homeostasis. Science (New York, NY), 319, 825–
828.
Kim, H.C., Dugan, N.P., Silber, J.H., Martin, M.B., Schwartz, E., Ohene-
Frempong, K. & Cohen, a R. (1994) Erythrocytapheresis therapy to reduce
iron overload in chronically transfused patients with sickle cell disease.
Blood, 83, 1136–1142.
Kim, K.H., Kim, J.W., Rhee, J.Y., Kim, M.K., Kim, B.S., Kim, I., Bang, S.M.,
Yoon, S.S., Lee, J.S., Han, K.S., Park, S. & Kim, B.K. (2009) Cost analysis
of iron-related complications in a single institute. Korean J Intern Med, 24,
33–36.
Kirk, P., Roughton, M., Porter, J.B., Walker, J.M., Tanner, M.A., Patel, J., Wu,
D., Taylor, J., Westwood, M.A., Anderson, L.J. & Pennell, D.J. (2009)
Cardiac T2* magnetic resonance for prediction of cardiac complications in
thalassemia major. Circulation, 120, 1961–1968.
Koduri, P.R. (2003) Iron in sickle cell disease: A review why less is better.
American Journal of Hematology, 73, 59–63.
Koren, A., Fink, D., Admoni, O., Tennenbaum-Rakover, Y. & Levin, C. (2010)

218
Non-transferrin bound labile plasma iron and iron overload in sickle cell
disease: A comparative study between sickle cell disease and ?? thalassemic
patients. European Journal of Haematology, 84, 72–78.
Kornbrust, D.J. & Mavis, R.D. (1980) Microsomal lipid peroxidation. 1.
Characterisation of the role of iron and NADPH. Molecular Pharmacology,
17, 400–407.
Lakhal-Littleton, S., Wolna, M., Carr, C.A., Miller, J.J., Christian, H.C., Ball, V.,
Santos, A., Diaz, R., Biggs, D., Stillion, R., Holdship, P., Larner, F., Tyler,
D.J., Clarke, K., Davies, B. & Robbins, P.A. (2015) Cardiac ferroportin
regulates cellular iron homeostasis and is important for cardiac function.
Proc Natl Acad Sci U S A, 112, 3164–3169.
Lakhal-Littleton, S., Wolna, M., Chung, Y., Christian, H., Heather, L., Brescia,
M., Ball, V., Clarke, K., Davies, B. & Robbins, P. (2016)Iron regulation by
the cardiac hepcidin/ferroportin axis is critical in th eheart. In European
Iron Club p 21.
Lal, A., Porter, J., Sweeters, N., Ng, V., Evans, P., Neumayr, L., Kurio, G.,
Harmatz, P. & Vichinsky, E. (2013) Combined chelation therapy with
deferasirox and deferoxamine in thalassemia. Blood Cells, Molecules, and
Diseases, 50, 99–104.
Le Lan, C., Loréal, O., Cohen, T., Ropert, M., Glickstein, H., Lainé, F.,
Pouchard, M., Deugnier, Y., Le Treut, A., Breuer, W., Cabantchik, Z.I. &
Brissot, P. (2005) Redox active plasma iron in C282Y/C282Y
hemochromatosis. Blood, 105, 4527–4531.
Lasocki, S., Millot, S., Andrieu, V., Lettéron, P., Pilard, N., Muzeau, F.,
Thibaudeau, O., Montravers, P. & Beaumont, C. (2008) Phlebotomies or
erythropoietin injections allow mobilization of iron stores in a mouse model
mimicking intensive care anemia. Critical care medicine, 36, 2388–94.
219
Lee, J.W. (2008) Iron chelation therapy in the myelodysplastic syndromes and
aplastic anemia: a review of experience in South Korea. Int J Hematol, 88,
16–23.
Leitch, H.A., Goodman, T.A., Wong, K.K., Vickars, L.M., Galbraith, P.F. &
Leger, C.S. (2006) Improved Survival in Patients with Myelodysplastic
Syndrome (MDS) Receiving Iron Chelation Therapy. Blood (ASH Annual
Meeting Abstracts), 108, 249.
Leszek, P., Sochanowicz, B., Szperl, M., Kolsut, P., Brz??ska, K., Piotrowski,
W., Rywik, T.M., Danko, B., Polkowska-Motrenko, H., R??za??ski, J.M. &
Kruszewski, M. (2012) Myocardial iron homeostasis in advanced chronic
heart failure patients. International Journal of Cardiology, 159, 47–52.
Lim, B.C., McArdle, H.J. & Morgan, E.H. (1987) Transferrin-receptor
interaction and iron uptake by reticulocytes of vertebrate animals - a
comparative study. Journal of Comparative Physiology B: Biochemical,
Systemic and Environmental Physiology, 157, 363–371.
Link, G., Athias, P., Grynberg, A., Pinson, A. & Hershko, C. (1989a) Effect of
iron loading on transmembrane potential, contraction, and automaticity of
rat ventricular muscle cells in culture. J Lab Clin Med, 113, 103–111.
Link, G., Pinson, A. & Hershko, C. (1993) Iron loading of cultured cardiac
myocytes modifies sarcolemmal structure and increases lysosomal fragility.
J Lab Clin Med, 121, 127–134.
Link, G., Pinson, A., Kahane, I. & Hershko, C. (1989b) Iron loading modifies the
fatty acid composition of cultured rat myocardial cells and liposomal
vesicles: effect of ascorbate and alpha-tocopherol on myocardial lipid
peroxidation. The Journal of laboratory and clinical medicine, 114, 243–9.
Link, G., Saada, a, Pinson, a, Konijn, a M. & Hershko, C. (1998)
Mitochondrial respiratory enzymes are a major target of iron toxicity in rat
220
heart cells. The Journal of laboratory and clinical medicine, 131, 466–474.
Lipschitz, D.A., Bothwell, T.H., Seftel, H.C., Wapnick, A.A. & Charlton, R.W.
(1971) The Role of Ascorbic Acid in the Metabolism of Storage Iron.
British Journal of Haematology, 20, 155–163.
Liu, Q., Davidoff, O., Niss, K. & Haase, V.H. (2012) Hypoxia-inducible factor
regulates hepcidin via erythropoietin-induced erythropoiesis. J Clin Invest,
122, 4635–4644.
Liuzzi, J.P., Aydemir, F., Nam, H., Knutson, M.D. & Cousins, R.J. (2006) Zip14
(Slc39a14) mediates non-transferrin-bound iron uptake into cells. Proc Natl
Acad Sci U S A, 103, 13612–13617.
Loréal, O., Gosriwatana, I., Guyader, D., Porter, J., Brissot, P. & Hider, R.C.
(2000) Determination of non-transferrin-bound iron in genetic
hemochromatosis using a new HPLC-based method. Journal of Hepatology,
32, 727–733.
De Luca, C., Filosa, A., Grandinetti, M., Maggio, F., Lamba, M. & Passi, S.
(1999) Blood antioxidant status and urinary levels of catecholamine
metabolites in beta-thalassemia. Free Radic Res, 30, 453–62.
Ma, Y., Podinovskaia, M., Evans, P.J., Emma, G., Schaible, U.E., Porter, J. &
Hider, R.C. (2014a) A novel method for non-transferrin-bound iron
quantification by chelatable fluorescent beads based on flow cytometry.
Biochem J, 463, 351–362.
Ma, Y., Podinovskaia, M., Evans, P.J., Emma, G., Schaible, U.E., Porter, J. &
Hider, R.C. (2014b) A novel method for non-transferrin-bound iron
quantification by chelatable fluorescent beads based on flow cytometry. The
Biochemical journal, 463, 351–62.
Makino, T., Nakamura, K. & Takahara, K. (2014) Potential problems in the

221
determination of serum non-transferrin-bound iron using nitrilotriacetic acid
and ultrafiltration. Clinica Chimica Acta, 429, 12–13.
Marx, J.J. & van Asbeck, B.S. (1996) Use of iron chelators in preventing
hydroxyl radical damage: adult respiratory distress syndrome as an
experimental model for the pathophysiology and treatment of oxygen-
radical-mediated tissue damage. Acta Haematol, 95, 49–62.
Mastrogiannaki, M., Matak, P., Keith, B., Simon, M.C., Vaulont, S. &
Peyssonnaux, C. (2009) HIF-2α, but not HIF-1α, promotes iron absorption
in mice. Journal of Clinical Investigation, 119, 1159–1166.
Meszaros, J.G., Karin, N.J., Akanbi, K. & Farach-Carson, M.C. (1996) Down-
regulation of L-type Ca2+ channel transcript levels by 1,25-
dihyroxyvitamin D3. Osteoblastic cells express L-type alpha1C Ca2+
channel isoforms. J Biol Chem, 271, 32981–32985.
Modell, B. (1976) Management of thalassaemia major. Br Med Bull, 32, 270–
276.
Modell, B., Khan, M. & Darlison, M. (2000) Survival in beta-thalassaemia major
in the UK: data from the UK Thalassaemia Register. Lancet, 355, 2051–2.
Modell, B., Khan, M., Darlison, M., Westwood, M. a, Ingram, D. & Pennell, D.J.
(2008) Improved survival of thalassaemia major in the UK and relation to
T2* cardiovascular magnetic resonance. Journal of cardiovascular
magnetic resonance : official journal of the Society for Cardiovascular
Magnetic Resonance, 10, 42.
Modell, B. & Matthews, R. (1976) Thalassemia in Britain and Australia. Birth
defects original article series, 12, 13–29.
Myers, B.M., Prendergast, F.G., Holman, R., Kuntz, S.M. & LaRusso, N.F.
(1991) Alterations in the structure, physicochemical properties, and pH of
222
hepatocyte lysosomes in experimental iron overload. Journal of Clinical
Investigation, 88, 1207–1215.
Nairz, M., Schleicher, U., Schroll, A., Sonnweber, T., Theurl, I., Ludwiczek, S.,
Talasz, H., Brandacher, G., Moser, P.L., Muckenthaler, M.U., Fang, F.C.,
Bogdan, C. & Weiss, G. (2013) Nitric oxide-mediated regulation of
ferroportin-1 controls macrophage iron homeostasis and immune function in
Salmonella infection. The Journal of experimental medicine, 210, 855–873.
Nemeth, E. (2004) Hepcidin Regulates Cellular Iron Efflux by Binding to
Ferroportin and Inducing Its Internalization. Science, 306, 2090–2093.
Nemeth, E. & Ganz, T. (2006) Hepcidin and iron-loading anemias.
Haematologica, 91, 727–732.
Nemeth, E., Valore, E. V., Territo, M., Schiller, G., Lichtenstein, A. & Ganz, T.
(2003) Hepcidin, a putative mediator of anemia of inflammation, is a type II
acute-phase protein. Blood, 101, 2461–2463.
Noetzli, L.J., Carson, S., Coates, T.D. & Wood, J.C. (2011) Revisiting the
relationship between vitamin D deficiency, cardiac iron and cardiac function
in thalassemia major. European Journal of Haematology, 86, 176–177.
Noetzli, L.J., Carson, S.M., Nord, A.S., Coates, T.D. & Wood, J.C. (2008a)
Longitudinal analysis of heart and liver iron in thalassemia major. Blood,
112, 2973–2978.
Noetzli, L.J., Carson, S.M., Nord, A.S., Coates, T.D. & Wood, J.C. (2008b)
Longitudinal analysis of heart and liver iron in thalassemia major. Blood,
112, 2973–8.
Ohnuma, K., Toyoda, Y., Nishihira, H., Iguchi, A., Tabuchi, K., Honda, K.,
Nagao, T., Kigasawa, H. & Iwahori, A. (1996) [Detection of early cardiac
dysfunction in patients with transfusion-dependent aplastic anemia and
223
chronic iron overload in childhood. Stress-velocity relation as a sensitive
index by echocardiography]. Rinsho Ketsueki, 37, 825–832.
Olivieri, N.F. (2001) Progression of iron overload in sickle cell disease. Semin
Hematol, 38, 57–62.
Olivieri, N.F., Nathan, D.G., MacMillan, J.H., Wayne, A.S., Liu, P.P., McGee,
A., Martin, M., Koren, G. & Cohen, A.R. (1994) Survival in medically
treated patients with homozygous beta-thalassemia. The New England
journal of medicine, 331, 574–578.
Origa, R., Barella, S., Argiolas, G.M., Bina, P., Agus, A. & Galanello, R. (2008a)
No evidence of cardiac iron in 20 never or minimally-transfused patients
with thalassemia intermedia. Haematologica, 93, 1095–1096.
Origa, R., Galanello, R., Ganz, T., Giagu, N., Maccioni, L., Faa, G. & Nemeth,
E. (2007) Liver iron concentrations and urinary hepcidin in beta-
thalassemia. Haematologica, 92, 583–588.
Origa, R., Satta, S., Matta, G. & Galanello, R. (2008b) Glutathione S-transferase
gene polymorphism and cardiac iron overload in thalassaemia major. British
Journal of Haematology, 142, 143–145.
Oudit, G.Y., Sun, H., Trivieri, M.G., Koch, S.E., Dawood, F., Ackerley, C.,
Yazdanpanah, M., Wilson, G.J., Schwartz, A., Liu, P.P. & Backx, P.H.
(2003) L-type Ca2+ channels provide a major pathway for iron entry into
cardiomyocytes in iron-overload cardiomyopathy. Nature medicine, 9,
1187–1194.
Oudit, G.Y., Trivieri, M.G., Khaper, N., Liu, P.P. & Backx, P.H. (2006a) Role of
L-type Ca2+ channels in iron transport and iron-overload cardiomyopathy. J
Mol Med, 84, 349–364.
Oudit, G.Y., Trivieri, M.G., Khaper, N., Liu, P.P. & Backx, P.H. (2006b) Role of
224
L-type Ca2+ channels in iron transport and iron-overload cardiomyopathy.
Journal of Molecular Medicine, 84, 349–364.
Pak, M., Lopez, M.A., Gabayan, V., Ganz, T. & Rivera, S. (2006) Suppression of
hepcidin during anemia requires erythropoietic activity. Blood, 108, 3730–
3735.
Parkes, J.G., Olivieri, N.F. & Templeton, D.M. (1997) Characterization of Fe2+
and Fe3+ transport by iron-loaded cardiac myocytes. Toxicology, 117, 141–
151.
Parkes, J.G., Randell, E.W., Olivieri, N.F. & Templeton, D.M. (1995)
Modulation by iron loading and chelation of the uptake of non- transferrin-
bound iron by human liver cells. Biochim Biophys Acta, 1243, 373–380.
Parola, M., Pinzani, A., Casini, E., Albano, G., PoLi, A., Gentilini, P. & Diazani,
M.W. (1993) Stimulation of lipid peroxidation or 4-hydroxynonenal
treatment increased procollagen (I) gene expression in human fat storing
cells. Journal of Biological Chemistry, 264, 16957–16962.
Pennell, D.J., Porter, J.B., Cappellini, M.D., Li, C.-K., Aydinok, Y., Lee, C.L.,
Kattamis, A., Smith, G., Habr, D., Domokos, G., Hmissi, A. & Taher, A.
(2008) Efficacy and Safety of Deferasirox (Exjade®) in Reducing Cardiac
Iron in Patients with β-Thalassemia Major: Results from the Cardiac
Substudy of the EPIC Trial. Blood, 112, Abstract 3873.
Pierre, T.G.S., Clark, P.R., Chua-anusorn, W., Fleming, A.J., Jeffrey, G.P.,
Olynyk, J.K., Pootrakul, P., Robins, E., Lindeman, R., St Pierre, T.G.,
Clark, P.R., Chua-anusorn, W., Fleming, A.J., Jeffrey, G.P., Olynyk, J.K.,
Pootrakul, P., Robins, E. & Lindeman, R. (2005) Noninvasive measurement
and imaging of liver iron concentrations using proton magnetic resonance.
Blood, 105, 855–861.
Piga, A., Kebaili, K., Galanello, R., Jehl, V., Rebischung, C., Maseruka, H.,
225
Rojkjaer, L. & Forni, G.L. (2008) Cumulative Efficacy and Safety of 5-Year
Deferasirox (Exjade®) Treatment in Pediatric Patients with Thalassemia
Major: A Phase II Multicenter Prospective Trial. Blood (ASH Annual
Meeting Abstracts), 112, Abstract 5413.
Piga, A., Longo, F., Duca, L., Roggero, S., Vinciguerra, T., Calabrese, R.,
Hershko, C. & Cappellini, M.D. (2009) High nontransferrin bound iron
levels and heart disease in thalassemia major. Am J Hematol, 84, 29–33.
Pippard, M.J., Callender, S.T. & Finch, C. a (1982) Ferrioxamine excretion in
iron-loaded man. Blood, 60, 288–94.
Ponka, P. & Lok, C.N. (1999) The transferrin receptor: role in health and disease.
The International Journal of Biochemistry & Cell Biology, 31, 1111–1137.
Pootrakul, P., Breuer, W., Sametband, M., Sirankapracha, P., Hershko, C. &
Cabantchik, Z.I. (2004) Labile plasma iron (LPI) as an indicator of
chelatable plasma redox activity in iron-overloaded beta-thalassemia/HbE
patients treated with an oral chelator. Blood, 104, 1504–1510.
Porter, J. (2005) Pathophysiology of iron overload. Hematol Oncol Clin North
Am., 19, 7–12.
Porter, J. (2009) Blood transfusion: quality and safety issues in thalassemia, basic
requirements and new trends. Hemoglobin, 33 Suppl 1, S28-36.
Porter, J., Cappellini, C., Kattamis, A., Viprakasit, V., Lawniczek, T., Ros, J.,
Deng, W. & Taher, A. (2011a)RELATIONSHIPS BETWEEN PLASMA
NON-TRANSFERRIN-BOUND IRON AND MARKERS OF IRON
OVERLOAD, ANAEMIA AND INEFFECTIVE ERYTHROPOIESIS IN
NON-TRANSFUSION-DEPENDENT THALASSAEMIA SYNDROMES.
In 16th Congress of the European Hematology Association, London, United
Kingdom, June 9-12, 2011 p 228. London.
226
Porter, J., Galanello, R., Saglio, G., Neufeld, E.J., Vichinsky, E., Cappellini,
M.D., Olivieri, N., Piga, A., Cunningham, M.J., Souli??res, D., Gattermann,
N., Tchernia, G., Maertens, J., Giardina, P., Kwiatkowski, J., Quarta, G.,
Jeng, M., Forni, G.L., Stadler, M., Cario, H., et al (2008) Relative response
of patients with myelodysplastic syndromes and other transfusion-
dependent anaemias to deferasirox (ICL670): A 1-yr prospective study.
European Journal of Haematology, 80, 168–176.
Porter, J.B. (2007) Concepts and goals in the management of transfusional iron
overload. Am J Hematol, 82, 1136–1139.
Porter, J.B., Abeysinghe, R.D., Marshall, L., Hider, R.C. & Singh, S. (1996)
Kinetics of removal and reappearance of non-transferrin-bound plasma iron
with deferoxamine therapy. Blood, 88, 705–13.
Porter, J.B., Cohen, A.R. & Kwiatkowski, J.L. (2009)Transfusion and iron
chelation . In Disorders of Hemoglobin, Steinberg MH Forget BG Higgs
DR & Weatheral DJ (eds) pp 689–744. New York: Cambridge University
Press.
Porter, J.B. & Davis, B.A. (2002) Monitoring chelation therapy to achieve
optimal outcome in the treatment of thalassaemia. Best Practice and
Research: Clinical Haematology, 15, 329–368.
Porter, J.B. & Garbowski, M. (2014) The pathophysiology of transfusional iron
overload. Hematology/Oncology Clinics of North America, 28, 683–701.
Porter, J.B. & Huehns, E.R. (1987) Transfusion and exchange transfusion in
sickle cell anaemias, with particular reference to iron metabolism. Acta
haematologica, 78, 198–205.
Porter, J.B., Lin, K.H., Beris, P., Forni, G.L., Taher, A., Habr, D., Domokos, G.,
Roubert, B. & Thein, S.L. (2011b) Response of iron overload to deferasirox
in rare transfusion-dependent anaemias: Equivalent effects on serum ferritin
227
and labile plasma iron for haemolytic or production anaemias. European
Journal of Haematology, 87, 338–348.
Porter, J.B., Morgan, J., Hoyes, K.P., Burke, L.C., Huehns, E.R. & Hider, R.C.
(1990) Relative oral efficacy and acute toxicity of hydroxypyridin-4-one
iron chelators in mice. Blood, 76, 2389–2396.
Porter, J.B., Walter, P.B., Neumayr, L.D., Evans, P., Bansal, S., Garbowski, M.,
Weyhmiller, M.G., Harmatz, P.R., Wood, J.C., Miller, J.L., Byrnes, C.,
Weiss, G., Seifert, M., Grosse, R., Grabowski, D., Schmidt, A., Fischer, R.,
Nielsen, P., Niemeyer, C. & Vichinsky, E. (2014) Mechanisms of plasma
non-transferrin bound iron generation: Insights from comparing transfused
diamond blackfan anaemia with sickle cell and thalassaemia patients.
British Journal of Haematology, 167, 692–696.
Qian, Z.M., Chang, Y.Z., Leung, G., Du, J.R., Zhu, L., Wang, Q., Niu, L., Xu,
Y.J., Yang, L., Ho, K.P. & Ke, Y. (2007) Expression of ferroportin1,
hephaestin and ceruloplasmin in rat heart. Biochim Biophys Acta, 1772,
527–532.
R’zik, S. & Beguin, Y. (2001) Serum soluble transferrin receptor concentration is
an accurate estimate of the mass of tissue receptors. Experimental
Hematology, 29, 677–685.
Ricchi, P., Meloni, A., Spasiano, A., Neri, M.G., Gamberini, M.R., Cuccia, L.,
Caruso, V., Gerardi, C., D’Ascola, D.G., Rosso, R., Campisi, S., Rizzo, M.,
Terrazzino, F., Vangosa, A.B., Chiodi, E., Missere, M., Mangione, M.,
Positano, V. & Pepe, A. (2015) Extramedullary hematopoiesis is associated
with lower cardiac iron loading in chronically transfused thalassemia
patients. American Journal of Hematology, 90, 1008–1012.
Riemer, J., Hoepken, H.H., Czerwinska, H., Robinson, S.R. & Dringen, R.
(2004) Colorimetric ferrozine-based assay for the quantitation of iron in
cultured cells. Analytical Biochemistry, 331, 370–375.

228
Rose, C., Brechignac, S., Vassilief, D., Pascal, L., Stamatoullas, A., Guerci, A.,
Larbaa, D., Dreyfus, F., Beyne-Rauzy, O., Chaury, M.P., Roy, L., Cheze, S.,
Morel, P. & Fenaux, P. (2010) Does iron chelation therapy improve survival
in regularly transfused lower risk MDS patients? A multicenter study by the
GFM. Leukemia Research, 34, 864–870.
Rouault, T.A., Stout, C.D., Kaptain, S., Harford, J.B. & Klausner, R.D. (1991)
Structural relationship between an iron-regulated RNA-binding protein
(IRE-BP) and aconitase: Functional implications. Cell, 64, 881–883.
Sadat-Ali, M., Sultan, O., Al-Turki, H. & Alelq, A. (2011) Does high serum iron
level induce low bone mass in sickle cell anemia? BioMetals, 24, 19–22.
Santini, V., Girelli, D., Sanna, A., Martinelli, N., Duca, L., Campostrini, N.,
Cortelezzi, A., Corbella, M., Bosi, A., Reda, G., Olivieri, O. & Cappellini,
M.D. (2011) Hepcidin levels and their determinants in different types of
myelodysplastic syndromes. PLoS ONE, 6, e23109.
Sarantos, K., Evans, P., Garbowski, M., Davis, B. & Porter, J.B. (2008) Vitamin
C Deficiency in Patients on Long-Term Deferasirox without
Supplementation. ASH Annual Meeting Abstracts, 112, 1858.
Schein, A., Enriquez, C., Coates, T.D. & Wood, J.C. (2008) Magnetic resonance
detection of kidney iron deposition in sickle cell disease: A marker of
chronic hemolysis. Journal of Magnetic Resonance Imaging, 28, 698–704.
Sears, D.A., Anderson, P.R., Foy, A.L., Williams, H.L. & Crosby, W.H. (1966)
Urinary iron excretion and renal metabolism of hemoglobin in hemolytic
diseases. Blood, 28, 708–25.
Shah, F.T., Westwood, M.A., Evans, P.J. & Porter, J.B. (2002) Discordance in
MRI assessment of iron distribution and plasma NTBI between
transfusionally iron loaded adults with sickle cell and thalassaemia
syndromes. . Blood, 100, 468a.
229
Silva, A.M.N. & Hider, R.C. (2009) Influence of non-enzymatic post-translation
modifications on the ability of human serum albumin to bind iron.
Implications for non-transferrin-bound iron speciation. Biochimica et
Biophysica Acta - Proteins and Proteomics, 1794, 1449–1458.
Silva, A.M.N., Kong, X., Parkin, M.C., Cammack, R. & Hider, R.C. (2009)
Iron(III) citrate speciation in aqueous solution. Dalton transactions
(Cambridge, England : 2003), 8616–8625.
Silvestri, L., Pagani, A., Nai, A., De Domenico, I., Kaplan, J. & Camaschella, C.
(2008) The Serine Protease Matriptase-2 (TMPRSS6) Inhibits Hepcidin
Activation by Cleaving Membrane Hemojuvelin. Cell Metabolism, 8, 502–
511.
Simpson, R.J., Konijn, A.M., Lombard, M., Raja, K.B., Salisbury, J.R. & Peters,
T.J. (1993) Tissue iron loading and histopathological changes in
hypotransferrinaemic mice. Journal of Pathology, 171, 237–244.
Singh, S., Hider, R.C. & Porter, J.B. (1990) A direct method for quantification of
non-transferrin-bound iron. Analytical Biochemistry, 186, 320–323.
Sonakul, D., Pacharee, P., Wasi, P. & Fucharoen, S. (1984) Cardiac pathology in
47 patients with beta thalassaemia/haemoglobin E. Southeast Asian J Trop
Med Public Health, 15, 554–563.
Speek, A.J., Schrijver, J. & Schreurs, W.H. (1984) Fluorometric determination of
total vitamin C in whole blood by high-performance liquid chromatography
with pre-column derivatization. Journal of chromatography, 305, 53–60.
Srichairatanakool, S., Kemp, P. and Porter, J.B. (1997)Evidence for ‘shuttle’
effect of NTBI onto desferrioxamine in thalassaemic plasma in the presence
of NTA. In International Symposium: Iron in Biology and Medicine. p
Abstract no. 210. St. Malo, France.
230
St Pierre, T.G., Tran, K.C., Webb, J., Macey, D.J., Heywood, B.R., Sparks, N.H.,
Wade, V.J., Mann, S. & Pootrakul, P. (1991) Organ-specific crystalline
structures of ferritin cores in beta-thalassemia/hemoglobin E. Biol Met, 4,
162–165.
de Swart, L., Hendriks, J.C.M., van der Vorm, L.N., Cabantchik, Z.I., Evans,
P.J., Hod, E.A., Brittenham, G.M., Furman, Y., Wojczyk, B., Janssen,
M.C.H., Porter, J.B., Mattijssen, V.E.J.M., Biemond, B.J., Mackenzie,
M.A., Origa, R., Galanello, R., Hider, R.C. & Swinkels, D.W. (2015)
Second international round robin for the quantification of serum non-
transferrin-bound iron and labile plasma iron in patients with iron-overload
disorders. Haematologica, 101, 38–45.
Swart, L. De, Smith, A., Fenaux, P., Bowen, D., Sanz, G., Hellström-lindberg,
E., Symeonidis, A., Cermak, J. & Germing, U. (2015) Transfusion-
Dependency Is the Most Important Prognostic Factor for Survival in 100 ...
Transfusion-Dependency Is the Most Important Prognostic Factor for
Survival in 1000 Newly Diagnosed MDS Patients with Low- and
Intermediate-1 Risk MDS in the European L. Blood, 67, 18–21.
Taher, A., Musallam, K.M., El Rassi, F., Duca, L., Inati, A., Koussa, S. &
Cappellini, M.D. (2009) Levels of non-transferrin-bound iron as an index of
iron overload in patients with thalassaemia intermedia. British Journal of
Haematology, 146, 569–572.
Takatoku, M., Uchiyama, T., Okamoto, S., Kanakura, Y., Sawada, K.,
Tomonaga, M., Nakao, S., Nakahata, T., Harada, M., Murate, T. & Ozawa,
K. (2007) Retrospective nationwide survey of Japanese patients with
transfusion-dependent MDS and aplastic anemia highlights the negative
impact of iron overload on morbidity/mortality. European Journal of
Haematology, 78, 487–494.
Taketani, S. (2005) Aquisition, mobilization and utilization of cellular iron and
heme: endless findings and growing evidence of tight regulation. The
231
Tohoku journal of experimental medicine, 205, 297–318.
Takeuchi, K. & Guggino, S.E. (1996) 24R,25-(OH)2 vitamin D3 inhibits 1??,25-
(OH)2 vitamin D3 and testosterone potentiation of calcium channels in
osteosarcoma cells. Journal of Biological Chemistry, 271, 33335–33343.
Tanno, T., Bhanu, N. V, Oneal, P. a, Goh, S.-H., Staker, P., Lee, Y.T., Moroney,
J.W., Reed, C.H., Luban, N.L.C., Wang, R.-H., Eling, T.E., Childs, R.,
Ganz, T., Leitman, S.F., Fucharoen, S. & Miller, J.L. (2007) High levels of
GDF15 in thalassemia suppress expression of the iron regulatory protein
hepcidin. Nature medicine, 13, 1096–1101.
Tanno, T., Porayette, P., Sripichai, O., Noh, S.J., Byrnes, C., Bhupatiraju, A.,
Lee, Y.T., Goodnough, J.B., Harandi, O., Ganz, T., Paulson, R.F. & Miller,
J.L. (2009) Identification of TWSG1 as a second novel erythroid regulator
of hepcidin expression in murine and human cells. Blood, 114, 181–186.
Telfer, P.T., Prestcott, E., Holden, S., Walker, M., Hoffbrand, A. V. & Wonke,
B. (2000) Hepatic iron concentration combined with long-term monitoring
of serum ferritin to predict complications of iron overload in thalassaemia
major. British Journal of Haematology, 110, 971–977.
Thomas, A.S., Garbowski, M.W., Ang, A.L., Shah, F.T., Walker, J.M., Moon,
J.C., Pennell, D.J., Porter, J.B. & Shah, T. (2010) A Decade Follow-up of a
Thalassemia Major (TM) Cohort Monitored by Cardiac Magnetic
Resonance Imaging (CMR): Significant Reduction In Patients with Cardiac
Iron and In Total Mortality. Blood (ASH Annual Meeting Abstracts), 116,
1011.
Vasavda, N., Gutiérrez, L., House, M.J., Drašar, E., St Pierre, T.G. & Thein, S.L.
(2012) Renal iron load in sickle cell disease is influenced by severity of
haemolysis. British Journal of Haematology, 157, 599–605.
Vichinsky, E., Bernaudin, F., Forni, G.L., Gardner, R., Hassell, K., Heeney,
232
M.M., Inusa, B., Kutlar, A., Lane, P., Mathias, L., Porter, J., Tebbi, C.,
Wilson, F., Griffel, L., Deng, W., Giannone, V. & Coates, T. (2011) Long-
term safety and efficacy of deferasirox (Exjade??) for up to 5years in
transfusional iron-overloaded patients with sickle cell disease. British
Journal of Haematology, 154, 387–397.
Vichinsky, E., Butensky, E., Fung, E., Hudes, M., Theil, E., Ferrell, L., Williams,
R., Louie, L., Lee, P.D.K. & Harmatz, P. (2005) Comparison of organ
dysfunction in transfused patients with SCD or ?? thalassemia. American
Journal of Hematology, 80, 70–74.
Vokurka, M., Krijt, J., ??ulc, K. & Ne??as, E. (2006) Hepcidin mRNA levels in
mouse liver respond to inhibition of erythropoiesis. Physiological Research,
55, 667–674.
Walter, P.B., Fung, E.B., Killilea, D.W., Jiang, Q., Hudes, M., Madden, J.,
Porter, J., Evans, P., Vichinsky, E. & Harmatz, P. (2006) Oxidative stress
and inflammation in iron-overloaded patients with beta-thalassaemia or
sickle cell disease. British journal of haematology, 135, 254–63.
Walter, P.B., Macklin, E.A., Porter, J., Evans, P., Kwiatkowski, J.L., Neufeld,
E.J., Coates, T., Giardina, P.J., Vichinsky, E., Olivieri, N., Alberti, D.,
Holland, J. & Harmatz, P. (2008) Inflammation and oxidant-stress in ??-
thalassemia patients treated with iron chelators deferasirox (ICL670) or
deferoxamine: An ancillary study of the Novartis CICL670A0107 trial.
Haematologica, 93, 817–825.
Wang, C.Y. & Knutson, M.D. (2013) Hepatocyte divalent metal-ion transporter-
1 is dispensable for hepatic iron accumulation and non-transferrin-bound
iron uptake in mice. Hepatology, 58, 788–798.
Wang, H. & Joseph, J.A. (1999) Quantifying cellular oxidative stress by
dichlorofluorescein assay using microplate reader. Free Radical Biology
and Medicine, 27, 612–616.

233
Wang, S. (2008) A Comparative study of Fenton and Fenton-like reaction
kinetics in decolourisation of wastewater. Dyes and Pigments, 76, 714–720.
WANG, Z., WOOD, J., WALTER, P. & et al. (2013)BioIron Abstracts. In
American Journal of Hematology pp E5–E243.
Washington, R. & Boggs, D.R. (1975) Urinary iron in patients with sickle cell
anamia. The Journal of laboratory and clinical medicine, 86, 17–23.
Weiss, H.M., Fresneau, M., Camenisch, G.P., Kretz, O. & Gross, G. (2006) In
vitro blood distribution and plasma protein binding of the iron chelator
deferasirox (ICL670) and its iron complex Fe-[ICL670]2 for rat, marmoset,
rabbit, mouse, dog, and human. Drug Metabolism and Disposition, 34, 971–
975.
Westwood, M. a, Shah, F., Anderson, L.J., Strange, J.W., Tanner, M. a, Maceira,
A.M., Howard, J., Porter, J.B., Walker, J.M., Wonke, B. & Pennell, D.J.
(2007) Myocardial tissue characterization and the role of chronic anemia in
sickle cell cardiomyopathy. Journal of magnetic resonance imaging : JMRI,
26, 564–568.
Wickramasinghe, S.N., Thein, S.L., Srichairatanakool, S. & Porter, J.B. (1999)
Determinants of iron status and bilirubin levels in congenital
dyserythropoietic anaemia type I. Br J Haematol, 107, 522–5.
Wijarnpreecha, K., Kumfu, S., Chattipakorn, S.C. & Chattipakorn, N. (2015)
Cardiomyopathy Associated with Iron Overload: How Does Iron Enter
Myocytes and What are the Implications for Pharmacological Therapy?
Hemoglobin, 39, 9–17.
Wilkins, S.J., Frazer, D.M., Millard, K.N., McLaren, G.D. & Anderson, G.J.
(2006) Iron metabolism in the hemoglobin-deficit mouse: Correlation of
diferric transferrin with hepcidin expression. Blood, 107, 1659–1664.

234
Wood, J.C. (2014) Guidelines for quantifying iron overload. Hematology, 2014,
210–215.
Wood, J.C., Claster, S., Carson, S., Menteer, J.D., Hofstra, T., Khanna, R. &
Coates, T. (2008) Vitamin D deficiency, cardiac iron and cardiac function in
thalassaemia major. British Journal of Haematology, 141, 891–894.
Wood, J.C., Enriquez, C., Ghugre, N., Tyzka, J.M., Carson, S., Nelson, M.D. &
Coates, T.D. (2005) MRI R2 and R2* mapping accurately estimates hepatic
iron concentration in transfusion-dependent thalassemia and sickle cell
disease patients. Blood, 106, 1460–1465.
Wood, J.C., Tyszka, J.M., Carson, S., Nelson, M.D. & Coates, T.D. (2004)
Myocardial iron loading in transfusion-dependent thalassemia and sickle
cell disease. Blood, 103, 1934–1936.
Wu, K.-H., Chang, J.-G., Ho, Y.-J., Wu, S.-F. & Peng, C.-T. (2006) Glutathione
S-transferase M1 gene polymorphisms are associated with cardiac iron
deposition in patients with beta-thalassemia major. Hemoglobin, 30, 251–6.
Zepp, R.G., Faust, B.C. & Holgne, J. (1992) Hydroxyl Radical Formation in
Aqueous Reactions (pH 3-8) of Iron(I1) with Hydrogen Peroxide: The
Photo-Fenton Reaction. Environmental Science & Technology, 26, 313–
319.
Zhao, M., Laissue, J.A. & Zimmermann, A. (1997) Hepatocyte apoptosis in
hepatic iron overload diseases. Histol Histopathol, 12, 367–374.
Zuo, Y., Xiang, B., Yang, J., Sun, X., Wang, Y., Cang, H. & Yi, J. (2009)
Oxidative modification of caspase-9 facilitates its activation via disulfide-
mediated interaction with Apaf-1. Cell research, 19, 449–57.
Zurlo, M., De Stefano, P., Borgna-Pignatti, C., Di Palma, A., Melevendi, C.,
Piga, A., Di Gregorio, F., Burattini, M. & Terzoli, S. (1989) Survival and

235
Causes of Death in Thalassaemia Major. The Lancet, 334, 27–30.