mold growth risk evaluation using the mold index mi · invisible growth acceptable ... eye mi ≥ 3...
TRANSCRIPT

Mold growth risk evaluation
using the mold index MI

2
Contents:
Mold problems in practice
Example Case
Evaluation with WUFI®-Bio
Evaluation with WUFI®-VTT
Common traffic light classification
Mold risk evaluation

3
Mould growth occurs at the surface as well as inside
building assemblies
… in old and new buildings
… in cold (winter) and warm countries (summer)
and leads to significant renovation costs
Mold problems in building practice
© T. Tanaka © J. Lstiburek

4
Higher insulation level reduces risk on the interior surface
…but also lowers the drying potential of the assembly
Air tight construction / high performance AC increase risk due to higher
indoor RH
Lower tolerance of inhabitants versus mold
Mould growth risk evaluation continues to be important!
Main question in practice:
Who is to blame - the user or the building design??
Mold problems in building practice

5
Numerical hygrothermal simulations allow the prediction of temperature and
RH on the surfaces as well as at the interfaces between different materials inside the
assemblies.
The mould growth risk can be predicted by numerical models on basis of
Temperature, RH (normal or extreme indoor climate) and the nutrient quality of the
substrate.
Amongst others two numerical prediction models are available, well established and
used worldwide for this purpose:
VTT / Viitanen model Biohygrothermal IBP model
Mold growth prediction models

6
Conditions in a building assembly
Cathedral ceiling insulation
of pitched metal roof
Example Case
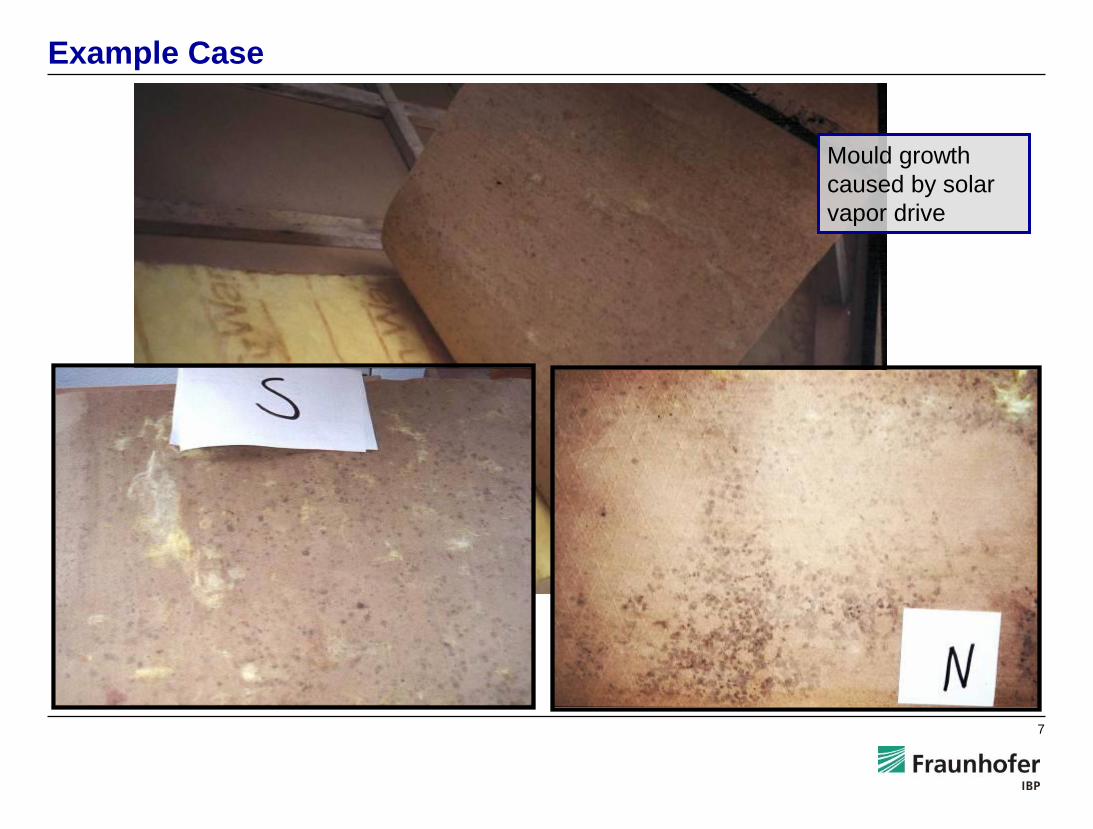
7
Mould growth
caused by solar
vapor drive
Example Case

8
No mould growth
on PA-film
Variable diffusion resistance of PA-film
Example Case

9
= Holzfeuchtemeßstellen
Zinkblech
Sparren
Holzschalung
Mineralwolle
Papierfolie Kunststoffolie
Measurements
Example Case

10
WUFI®
simu-
lation
Location: Holzkirchen Cathedral ceiling orientation: 50° south
zinc on wooden sheathing fiber glass insulation v.r. & gypsum board
cross section [cm]
Example Case

11
WUFI®
simulation Hygrothermal
conditions
between vapor
retarder and
insulation
Evaluation with WUFI®-Bio

12
Kraft paper
PA-film
Humidity fluctuations
between vapor retarder
and insulation
Evaluation with WUFI®-Bio
WUFI®
simulation

13
Water Content of Model Spore
Critical water content
biodegradable substrate
non biodegradable substrate
Evaluation with WUFI®-Bio
WUFI®-Bio
simulation

14
WUFI®-Bio
Here only an
assessment of the
interior surface is
possible
Evaluation with WUFI®-Bio
WUFI®-Bio: As a PostProcessor combined with WUFI®-Pro
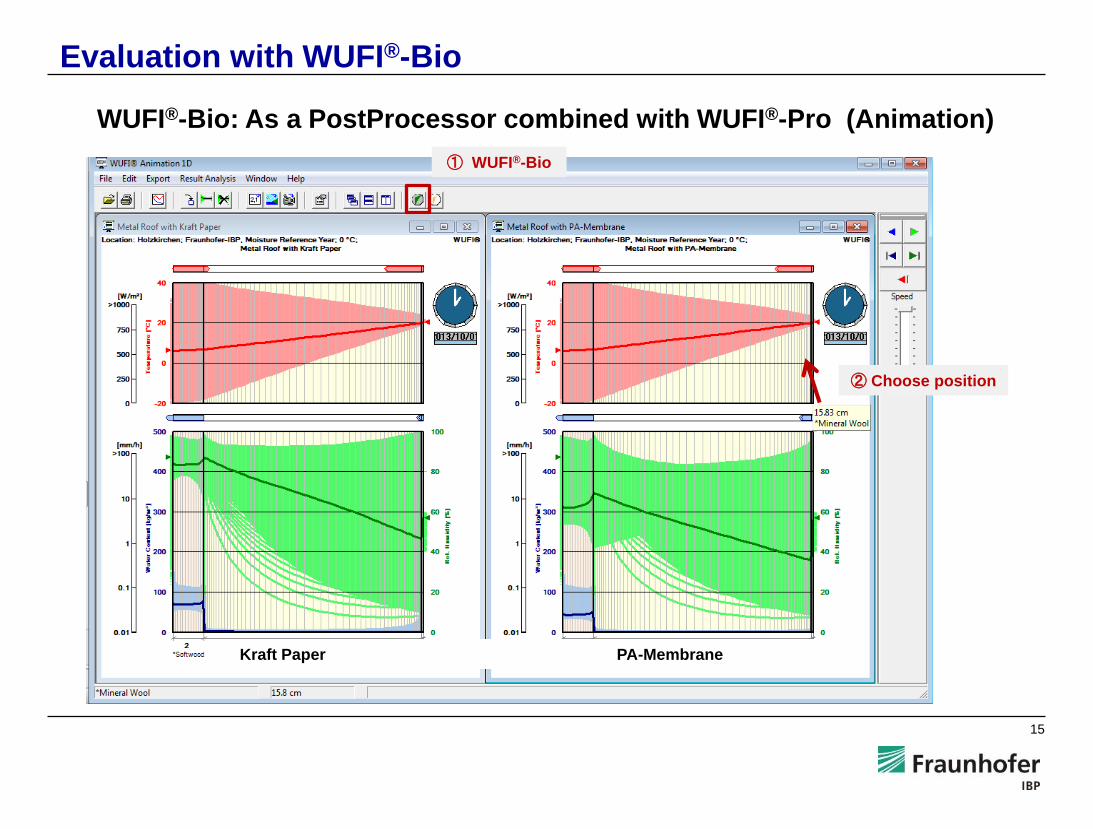
15
WUFI®-Bio: As a PostProcessor combined with WUFI®-Pro (Animation)
Evaluation with WUFI®-Bio
① WUFI®-Bio
② Choose position
Kraft Paper PA-Membrane

16
Inputs : Initial RH in spore & Substrate Class
Evaluation with WUFI®-Bio

17
Evaluation with WUFI®-Bio
Temperature Relative Humidity
Climate: Temperature and Relative Humidity used for the Assesment

18
Kraft Paper
Mould Growth [mm] Mould Index [-]
Evaluation with WUFI®-Bio

19
PA-Membrane
Mould Growth [mm] Mould Index [-]
Evaluation with WUFI®-Bio

20
As a PostProcessor combined with WUFI®-Pro
VTT/Viitanen
Here only an
assessment of the
interior surface is
possible
Evaluation with WUFI®-VTT

21
As a PostProcessor combined with WUFI®-Pro (Animation)
① VTT/Viitanen
② Choose position
Evaluation with WUFI®-VTT

22
Occupant exposition
class criterium of
traffic light
Choice of Material
- Wooden materials x 14
- Other materials x 16
Setting the factors
Factors are for each material
predefined:
- Sensitivity Class
- Material Class
- Type of surface
- Type of wood
User defined also possible
Evaluation with WUFI®-VTT
Input: Exposition class of surface

23
Input: Available materials in the lists
Wooden and natural materials Other materials
Coated wooden materials for outdoor use „worst case“
Hardwood resistant (e.g., oak, larch, western red cedar)
(heartwood) Aerated autoclaved concrete
Hardwood sensitive (e.g. birch, maple, beech) (heartwood) Brick
Mineral fibers Cement based materials
Moisture resistant Particle board Concrete
OSB EPS
paper coated products (e.g. gypsum board, PU board) Glass / Metal / Metal coated surface
Particle board Gypsum render with organic compounds
plywood (birch) Light weight concrete
plywood (softwood) PU-insulation with Al-foil
Resistant wooden / natural fibre materials PUR-products
Rough and solied surface (worst case assumption) Prastic surfaces (smooth)
Sapwood, sensitive wooden/natural fiber materials Prastic wool
Untreated pine or spruce (heartwood) Pure gypsum or lime render
Silicate wall painting
Wall paints for indoor use
Evaluation with WUFI®-VTT

24
Input: User defined seetings
Evaluation with WUFI®-VTT

25
Climate: Temperature and Relative Humidity used for the Assessment Input from WUFI®
Evaluation with WUFI®-VTT

26
Mould Growth Index Mould Growth Rate
Kraft Paper
Evaluation with WUFI®-VTT

27
PA-Membrane (compared to Kraft Paper)
Mould Growth Index Mould Growth Rate
Evaluation with WUFI®-VTT

28
Comparison of mould growth prediction from the two models to develop a transfer function for hyphen growth in mm to Mould Index MI
Outdoor climate: 32 different locations in Europe and USA representing regions with
cold winters, moderate climate, warm summer etc.
Indoor climate: 14 different cases varying indoor climate according to different
European and US standards and guidelines
Lightweight and massive assemblies with U-values from 0,3 W/m²K (well insulated
new walls) to 1,9 W/m²K (thermal bridge situation)
In total about 350 simulation cases
Common traffic light classification

29
Common traffic light classification
Comparison of mould growth prediction from the two models to develop a transfer function for hyphen growth in mm to Mould Index MI
Finally good correlation with polynomial
regression fit (red curve)
A Brunauer–Emmett–Teller (BET) adsorption was
chosen as regression curve
Periods with growth
reduction (only VTT model)
and growth rates above MI 6
(only IBP model) were
excluded
Transfer Function allows to compare the results of the two models and to express them
commonly in the clear six-steps Mould-Index scale

30
Interior surface / direct
contact to the indoor air
Surfaces inside the
assembly / no contact to
the indoor air
Contact with users /
inhabitants excluded
Period too short (< 1 year)
Evaluation not possible or not meaningful
MI < 1 : no or just starting
invisible growth acceptable
in indoor spaces (plants,
food)
MI < 2 : no or only invisible
growth, recognizable only
by microscope
MI < 3 : growth starts to
become visible to the naked
eye
1 ≤ MI < 2: invisible growth,
recognizable only by
microscope
2 ≤ MI < 3: growth starts to
become visible to the naked
eye
MI ≥ 3
In most cases no damage of
the material due to mold!
Stricter limits may be
necessary to avoid damage
caused by metabolites or to
exclude growth of toxic
mold species!
Topic of further research!
MI ≥ 2: growth starts to
become visible to the naked
eye
MI ≥ 3: growth is visible to
the naked eye and starts
covering the surface
Common traffic light classification for VTT and Bio

31
1. No evaluation of exterior surfaces!
UV radiation, frost, rain water impact may be lethal for many species
considered by the model.
2. Reduced growth risk in isolated air gaps inside the assemblies!
No new spores and nutrients are provided during operation.
3. Reduced growth risk on fresh concrete, renders or cementitious materials
alkaline conditions prohibit mold formation and the predicted MI values
are not valid until complete carbonation of the considered surface
4. Reduced or eliminated growth risk at interfaces exposed to high
temperatures (like e.g. dark flat roofs)
high temperatures can become lethal for most mold species. If
hyphen die before sporolation, the interface is sterilized
Model limitations
33
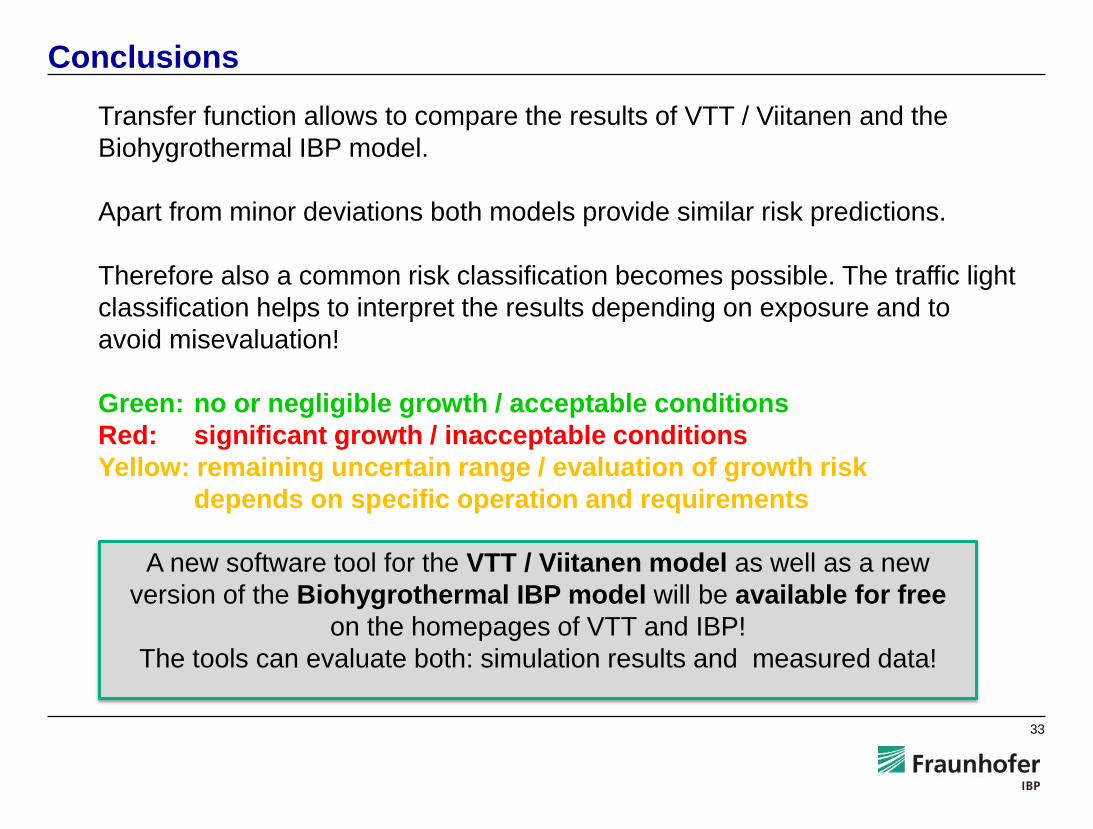
Transfer function allows to compare the results of VTT / Viitanen and the
Biohygrothermal IBP model.
Apart from minor deviations both models provide similar risk predictions.
Therefore also a common risk classification becomes possible. The traffic light
classification helps to interpret the results depending on exposure and to
avoid misevaluation!
Green: no or negligible growth / acceptable conditions
Red: significant growth / inacceptable conditions
Yellow: remaining uncertain range / evaluation of growth risk
depends on specific operation and requirements
A new software tool for the VTT / Viitanen model as well as a new
version of the Biohygrothermal IBP model will be available for free
on the homepages of VTT and IBP!
The tools can evaluate both: simulation results and measured data!
Conclusions

Mold growth risk evaluation
with the mold index MI