moisture sorption isotherms for crushed chillies
TRANSCRIPT

ARTICLE IN PRESS
doi:10.1016/j.biosystemseng.2004.10.008PH—Postharvest Technology
Biosystems Engineering (2005) 90(1), 47–61
Moisture Sorption Isotherms for Crushed Chillies
Nurhan Arslan; Hasan Togrul
Department of Chemical Engineering, Faculty of Engineering, Fırat University, 23279 Elazıg, Turkey; e-mail of corresponding author:[email protected]
(Received 6 April 2004; accepted in revised form 25 October 2004; published online 18 January 2004)
The moisture isotherms of crushed chillies stored in a chamber the relative humidity of which is controlled byan atomising humidifier were determined at 25, 35 and 45 1C and within the range of 0�1–0�8 water activity.The sorption isotherms of crushed chillies exhibited type III behaviour according to BET classification.Sorption capacity decreased with increasing temperature. The sorption isotherms of crushed chillies exhibitedhysteresis. The moisture sorption data were used to fit Guggenheim–Anderson–de Boer, Brunauer–Emmett–Teller, Henderson, Oswin, Peleg, Crapiste and Rotstein, Caurie models, and constants of equationstested were determined by non-linear regression analysis. Among the various models tested to interpretsorption isotherms, one was selected which presented best statistical indicators. The Peleg and theCrapiste–Rotstein models correctly fit the whole set of data, for water activity ranging from 0�1 to 0�8, but theCrapiste and Rotstein model was preferred since the values of its parameter were more realistic. The surfacearea of the monolayer was calculated. The water activities corresponding to the monolayer values weredetermined. The thermodynamic functions such as isosteric heat of sorption, sorption entropy, spreadingpressure, net integral enthalpy and entropy were determined by means of sorption isotherm data. The isostericheats of desorption, calculated from the slope of plot of logarithm of water activity versus reciprocal oftemperature, were higher than the isosteric heats of adsorption.r 2004 Silsoe Research Institute. All rights reserved
Published by Elsevier Ltd
1. Introduction
All food contain water, and it is well recognised thatthose most susceptible to physical and chemicaldegradations are of high water content. During long-term storage of food, important physico-chemical andbiological changes take place with a strong impact onthe nutrient properties. To a large extent, these changesdepend on the moisture content of food (Hentges et al.,1991; Menkov, 2000a). A hygroscopic foodstuff con-tains water in both bound and unbound forms that caninfluence its structure and texture. The unbounded watercan also affect the stability of the foodstuff, bydetermining the extent to which bacteria thrive anddegradation reactions occur within it. Dehydration isthus a common method for preserving foodstuffs(Vazquez et al., 1999).The relationship between water activity and the
moisture content in food at a constant temperature is
1537-5110/$30.00 47
often expressed as a sorption isotherm. These equationshave been used to describe equilibrium moisture data ofmany agricultural products (Boquet et al., 1978;Lomauro et al., 1985; Tsami et al., 1990a; Maskan &Gogus-, 1997; Timmermann et al., 2001). Many of theseequations are of limited value as they are applicable overa narrow range of water activity. Determination of themoisture sorption behaviour of foods can be used tosolve food-processing design problems, to predict energyrequirements and determine proper storage conditions(Myhara et al., 1998). If the storage environment has apartial pressure of water vapour above or below thevapour pressure of water at the foodstuff surface, wateris adsorbed or desorbed, respectively. Up to wateractivity of about 0�30, it is considered that water is heldon polar sites of relatively high energies. This is calledthe monolayer. The water activity in the range of0�30–0�70 is referred to multi-layer water. It consists oflayers of water, which are adsorbed onto the first layer
r 2004 Silsoe Research Institute. All rights reserved
Published by Elsevier Ltd

ARTICLE IN PRESS
Notation
AC, BC, CC Crapiste–Rotstein model parametersAH, BH Henderson model parametersAm area of a water molecule
(1�06� 10�19m2)AO; BO Oswin model parametersAx, Bx constantsa, k Caurie model parametersaw water activity(aw)x water activity corresponding to the
monolayer moisture content(aw)
* geometric mean water activity at con-stant spreading pressure
b, b0 constants from Dent sorption isothermrelated to the properties of the adsorbedwater, dimensionless
C constantCB Brunauer–Emmett–Teller model para-
meterCG, K Guggenheim–Anderson–de Boer model
parametersC0 constant (adjusted to the temperature
effect), dimensionlesseave average residualeRMS root mean-square errorHM heat of sorption of the first layer,
kJmol�1
HN heat of sorption of a multi-layer,kJmol�1
HL latent heat of vapourisation of purewater, kJmol�1
DHc difference in enthalpy between mono-layer and multi-layer sorption, Jmol�1
DHd isosteric heat of sorption, kJmol�1
DHk difference between the latent heat ofvapourisation of pure water and heat ofsorption of the multi-layer, Jmol�1
heq net integral enthalpy, kJmol�1
Dhd net isosteric heat of sorption, kJmol�1
K0 constant (adjusted to the temperatureeffect), dimensionless
K1, K2 constantsKB Boltzmann’s constant
(1�380� 10�23 JK�1)Mwat molecular weight of water (18 gmol�1)m1, m2 Peleg model parametersN number of experimental dataNA Avogadro’s number
(6� 1023moleculesmol�1)n1, n2 Peleg model parametersP mean relative percentage deviation mod-
ulus, %R universal gas constant
(8�314 Jmol�1K�1)r2 coefficient of determinationS solid surface area, m2 g�1[solids]DS sorption entropy, Jmol�1K�1
DSeq net integral entropy, Jmol�1K�1
T temperature, KTb isokinetic temperature, KThm harmonic mean temperature, Kt temperature, 1CX equilibrium moisture content, % (d.b.)Xei experimental value of equilibrium moist-
ure content, % (d.b.)Xci predicted value of equilibrium moisture
content, % (d.b.)Xm monolayer moisture content, % (d.b.)a constantf spreading pressure, Jm�2
y moisture ratio
N. ARSLAN; H. TOGRUL48
hydrogen bonds. There is a capillary sorption regionabove a water activity of 0�7 and water is relatively freewater (Wolf et al., 1985; Lahsasni et al., 2002). Themonolayer moisture content has a significant impor-tance for the physical and chemical stability ofdehydrated materials (Menkov, 2000a). It can bedetermined from the equilibrium sorption isotherms bymeans of Guggenheim–Anderson–de Boer (GAB) andthe Brunauer–Emmett–Teller (BET) equations. TheBET model assumes a first adsorbed water layer bindingto specific substrate sites resulting in an increased heatof condensation. The GAB model adds the assumptionthat the heat of adsorption from the second to the ninth
layer differs from the heat of pure water condensationby a constant amount (Labuza et al., 1985; Diosadyet al., 1996).
Crushed chillies are subjected to different relativehumidities and temperatures due to handling in a widevariety of climates. It is necessary to know the isothermsin the range of temperatures to model the drying andstorage stability processes and to analyse thermodyna-mically sorption. The knowledge of the dependency ofthe sorption phenomena on temperature providesvaluable information about the changes related to thesystem’s energy (Palou et al., 1997). Thermodynamicproperties of food are crucial in the analysis of heat and

ARTICLE IN PRESS
MOISTURE SORPTION ISOTHERM 49
mass transfer phenomena during dehydration. Theydetermine the end point to which food must bedehydrated in order to achieve a stable product withoptimal moisture content and yield a figure for thetheoretical minimum amount of energy required toremove a given amount of water from food. Theproperties also provide insight into the microstructureassociated with the food–water interface (Rizvi, 1986;Aviara & Ajibola, 2002). Isosteric heat of sorption,often referred to as differential heat of sorption, is usedas an indicator of the state of water adsorbed by thesolid particles (Fasina et al., 1997). The desorption heatis the energy requirement to break the intermolecularforces between the molecules of water vapour and thesurface of adsorbent and the adsorption heat is ameasure of the energy released on sorption (Rizvi,1986). Estimation of heat of sorption data fromisotherms at two or more temperatures throughClausius–Clapeyron type equations allows predictionof isotherms at any temperature. The integral enthalpyof sorption of water in food provides an indication ofthe binding strength of water molecules to the solid andhas some bearing on the energy balance in drying andfreezing operations.Since the crushed chillies are subjected to long-term
storage, important physico-chemical and biologicalchanges take place with a strong impact on the nutrientproperties. To a large extent, these changes depend onthe moisture content of the crushed chillies. The storageconditions have a substantial influence on germinationand longevity (Roberts, 1972; Menkov, 2000b).There-fore, it is necessary to investigate the equilibriummoisture content relationships of the crushed chilliesfor various relative humidities and temperatures toenable the storage conditions for the crushed chillies tobe correctly specified. Kaleemullah and Kailappan(2004) determined the equilibrium moisture contentsfor red chillies using the static method. The sorptionbehaviour of various types of food have been extensivelystudied (Cadden, 1988; Pezzutti & Crapiste, 1997;Belarbi et al., 2000; Chen, 2002; Hossain et al., 2002),but no work has been reported on the moistureisotherms of crushed chillies stored in a chamber therelative humidity of which is controlled by atomisinghumidifier.The objectives of this study were to provide
reliable experimental data for the sorption character-istics of crushed chillies, to evaluate the suitability ofvarious mathematical models for fitting theisotherms, to model the dependence of the isostericheat, net integral enthalpy, sorption entropy, netintegral entropy on moisture content, and to evaluatethe application of the enthalpy–entropy compensationtheory.
2. Materials and methods
2.1. Experimental procedure
Crushed chillies (Capsicum annuum L.) from theElazıg district of Turkey were purchased from a localretail market. The initial moisture content of crushedchillies measured by drying in air oven at 105 1C toconstant weight (AOAC, 1980) was found to 22�85%w.b. (70�1%).
The temperature and relative humidity-controlledchamber was constructed from Cr–Ni stainless-steelsheets as a cuboid with dimensions of 95 cm by 124 cmby 200 cm. All sides and the platform of the chamberwere insulated. The experimental design for evaluatingthe moisture sorption behaviour of the crushed chilliesapparatus used in this study is presented in Fig. 1.Sorption operations were carried out under the condi-tions of 10, 20, 30, 40, 50, 60, 70 and 80% relativehumidities at temperatures of 25, 35, 45 1C. In the firstplace, the relative humidity in chamber was lowered upto 10% relative humidity by means of silica gel(Crosfield Chemicals, UK) since silica gel adsorbedand held water vapour in chamber. The relativehumidity in chamber was detected by relative humiditysensor. Upon achievement of constant conditions withrespect to relative humidity and temperature for theadsorption process, the dried sample of 870�001 g inspecimen baskets from stainless-steel wire was placed intemperature-controlled chamber maintained at a con-stant temperature. The mass change of sample wasrecorded until equilibrium was reached. The relativehumidity of chamber was controlled by the atomisinghumidification system at relative humidities higher than10%. Water purified by a water treatment system thatconsists of ion exchanger and reverse osmosis systemwas stored in a tank of 200 l capacity. The pressure oftreated water sent to the water pressure regulator of theatomising humidifier by means of a pump working atpressures in the range of 3�5–6 bar was adjusted to apressure of 4 bar by a water pressure regulator. After air,compressed in a compressor working at pressures in therange of 4�5–7 bar, was passed through an air filter, thepressure of the air was regulated to pressure of 4 bar bythe air pressure regulator of the atomising humidifier.Water and air was sent into an atomising nozzle. Thecompressed air enters the atomiser and siphons water toproduce a fine, fog-like mist. This mist was injected intothe chamber where it was quickly absorbed by the air tohumidify the chamber. Dry air heaters of 3 kW and acooling unit consisting of a heat pump were used to heator cool the chamber, respectively. The temperature andrelative humidity were kept at constant values by cali-brated temperature and relative humidity controllers.

ARTICLE IN PRESS
1 2
3
4 5 6
7
8
9
11 12 13 14 15
16 17 1819
20 21 Air
Water
22
25
23 24
26
27
2829 30
3132
33 34 35
36
°C°C
RH2
37
38
10
Fig. 1. Schematic diagram of the equipment for the determination of the equilibrium moisture content: (1) water inlet; (2) pump;(3) air pressure tank; (4) filter; (5) ion exchanger; (6) membrane; (7) drainage; (8) purified water; (9) water tank; (10) pump;(11) valve; (12) water valve; (13) no return water; (14) water pressure regulator with manometer; (15) water valve (opening by airpressure); (16) compressor; (17) air filter; (18) air pressure regulator; (19) electric valve; (20) air valve with manometer; (21)fitting; (22) atomising nozzle; (23) temperature sensors; (24) percent relative humidity probe; (25) fan; (26) specimen baskets;(27) UV lamp; (28) hermetic compressor; (29) condenser; (30) liquid tank; (31) filter drier; (32) solenoid valve; (33)thermostatic expansion valve; (34) evaporator; (35) dry air heater; (36) temperature and relative humidity control panel; (37)
cooling unit; (38) constant temperature and humidity chamber
N. ARSLAN; H. TOGRUL50
The system continues to atomise the water until thedesired relative humidity level is achieved. When theproper humidity is reached, the humidity controllerautomatically shuts the system off. Relative humidityand temperature was measured by means of a relativehumidity probe and temperature sensors, respectively.The sensor element of r.h. sensor (RH31, OmegaEngineering Inc., USA) was high polymer film. Thedeviations for temperature and relative humidity controlwere 1 1C and 1%, respectively. A radial fan was used tocirculate the mist inside chamber. An ultraviolet (UV)lamp (Philips, TUV G30T8, Holland) of 30W was usedto prevent mould growth. An uninterruptible powersupply of 3000VA (Inform, Guard 1600, Turkey) wasused to secure electrical protection.The baskets containing the samples maintained a
constant relative humidity and temperature were re-moved and weighed on an electronic balance with anaccuracy of 0�001 g (Shimadzu Corporation, BX 300,Japan) at intervals of 6 h to determine the increases insample weights. The samples were allowed to equilibrateuntil there was no discernible weight change asevidenced by constant weight values (70�001 g). Thetotal time required for removal, weighing and replacingthe samples in duplicate in the chamber was approxi-mately 15 s. This minimised the degree of atmosphericmoisture sorption during weighing. The equilibriummoisture content of the samples was calculated on drybasis from the weight change and dry matter weight.The water activity of a foodstuff is defined as the ratio of
vapour pressure of water in the food to the vapourpressure of pure water at the same temperature. Thewater activity was calculated as percentage relativehumidity (RH). Adsorption processes were repeated forrelative humidities in the range of 10–80% in the orderof increasing relative humidity. For the desorptionprocess, samples were held at 80% relative humidityuntil equilibrium was reached. Then, silica gel was usedto adsorb the water vapour in chamber in the order ofdecreasing relative humidity in desorption studies.Samples were weighed to determine weight loss andequilibrium was considered to be reached when themoisture content (dry basis) did not change by morethan 1mg g�1 of sample (0�1%) during for threeconsecutive weighings. Sorption processes were repeatedfor temperatures of 25, 35, 45 1C 71 1C. All theexperiments were performed in duplicate and averagevalues was used for the determination of moisturesorption isotherms. The standard deviation of eachexperimental point was within the range 0�002–0�004 g.Samples reached equilibrium between 4 and 16 days,depending on the temperature and relative humidity.
2.2. Mathematical analysis and determination of
thermodynamic parameters
2.2.1. Modelling isotherms
The equilibrium moisture data were fitted using someisotherm models such as: Guggenheim–Anderson–de
ARTICLE IN PRESS
MOISTURE SORPTION ISOTHERM 51
Boer (GAB) (Van den Berg & Bruin, 1981), Brunauer–Emmett–Teller (BET) (1938), Henderson (1952), Oswin(1946), Peleg (1993), Crapiste and Rotstein (1985) andCaurie (1970). The different models are shown in Table1. The parameters X, Xm and aw in Table 1 representsequilibrium moisture content in % d.b., monolayermoisture content in % d.b., and water activity,respectively. The symbols CG, K, CB, AH, BH, AO, BO,m1, m2, n1, n2, AC, BC, CC, a, k are the isothermconstants. Model parameters AC, BC and CC in Crapisteand Rotstein equation were estimated by taking thewater activity to be the dependent variable. Modelparameters CG, K, CB, AH, BH, AO, BO, m1, m2, n1, n2, a
and k in the other equations were estimated by takingthe equilibrium moisture content to be the dependentvariable. Statistical analyses to estimate the constants ofthe equilibrium moisture models were carried out usinga software package (Statistica for Windows 5.0, 1995)within the range of 0–0�8 water activity. The quality ofthe fit of the models was judged from the values of themean relative percentage deviation modulus P, theaverage residuals and the root mean-square error(Lomauro et al., 1985).
P ¼100
N
XN
i¼1
jX ei � X cij
X ei
(1)
eave ¼ SjðX ei � X ciÞj=N (2)
eRMS ¼1
N
XN
i¼1
ðX ei � X ciÞ2
" #1=2
(3)
where: Xei and Xci are experimental and predictedequilibrium moisture content values in % d.b., respec-tively; eave is the average residual; eRMS is the root mean-square error; and N is the number of experimental data.A model is considered acceptable if values for P are
below 10% (Wang & Brennan, 1991).
TablModels fitted to the experime
Name of model
GAB (Van den Berg & Bruin, 1981)BET (Brunauer et al.,1938)Henderson (Henderson, 1952)
Oswin (Oswin, 1946)
Peleg (Peleg, 1993)
Crapiste and Rotstein (Crapiste & Rotstein, 1985)
Caurie (Caurie, 1970)
X and Xm, equilibrium and monolayer moisture content, respectively; a
parameters; AH and BH, Henderson model parameters; AO and BO, Osw
Peleg model parameters; AC, BC, CC, Crapiste and Rotstein model param
The constant CG is related to the first layer heat ofsorption and K is a factor correcting properties of themulti-layer molecules with respect to the bulk liquid.The effect of temperature on GAB constants CG and K
was calculated with an Arrhenius form of equation(Sanni et al., 1997):
CG ¼ C0 exp½ðHM � HN Þ=RT (4)
K ¼ K0 exp½ðHL � HN Þ=RT (5)
where: C0 and K0 are the sub-parameters (of an entropiccharacter); HM in kJmol�1 is the sorption heat of themonolayer; HN in kJmol�1 is the sorption heat of themulti-layer; HL in kJmol�1 is the heat of vapourisationof pure water (43�53 kJmol�1 at 35 1C), R is theuniversal gas constant in kJmol�1K�1; and T is thetemperature in K.
The values of C0, K0, Xm, HM and HN weredetermined using non-linear regression analysis, withEqns (4) and (5) being substituted into the GABequation in Table 1.
Monolayer moisture contents determined using theBET equation (values for aw of up to 0�4) were used todetermine the solid surface area of the samples (Mazza& Le Maguer, 1978):
S ¼ X mNAAm=Mwat ¼ 35�3X m (6)
where: S is the solid surface area in m2 g�1[solids]; Xm isthe monolayer moisture content in % d.b.; Mwat is themolecular weight of water (18 gmol�1); NA is Avoga-dro’s number (6� 1023moleculesmol�1); and Am is thearea of a water molecule (1�06� 10�19m2).
The dependence between monolayer moisture contentand temperature was given by a linear equation(Menkov et al., 1999):
X m ¼ Ax þ Bxt (7)
e 1ntal data of crushed chillies
Model
X ¼ X mCGKaw=½ð1� KawÞð1� Kaw þ CGKawÞ
X ¼ X mCBaw=½ð1� awÞð1� aw þ CBawÞ
X ¼ ½� lnð1� awÞ=AH 1=BH
X ¼ AO½aw=ð1� awÞBO
X ¼ m1an1w þ m2an2
w
ln aw ¼ �ACX�BC expð�CCX Þ
X ¼ expða þ kawÞ
w, water activity; CG and K, GAB model parameters; CB, BET model
in model parameters; m1 and m2, Peleg model parameters; n1 and n2,
eters; a and k, Caurie model parameters.

ARTICLE IN PRESS
0
20
40
60
Equ
ilib
rium
moi
stur
e co
nten
t, %
d.b
.
N. ARSLAN; H. TOGRUL52
and the BET equation transformed into
X ¼ðAx þ BxtÞCaw
½ð1� awÞð1� aw þ CawÞ(8)
where: t is the temperature in 1C; and Ax, Bx and C arecoefficients independent of temperature.The values for Ax, Bx and C in Eqn (8) were
calculated using a non-linear regression programmewith the experimental data at awp0�4: When Eqn (8) issolved for the monolayer moisture content ðX ¼ X mÞ;the value for the water activity (aw)x at which themonolayer forms is as follows
ðawÞx ¼
ffiffiffiffiC
p� 1
C � 1(9)
The calculation of thermodynamic parameters isexplained in Appendix A.
0.0 0.2 0.4 0.6 0.8
Equilibrium relative humidity, %
Fig. 3. Effect of temperature on the desorption isotherms ofcrushed chillies (m, experimental 25 1C; J, experimental 35
1C; �, experimental 45 1C)
3. Results and discussion
3.1. Moisture sorption isotherms
The adsorption and desorption isotherms for crushedchillies at different temperatures are shown in Figs 2 and3. The sorption isotherm follows the type III isotherm(Perry et al., 1984), which adsorb small amounts ofwater at low water activities. At lower water activities,water can be adsorbed only to the surface –OH sites ofcrystalline sugar, proteins and polysaccharides (Labuza,1984). However, the water content increases sharply athigh water activity values. This is probably due to an
0
15
30
45
60
0.0 0.2 0.4 0.6 0.8Equilibrium relative humidity, %
Equ
ilibr
ium
moi
stur
e co
nten
t, %
d.b
.
Fig. 2. Effect of temperature on the adsorption isotherms ofcrushed chillies (m, experimental 25 1C; J, experimental 35 1C;
�, experimental 45 1C)
increase in the number of sorption sites. A similarbehaviour has been reported by other authors fordifferent foods (Maskan & Gogus-, 1997; Pezzutti &Crapiste, 1997; Cadden, 1988; Coupland et al., 2000;Lasekan & Lasekan, 2000; Hossain et al., 2002).According to BET theory, a type III isotherm appearswhen the binding energy of the first layer is lower thanthe binding energy between water molecules (Labuza,1984). The equilibrium moisture content increasedslowly between values for aw of 0�1 and 0�5, followedby a steep rise above 0�5. An increase in temperatureresulted in a slight decrease in equilibrium moisturecontent. The analysis of variance (ANOVA) showedthat the effect of temperature on moisture content wasinsignificant (probability p40�05). Palipane and Dris-coll (1992) suggested that at increased temperature somewater molecules are activated to energy levels that allowthem break away from their sorption sites, thusdecreasing the equilibrium moisture content.
The adsorption and desorption equilibrium moistureisotherms of crushed chillies at 45 1C are shown inFig. 4. Similar behaviour of adsorption and desorptionisotherms was observed for 25 and 35 1C. By comparingisotherms from Fig. 4, it can be noted that differentcurves are followed during adsorption and desorption.The difference between desorption and adsorption iscalled hysteresis. The effect of hysteresis on food isimportant, even though it can be relatively low inmagnitude. It can also be seen from the adsorption anddesorption isotherms that they exhibit the phenomenon

ARTICLE IN PRESS
0
15
30
45
0.0 0.2 0.4 0.6 0.8
Equilibrium relative humidity, %
Equil
ibri
um
mois
ture
conte
nt,
% d
.b.
Fig. 4. Hysteresis between the adsorption and desorptionisotherms at 45 1C (�, experimental (adsorption); J, experi-mental (desorption); ___, predicted (adsorption); - - -, predicted
(desorption))
MOISTURE SORPTION ISOTHERM 53
of hysteresis. The equilibrium moisture content fordesorption was higher than for adsorption at aparticular water activity. Crushed chillies was morehygroscopic in desorption, resulting in a hysteresiseffect. This may be attributed to process irreversibilityand those structural and physico-chemical changes thatthe material undergoes during dehydration (Pezutti &Crapiste, 1997). The differences between adsorption anddesorption data were compared using ANOVA todetermine the hysteresis effect. The analysis of variancecarried out using the least significant difference proce-dure revealed that the hysteresis effect was notsignificant (p40�05). Similar results have been reportedfor some foods (Palou et al., 1997; Menkov, 2000a,2000b; Al-Muhtaseb et al., 2004a). Hysteresis phenom-ena affected a large number of factors such astemperature, composition, time in storage, and numberof previous adsorption–desorption cycles (Benado &Rizvi, 1985).
3.2. Fitting of sorption data to various isotherm equations
Estimated constants of the equations for crushedchillies and coefficient of determination r2, P, averageresidual and eRMS are presented in Table 2. Theseconstants assist in the calculation of equilibriummoisture content values within the temperature andrelative humidity ranges used in this work. The lowerare the values of P, eave and eRMS, the better is the
goodness of fit. But, the higher are the values of r2, thebetter is the goodness of fit. The results have shown thatthe lowest values for P were obtained with the Pelegmodel and the Crapiste–Rotstein model throughout theentire range of water activity. It can be seen from Table2 that the Peleg equation and Crapiste and Rotsteinequation both fit the data equally well. This wasconcluded from various goodness of the fit statisticalcriteria and residual examination. However, the quanti-tative criteria were not consistent for both the equations.For example, the Peleg equation had higher values of r2.The Crapiste and Rotstein equation, on the other hand,had smaller values of P, eave and eRMS. Either of the twoequations could be used satisfactorily to model theexperimental data. However, it is concluded that theCrapiste and Rotstein model is the most appropriateequation for simulation of water sorption of crushedchillies throughout the entire range of water activitysince it gave lower values of P, eave and eRMS foradsorption and desorption. A model is considered betterthan another if it has a lower mean relative percentdeviation modulus. The GAB, Henderson, Oswin andCaurie models gave a poor fit over the entire range ofequilibrium moisture contents. The high values ofmonolayer moisture content from GAB model arephysically impossible. The validity of sorption modelcannot be proved just by its ability to fit theexperimental data. In addition, a physico-chemical basisis also needed (Chirife et al., 1992). As a matter of fact,the GAB model gave a poor fit to the experimental dueto high P values for adsorption and desorption.Kaleemullah and Kailappan (2004) reported that theequilibrium relative humidity of red chillies could bepredicted by using the modified Halsey and Kaleemullahmodels for adsorption process whereas modified Oswin,Kaleemullah, Oswin models can be used for desorptionprocess of red chillies. The experimental sorption dataand the sorption equilibrium moisture isotherms ofcrushed chillies constructed using the Crapiste andRotstein model at 45 1C are shown in Fig. 4.
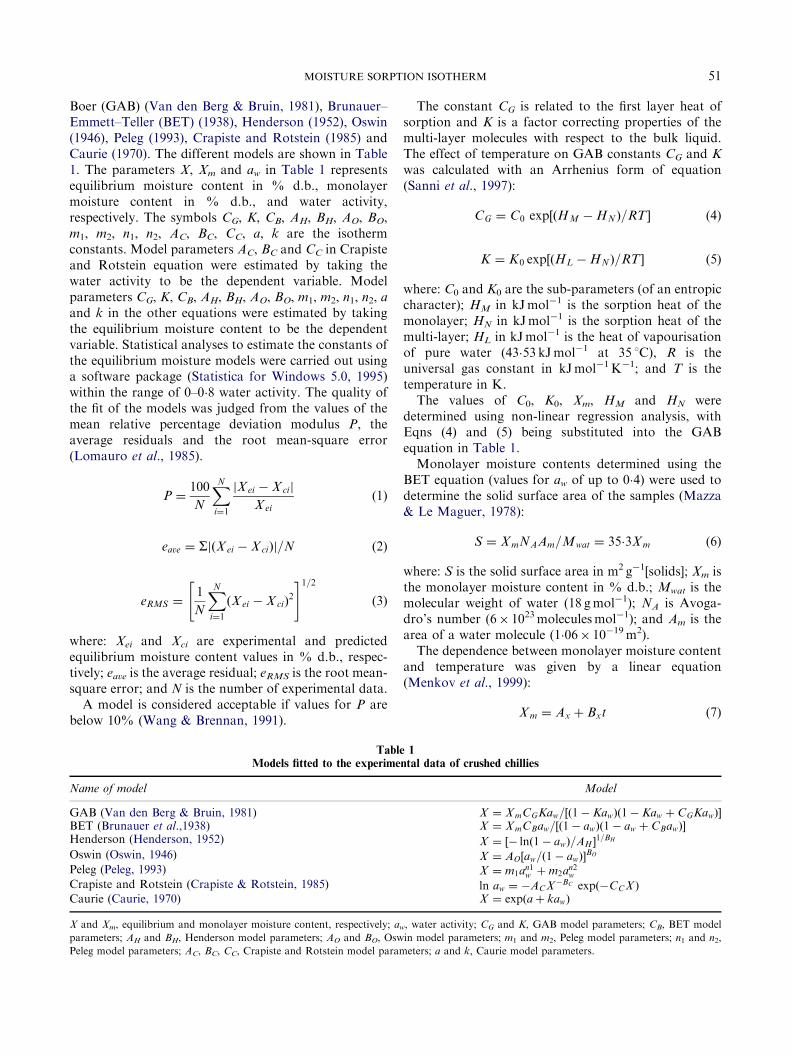
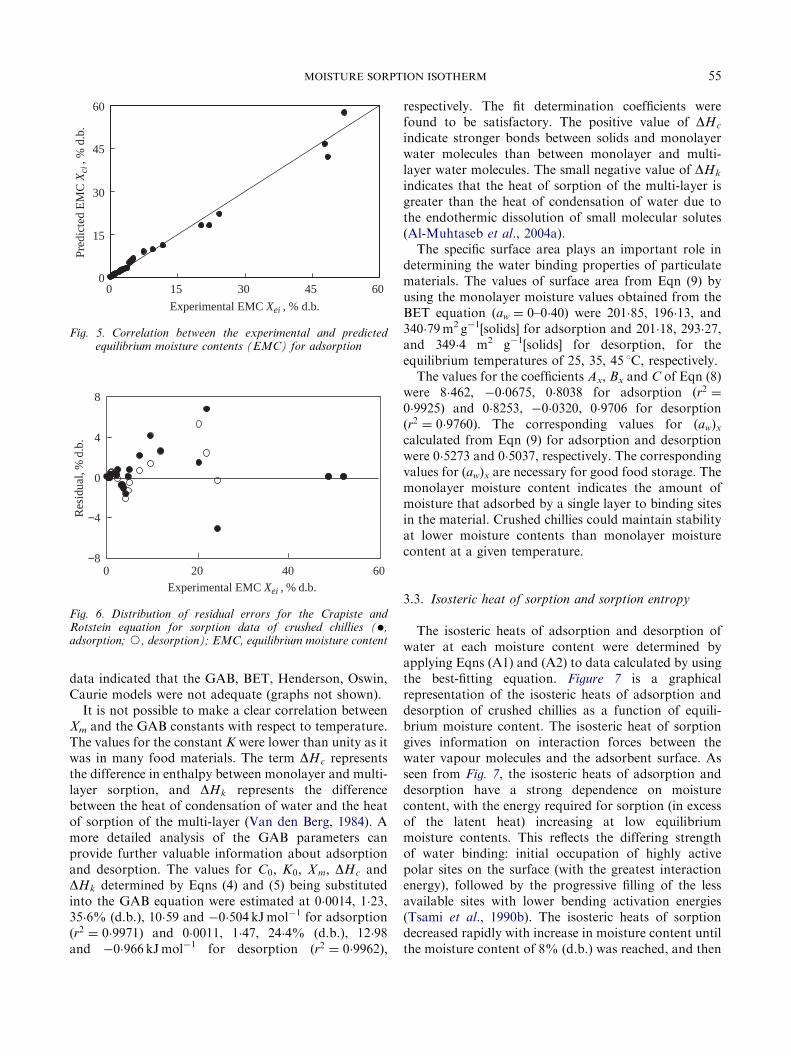
Adsorption experimental equilibrium moisture con-tent values Xei of crushed chillies were compared withthe equilibrium moisture content values Xci predicted bythe Crapiste and Rotstein model ðr2 ¼ 0�9833Þ (Fig. 5).Similar plot were obtained for desorption (r2 ¼ 0�9948;graph not shown). Figure 6 depicts the residual plotsðX ei � X ciÞ for Crapiste and Rotstein model. Theresiduals obtained by the Peleg and Crapiste–Rotsteinmodels denoted uniformly scattered points in residualplots (Table 2, graph for Peleg model not shown). Usingthe residual plot criterion, the Peleg and Crapiste–Rot-stein models were found acceptable for predicting theequilibrium moisture content of crushed chillies. Thesystematic residual pattern of adsorption and desorption

ARTICLE IN PRESS
Table 2
Fitting parameters and coefficient of determination r2, mean relative deviation modulus P, average residual eave and root mean-square
error eRMS for several models tested at different temperatures
Model Constants Adsorption Desorption
25 1C 35 1C 45 1C 25 1C 35 1C 45 1C
GAB Xm 477�2 410�5 322�6 642�3 342�8 152�5CG 0�0082 0�0079 0�0077 0�0085 0�0125 0�0209K 0�955 0�971 0�999 0�913 0�939 0�988r2 0�9983 0�9980 0�9968 0�9975 0�9983 0�9981
P, % 13�283 15�67 17�65 14�04 15�52 18�10eave 0�4562 0�5231 0�6010 0�6482 0�5298 0�5325
eRMS 0�6746 0�6812 0�8396 0�8327 0�6384 0�7027
BET* Xm 5�718 5�556 9�654 5�699 8�308 9�898CB 1�031 0�929 0�376 1�607 0�780 0�542r2 0�9953 0�9945 0�9945 0�9877 0�9962 0�9941
P, % 6�866 6�606 8�853 7�327 7�082 8�471eave 1�6666 1�5103 1�2774 2�1928 1�9986 1�7847
eRMS 2�173 1�975 1�737 2�809 2�624 2�385
Henderson AH 0�348 0�385 0�445 0�284 0�325 0�391BH 0�387 0�369 0�332 0�437 0�410 0�356r2 0�9975 0�9968 0�9958 0�9962 0�9953 0�9943
P, % 34�55 36�66 42�62 31�42 34�63 41�99eave 0�6327 0�6399 0�7357 0�8325 0�8258 1�0133
eRMS 0�8085 0�8507 0�9580 1�018 1�055 1�231
Oswin AO 6�681 5�689 4�570 8�430 7�079 5�838BO 1�486 1�552 1�699 1�334 1�408 1�593r2 0�9982 0�9978 0�9968 0�9969 0�9978 0�9974
P, % 21�10 24�83 30�25 17�71 20�76 27�27eave 0�5423 0�6073 0�6669 0�7397 0�6105 0�6270
eRMS 0�6920 0�7040 0�8416 0�9270 0�7219 0�8428
Peleg m1 7�200 203�9 5�482 171�9 192�7 217�2n1 0�961 6�916 0�923 5�829 6�848 7�324m2 198�8 6�402 237�9 7�774 10�21 9�177n2 6�520 0�930 7�598 0�820 1�057 1�052r2 0�9997 0�9997 0�9991 0�9995 0�9995 0�9996
P, % 7�639 8�167 14�69 9�022 6�468 10�07eave 1�1909 1�3303 0�7504 0�5997 0�7263 1�0802
eRMS 1�989 2�631 1�072 0�9578 1�058 0�4296
Crapiste and Rotstein AC 1�918 1�815 1�587 2�277 2�100 1�914BC 0�559 0�563 0�519 0�560 0�545 0�525CC �0�0020 �0�0024 �0�0008 0�0017 0�0029 0�0024r2 0�9956 0�9966 0�9927 0�9948 0�9962 0�9934
P, % 10�66 8�408 11�21 6�708 7�234 10�17eave 0�2171 0�2159 0�3379 0�3333 0�2412 0�2578
eRMS 0�300 0�2566 0�4527 0�3842 0�3116 0�3425
Caurie a �1�924 �2�294 �2�983 �1�240 �1�643 �2�418k 7�344 7�721 8�566 6�514 6�930 7�979r2 0�9983 0�9976 0�9965 0�9977 0�9964 0�9948
P, % 25�22 28�96 36�678 20�11 25�78 35�89eave 0�5377 0�5603 0�6570 0�6053 0�7519 0�9854
eRMS 0�6742 0�7378 0�8806 0�7785 0�9219 1�1747
Xm, monolayer moisture content; r2, coefficient of determination; P, mean relative deviation modulus; eave, average residual; eRMS, root mean
square error; CG and K, GAB model parameters; CB, BET model parameters; AH and BH, Henderson model parameters; AO and BO, Oswin
model parameters; m1, m2, n1, n2, Peleg model parameters; AC, BC, CC, Crapiste and Rotstein model parameters; a and k, Caurie model
parameters.*Sorption data fitted for water activity awp0�4.
N. ARSLAN; H. TOGRUL54
ARTICLE IN PRESS
0
15
30
45
60
0 15 30 45 60
Experimental EMC Xei , % d.b.
Pred
icte
d E
MC
Xci
, %
d.b
.
Fig. 5. Correlation between the experimental and predictedequilibrium moisture contents (EMC) for adsorption
−8
−4
0
4
8
0 20 40 60Experimental EMC Xei , % d.b.
Res
idua
l, %
d.b
.
Fig. 6. Distribution of residual errors for the Crapiste andRotstein equation for sorption data of crushed chillies (�,adsorption; J, desorption); EMC, equilibrium moisture content
MOISTURE SORPTION ISOTHERM 55
data indicated that the GAB, BET, Henderson, Oswin,Caurie models were not adequate (graphs not shown).It is not possible to make a clear correlation between
Xm and the GAB constants with respect to temperature.The values for the constant K were lower than unity as itwas in many food materials. The term DHc representsthe difference in enthalpy between monolayer and multi-layer sorption, and DHk represents the differencebetween the heat of condensation of water and the heatof sorption of the multi-layer (Van den Berg, 1984). Amore detailed analysis of the GAB parameters canprovide further valuable information about adsorptionand desorption. The values for C0; K0; X m; DHc andDHk determined by Eqns (4) and (5) being substitutedinto the GAB equation were estimated at 0�0014, 1�23,35�6% (d.b.), 10�59 and �0�504 kJmol�1 for adsorptionðr2 ¼ 0�9971Þ and 0�0011, 1�47, 24�4% (d.b.), 12�98and �0�966 kJmol�1 for desorption ðr2 ¼ 0�9962Þ;
respectively. The fit determination coefficients werefound to be satisfactory. The positive value of DHc
indicate stronger bonds between solids and monolayerwater molecules than between monolayer and multi-layer water molecules. The small negative value of DHk
indicates that the heat of sorption of the multi-layer isgreater than the heat of condensation of water due tothe endothermic dissolution of small molecular solutes(Al-Muhtaseb et al., 2004a).
The specific surface area plays an important role indetermining the water binding properties of particulatematerials. The values of surface area from Eqn (9) byusing the monolayer moisture values obtained from theBET equation (aw ¼ 0–0�40) were 201�85, 196�13, and340�79m2 g�1[solids] for adsorption and 201�18, 293�27,and 349�4 m2 g�1[solids] for desorption, for theequilibrium temperatures of 25, 35, 45 1C, respectively.
The values for the coefficients Ax, Bx and C of Eqn (8)were 8�462, �0�0675, 0�8038 for adsorption ðr2 ¼
0�9925Þ and 0�8253, �0�0320, 0�9706 for desorptionðr2 ¼ 0�9760Þ: The corresponding values for (aw)xcalculated from Eqn (9) for adsorption and desorptionwere 0�5273 and 0�5037, respectively. The correspondingvalues for (aw)x are necessary for good food storage. Themonolayer moisture content indicates the amount ofmoisture that adsorbed by a single layer to binding sitesin the material. Crushed chillies could maintain stabilityat lower moisture contents than monolayer moisturecontent at a given temperature.
3.3. Isosteric heat of sorption and sorption entropy
The isosteric heats of adsorption and desorption ofwater at each moisture content were determined byapplying Eqns (A1) and (A2) to data calculated by usingthe best-fitting equation. Figure 7 is a graphicalrepresentation of the isosteric heats of adsorption anddesorption of crushed chillies as a function of equili-brium moisture content. The isosteric heat of sorptiongives information on interaction forces between thewater vapour molecules and the adsorbent surface. Asseen from Fig. 7, the isosteric heats of adsorption anddesorption have a strong dependence on moisturecontent, with the energy required for sorption (in excessof the latent heat) increasing at low equilibriummoisture contents. This reflects the differing strengthof water binding: initial occupation of highly activepolar sites on the surface (with the greatest interactionenergy), followed by the progressive filling of the lessavailable sites with lower bending activation energies(Tsami et al., 1990b). The isosteric heats of sorptiondecreased rapidly with increase in moisture content untilthe moisture content of 8% (d.b.) was reached, and then

ARTICLE IN PRESS
40
43
46
49
52
55
0 10 20 30 40 50Moisture content, % d.b.
Isos
teri
c he
at,
kJ m
ol−1
Fig. 7. Effect of moisture content on the isosteric heats ofsorption of crushed chillies (�, adsorption; J, desorption)
−2
4
10
16
22
0 20 40
Moisture content, % d.b.
Sorp
tion
entr
opy,
J m
ol−1
K−1
Fig. 8. Variation of sorption entropy with moisture content (�,adsorption; J, desorption)
N. ARSLAN; H. TOGRUL56
they decreased smoothly with increasing moisturecontent. The higher the moisture content, the less energyis required to remove water molecules from the solid.That is, water bound in the ‘monolayer region’ is moretightly bound than water occurring in the ‘condensedwater regions’ of the isotherm. The heat of sorption ofcrushed chillies approached the latent heat of pure waterat moisture content between 30 and 49% dry basis. No amarked difference was observed between the isostericheats of adsorption and desorption at all moisturecontents. Experimental values of the isosteric heatobtained in this work follow the trend of curves foundby previous authors in other fruits (Myhara et al., 1998;Vazquez et al., 1999; Aviara & Ajibola, 2002).Knowledge of the magnitude of the heat of sorption,
at a specific moisture content, provides an indication ofthe state of the sorbed water and hence, a measure of thephysical, chemical and microbiological stability of thefood material under given storage conditions. Inaddition the variation in heat of sorption with moisturecontent, and magnitude relative to the latent heat ofvapourisation of pure water, provides valuable data forenergy consumption calculations and subsequent designof drying equipment, and an understanding of the extentof the water–solid versus water–water interactions(McMinn & Magee, 2003).At the values of equilibrium moisture contents
(invariant with temperature) corresponding to themonolayer moisture contents (35�6% d.b., for adsorp-tion; 24�4% d.b., for desorption) evaluated with Eqns(4) and (5) being substituted into the GAB equation, theisosteric heats of adsorption and desorption were about44�4 and 45�2 kJmol�1, respectively. These values wasnot close to the values for HM (54�62 kJmol�1 foradsorption and 57�48 kJmol�1 for desorption) estimatedby the Eqns (4) and (5) since the value for HL was given,
thereby confirming the poor fit of GAB model to theexperimental data.
Figure 8 shows the sorption entropy for crushedchillies as a function of moisture content. Once again thesorption entropy data displayed a strong dependence onmoisture content, especially at low moisture contents.
3.4. Enthalpy–entropy compensation theory
The plots of DHd versus DS for adsorption anddesorption showed a linear relation, with values for thecoefficient of determination r2 of 0�9920 and 0�9899,respectively; this indicates that compensation exists. Thevalues for the parameters Tb and a (Eqn (A4)) calculatedfrom the data by linear regression for adsorption anddesorption were found to be 437�4K, 44�19kJmol�1 and550�8K, 43�93kJmol�1, respectively.
Confirmation of the application of the compensationtheory was provided by the calculation of a value for theharmonic mean temperature Thm of 307�8K. For bothadsorption and desorption, the value for Tb is not equalto that for Thm:
The compensation theory was further used to modelthe temperature effect of the sorption behaviour usingEqn (A7). A plot of ln½ln aw=ð1=Tb � 1=TÞ versus X
gave a straight line (graphs not shown), which confirmsthat the dependence of ln aw=ð1=Tb � 1=TÞ on moisturecontent is an exponential law of the form reported byAguerre et al. (1986). The parameters K1 and K2
calculated using linear regression at 25, 35, 45 1C foradsorption and desorption were found to be 1099�8,1145�3, 1175�8K and 0�9003, 0�9001, 0�9043 and 608,609�5, 608�1K and 0�9687, 0�9687, 0�9702, respectively.Aguerre et al. (1986) reported values for K1 and K2 of8957K and 0�842 for the sorption characteristics ofrough rice.

ARTICLE IN PRESS
MOISTURE SORPTION ISOTHERM 57
The enthalpy–entropy compensation or the isokinetictheory could be successfully applied to water sorptionby crushed chillies and suggests that this process couldoccur by enthalpy-controlled mechanisms.
3.5. Net integral enthalpy and entropy
The values of b and b0 parameters in Eqn (A11) at 25,35 and 45 1C were found to be 1�128, 1�127, 1�100 and1�141, 0�7069, 0�2239, respectively, for adsorption(r2¼0�9935; r2¼ 0�9994; r2¼ 0�9991), and 1�126, 1�085,1�076 and 1�946, 0�6403, 0�4013, respectively, fordesorption (r2 ¼ 0�9887; r2 ¼ 0�9973; r2 ¼ 0�9971). Thespreading pressures of crushed chillies at different wateractivities and temperatures are given in Table 3. Thespreading pressure decreased with increase in tempera-ture and increased with increase in water activity moresignificantly in the high range of water activity. Thesetrends with respect to temperature and water activity arecomparable to those determined by Fasina et al. (1999)for winged bean and gari, Aviara and Ajibola (2002) formelon seed and cassava, Al-Muhtaseb et al. (2004b) forstarch powders, and McMinn and Magee (2003) forpotato.The variation in net integral enthalpy with the
moisture content for crushed chillies is shown in Fig. 9.The graphs clearly show that, for both adsorption anddesorption, the net integral enthalpy decreases withincreasing moisture content. Similar trends have been
Table 3Spreading pressures of crushed chillies at different water
activities and temperatures
Water activity, aw Spreading pressure, J m�2
25 1C 35 1C 45 1C
Adsorption 0�1 0�0047 0�0031 0�00100�2 0�0100 0�0067 0�00230�3 0�0162 0�0112 0�00400�4 0�0235 0�0167 0�00610�5 0�0325 0�0238 0�00920�6 0�0441 0�0336 0�01380�7 0�0608 0�0485 0�02150�8 0�0906 0�0767 0�0378
Desorption 0�1 0�0077 0�0028 0�00180�2 0�0158 0�0061 0�00400�3 0�0245 0�0101 0�00680�4 0�0342 0�0150 0�01030�5 0�0455 0�0213 0�01490�6 0�0592 0�0298 0�02150�7 0�0778 0�0422 0�03150�8 0�1092 0�0636 0�0496
observed in the enthalpies of sesame seed (Aviara et al.,2002), of cowpea (Ajibola et al., 2003), and of soya bean(Aviara et al., 2004). This thermodynamic behaviourcan be attributed to the monolayer covering of thematerials (Fasina et al., 1999). At low moisture contents,water is adsorbed on the most accessible locations onthe exterior surface of the solid. The net integralenthalpy then starts to decline as less favourablelocations are covered and multiple layers of sorbedwater form. While the integral enthalpy of adsorptiondiffers considerably from the integral enthalpy ofdesorption in magnitude, the integral enthalpies ofadsorption and desorption are qualitatively similar withregard to their functionality with moisture content. Thenet integral enthalpy values for desorption were greaterthan those for adsorption at a specific moisture contentvalue.
The variation in net integral entropy with moisturecontent for crushed chillies is shown in Fig. 10. The netintegral entropy of adsorption and desorption wasnegative in magnitude, being low at low moisturecontent, and increased rapidly as water covers thesurface and forms further layers. Iglesias et al. (1976)attributed the negative entropy values to the existence ofchemical adsorption and/or structural modifications ofthe adsorbent. The form of the net integral entropyversus moisture content curve is similar to that observedfor grain sorghum (Rizvi & Benado, 1983), rice (Benado& Rizvi, 1985), and melon seed (Aviara & Ajibola,2002). The net integral entropy of adsorption is ofhigher magnitude than the net integral entropy ofdesorption. Rizvi and Benado (1983) attributed thisthe entrapment of water in microcapillaries and matrixcollapse during desorption.
50
60
70
80
90
100
0 5 10 15 20 25 30
Moisture content, % d.b.
Net
inte
gral
ent
halp
y, k
J m
ol−1
Fig. 9. Variation of the net integral enthalpy of adsorption anddesorption with moisture content (�, adsorption; J, desorption)

ARTICLE IN PRESS
−330
−300
−270
−240
−210
0 5 10 15 20 25 30
Moisture content,% d.b.
Net
inte
gral
ent
ropy
, J m
ol−1
K−1
Fig. 10. Changes in the net integral entropy as a function ofmoisture content (�, adsorption; J, desorption)
N. ARSLAN; H. TOGRUL58
4. Conclusions
Crushed chillies presents Type III isotherms. Watersorption isotherms of crushed chillies were slightlydependent on temperature. Hysteresis was evident overthe entire range of water activity. The experimental datafit well with the sorption models of Peleg andCrapiste–Rotstein equations. The sorption data werealso expressed by the Brunauer–Emmett–Teller (BET)equation in the range of water activity 0–0�4. The BETequation was solved for the monolayer moisture contentand the corresponding values for water activity at whichmonolayer forms were presented. The Clausius–Clapeyron equation facilitates satisfactory determina-tion of the isosteric heats of sorption, which were foundto increase with decreasing moisture content. Deso-rption values were similar with adsorption values. Theenthalpy–entropy compensation could be successfullyapplied to water sorption by crushed chillies andsuggests that this process could occur by enthalpy-controlled mechanisms.Spreading pressure increased with increasing water
activity, and decreased with increasing temperature. Thenet integral enthalpy decreased with increasing moisturecontent. The net integral enthalpy values for desorptionwere greater than those for adsorption at a specificmoisture content value. The net integral entropyincreased continually with moisture content, but isnegative in value with respect to the entropy of pureliquid water.
Acknowledgements
This study was supported by Scientific ResearchDepartment of Fırat University (project no. FUBAP-793).
Appendix A:. Calculation of thermodynamic parameters
A.1. Isosteric heat of sorption and sorption entropy
The net isosteric heat is defined as the isosteric heat ofsorption minus the latent heat of vapourisation of purewater (Tsami et al., 1990b). The isosteric heats ofsorption were determined by applying the Clausius–Cla-peyron equation to data from the best-fitting equation(Lasekan & Lasekan, 2000):
Dhd ¼ �R@ðln awÞ
@ð1=TÞ
� �x
(A1)
DHd ¼ Dhd þ HL (A2)
where: Dhd is the net isosteric heat of sorption inkJmol�1; and DHd is the isosteric heat of sorption inkJmol�1.
Re-plotting the experimental sorption isotherm in theform of the natural logarithms of the water activity fromthe best-fitting equation versus 1/T, for a specificmoisture content, Dhd was determined from the slopeð�Dhd=RÞ: Mathcad 7 Professional was used for thecalculation by the Newton–Raphson method of aw
values corresponding to a given moisture content. Thisprocedure is based on the assumption that Dhd isinvariant with temperature and requires measurement ofthe sorption isotherms at more than two temperatures(Tsami, 1991). The latent heat of vapourisation of purewater (43�53 kJmol�1) at 35 1C, the average temperaturewithin the investigate range 25–45 1C, was added to Dhd
values to obtain DHd values.The differential entropy DS in Jmol�1K�1 of
adsorption and desorption of water at each moisturecontent was obtained by fitting Eqn (A3) to equilibriumdata from the best-fitting equation (Aguerre et al.,1986):
� ln aw ¼ DHd=ðRTÞ � ðDS=RÞ (A3)
The differential entropy or sorption entropy for agiven moisture content was determined from theintercept ðDS=RÞ by plotting ln aw versus 1/T.
A.2. Enthalpy–entropy compensation theory
Compensation theory proposes a linear relationshipbetween the isosteric heat of sorption and sorptionentropy. The values of the isosteric heat and thesorption entropy for each set of sorption data can becorrelated according to the following equation(McMinn & Magee, 2003):
DHd ¼ TbDS þ a (A4)
ARTICLE IN PRESS
MOISTURE SORPTION ISOTHERM 59
The isokinetic temperature Tb in K and constant awere calculated using linear regression. The isokinetictemperature has an important physical meaning as itrepresents the temperature at which all reactions in theseries proceed at the same rate. Since there is a highdegree of linear correlation between enthalpy andentropy, the compensation theory is assumed to bevalid for sorption (Madamha et al., 1996). Thecompensation theory is only applied if the isokinetictemperature Tb and the harmonic mean temperatureThm in K are different, where
Thm ¼ N
,XN
1
1=T (A5)
If Tb4Thm the process is enthalpy driven; while if theopposite condition is observed TboThm; the process isconsidered to be entropy-controlled (Leffer & Grun-wald, 1963). After parameter a in Eqn (A4) wasneglected due to the negligible contribution to theenthalpy change, the compensation theory was used toevaluate the influence of temperature on the sorptionbehaviour by applying the following equation obtainedwith DS in Eqn (A4) being substituted into Eqn (A3)(Aguerre et al., 1986):
� ln aw ¼ DHd=Rð1=T � 1=TbÞ (A6)
Several equations have been proposed to correlateequilibrium moisture content, temperature and wateractivity (Tolaba et al., 2003). Based on the enthalpy–en-tropy compensation effect of water sorption in foods,Aguerre et al. (1986) derived a three-parameter equationthat represents the water sorption equilibrium of food-stuffs in the entire range of moisture content andadequately describes the temperature dependence. Anexponential function between water activity and moist-ure content was given by Aguerre et al. (1986). Equation(A6) was re-expressed in the form
ln aw=ð1=Tb � 1=TÞ ¼ K1KX2 (A7)
where: K1 and K2 are constants; and X is theequilibrium moisture content in % d.b.The logarithmic function ln½ln aw=ð1=Tb � 1=TÞ ver-
sus X was plotted to obtain the values for the constantsK1 and K2:
A.3. Spreading pressure
The spreading pressure f in Jm�2 represents thesurface excess free energy, and provides an indication ofthe increase in surface tension of bare sorption sites dueto sorbed molecules (Fasina et al., 1999). Spreading
pressure can be estimated using an analytical proceduredescribed by Fasina et al. (1999) from the relationship
f ¼KBT
Am
Z aw
0
yaw
@aw (A8)
where the moisture ratio y is given by
y ¼ X=X m (A9)
and where KB is Boltzmann’s constant (1�38�10�23 JK�1).
The value of spreading pressure was noted to beindeterminate at a water activity of 0. Therefore, theDent model (Dent, 1977) assuming an empiricalrelationship between water activity and moisture con-tent was used
aw
X¼
1
b0X m
þb0 � 2b
b0X m
aw �bðb0 � bÞ
b0X m
a2w (A10)
where b and b0 are the constants from Dent sorptionisotherm related to the properties of the adsorbed water(dimensionless).
Non-linear regression analysis was adopted to deter-mine the parameters b and b0. The monolayer moisturecontent obtained by applying BET equation to theexperimental data on equilibrium moisture relationshipswas used in Eqn (A10).
The spreading pressure of adsorbed water in terms ofthe surface area per sorption site or area per onemolecule of water on each sorption site were deter-mined, with Eqn (A10) being substituted into Eqn (A8)and integration.
f ¼KBT
Am
ln1þ b0aw � baw
1� baw
� �(A11)
By using values for b and b0 at different temperaturesfor adsorption and desorption, the values of spreadingpressure were determined from the above equation.
A.4. Net integral enthalpy and entropy
The net integral enthalpy heq in kJmol�1 or netequilibrium heat of sorption is an integral molarquantity and is calculated in a similar manner to thedifferential heat of sorption (isosteric heat of sorption)but at constant spreading pressure instead of constantmoisture content (Benado & Rizvi, 1985).
heq ¼ �R@ðln awÞ
@ð1=TÞ
� �f
(A12)
The net integral enthalpy of adsorption and deso-rption at each spreading pressure was obtained by fittingEqn (A12) to the equilibrium data from the best-fittingequation and then replotting the sorption isotherm in

ARTICLE IN PRESS
N. ARSLAN; H. TOGRUL60
the form ln(aw) versus 1/T for a specific spreadingpressure, heq was determined from the slope (�heq/R).Net integral entropy DSeq in Jmol�1K�1 describes the
degree of disorder, randomness of motion and otherstatistical approach related to water sorption by foods(Mazza & Le Maguer, 1978). For a thermodynamicsystem, the net integral entropy is given by Benado andRizvi (1985):
DSeq ¼ �heq=T � R lnðawÞ (A13)
where ðawÞ is the geometric mean water activity
obtained at constant spreading pressure at differenttemperatures.
References
Aguerre R J; Suarez C; Viollaz P E (1986). Enthalpy–entropycompensation in sorption phenomena: application to theprediction of the effect of temperature on food isotherms.Journal of Food Science, 51, 1547–1549
Ajibola O O; Aviara N A; Ajetumobi O E (2003). Sorptionequilibrium and thermodynamic properties of cowpea(Vigna unguiculata). Journal of Food Engineering, 58,317–324
Al-Muhtaseb A H; McMinn W A M; Magee T R A (2004a).Water sorption isotherms of starch powders, part 1:mathematical description of experimental data. Journal ofFood Engineering, 61(3), 297–307
Al-Muhtaseb A H; McMinn W A M; Magee T R A (2004b).Water sorption isotherms of starch powders, part 2:thermodynamic characteristics. Journal of Food Engineer-ing, 62(2), 135–142
AOAC (1980). Official Methods of Analysis. Association ofOfficial Analytical Chemists Inc., Washington, DC
Aviara N A; Ajibola O O (2002). Thermodynamics of moisturesorption in melon seed and cassava. Journal of FoodEngineering, 55(2), 107–113
Aviara N A; Ajibola O O; Dairo U O (2002). Thermodynamicsof moisture sorption in sesame seed. Biosystems Engineer-ing, 83(4), 423–431
Aviara N A; Ajibola O O; Oni S A (2004). Sorption equilibriumand thermodynamic characteristics of soya bean. BiosystemsEngineering, 87(2), 179–190
Belarbi A; Aymard C H; Meot J M; Themelin A; Reynes M
(2000). Water desorption isotherms for eleven varieties ofdates. Journal of Food Engineering, 43(2), 103–107
Benado A L; Rizvi S S H (1985). Thermodynamic properties ofwater in rice as calculated from reversible and irreversibleisotherms. Journal of Food Science, 50, 101–105
Boquet R; Chirife J; Iglesias H A (1978). Equations for fittingwater sorption isotherms of foods. II. Evaluation of varioustwo-parameter models. Journal of Food Technology, 13,
319–327Brunauer S; Emmett P H; Teller E (1938). Adsorption of gasesin multimolecular layers. Journal of the American ChemicalSociety, 60, 309
Cadden A M (1988). Moisture sorption characteristics ofseveral food fibers. Journal of Food Science, 53(4),1150–1155
Caurie M (1970). A new model equation for predicting safestorage moisture levels for optimum stability of dehydratedfoods. Journal of Food Technology, 5, 301–307
Chen C (2002). Sorption isotherms of sweet potato slices.Biosystems Engineering, 83(1), 85–95
Chirife J; Timmermann E O; Iglesias H A; Boquet R (1992).Some features of the parameter k of the GAB equation asapplied to sorption isotherms of selected food materials.Journal of Food Engineering, 15, 75–82
Coupland J N; Shaw N B; Monahan F J; O’Riordan E D;O’Sullivan M (2000). Modeling the effect of glycerol on themoisture sorption behaviour of whey protein edible films.Journal of Food Engineering, 43(1), 25–30
Crapiste G H; Rotstein E (1985). Sorptional equilibrium atchanging temperatures. In: Drying of Solids. RecentInternational Developments (Mujumdar A S, ed), pp41–45. John Wiley, New York
Dent R W (1977). A multi-layer theory for gas sorption, part 1:sorption of a single gas. Textile Research Journal, 47,145–152
Diosady L L; Rizvi S S H; Cai W; Jagdeo D J (1996). Moisturesorption isotherms of canola meals, and applications topackaging. Journal of Food Science, 61, 204–208
Fasina O O; Ajibola O O; Tyler R T (1999). Thermodynamicsof moisture sorption in winged bean seed and gari. Journalof Food Process Engineering, 22(6), 405–418
Fasina O; Sokhansanj S; Tyler R (1997). Thermodynamics ofmoisture sorption in alfalfa pellets. Drying Technology, 15,1553–1570
Henderson S M (1952). A basic concept of equilibriummoisture. Agricultural Engineering, 33, 29–32
Hentges D L; Weaver C M; Nielsen S S (1991). Changes ofselected physical and chemical components in developmentof the hard-to-cook bean defect. Journal of Food Science,56, 436–442
Hossain S A; Pal P K; Sarkar P K; Patil G R (2002). Moisturesorption characteristics of dudh churpi, a traditional milkproduct in India. Nahrung/Food, 46(3), 136–140
Iglesias H A; Chirife J; Viollaz P (1976). Thermodynamics ofwater vapour sorption by sugar beet root. Journal of FoodTechnology, 11, 91–101
Kaleemullah S; Kailappan R (2004). Moisture sorptionisotherms of red chillies. Biosystems Engineering, 88(1),95–104
Labuza T P (1984). Moisture Sorption: Practical Aspects ofIsotherm Measurement and Use. American Association ofCereal Chemists, St Paul, MN
Labuza T P; Kaanane A; Chen J Y (1985). Effect oftemperature on the moisture sorption isotherms and wateractivity shift of two dehydrated foods. Journal of FoodScience, 50, 385–391
Lahsasni S; Kouhila M; Mahrouz M; Kechaou N (2002).Experimental study and modelling of adsorption anddesorption isotherms of prickly pear peel (Opuntia ficusindica). Journal of Food Engineering, 55(3), 201–207
Lasekan O O; Lasekan WO (2000). Moisture sorption and thedegree of starch polymer degradation on flours of poppedand malted sorghum (Sorghum bicolor). Journal of CerealScience, 31(1), 55–61
Leffer J E; Grunwald E (1963). Rates and Equilibria ofOrganic Reactions. Wiley, New York
Lomauro C J; Bakshi A S; Labuza T P (1985). Evaluation offood moisture sorption isotherm equations, part I: fruit,

ARTICLE IN PRESS
MOISTURE SORPTION ISOTHERM 61
vegetable and meat products. Lebensmittel-Wissenschaftund Technologie, 18, 111–117
Madamha P S; Driscoll R H; Buckle K A (1996). Enthalpy–en-tropy compensation models for sorption and browning ofgarlic. Journal of Food Engineering, 28, 109–119
Maskan M; Gogus- F (1997). The fitting of various models towater sorption isotherms of pistachio nut paste. Journal ofFood Engineering, 33(3–4), 227–237
Mazza G; Le Maguer M (1978). Water sorption properties ofyellow globe onion (Allium cepa L.). Canadian Institute ofFood Science and Technology Journal, 11(4), 189–193
McMinn W A M; Magee T R A (2003). Thermodynamicproperties of moisture sorption of potato. Journal of FoodEngineering, 60(2), 157–165
Menkov N D (2000a). Moisture sorption isotherms of chickpeaseeds at several temperatures. Journal of Food Engineering,45(4), 189–194
Menkov N D (2000b). Moisture sorption isotherms of broadbean seeds at different temperatures. Nahrung/Food, 44(6),443–446
Menkov N D; Paskalev HM; Galyazkov D I; Kerezieva-Rakova
M (1999). Applying the linear equation of correlation ofBranauer–Emmet–Teller (BET)-monolayer moisture con-tent with temperature. Nahrung/Food, 43, 118–121
Myhara R M; Taylor M S; Slominski B A; Al-Bulushi I (1998).Moisture sorption isotherms and chemical composition ofOmani dates. Journal of Food Engineering, 37(4), 471–479
Oswin C R (1946). The kinetics of package life III. Theisotherm. Journal of Chemical Industry, 65, 419–421
Palipane K B; Driscoll R H (1992). Moisture sorptioncharacteristics of inshell macadamia nuts. Journal of FoodEngineering, 18(1), 63–76
Palou E; Lopez-Malo A; Argaiz A (1997). Effect of tempera-ture on the moisture sorption isotherms of some cookies andcorn snacks. Journal of Food Engineering, 31(1), 85–93
Peleg M (1993). Assessment of a semi-empirical fourparameter general model for sigmoid moisture sorptionisotherms. Journal of Food Process Engineering, 16, 21–37
Perry R H; Green D W; Maloney J O (1984). Perry’s ChemicalEngineers’ Handbook, Sec. 16-12. McGraw-Hill, New York
Pezzutti A; Crapiste G H (1997). Sorptional equilibrium anddrying characteristics of garlic. Journal of Food Engineer-ing, 31, 113–123
Rizvi S S H (1986). Thermodynamics properties of foodsin dehydration. In: Engineering Properties of Foods
(Rao M A; Rizvi S S H, eds), pp 133–214. Marcel DekkerInc., New York
Rizvi R R H; Benado A L (1983). Thermodynamic analysis ofdrying foods. Food Technology, 2, 471–502
Roberts E H (1972). Storage environment and the control ofviability. In: Viability of Seeds (Roberts E H, ed), pp 14–58.Chapman & Hall, London
Sanni L O; Atere A; Kuye A (1997). Moisture sorptionisotherms of fufu and tapioca at different temperatures.Journal of Food Engineering, 34(2), 203–212
Statistica for Windows 5.0 (1995). Computer Program Manual.StatSoft Inc., Tulsa
Timmermann E O; Chirife J; Iglesias H A (2001). Watersorption isotherms of foods and foodstuffs: BET and GABparameters. Journal of Food Engineering, 48(1), 19–31
Tolaba M P; Peltzer M; Enriquez N; Pollio M L (2003). Grainsorption equilibria of quinoa grains. Journal of FoodEngineering, 61, 365–371
Tsami E (1991). Net isosteric heat of sorption in dried fruits.Journal of Food Engineering, 14, 327–335
Tsami E; Marinos-Kouris D; Maroulis Z B (1990a). Watersorption isotherms of raisins, currants, figs, prunes andapricots. Journal of Food Science, 55, 1594–1597
Tsami E; Maroulis Z B; Marinos-Kouris D; Saravacos G D
(1990b). Heat of sorption of water in dried fruits. Interna-tional Journal of Food Science and Technology, 25, 350–359
Van den Berg C; Bruin S (1981). Water activity and itsestimation in food systems: theoretical aspects. In: WaterActivity: Influences on Food Quality (Rockland L B;Stewart G F, eds), pp 1–61. Academic Press, New York
Van den Berg C (1984). Description of water activity of foodsfor engineering purposes by means of the GAB model ofsorption. In: Engineering and Food (McKenna B M, ed), pp311–321. Elsevier Applied Science, New York
Vazquez G; Chenlo F; Moreira R; Carballo L (1999).Desorption isotherms of muscatel and aledo grapes, andthe influence of pretreatments on muscatel isotherms.Journal of Food Engineering, 39(4), 409–414
Wang N; Brennan J G (1991). Moisture sorption isothermcharacteristics of potatoes at four temperatures. Journal ofFood Engineering, 14, 269–282
Wolf M; Speiss W E L; Jung G (1985). Standardization ofisotherm measurements. In: Properties of Water in Foods(Simatos D; Multon J L, eds), p 661. Martinus Nijhoff,Dordrecht