mohammed ali, mustafa arafa, and mohamed elaraby · abstract—the aim of this work is to exploit...
TRANSCRIPT

Abstract—The aim of this work is to exploit flow-induced
vibration for energy harvesting. A cantilever beam carrying a
tip mass in the form of a lightweight box having a square,
triangular, or semicircular cross-section is designed to undergo
galloping oscillations when subjected to an incoming wind
stream. Electrical power is extracted from the self-excited
flexural vibration of the beam through an electromagnetic
generator consisting of a permanent magnet that is attached to
the beam oscillating past a stationary coil. A theoretical model
is developed to predict the system dynamics in terms of its
design parameters. Emphasis is placed on developing finite
element models to assess the lift and drag coefficients, together
with their variation with the angle of attack, which are known
to affect the aero-elastic behavior significantly. The resulting
predictions of the lift and drag forces are then implemented in
an electro-aeroelastic model to predict the output voltage and
power. The results are supported by experimental
measurements over a range of load resistance.
Index Terms—Energy harvesting, galloping
I. INTRODUCTION
HE worldwide quest to exploit renewable energy
sources has recently prompted significant research in the
field of energy harvesting wherein clean useful energy is
generated by novel means from existing ambient sources that
are otherwise neglected. A number of ambient energy
sources have been recognized to be promising for energy
harvesting, including waste heat, mechanical vibration,
wind, solar energy, rainfall, human movement, seismic
forces, traffic, and sea waves. While most of these sources
can be exploited for energy harvesting, mechanical vibration
seems particularly appealing due to the convenience of
directly converting mechanical energy into electrical energy
through various well-established piezoelectric [1],
electromagnetic [2] and electrostatic [3] transducers. A
review of the pertinent literature reveals that most of the
reported studies are based on the fact that mechanical
vibration is readily available as a source of energy at our
disposal. Emphasis in many studies was placed upon
converting mechanical energy, typically provided by a
dynamic shaker in a laboratory, into electrical energy. While
these shaker tests provide useful tools to assess the
performance of the developed devices at favorable drive
Manuscript received March 16, 2013; revised April 6, 2013.
Mohammed Ali is with the Production Engineering and Printing
Technology Department, Akhbar Elyom Academy, Egypt (e-mail:
Mustafa Arafa is with the Mechanical Engineering Department of the
American University in Cairo, Egypt (phone: +2 02 2615 3082; e-mail:
Mohamed Elaraby is with the Department of Mechanical Design and
Production, Faculty of Engineering, Cairo University, Egypt.
conditions, further efforts are needed to expand the range of
possibilities wherein mechanical vibration can be induced
from clean and renewable sources for improved energy
extraction in broader applications. An ideal candidate in this
capacity is wind.
Wind power can be harvested in several forms. For many
years, the generation of useful electric power from wind on
the large scale has been centered predominantly on the use
of rotating machinery, primarily wind turbines. While wind
farms are known to be an effective means to generate power,
their use is faced with several challenges, including
prohibitive costs of infrastructure, including land, civil work,
electrical work, transmission lines and approach roads. In
addition, as the size of the turbine shrinks, concerns over
efficiency, cost and reliability make room for novel designs
for more efficient performance. In particular, small-scale
devices that contain few mechanical parts have a greater
potential owing to their reduced mechanical losses. One
promising solution is to convert the fluid flow into a sort of
mechanical vibration from which electric power can be
extracted. The key aspect in this work, therefore, lies in
converting fluid flow into some type of flow-induced
vibration, which in turn can be converted into useful power.
Various alternative energy solutions based on wind
harvesting have been proposed in the past few years. In an
early study, Pike [4] proposed the use of the Magnus effect
for a wind generator. Another endeavor has been reported by
Jones et al. [5] who investigated power extraction from an
oscillating wing power generator based on the phenomenon
of flutter. The concept of flutter was also developed by
Frayne [6], who proposed an energy harvesting device that
relies on a fluttering membrane fitted with a pair of magnets
that oscillate between metal coils. More recently, Wang et
al. [7] presented an electromagnetic energy harvester that
exploits vortex shedding from bluff bodies placed in a
flowing water stream. Reference is also made to the works of
Jung and Lee [8] on utilizing wake galloping and Bibo et al.
[9] who devised a micro wind power generator that mimics
the oscillations of the reeds of music-playing harmonica.
This work addresses the concept of generating mechanical
vibration from wind through the phenomenon of galloping,
and exploiting the ensuing motion to harvest useful energy.
The device being investigated for this purpose consists of a
lightweight box that is mounted at the tip of a flexible
cantilever beam facing an incoming wind stream. Wind-
induced vibration causes the box to gallop in the transverse
direction, leading to self-excited bending vibrations in the
beam. Energy is harvested using electromagnetic energy
transduction where a beam-mounted magnet moves past a
stationary coil. While the concept has been recently
investigated [10-13], emphasis in this work is placed on
assessing the lift and drag coefficients numerically, and
Harvesting Energy from Galloping Oscillations
Mohammed Ali, Mustafa Arafa, and Mohamed Elaraby
T
Proceedings of the World Congress on Engineering 2013 Vol III, WCE 2013, July 3 - 5, 2013, London, U.K.
ISBN: 978-988-19252-9-9 ISSN: 2078-0958 (Print); ISSN: 2078-0966 (Online)
WCE 2013

applying the resulting forces, together with their variation
with the angle of attack, on a finite element model of the
system in order to predict the dynamic behavior.
The remainder of this paper is organized into eight
sections. Sections II-IV present the design of the proposed
energy harvester, together with the electromechanical
modeling of the system, which comprises determination of
the wind loads and formulation of a dynamic model to
predict the output voltage as a function of the design
parameters. Sections V-VII present the experimental
verification of the proposed design, and section VIII is
dedicated to conclusions and recommendations.
II. DESIGN AND MODELING OF ENERGY HARVESTER
For many years, galloping has been known as an
undesirable effect in transmission lines due to ice accretions
in cold climates. Such ice formations can alter the original
circular cross-section of the cables, leading to galloping
oscillations in the vertical plane when the wind acts normal
to the cable span. Pioneering contributions to the galloping
problem are due to Den Hartog [14] who described an
elementary apparatus for demonstrating galloping, which
consists of a lightweight rod having a semicircular cross-
section, suspended by springs in the vertical plane and
subjected to cross wind. The susceptibility of structures to
exhibit galloping depends on a number of variables
including the variation of the lift and drag coefficients with
the angle of attack. Various sections have been investigated
in the literature, including rectangular [15], triangular [16],
elliptical [17] and semicircular [11] sections. While
galloping has been regarded as an undesirable effect in many
structural applications, this phenomenon may well be
exploited in energy harvesting applications.
Figure 1 shows a schematic illustration of the various
designs being studied in this work. A lightweight solid
cylindrical tip mass having a square, triangular, or
semicircular cross-section is mounted at the tip of a flexible
cantilever beam facing an incoming wind flow. Wind-
induced vibration causes the box to gallop in the transverse
direction, leading to self-excited bending vibrations in the
beam. Energy is harvested due to the motion of the magnet
past a stationary coil, whose terminals are connected across
a load resistance.
Fig 1 Schematic illustration of proposed energy harvesters.
III. ESTIMATION OF AIR LOADS
Figure 2 shows a square section undergoing both
transverse and angular displacements denoted by w and ,
respectively. The structure is exposed to an air flow with a
constant mean speed U.
Fig 2 Air loads acting on square section.
The generated lift (L) and drag (D) forces are given by
[18] as:
21
2 rel LL U bC
(1)
and
21
2 rel DD U bC
(2)
where is the air density, b is the product of the section
width by the out-of-plane width, Urel is the velocity of air
relative to the section, and CL and CD are the lift and drag
coefficients, respectively, evaluated at the effective angle of
attack (-) which depends on both the section rotation, ,
and transverse velocity, w . From geometry, we note:
cosrelU U (3)
Resolving the lift and drag forces along the transverse
direction gives:
sin cosAF D L (4)
which can be written as:
2 212
sec sin cosA D LF U b C C
(5)
or:
21
2A AF U bC (6)
where
2sec sin cosA D LC C C
(7)
and:
1tan
w
U
(8)
The lift and drag coefficients in Eqs. (1) and (2) are highly
dependent on the section geometry, as well as the flow
characteristics, mainly Reynolds number. Different studies
have been reported in the literature to investigate the
variation of the lift and drag coefficients with the angle of
attack for rectangular sections. However, these studies are
only available for limited angles of attack [19,20] or lower
Reynolds numbers than the ones addressed in this work
[21,22]. One way to alleviate these obstacles is to use
polynomial estimates of the aerodynamic forces [23], but
these are limited to Reynolds numbers below 200. To
Proceedings of the World Congress on Engineering 2013 Vol III, WCE 2013, July 3 - 5, 2013, London, U.K.
ISBN: 978-988-19252-9-9 ISSN: 2078-0958 (Print); ISSN: 2078-0966 (Online)
WCE 2013
overcome this limitation, a finite element model will be
established in this work to evaluate the lift and drag forces.
The methodology will first be verified through comparisons
with previous studies with similar flow conditions. The
analysis will then be employed to model the present
harvester.
A Computational Fluid Dynamic (CFD) model was first
conducted to determine the resultant aerodynamic forces
acting on a stationary bluff object subjected to an incoming
wind stream. This model can be regarded as a
“computational wind-tunnel test” on a square section to
evaluate the lift and drag coefficients at various angles of
attack. A two-dimensional model was developed on the
multiphysics finite element analysis software COMSOL to
solve the one-way fluid-structure interaction problem
between a stationary rigid object (solid domain), tilted at
various angles and placed within a flowing wind stream
(fluid domain). The loads imparted by the fluid on the fixed
object was determined by integrating the reaction forces on
the mutual interaction surfaces along the direction parallel to
the fluid flow (drag force) and the one perpendicular to it
(lift force). The lift (CL) and drag (CD) coefficients are then
obtained from:
2 2
2 2,L D
L DC C
U b U b (9)
A rectangular air domain, measuring 16.67 × 6.17 m, was
discretized using free triangular mesh. A solid steel square
section having a side of length 50 mm was inserted in the
fluid flow at various angles of attack. Corners of the square
section were rounded with a fillet radius of 0.7 mm. The
width of the chosen wind tunnel was chosen sufficiently
large compared to the obstacle size to avoid interactions
with the tunnel walls. The number of elements in the model
was systematically increased, reaching nearly 20,000
elements, until converged results were obtained. The wind
velocity profile is assumed to be uniform, the turbulent
intensity is taken as 5%, and the turbulence length scale is
set to 0.014 m. The wind velocity of the stream at the inlet
edge of the chamber is taken as 30 m/s, which yields a
Reynolds number (based on the model characteristic length)
of Re = 105 at zero angle of attack for the square section.
This value enables comparisons with the experimental work
of Alonso et al. [22]. The top and bottom edges are modeled
as fixed walls, whereas zero pressure was imposed at the
outlet boundary.
This model is solved in two steps. First, a turbulent flow
analysis is conducted to investigate the interaction between
the test section and the fluid flow. This enables calculating
the wall shear stresses due to viscous effects, and normal
stresses due to fluid pressure. Subsequently, a solid
mechanics model is implemented, wherein the output
stresses produced from the previous step are applied on the
solid domain to obtain the resultants of the reaction forces in
the direction of the stream velocity and the direction normal
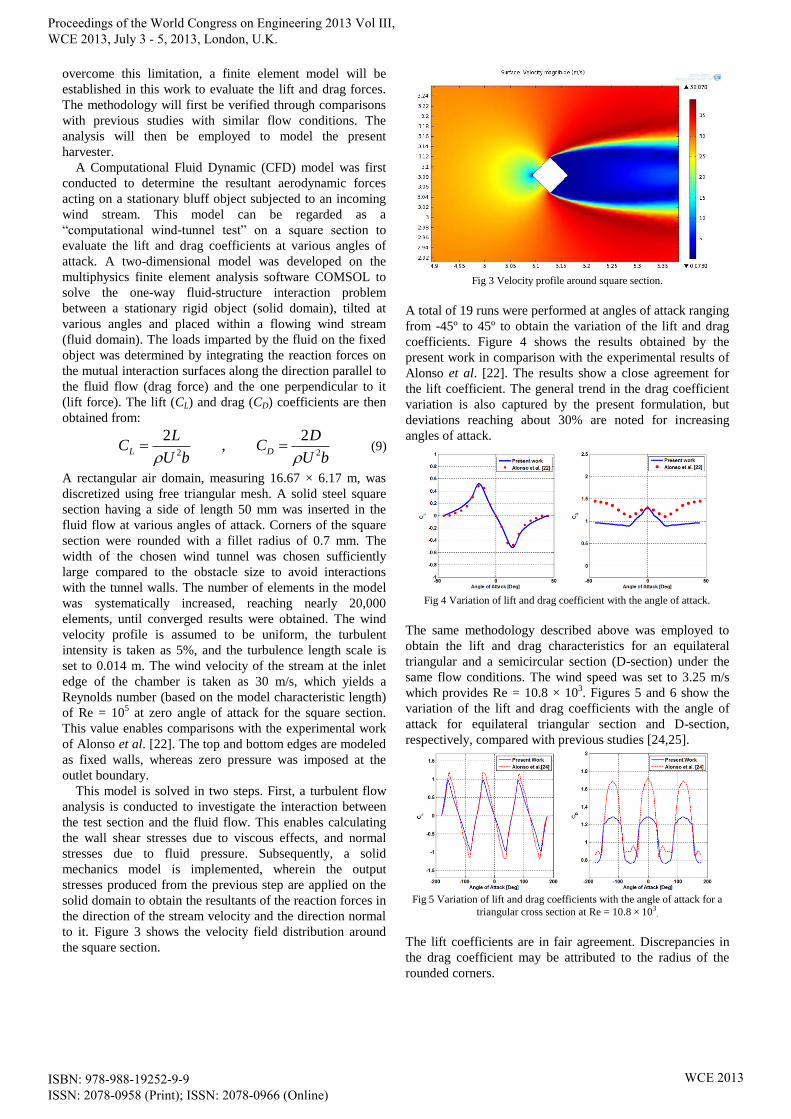
to it. Figure 3 shows the velocity field distribution around
the square section.
Fig 3 Velocity profile around square section.
A total of 19 runs were performed at angles of attack ranging
from -45º to 45º to obtain the variation of the lift and drag
coefficients. Figure 4 shows the results obtained by the
present work in comparison with the experimental results of
Alonso et al. [22]. The results show a close agreement for
the lift coefficient. The general trend in the drag coefficient
variation is also captured by the present formulation, but
deviations reaching about 30% are noted for increasing
angles of attack.
Fig 4 Variation of lift and drag coefficient with the angle of attack.
The same methodology described above was employed to
obtain the lift and drag characteristics for an equilateral
triangular and a semicircular section (D-section) under the
same flow conditions. The wind speed was set to 3.25 m/s
which provides Re = 10.8 × 10³. Figures 5 and 6 show the
variation of the lift and drag coefficients with the angle of
attack for equilateral triangular section and D-section,
respectively, compared with previous studies [24,25].
Fig 5 Variation of lift and drag coefficients with the angle of attack for a
triangular cross section at Re = 10.8 × 10³.
The lift coefficients are in fair agreement. Discrepancies in
the drag coefficient may be attributed to the radius of the
rounded corners.
Proceedings of the World Congress on Engineering 2013 Vol III, WCE 2013, July 3 - 5, 2013, London, U.K.
ISBN: 978-988-19252-9-9 ISSN: 2078-0958 (Print); ISSN: 2078-0966 (Online)
WCE 2013

Fig 6 Variation of lift and drag coefficients with the angle of attack
for a D-section at Re = 10.8 × 10³
IV. COUPLED ELECTRO-AEROELASTIC MODEL
Using the Euler-Bernoulli beam formulation, a finite element
model is formulated to study the dynamic behavior of the
energy harvester. The beam was divided into 22 elements,
each bounded by two nodes. Axial loading on the beam was
neglected in this study. The vector of nodal degrees of
freedom, {}, is structured to contain the transverse
displacements (odd numbered entries) and cross section
rotations (even-numbered entries) in the displacement
vector, i.e.
1 1 2 2 22 22
Tw w w (10)
The coupled electro-aeroelastic problem is modeled by
extending the formulation developed earlier by Poulin et al.
[26], which accounts for the effect of inducing
electromagnetic current in a single-degree-of-freedom
system, to a system having a finite number of degrees of
freedom by introducing a forcing term proportional to the
induced current, which in turn is proportional to the magnet
velocity, at its point of attachment. Rotational displacement
of the magnet is neglected since it is placed close to the
fixed end where the displacement is predominantly linear.
The coupled equations governing the dynamic behavior of
the system are expressed as:
0 0
0 0 00
T
c l c
M C FK P
P L IR RI I
(11)
where
0 0 0 0 0 0wP BL (12)
In Eqs. (11) and (12), I is the current through the coil, B is
the magnetic flux density (assumed to be constant), Lw is the
total wire length, Rc is the coil resistance Rl is the load
resistance, and Lc is the coil inductance. All entries of the
vector {P} in Eq. (12) are zeros except the fifth, which
corresponds to the transverse structural displacement of the
node on the beam where the magnet is attached.
The mass matrix is adjusted to include the mass of the
magnet and its mass moment of inertia. The damping matrix
in Eq. (11) is estimated as [C] = γ [M] + β [K]. This
damping term only includes mechanical damping in the
system whereas electromagnetic damping will be included in
the force terms. The force vector {F} in Eq. (11) accounts
for both the aerodynamic forces (estimated in the previous
section) applied at the beam tip and the electromagnetic
damping force at the magnet location. Accordingly, entries
in the force vector are listed as:
0 0 0 0 0 0 0T
n AF F F (13)
where FA is the aerodynamic force and Fn is the
electromagnetic force given by:
n wF BL I (14)
Equation (11) is numerically integrated in the time domain
to obtain both the mechanical and electrical responses for a
given input wind speed and load resistance. As an initial
condition, the beam is perturbed from its equilibrium
position to allow the oscillations to build up. In all
simulations, all nodes were given zero initial displacements
and slight initial velocities that are proportional to the
beam’s static deflection curve.
V. EXPERIMENTAL VALIDATION
Figure 7a shows a photograph of the experimental setup
consisting of a stainless steel beam measuring 192 × 25.4 ×
0.45 mm rigidly fixed to a bracket at one end. At the free
end, one of the foam boxes shown in Fig. 7b (each having a
mass of 10 g) is firmly attached. The side facing the
incoming wind stream measures 250 × 50 mm for all the
boxes used in this study. A nickel plated cylindrical NdFeB
button magnet having a diameter of 17 mm and a thickness
of 2.3 mm is attached to the beam 26 mm away from the
fixed end and a coil is fixed in front of it. Resistive load in
the range from 100 Ω to 10 kΩ is provided by a decade
resistance box (Lutron, type RBOX-408). Data is captured
on a multi-channel dynamic signal analyzer (LMS Pimento).
Box
Beam Magnet
Support
Coil
(a)
(b) Fig 7 (a)Experimental setup, (b) Tip end cross sections.
This setup is subjected to a steady wind stream whose
velocity was measured by a handheld metal vane
anemometer. Once placed in the wind flow, the beam is
allowed to oscillate from rest. The time-domain signal,
including measurement of the amplitude build-up, is
recorded for 30 seconds until steady-state oscillations are
observed to prevail. A wind speed of 3.25 m/s was utilized
in this work. The magnetic flux density was estimated for the
average distance between the magnet and the coil based on
data released by the magnet manufacturer [27]. Table 1 lists
the geometrical and material properties relevant to this work.
Proceedings of the World Congress on Engineering 2013 Vol III, WCE 2013, July 3 - 5, 2013, London, U.K.
ISBN: 978-988-19252-9-9 ISSN: 2078-0958 (Print); ISSN: 2078-0966 (Online)
WCE 2013
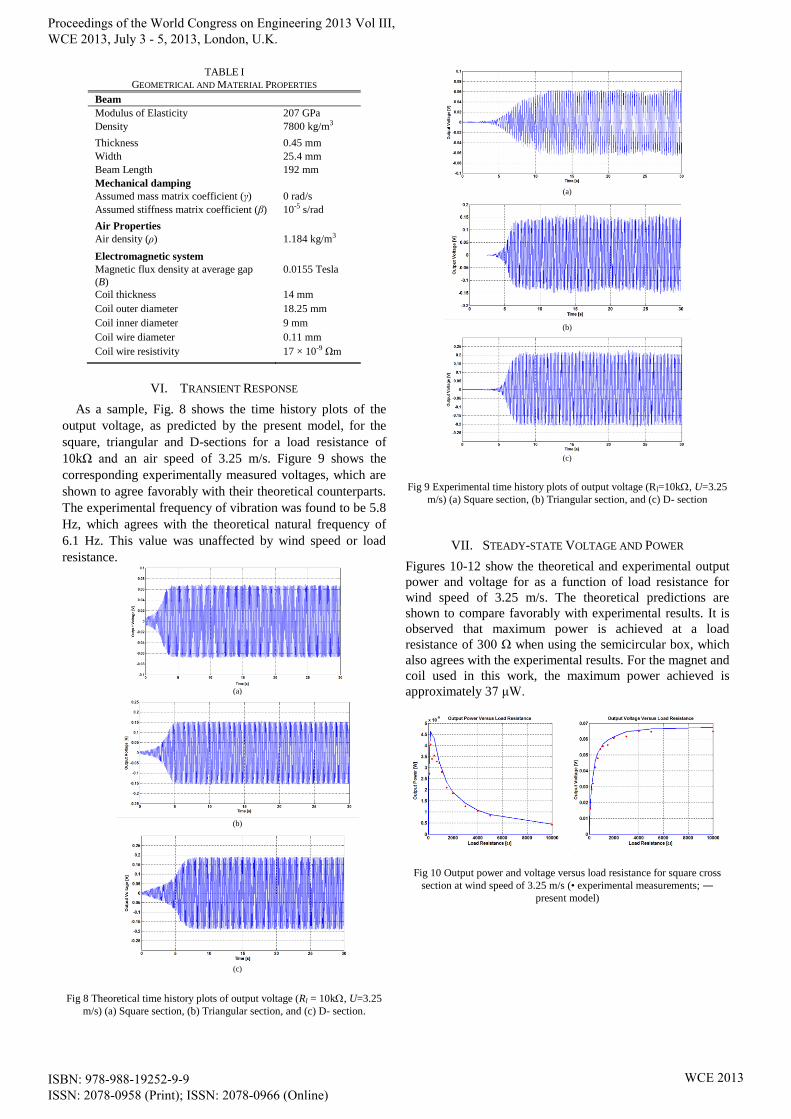
TABLE I
GEOMETRICAL AND MATERIAL PROPERTIES
Beam
Modulus of Elasticity 207 GPa
Density 7800 kg/m3
Thickness 0.45 mm
Width 25.4 mm
Beam Length 192 mm
Mechanical damping
Assumed mass matrix coefficient (γ) 0 rad/s
Assumed stiffness matrix coefficient (β) 10-5 s/rad
Air Properties
Air density (ρ) 1.184 kg/m3
Electromagnetic system
Magnetic flux density at average gap
(B)
0.0155 Tesla
Coil thickness 14 mm
Coil outer diameter 18.25 mm
Coil inner diameter 9 mm
Coil wire diameter 0.11 mm
Coil wire resistivity 17 × 10-9 Ωm
VI. TRANSIENT RESPONSE
As a sample, Fig. 8 shows the time history plots of the
output voltage, as predicted by the present model, for the
square, triangular and D-sections for a load resistance of
10kΩ and an air speed of 3.25 m/s. Figure 9 shows the
corresponding experimentally measured voltages, which are
shown to agree favorably with their theoretical counterparts.
The experimental frequency of vibration was found to be 5.8
Hz, which agrees with the theoretical natural frequency of
6.1 Hz. This value was unaffected by wind speed or load
resistance.
(a)
(b)
(c)
Fig 8 Theoretical time history plots of output voltage (Rl = 10k, U=3.25
m/s) (a) Square section, (b) Triangular section, and (c) D- section.
(a)
(b)
(c)
Fig 9 Experimental time history plots of output voltage (Rl=10k, U=3.25
m/s) (a) Square section, (b) Triangular section, and (c) D- section
VII. STEADY-STATE VOLTAGE AND POWER
Figures 10-12 show the theoretical and experimental output
power and voltage for as a function of load resistance for
wind speed of 3.25 m/s. The theoretical predictions are
shown to compare favorably with experimental results. It is
observed that maximum power is achieved at a load
resistance of 300 Ω when using the semicircular box, which
also agrees with the experimental results. For the magnet and
coil used in this work, the maximum power achieved is
approximately 37 μW.
Fig 10 Output power and voltage versus load resistance for square cross
section at wind speed of 3.25 m/s (• experimental measurements; ―
present model)
Proceedings of the World Congress on Engineering 2013 Vol III, WCE 2013, July 3 - 5, 2013, London, U.K.
ISBN: 978-988-19252-9-9 ISSN: 2078-0958 (Print); ISSN: 2078-0966 (Online)
WCE 2013
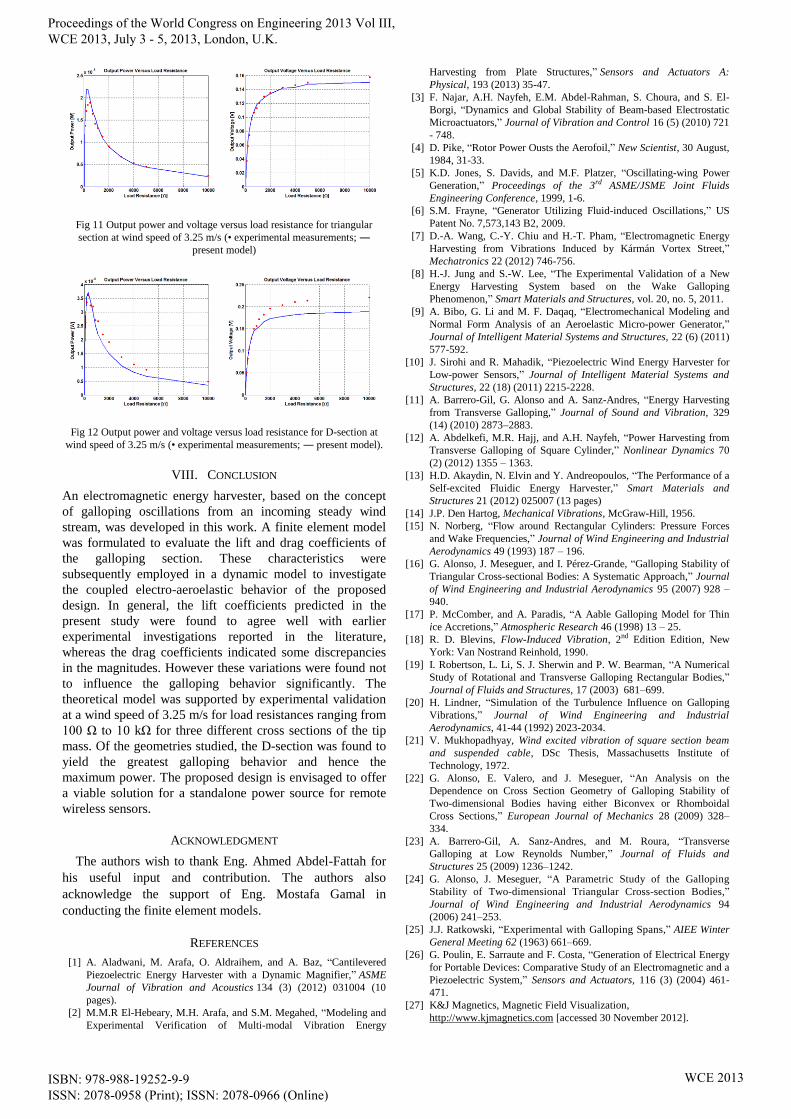
Fig 11 Output power and voltage versus load resistance for triangular
section at wind speed of 3.25 m/s (• experimental measurements; ―
present model)
Fig 12 Output power and voltage versus load resistance for D-section at
wind speed of 3.25 m/s (• experimental measurements; ― present model).
VIII. CONCLUSION
An electromagnetic energy harvester, based on the concept
of galloping oscillations from an incoming steady wind
stream, was developed in this work. A finite element model
was formulated to evaluate the lift and drag coefficients of
the galloping section. These characteristics were
subsequently employed in a dynamic model to investigate
the coupled electro-aeroelastic behavior of the proposed
design. In general, the lift coefficients predicted in the
present study were found to agree well with earlier
experimental investigations reported in the literature,
whereas the drag coefficients indicated some discrepancies
in the magnitudes. However these variations were found not
to influence the galloping behavior significantly. The
theoretical model was supported by experimental validation
at a wind speed of 3.25 m/s for load resistances ranging from
100 Ω to 10 kΩ for three different cross sections of the tip
mass. Of the geometries studied, the D-section was found to
yield the greatest galloping behavior and hence the
maximum power. The proposed design is envisaged to offer
a viable solution for a standalone power source for remote
wireless sensors.
ACKNOWLEDGMENT
The authors wish to thank Eng. Ahmed Abdel-Fattah for
his useful input and contribution. The authors also
acknowledge the support of Eng. Mostafa Gamal in
conducting the finite element models.
REFERENCES
[1] A. Aladwani, M. Arafa, O. Aldraihem, and A. Baz, “Cantilevered
Piezoelectric Energy Harvester with a Dynamic Magnifier,” ASME
Journal of Vibration and Acoustics 134 (3) (2012) 031004 (10
pages).
[2] M.M.R El-Hebeary, M.H. Arafa, and S.M. Megahed, “Modeling and
Experimental Verification of Multi-modal Vibration Energy
Harvesting from Plate Structures,” Sensors and Actuators A:
Physical, 193 (2013) 35-47.
[3] F. Najar, A.H. Nayfeh, E.M. Abdel-Rahman, S. Choura, and S. El-
Borgi, “Dynamics and Global Stability of Beam-based Electrostatic
Microactuators,” Journal of Vibration and Control 16 (5) (2010) 721
- 748. [4] D. Pike, “Rotor Power Ousts the Aerofoil,” New Scientist, 30 August,
1984, 31-33. [5] K.D. Jones, S. Davids, and M.F. Platzer, “Oscillating-wing Power
Generation,” Proceedings of the 3rd ASME/JSME Joint Fluids
Engineering Conference, 1999, 1-6. [6] S.M. Frayne, “Generator Utilizing Fluid-induced Oscillations,” US
Patent No. 7,573,143 B2, 2009. [7] D.-A. Wang, C.-Y. Chiu and H.-T. Pham, “Electromagnetic Energy
Harvesting from Vibrations Induced by Kármán Vortex Street,”
Mechatronics 22 (2012) 746-756. [8] H.-J. Jung and S.-W. Lee, “The Experimental Validation of a New
Energy Harvesting System based on the Wake Galloping
Phenomenon,” Smart Materials and Structures, vol. 20, no. 5, 2011. [9] A. Bibo, G. Li and M. F. Daqaq, “Electromechanical Modeling and
Normal Form Analysis of an Aeroelastic Micro-power Generator,”
Journal of Intelligent Material Systems and Structures, 22 (6) (2011)
577-592. [10] J. Sirohi and R. Mahadik, “Piezoelectric Wind Energy Harvester for
Low-power Sensors,” Journal of Intelligent Material Systems and
Structures, 22 (18) (2011) 2215-2228. [11] A. Barrero-Gil, G. Alonso and A. Sanz-Andres, “Energy Harvesting
from Transverse Galloping,” Journal of Sound and Vibration, 329
(14) (2010) 2873–2883. [12] A. Abdelkefi, M.R. Hajj, and A.H. Nayfeh, “Power Harvesting from
Transverse Galloping of Square Cylinder,” Nonlinear Dynamics 70
(2) (2012) 1355 – 1363. [13] H.D. Akaydin, N. Elvin and Y. Andreopoulos, “The Performance of a
Self-excited Fluidic Energy Harvester,” Smart Materials and
Structures 21 (2012) 025007 (13 pages) [14] J.P. Den Hartog, Mechanical Vibrations, McGraw-Hill, 1956. [15] N. Norberg, “Flow around Rectangular Cylinders: Pressure Forces
and Wake Frequencies,” Journal of Wind Engineering and Industrial
Aerodynamics 49 (1993) 187 – 196. [16] G. Alonso, J. Meseguer, and I. Pérez-Grande, “Galloping Stability of
Triangular Cross-sectional Bodies: A Systematic Approach,” Journal
of Wind Engineering and Industrial Aerodynamics 95 (2007) 928 –
940. [17] P. McComber, and A. Paradis, “A Aable Galloping Model for Thin
ice Accretions,” Atmospheric Research 46 (1998) 13 – 25. [18] R. D. Blevins, Flow-Induced Vibration, 2nd Edition Edition, New
York: Van Nostrand Reinhold, 1990. [19] I. Robertson, L. Li, S. J. Sherwin and P. W. Bearman, “A Numerical
Study of Rotational and Transverse Galloping Rectangular Bodies,”
Journal of Fluids and Structures, 17 (2003) 681–699. [20] H. Lindner, “Simulation of the Turbulence Influence on Galloping
Vibrations,” Journal of Wind Engineering and Industrial
Aerodynamics, 41-44 (1992) 2023-2034. [21] V. Mukhopadhyay, Wind excited vibration of square section beam
and suspended cable, DSc Thesis, Massachusetts Institute of
Technology, 1972. [22] G. Alonso, E. Valero, and J. Meseguer, “An Analysis on the
Dependence on Cross Section Geometry of Galloping Stability of
Two-dimensional Bodies having either Biconvex or Rhomboidal
Cross Sections,” European Journal of Mechanics 28 (2009) 328–
334. [23] A. Barrero-Gil, A. Sanz-Andres, and M. Roura, “Transverse
Galloping at Low Reynolds Number,” Journal of Fluids and
Structures 25 (2009) 1236–1242.
[24] G. Alonso, J. Meseguer, “A Parametric Study of the Galloping
Stability of Two-dimensional Triangular Cross-section Bodies,”
Journal of Wind Engineering and Industrial Aerodynamics 94
(2006) 241–253.
[25] J.J. Ratkowski, “Experimental with Galloping Spans,” AIEE Winter
General Meeting 62 (1963) 661–669.
[26] G. Poulin, E. Sarraute and F. Costa, “Generation of Electrical Energy
for Portable Devices: Comparative Study of an Electromagnetic and a
Piezoelectric System,” Sensors and Actuators, 116 (3) (2004) 461-
471.
[27] K&J Magnetics, Magnetic Field Visualization,
http://www.kjmagnetics.com [accessed 30 November 2012].
Proceedings of the World Congress on Engineering 2013 Vol III, WCE 2013, July 3 - 5, 2013, London, U.K.
ISBN: 978-988-19252-9-9 ISSN: 2078-0958 (Print); ISSN: 2078-0966 (Online)
WCE 2013