module-detection approaches for the integration of
TRANSCRIPT

RESEARCH ARTICLE Open Access
Module-detection approaches for theintegration of multilevel omics datahighlight the comprehensive response ofAspergillus fumigatus to caspofunginT. Conrad1* , O. Kniemeyer2, S. G. Henkel3, T. Krüger2, D. J. Mattern2,9, V. Valiante4, R. Guthke1, I. D. Jacobsen5,6,A. A. Brakhage2,6, S. Vlaic1 and J. Linde7,8
Abstract
Background: Omics data provide deep insights into overall biological processes of organisms. However, integrationof data from different molecular levels such as transcriptomics and proteomics, still remains challenging. Analyzinglists of differentially abundant molecules from diverse molecular levels often results in a small overlap mainly due todifferent regulatory mechanisms, temporal scales, and/or inherent properties of measurement methods. Module-detecting algorithms identifying sets of closely related proteins from protein-protein interaction networks (PPINs)are promising approaches for a better data integration.
Results: Here, we made use of transcriptome, proteome and secretome data from the human pathogenic fungusAspergillus fumigatus challenged with the antifungal drug caspofungin. Caspofungin targets the fungal cell wallwhich leads to a compensatory stress response. We analyzed the omics data using two different approaches: First,we applied a simple, classical approach by comparing lists of differentially expressed genes (DEGs), differentiallysynthesized proteins (DSyPs) and differentially secreted proteins (DSePs); second, we used a recently publishedmodule-detecting approach, ModuleDiscoverer, to identify regulatory modules from PPINs in conjunction with theexperimental data. Our results demonstrate that regulatory modules show a notably higher overlap between thedifferent molecular levels and time points than the classical approach. The additional structural informationprovided by regulatory modules allows for topological analyses. As a result, we detected a significant association ofomics data with distinct biological processes such as regulation of kinase activity, transport mechanisms or aminoacid metabolism. We also found a previously unreported increased production of the secondary metabolitefumagillin by A. fumigatus upon exposure to caspofungin. Furthermore, a topology-based analysis of potential keyfactors contributing to drug-caused side effects identified the highly conserved protein polyubiquitin as a centralregulator. Interestingly, polyubiquitin UbiD neither belonged to the groups of DEGs, DSyPs nor DSePs but mostlikely strongly influenced their levels.
Conclusion: Module-detecting approaches support the effective integration of multilevel omics data and provide adeep insight into complex biological relationships connecting these levels. They facilitate the identification ofpotential key players in the organism’s stress response which cannot be detected by commonly used approachescomparing lists of differentially abundant molecules.
Keywords: Multilevel, Omics, Protein-protein interaction network, Module, Aspergillus fumigatus, Caspofungin, Stressresponse, ModuleDiscoverer
* Correspondence: [email protected] Biology/Bioinformatics, Leibniz Institute for Natural ProductResearch and Infection Biology – Hans Knöll Institute, Jena, GermanyFull list of author information is available at the end of the article
© The Author(s). 2018 Open Access This article is distributed under the terms of the Creative Commons Attribution 4.0International License (http://creativecommons.org/licenses/by/4.0/), which permits unrestricted use, distribution, andreproduction in any medium, provided you give appropriate credit to the original author(s) and the source, provide a link tothe Creative Commons license, and indicate if changes were made. The Creative Commons Public Domain Dedication waiver(http://creativecommons.org/publicdomain/zero/1.0/) applies to the data made available in this article, unless otherwise stated.
Conrad et al. BMC Systems Biology (2018) 12:88 https://doi.org/10.1186/s12918-018-0620-8

BackgroundThe permanent growth in the development and im-provement of new measurement techniques have led toa wealth of data from heterogeneous sources. The inte-gration of all available data obtained from diverse studieshas the potential to provide a more comprehensive anddeeper understanding of the studied subject [1–3]. Oneexample is the investigation of an organism’s response toan external stimulus at different molecular levels.Large-scale studies at molecular levels like transcripto-mics, proteomics, lipidomics or metabolomics can besummarized by the term ‘omics levels’. These omicslevels are linked to each other and are considered intheir entirety. They describe the overall biological pro-cesses which occur in the analyzed organism. Potentiallinks can be characterized by level-shared (‘overlapping’)components (such as genes or proteins) or the participa-tion of components of different molecular levels inlevel-shared pathways.As widely reported, the integration and analysis of data
from multiple levels measured with diverse techniquesat different time points are challenging. In an intuitiveand commonly used approach (‘simple approach’), theanalysis of several sets of omics data is based on thecomparison of lists of differentially expressed genes(DEGs) and differentially synthesized proteins (DSyPs)identified in experimental datasets. However, the use ofonly DEGs and DSyPs is threshold-dependent andusually incomplete due to experimental limitations. Forexample, the use of liquid chromatography-massspectrometry (LC-MS/MS)-based shotgun proteomicsanalysis for the identification of DSyPs is usually limitedin the quantification of low abundant proteins due tothe large dynamic range of protein abundances thatneeds to be covered [4, 5]. Other approaches, includingdiverse pathway enrichment analyses, assign both differ-entially and non-differentially expressed genes or theirsynthesized proteins to specific pathways which are partof biological processes. The level of activity of suchpathways can be estimated by taking into account mea-surements of changes in gene expression or protein syn-thesis. However, as these approaches are based onpre-defined lists of pathways, they exclude unknownpathways which may also have important functions [6].Over the last decades, the analysis of protein-proteininteraction networks (PPINs) has become a useful ap-proach [7]. By identifying direct (physical) contacts andindirect interactions (e.g., via regulatory cascades) be-tween two or more proteins, PPINs point to structuraland functional relationships between their nodes [8].Several de novo network enrichment approaches weredeveloped to extract connected sub-networks from largerinteraction networks. Such sub-networks containing setsof closely related proteins are defined as modules [9].
There are many examples in the literature demonstratingthe usefulness of modules in research data interpretation.For instance, Stuart et al. analyzed genetic modules to de-tect co-expressed genes that are involved in similar bio-logical processes [10], while Trevino et al. [11] have shownthe usefulness of investigating inter-module connectivityto identify molecular cross-talk between normal prostateepithelial and prostate carcinoma cells.Another very interesting application of modules is the
identification of prognostic or drug response biomarkers[12]. In this context, modules also show their potentialfor the characterization of drug-caused side effects oc-curring in addition to effects on the intended primarydrug target. Wang et al. [13] demonstrated that majorcontributing factors of such side effects can be investi-gated by considering the primary drug target and itslocal network structure.Several categories of modules have been described
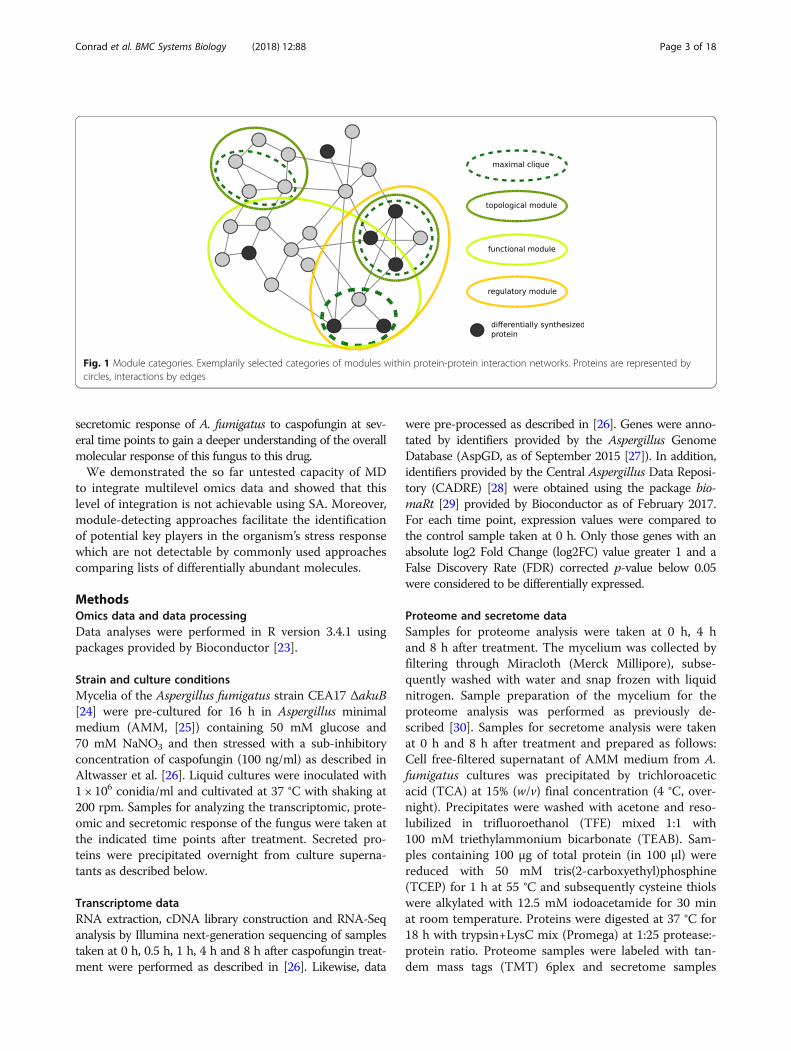
until now (Fig. 1). Examples are topological modulescomposed of proteins showing a high degree ofinner-connectiveness or functional modules that containproteins associated to specific biological functions [14,15]. So-called regulatory modules are defined as sets ofco-expressed genes which share a common function[16]. Popular methods for the detection of regulatorymodules are: DEGAS [17], MATISSE [15], KeyPathway-Miner [18] and ModuleDiscoverer [19]. Among them,the recently published ModuleDiscoverer (MD) includesa heuristic that approximates the PPIN’s underlyingcommunity structure based on maximal cliques. While acommunity defines a group of proteins featuring ahigher within-edge density in comparison to the edgedensity connecting them, a clique represents a set ofproteins with edges between each pair of them. A cliqueis maximal if no node (e.g., protein) exists which extendsthat clique. MD was shown to be very efficient in the de-tection of regulatory modules for gene expression datain the context of animal models of non-alcoholic fattyliver disease [19].In this study, we applied the simple approach (SA), the re-
cently published module-detection approach MD as well asKeyPathwayMiner to experimental data of different molecu-lar levels, measurement techniques and time points. As acase study, we analyzed the molecular response of the hu-man pathogenic fungus Aspergillus fumigatus to the antifun-gal drug caspofungin. A. fumigatus causes local and systemicinfections in immunocompromised individuals [20]. Onetherapeutic approach is the use of the lipopeptide caspofun-gin of the group of echinocandins. Caspofungin specificallytargets the fungal cell wall by inhibiting the synthesis of thepolysaccharide β-(1,3)-D-glucan [21]. Fungal cells respond tocaspofungin by the adaption of gene expression and, conse-quently, protein biosynthesis and secretion of molecules [22].Therefore, we analyzed the transcriptomic, proteomic and
Conrad et al. BMC Systems Biology (2018) 12:88 Page 2 of 18
secretomic response of A. fumigatus to caspofungin at sev-eral time points to gain a deeper understanding of the overallmolecular response of this fungus to this drug.We demonstrated the so far untested capacity of MD
to integrate multilevel omics data and showed that thislevel of integration is not achievable using SA. Moreover,module-detecting approaches facilitate the identificationof potential key players in the organism’s stress responsewhich are not detectable by commonly used approachescomparing lists of differentially abundant molecules.
MethodsOmics data and data processingData analyses were performed in R version 3.4.1 usingpackages provided by Bioconductor [23].
Strain and culture conditionsMycelia of the Aspergillus fumigatus strain CEA17 ΔakuB[24] were pre-cultured for 16 h in Aspergillus minimalmedium (AMM, [25]) containing 50 mM glucose and70 mM NaNO3 and then stressed with a sub-inhibitoryconcentration of caspofungin (100 ng/ml) as described inAltwasser et al. [26]. Liquid cultures were inoculated with1 × 106 conidia/ml and cultivated at 37 °C with shaking at200 rpm. Samples for analyzing the transcriptomic, prote-omic and secretomic response of the fungus were taken atthe indicated time points after treatment. Secreted pro-teins were precipitated overnight from culture superna-tants as described below.
Transcriptome dataRNA extraction, cDNA library construction and RNA-Seqanalysis by Illumina next-generation sequencing of samplestaken at 0 h, 0.5 h, 1 h, 4 h and 8 h after caspofungin treat-ment were performed as described in [26]. Likewise, data
were pre-processed as described in [26]. Genes were anno-tated by identifiers provided by the Aspergillus GenomeDatabase (AspGD, as of September 2015 [27]). In addition,identifiers provided by the Central Aspergillus Data Reposi-tory (CADRE) [28] were obtained using the package bio-maRt [29] provided by Bioconductor as of February 2017.For each time point, expression values were compared tothe control sample taken at 0 h. Only those genes with anabsolute log2 Fold Change (log2FC) value greater 1 and aFalse Discovery Rate (FDR) corrected p-value below 0.05were considered to be differentially expressed.
Proteome and secretome dataSamples for proteome analysis were taken at 0 h, 4 hand 8 h after treatment. The mycelium was collected byfiltering through Miracloth (Merck Millipore), subse-quently washed with water and snap frozen with liquidnitrogen. Sample preparation of the mycelium for theproteome analysis was performed as previously de-scribed [30]. Samples for secretome analysis were takenat 0 h and 8 h after treatment and prepared as follows:Cell free-filtered supernatant of AMM medium from A.fumigatus cultures was precipitated by trichloroaceticacid (TCA) at 15% (w/v) final concentration (4 °C, over-night). Precipitates were washed with acetone and reso-lubilized in trifluoroethanol (TFE) mixed 1:1 with100 mM triethylammonium bicarbonate (TEAB). Sam-ples containing 100 μg of total protein (in 100 μl) werereduced with 50 mM tris(2-carboxyethyl)phosphine(TCEP) for 1 h at 55 °C and subsequently cysteine thiolswere alkylated with 12.5 mM iodoacetamide for 30 minat room temperature. Proteins were digested at 37 °C for18 h with trypsin+LysC mix (Promega) at 1:25 protease:-protein ratio. Proteome samples were labeled with tan-dem mass tags (TMT) 6plex and secretome samples
Fig. 1 Module categories. Exemplarily selected categories of modules within protein-protein interaction networks. Proteins are represented bycircles, interactions by edges
Conrad et al. BMC Systems Biology (2018) 12:88 Page 3 of 18

were labeled with isobaric tags for relative and absolutequantification (iTRAQ) 4plex according to the manufac-turer’s protocols.LC-MS/MS analysis was performed as previously de-
scribed [30] with the following modifications: Eluents A(0.1% v/v formic acid in H2O) and B (0.1% v/v formicacid in 90/10 ACN/H2O v/v) were mixed for 10 h gradi-ent elution: 0–4 min at 4% B, 15 min at 5.5% B, 30 minat 6.5%, 220 min at 12.5% B, 300 min at 17% B, 400 minat 26% B, 450 min at 35% B, 475 min at 42% B, 490 minat 51% B, 500 min at 60% B, 515–529 min at 96% B,530–600 min at 4% B. Precursor ions were monitored atm/z 300–1500, R = 140 k (FWHM), 3e6 AGC (automaticgain control) target, and 120 maximum injection time(maxIT). Top ten precursor ions (0.8 Da isolation width;z = 2–5) underwent data-dependent higher-energy colli-sional dissociation (HCD) fragmentation at normalizedcollision energy (NCE) 36% using N2 gas. Dynamic ex-clusion was set to 40 s. MS2 spectra were monitored atR = 17.5 k (FWHM), 2e5 AGC target, and 120 maxIT.The fixed first mass was set to m/z 110 to match theiTRAQ reporter ions (m/z 114–117).Database searches were performed by Proteome Discoverer
(PD) 1.4 (Thermo Fisher Scientific, Dreieich, Germany)using the AspGD protein database of A. fumigatusAf293 [31] and the algorithms of MASCOT 2.4.1(Matrix Science, UK), SEQUEST HT (integral searchengine of PD 1.4), and MS Amanda 1.0. Two missedcleavages were allowed for tryptic digestion. The pre-cursor mass tolerance and the integration tolerance(most confident centroid) were set to 5 ppm and theMS2 tolerance to 0.02 Da. Static modifications werecarbamidomethylation of cysteine and either TMT6plex(proteome) or iTRAQ4plex (secretome) at lysineresidues and the peptide N-terminus. Dynamic modifi-cations were oxidation of methionine and eitherTMT6plex of threonine or iTRAQ4plex of tyrosine.Percolator and a reverse decoy database were used forq-value validation of the spectral matches (Δcn < 0.05).At least two peptides per protein and a strict targetFDR < 1% were required for confident protein hits. Thesignificance threshold for differential protein abun-dances for TMT and iTRAQ experiments was set tofactor 1.5.With the aid of the biomaRt package, proteins were
annotated using identifiers provided by AspGD as ofSeptember 2015 and CADRE as of February 2017.
Chemical analysis of secondary metabolitesFor quantification of fumagillin, fungal cultures were ex-tracted and run on a LC-MS system consisting of anHPLC, UltiMate 3000 binary RSLC with photo diode arraydetector (Thermo Fisher Scientific, Dreieich, Germany)and the mass spectrometer (LTQ XL Linear Ion Trap
from Thermo Fisher Scientific, Dreieich, Germany) withan electrospray ion source as described in Jöhnk et al.[32]. Data were obtained from three biological replicatesand three technical replicates. A standard curve (1000,500, 250, 125 and 62.5 μg/mL) using an authentic fumagil-lin standard (Abcam, United Kingdom) was calculated.The Xcalibur Quan Browser software (Thermo FisherScientific, Dreieich, Germany) was used to calculate theamounts of fumagillin.
Application of module-detecting approachesA high-confidence (score > 0.7) PPIN of A. fumigatusstrain A1163 was downloaded from STRING version 10[33]. Both the PPIN and the pre-processed omics datawere taken as input for the module-detecting ap-proaches. Thereby, protein identifier annotations pro-vided by CADRE were used.
ModuleDiscovererIn order to apply MD for transcriptome data, the back-ground contains all known A. fumigatus proteins de-scribed in AspGD. Analyzing proteome and secretomedata, all proteins detected via LC-MS/MS were taken asbackground. The single-seed MD algorithm was appliedto the input data as described by Vlaic et al. [19]. In brief,maximal cliques were identified using only one seed nodein the PPIN. Cliques were tested for their enrichment withDEGs/DSyPs/DSePs using a permutation-based test as de-scribed in Vlaic et al. [19]. Cliques with a p-value < 0.01were considered significantly enriched. Based on theunion of these significantly enriched cliques, the regula-tory module was assembled.For the integration of different omics datasets, all regula-
tory modules were merged by forming the union of allnodes and edges. The resulting union regulatory module isdefined as ‘overall regulatory module’ (ORM). Sub-moduleswith a number of nodes < 10 were not considered. Cytos-cape version 3.2.1 [34] was used to visualize and analyzeregulatory modules, for example, regarding their nodes’ de-gree and betweenness centrality.
KeyPathwayMinerKeyPathwayMiner (KPM) detects maximal connectedsub-networks. In these sub-networks, all but a specificnumber K components are DEGs, DSyPs or DSePs in allbut at most a specific number L cases [18]. In this study,cases are defined as the available time points. In a firstanalysis (I), KPM was applied to each single experimen-tal dataset to receive one module for each time point ofthe respective molecular level. In the single-level analysis(II), the modules for each molecular level over all timepoints were identified. A third analysis (III) directlycombined all of the experimental datasets to get theoverall regulatory module. For the KPM input, one
Conrad et al. BMC Systems Biology (2018) 12:88 Page 4 of 18
matrix for each time point (I) or molecular level ((II)and (III)) were generated consisting of information aboutthe components’ regulation at the respective time points.For (II) and (III), only those components were consid-ered that were DEGs/DSyPs/DSePs in at least one of thetime points of the respective molecular level. With thesematrices, the A. fumigatus PPIN and with the aid ofKeyPathwayMiner Cytoscape App [18], sub-networkswere computed using following settings: Ant colonyoptimization meta heuristic (ACO) as search algorithm,individual node exceptions (INEs) as search strategy,maximum of exception nodes K = 2. For (I) and (II), themaximal case exception parameter was set to L = 0. Forthe multilevel omics analysis (III), the logical connectorof the different levels was set to the logical ‘OR’ and Lwas set to L1 = 3 (transcriptome data), L2 = 1 (proteomedata) and L3 = 0 (secretome data). These L values werebased on the number of time points of the respective mo-lecular level. The assumption was that the consideredcomponent is a DEG/DSyP/DSeP in at least one measuredtime point. For instance, as four measured transcriptometime points were available, a gene was allowed to be notdifferentially expressed in maximal three out of four timepoints. The top ten best-scoring sub-networks wereselected for further analysis. A KPM regulatory moduledescribes the union of these top ten sub-networks of therespectively considered datasets.
Comparison of the simple approach and a module-detecting approachOverlap of componentsThe overlap (percentage value) is defined as fraction ofthe intersection of the respective datasets from theunion of the datasets. For the simple approach (SA), theoverlap of different molecular levels was analyzed bycomparing lists of DEGs, DSyPs and DSePs at the con-sidered time points. For the module-detecting approach,the overlap of all components of the respective regula-tory modules was considered.In addition to the comparison of percentage values
of overlapping components, a more objective meas-urement based on a permutation-based test was con-sidered. Considering all known A. fumigatus proteins(N) described in AspGD, D ∈ N is a set of compo-nents (DEGs, DSyPs or DSePs) for each of the mo-lecular levels. In I = 100,000 iterations, datasets Bwere created where each set consists of |D| compo-nents sampled from N. In every iteration, the overlapP of the molecular levels was calculated based on thegenerated datasets for transcriptome, proteome andsecretome. The p-value was calculated by dividing thenumber of iterations in which P ≥O, where O repre-sents the overlap received by SA or MD, and thetotal number of iterations I.
Correlation of the components’ regulationAll components detected in at least one of the transcrip-tomic and one of the proteomic time points were consid-ered for correlation analyses. The distance between resultsobtained for different molecular levels and time points wasestimated based on the correlation of ranked lists of thecomponents’ absolute gene expression or protein synthesisregulation values (absolute log2FCs). Lists of ordered, abso-lute regulation values were rank-transformed. Indices corre-sponding to ties (equal values) were randomly ordered.Spearman’s rank correlation coefficient r was calculated.The ranking was repeated 1000 times. Over all repeats, thefinal correlation between the regulation lists was averaged.The distance d is defined as d = 1 - r.
Generalized topological overlapThe ORM was clustered via the generalized topologicaloverlap measure (GTOM) as described in [35]. Matrix
T ½m� ¼ ½t½m�ij � is called the m-th order GTOM matrix and
includes the overlap of nodes reachable from the nodes iand j within m steps:
t m½ �ij ¼ Nm ið Þ∩Nm jð Þj j þ aij þ Ii¼ j
min Nm ið Þj j; Nm jð Þj jf g þ 1−aij
A = [aij] is defined as adjacency matrix, Nm(i) as theset of neighbors of i, the Identity matrix Ii = jequals 1 if i = jand zero else, |·| denotes the number of elements (cardin-ality) in its argument j. The clustering was performed forsecond-order connections. With the aid of the hclust func-tion (method = average), a dendrogram based on all dis-tances between proteins were generated. A cutoff of 0.65was chosen to receive the clusters. R packages Rcolor-Brewer [36] and WGCNA [37] were applied for coloringthe single clusters.
Enrichment analysis (functional annotation of biologicalprocesses)Gene Ontology (GO) terms were applied for functionalannotation concerning biological processes. Gene (geneproduct) terms of A. fumigatus were retrieved fromAspGD as of October 2017. In particular, GO informa-tion about the Af293 strain was extracted and importedinto R and was transformed into custom annotation ob-jects by packages AnnotationDbi [38] and GSEABase[39] (each of version 1.38.2 as part of Bioconductorpackage collection version 3.5). In addition, the packagesGO.db [40], GOstats [41] as well as the helper functionGSEAGOHyperGParams of package Category [42] wereapplied for the enrichment analysis. For SA, all A. fumi-gatus proteins described in AspGD were taken as back-ground. For the MD approach, all proteins which arepart of the PPIN downloaded from STRING, were takenas background. GO terms composed of at least two
Conrad et al. BMC Systems Biology (2018) 12:88 Page 5 of 18

members, associated with at least two components andleading to p-values below 0.05 were considered as sig-nificantly enriched.
ResultsData overviewWe used experimental omics data of a A. fumigatus studythat investigated the stress response to the antifungal drugcaspofungin at different molecular levels (transcriptome,proteome, secretome) including different time points. Fig-ure 2a provides an overview of the available datasets includ-ing all genes and proteins detected by RNA-Seq andLC-MS/MS. Over all considered time points, 9881 geneswere measured for the transcriptomic response, 3858 pro-teins for the proteomic response and 1110 proteins for thesecretome. Filtering the data for DEGs, DSyPs and DSePsresulted in 1058 DEGs (498 upregulated (↑), 560 downregu-lated (↓)) at 0.5 h, 1237 DEGs (876 ↑, 361 ↓) at 1 h, 1322DEGs (784 ↑, 538 ↓) at 4 h and 1068 DEGs (600 ↑, 468 ↓)at 8 h after caspofungin treatment. In the proteome, 230DSyPs (88 ↑, 142 ↓) were identified at 4 h after treatment,and 204 DSyPs (114 ↑, 90 ↓) at the 8 h time point.136 DSePs (118 ↑, 18 ↓) were detected for the secretome at8 h after treatment (Fig. 2b). Complete lists of DEGs, DSyPsand DSePs are provided in the Additional file 1.
Overlap of datasets of the different molecular levelsWe started to analyze the molecular level overlap by com-paring all measured genes or proteins (hereafter called‘components’) independently of their differential regula-tion and time points. This comparison showed that theoverlap of all three molecular levels amounted to 10.5%(Fig. 2a). Applying SA and MD to the experimental data(Fig. 3), this level overlap accounted for 0.5% (SA) and6.1% (MD). Considering only two out of three molecularlevels (including data of all considered time points, re-spectively), both approaches resulted in the highest over-lap for the proteome/secretome comparison (11.2% SA,
21.4% MD). This observation was not surprising as the se-creted proteins are also included in the global proteome.We found that MD provided an up to 12-fold higher over-lap than SA.A further analysis of overlapping components considered a
more objective measurement based on a permutation-basedtest. In 100,000 iterations, random datasets for transcrip-tome, proteome and secretome were generated and the over-lap of all three datasets was calculated. The median-value ofall 100,000 random overlaps equaled 3. Thus, the level over-lap accounted for 0.1%. For the SA-obtained overlap (11components or 0.5% as presented in Fig. 3), we calculated ap-value = 2.8 × 10− 4 which is statistically significant in com-parison to random overlaps. In contrast, the MD-receivedoverlap (58 components or 6.1% as presented in Fig. 3) re-sulted in the smaller p-value = 1.0 × 10− 5. Comparing theoverlap percentage values, SA produced 5-fold and MD even61-fold higher overlap values than random overlaps. Thecomparison of the SA- and MD-received overlap values re-sulted in the above-mentioned 12-fold higher values for MD.
Estimation of the best match of transcriptomic andproteomic time pointsThe selection of measured time points was based on thefollowing assumption: The expression of a gene and thesynthesis of its corresponding protein do not occur at thesame time since they are consecutive processes. Thus,changes in the transcriptional regulation are also reflectedin the differential synthesis of proteins at the proteomiclevel but most likely at a later time point. Therefore, dif-ferent time points at the transcriptomic and proteomiclevel were selected to consider the delay between tran-scription and translation during the fungal response.Hence, we analyzed our results regarding best matches oflevel- and time point-dependent sub-responses.We tested two approaches for estimating the best
transcriptome-proteome time point match: Comparisonof components, and correlation of the components’
(A) (B)
Fig. 2 Overview of the available datasets. a Number and overlap of all measured genes and proteins. b Number of differentially expressed genes(DEGs), differentially synthesized proteins (DSyPs) and differentially secreted proteins (DSePs) in all available experimental datasets
Conrad et al. BMC Systems Biology (2018) 12:88 Page 6 of 18

regulation. The first estimation approach aimed at ana-lyzing overlapping components in the transcriptome andproteome which can be observed, for instance, as tran-scripts and their synthesized proteins. For the second es-timation approach, the correlation of the components’regulation was calculated based on absolute gene expres-sion or protein synthesis regulation values. This ap-proach represents the regulation of response pathways
which not necessarily contain overlapping componentsbut also other genes or proteins contributing to thesepathways. Therefore, in this approach not only theoverlapping components were analyzed but also com-ponents which are part from at least one of the re-spectively compared transcriptome and proteome timepoints. This leads to a higher number of consideredcomponents.Starting with the comparison of components (Fig. 4a),
both SA and MD demonstrated the best match for thetranscriptomic response 1 h and the proteomic response4 h after caspofungin treatment (5.3% SA, 16.5% MD).While SA resulted in the best match of transcriptome at8 h with proteome at 8 h (7.3%), MD showed the bestmatch with transcriptome at 4 h (16.8%). Consequently,for both time point comparisons, MD-produced resultsindicated a delay of 3–4 h between the differentsub-responses. Taking into account also the correlationof components’ regulation, Fig. 4b shows that similar tothe previous analyses MD provided a better, i.e., herelower, distance for MD values than for SA. Oppositely toSA, the MD results confirmed the best time point matchof transcriptome at earlier time point (1 h) and prote-ome at the later one (8 h) (Fig. 4b), similarly to theaforementioned comparison of components (Fig. 4a).
Fig. 3 Overlap of molecular levels. Overlap of transcriptome (T),proteome (P) and secretome (S) regarding their components (genesor proteins)
(A)
(B)
Fig. 4 Transcriptome-proteome time point match. Estimation of the best time point match for transcriptome (T) and proteome (P) time pointsregarding a comparison of components and b correlation of the components’ regulation. Distance is defined as 1 minus correlation coefficient
Conrad et al. BMC Systems Biology (2018) 12:88 Page 7 of 18

The lowest distances were observed for the proteome at8 h and transcriptome at 1 h (Fig. 4b, highlighted in darkgreen), followed by the proteome at 4 h and transcrip-tome at 1 h (Fig. 4b, dark green). These findings werealso in agreement with the highest and second highestoverlap values in Fig. 4a. Together with the observationthat both approaches showed very high distance values(yellow and light yellow) between the same transcrip-tome and proteome time points, our results support theassumption of a time delay between level-dependentsub-responses (transcription and translation). Tenden-cies in the coherence of time points and an estimationof the resulting time delay between molecular levels maybe helpful for further wet-lab studies regarding time-and cost-saving by focusing on the most relevant timepoints.Another observation can be made by comparing the re-
spective results of the two estimation approaches: There isa tendency that the correlation-based approach resulted inbest matches for earlier transcriptome time points than theoverlap-based approach. This observation may be based onthe activation of stress response pathways induced by thefungus shortly after the caspofungin treatment. As such re-sponse pathways could involve components from both mo-lecular levels transcriptome and proteome, we assume thatthe actual regulation of response pathways represented bythe correlation-based approach already starts before themain translation process of potentially involved compo-nents occurs (represented by the overlap-based approach).
Integration of multilevel omics dataAnalysis of the overall fungal response to caspofunginAll regulatory modules of each molecular level and timepoint identified by MD (Table 1 and Additional file 2:Table S1) can be considered to be part of the overall fun-gal response to caspofungin. Forming the union of them,the resulting overall regulatory module (ORM) was com-posed of five sub-modules including 894 components
(Fig. 5). For a focused enrichment analysis based on theORM’s underlying topology, we performed a generalizedtopological overlap measurement regarding the mainsub-module 1. Figure 5 represents the ORM with its fivesub-modules and the 15 clusters of sub-module 1, wherethe cluster membership of each protein is color-coded. Anoverview of all components of the ORM includingsub-modules and clusters is available in Additional file 2:Table S2). GO term enrichment analyses showed that theclusters were significantly enriched with distinct biologicalfunctions (see Additional file 2: Tables S3–21) for a list ofall significantly associated biological processes of each clusterand the remaining sub-modules). Examples of suchprocesses are protein phosphorylation and response to oxi-dative stress (cluster 2, Additional file 2: Table S4), actinfilament-based process (cluster 3, Additional file 2: Table S5),regulation of kinase activity (cluster 5, Additional file 2:Table S7), amino acid metabolic processes (cluster 6,Additional file 2: Table S8 and cluster 9, Additional file 2:Table S11), (1,3)-alpha-D-glucan biosynthesis (cluster 7,Additional file 2: Table S9), secondary and lipid metabolicprocess (cluster 12, Additional file 2: Table S14 and cluster13, Additional file 2: Table S15) or transport mechanisms(cluster 15, Additional file 2: Table S17 and sub-module 5,Additional file 2: Table S21).
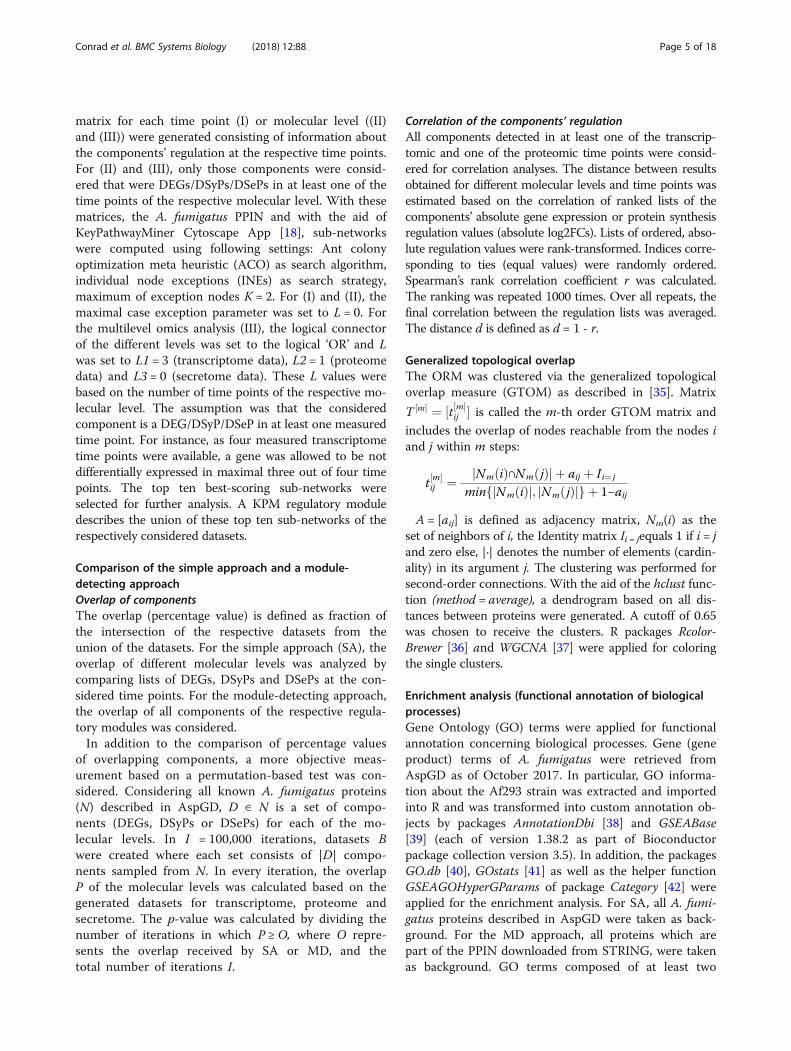
Polyubiquitin and CBF/NF-Y family transcription factor aspotential key factors contributing to the caspofungin-induced responseTo investigate potential key factors in the fungal re-sponse contributing to, e.g., caspofungin-caused side ef-fects, we analyzed the underlying topological networkstructure of the ORM. We took into account the net-work node-associated degree (number of edges con-nected to the node) and betweenness centrality (numberof shortest paths that go through each node) [13]. Weidentified the node representing polyubiquitin UbiD withthe fifth highest degree (Table 2) and the third highestbetweenness centrality (Table 3). It was furthermore theonly node that could be found in the top ten lists ofboth measures. Ubiquitin is a highly conserved 76-residueprotein which can be found in all eukaryotic organisms [43].In Saccharomyces cerevisiae, the orthologous gene UBI4, oneout of four ubiquitin genes in yeast, was shown to be essen-tial for resistance to different stresses including high temper-atures and starvation [44].In addition to this topology-based approach, we also
applied an approach focused on transcription factors.Transcription factors play an important role in regulatingthe compensatory stress response to drugs. However, inmany cases, it is difficult to measure transcription factors’ ac-tivity since they are often constitutively expressed and/or ac-tivated posttranscriptionally. Therefore, we scanned theORM for transcription factors connected to DEG-associated
Table 1 Regulatory modules generated by ModuleDiscoverer
Underlying experimental dataset Number of nodes(components)
Number of edges(interactions)
Transcriptome 0.5 h 511 2967
Transcriptome 1 h 256 1336
Transcriptome 4 h 313 1604
Transcriptome 8 h 256 1208
Proteome 4 h 147 845
Proteome 8 h 124 520
Secretome 8 h 293 2413
Overall regulatory module 894 6111
Number of nodes (representing gene or protein components) and edges(representing interactions between the components) of the regulatorymodules received by ModuleDiscoverer
Conrad et al. BMC Systems Biology (2018) 12:88 Page 8 of 18

proteins, DSyPs or DSePs (Table 4). Among them, we de-tected the CBF/NF-Y family transcription factor. It showssimilarities to DNA polymerase epsilon subunit DPB4 of S.cerevisiae and Schizosaccharomyces pombe.Both polyubiquitin and the CBF/NF-Y family transcrip-
tion factor were detected in all transcriptome and, in caseof the CBF/NF-Y family transcription factor, proteometime points but neither as DEG nor as DSyP. Figure 6 rep-resents these two nodes and their respective first neigh-bors (including DEGs, DSyPs or DSePs) within the ORM.The investigation of potential key factors in the
drug-induced response, like polyubiquitin and CBF/NF-Y family transcription factor, may help to betterunderstand the position and dynamics of drug targetsand associated proteins in the interaction network andcan potentially contribute to increase the safety of drugs.
Caspofungin induces increased production of thesecondary metabolite fumagillinAs described above, the ORM contained two clusters,cluster 12 and 13, which included several enzymes thatare involved in the biosynthesis of secondary metabo-lites. In particular, transcripts and their correspondingproteins of the antimicrobial agent fumagillin biosyn-thesis gene cluster (11 out of 15 cluster genes) showed
increased levels after exposure of A. fumigatus to caspo-fungin. To verify whether caspofungin triggers the pro-duction of this meroterpenoid, we extracted A.fumigatus cultures exposed for 8 h to caspofungin(100 ng/ml) and control cultures with ethyl acetate anddetermined the fumagillin concentration by LC-MS. Incultures without caspofungin the concentration of fuma-gillin was 67.3 ± 21.7 μg/ml, while in cultures with cas-pofungin the concentration increased by 3-fold to 208.1± 63.8 μg/ml (Fig. 7). The level of other secondary me-tabolites such as pseurotin A stayed almost unchanged(Additional file 3).
Comparison of ModuleDiscoverer- and KeyPathwayMiner-generated regulatory modulesTo estimate the comprehensiveness of MD-generated regula-tory modules, we applied another available module-detectingapproach, KeyPathwayMiner (KPM), to our experi-mental datasets and compared the identified regula-tory modules with those identified by MD (Table 5).Table 5 shows the numbers of components of the
KPM-produced regulatory modules for each time point andthe overall regulatory module in comparison with thosebased on MD. Exemplarily, the comparison showed that theORM received by MD contains a 1.5-fold higher number of
Fig. 5 Overall regulatory module representing the response of A. fumigatus to caspofungin. The overall regulatory module identified byModuleDiscoverer is composed of five sub-modules including 894 components (see Additional file 2: Table S2). Clusters with exemplarily selectedsignificantly enriched biological processes are color-coded
Conrad et al. BMC Systems Biology (2018) 12:88 Page 9 of 18
Table
2Nod
esof
theoverallreg
ulatorymod
ulewith
high
estde
gree
CADRE-ID
sAspGD-ID
sProteinnames
Deg
ree
BClog2
FC
T0.5h
T1h
T4h
T8h
P4h
P8h
S8h
CADAFU
BP00004294
AFU
B_043760
Fattyacid
synthase
beta
subu
nit,pu
tative
146
0.126
−1.159
−0.628
−0.693
−0.828
−0.006
−0.136
0.534
CADAFU
BP00004295
AFU
B_043770
Fattyacid
synthase
alph
asubu
nitFasA,p
utative
142
0.082
−1.008
−0.517
−0.678
−0.726
−0.038
−0.105
1.448
CADAFU
BP00002402
AFU
B_024590
Acetyl-C
oAcarboxylase
124
0.122
−1.697
−0.812
−1.285
−1.380
−0.456
−0.628
1.518
CADAFU
BP00004404
AFU
B_044900
Non
ribosom
alpe
ptidesynthase
SidE
114
0.048
1.077
1.918
1.613
1.229
NA
NA
NA
CADAFU
BP00006564
AFU
B_067450
Polyub
iquitin
UbiD/Ubi4,pu
tative
111
0.396
−0.762
0.238
−0.248
−0.688
NA
NA
NA
CADAFU
BP00007473
AFU
B_076690
ATP
citratelyase,subu
nit1,pu
tative
980.037
−1.636
−0.705
−0.698
−0.584
−0.474
−0.521
0.683
CADAFU
BP00007537
AFU
B_077330
Bifunctio
nalp
yrim
idinebiosynthesisprotein
(PyrABC
N),pu
tative
820.073
−0.438
−0.468
−0.214
−0.974
−0.206
−0.340
1.586
CADAFU
BP00000761
AFU
B_007730
Glutamatesynthase
Glt1,putative
740.035
−2.168
−0.525
−0.119
−0.483
−0.255
−0.234
1.135
CADAFU
BP00001006
AFU
B_010250
Succinyl-CoA
synthe
tase,alpha
subu
nit,pu
tative
720.021
−0.497
−0.273
0.167
−0.011
0.234
0.069
NA
CADAFU
BP00003062
AFU
B_031240
Sulfite
redu
ctase,pu
tative
680.047
−0.900
−0.774
−0.103
−0.598
−0.016
−0.022
1.5
Toptenno
desof
theov
erallreg
ulatorymod
uleshow
ingthehigh
estde
gree
andad
ditio
nalinformationrega
rdingtheirbe
tweenn
esscentrality(BC)an
dge
ne-or
protein-associated
log2
Fold
Cha
nge(lo
g2FC
)measuredforthetran
scrip
tomic(T),proteo
mic(P)an
dsecretom
ic(S)fung
alrespon
seto
caspofun
ginat
alltim
epo
ints,respe
ctively
Conrad et al. BMC Systems Biology (2018) 12:88 Page 10 of 18

Table
3Nod
esof
theoverallreg
ulatorymod
ulewith
high
estbe
tweenn
esscentrality
CADRE-ID
sAspGD-ID
sProteinnames
Deg
ree
BClog2
FC
T0.5h
T1h
T4h
T8h
P4h
P8h
S8h
CADAFU
BP00007914
AFU
B_081260
Peptidyl-argininede
iminasedo
mainprotein
40.6
0.696
3.125
2.328
1.647
NA
NA
NA
CADAFU
BP00001626
AFU
B_016580
Long
-chain-fatty-acid-CoA
ligase,pu
tative
110.405
−1.395
−1.605
−0.406
−0.750
NA
NA
NA
CADAFU
BP00006564
AFU
B_067450
Polyub
iquitin
UbiD/Ubi4,pu
tative
111
0.396
−0.762
0.238
−0.248
−0.688
NA
NA
NA
CADAFU
BP00008739
AFU
B_089890
Mande
late
racemase/mucon
atelacton
izing
enzymefamily
protein
100.304
1.791
0.546
0.247
0.055
NA
NA
NA
CADAFU
BP00003378
AFU
B_034540
Lysoph
osph
olipase3
50.303
0.906
1.357
1.185
1.357
0.706
0.937
1.513
CADAFU
BP00002707
AFU
B_027690
Lysoph
osph
olipase
100.273
−1.454
−0.217
−0.854
−1.700
0.387
0.192
NA
CADAFU
BP00006379
AFU
B_065540
Patatin
-like
phosph
olipasedo
main-containing
protein
100.273
−0.639
−0.570
−0.931
−1.460
NA
NA
NA
CADAFU
BP00008747
AFU
B_089980
Ribo
somebiog
enesisprotein(Rrs1),p
utative
260.259
1.045
−0.096
−0.154
0.413
0.185
0.045
NA
CADAFU
BP00004062
AFU
B_041460
Plasmamem
braneATPase
40.25
−1.535
−0.670
−1.002
−1.152
0.041
−0.023
1.910
CADAFU
BP00005096
AFU
B_052070
Plasmamem
braneATPase
40.25
−0.378
−0.299
0.441
0.463
NA
NA
NA
CADAFU
BP00000491
AFU
B_004970
Alcoh
olde
hydrog
enase,zinc-con
taining,
putative
30.167
−1.712
−1.178
−1.125
−0.941
−0.759
−0.454
0.914
Toptenno
desof
theov
erallreg
ulatorymod
uleshow
ingthehigh
estbe
tweenn
esscentrality(BC)an
dad
ditio
nalinformationrega
rdingtheirno
dede
gree
andge
ne-or
protein-associated
log2
Fold
Cha
nge(lo
g2FC
)measuredforthetran
scrip
tomic(T),proteo
mic(P)an
dsecretom
ic(S)fung
alrespon
seto
caspofun
ginat
alltim
epo
ints,respe
ctively
Conrad et al. BMC Systems Biology (2018) 12:88 Page 11 of 18

Table
4Transcrip
tionfactorswith
intheoverallreg
ulatorymod
ule
CADRE-ID
sAspGD-ID
sProteinnames
log2
FC
T0.5h
T1h
T4h
T8h
P4h
P8h
S8h
CADAFU
BP00000978
AFU
B_009970
CBF/NF-Yfamily
transcrip
tionfactor,p
utative
0.230
0.447
−0.124
0.002
−0.034
−0.150
NA
CADAFU
BP00001789
AFU
B_018340
HLH
transcrip
tionfactor,p
utative
−1.441
−0.236
0.128
−0.355
NA
NA
NA
CADAFU
BP00003751
AFU
B_038290
Zinc
knuckletranscrip
tionfactor/splicing
factor
MSL5/ZFM1,pu
tative
0.366
0.062
0.111
0.143
−0.368
−0.322
3.379
CADAFU
BP00004232
AFU
B_043140
Transcrip
tionelon
gatio
nfactor
SPT6,p
utative
−0.369
−0.235
−0.177
−0.563
0.143
0.188
NA
CADAFU
BP00005084
AFU
B_051950
PHDtranscrip
tionfactor
(Rum
1),p
utative
−1.069
0.036
0.089
−0.780
−0.071
−0.042
NA
CADAFU
BP00007653
AFU
B_078520
Stress
respon
seregu
lator/HFS
transcrip
tion
factor,p
utative
0.317
−0.271
0.034
−0.102
−0.130
0.072
NA
CADAFU
BP00001318
AFU
B_013400
TFIIH
complex
helicaseRad3
,putative
0.154
0.034
−0.055
−0.226
−0.032
0.222
NA
CADAFU
BP00003811
AFU
B_038920
Ccr4-Not
transcrip
tioncomplex
subu
nit
(NOT1),pu
tative
−0.786
−0.076
0.038
−0.834
−0.100
−0.041
NA
Tran
scrip
tionfactorsde
tected
intheov
erallreg
ulatorymod
ulean
dtheirlog2
Fold
Cha
nge(lo
g2FC
)measuredforthetran
scrip
tomic(T),proteo
mic(P)an
dsecretom
ic(S)fung
alrespon
seto
caspofun
ginat
alltim
epo
ints,respe
ctively
Conrad et al. BMC Systems Biology (2018) 12:88 Page 12 of 18
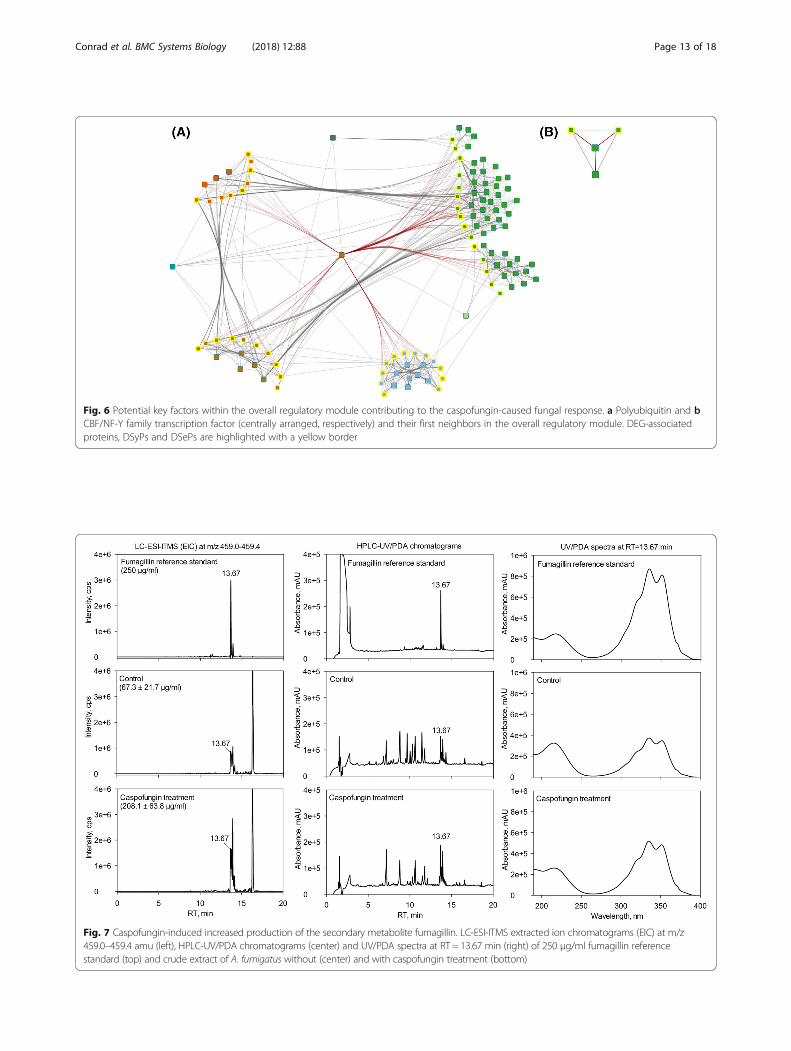
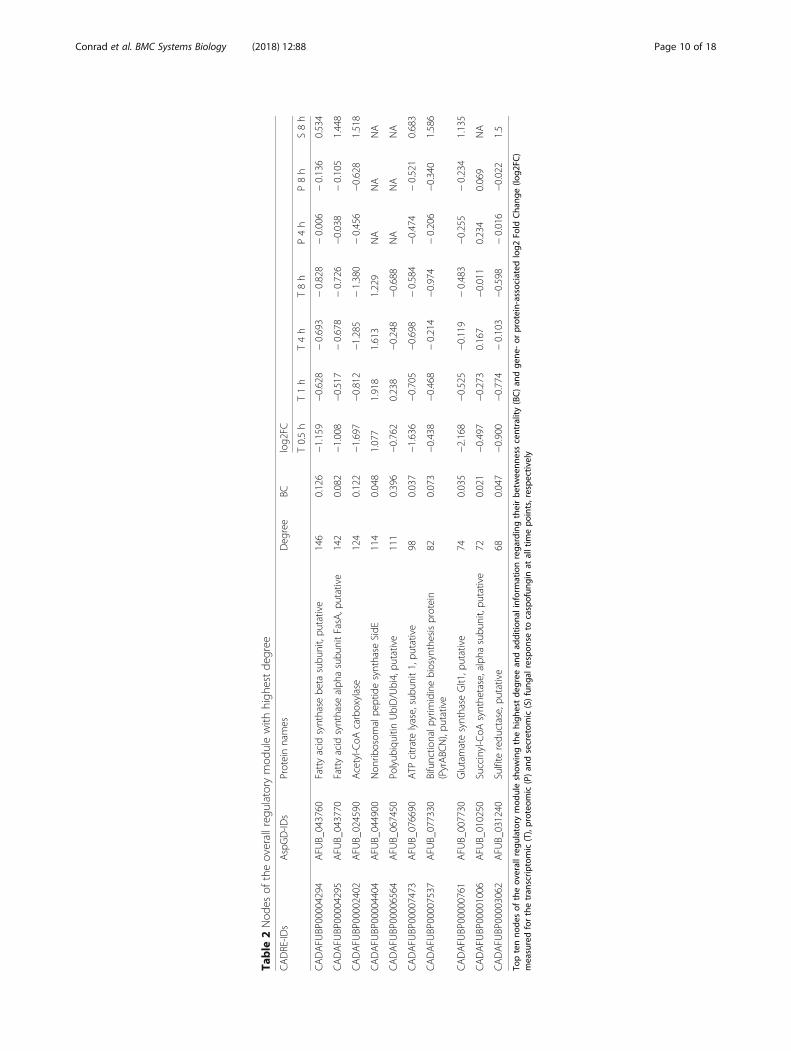
Fig. 6 Potential key factors within the overall regulatory module contributing to the caspofungin-caused fungal response. a Polyubiquitin and bCBF/NF-Y family transcription factor (centrally arranged, respectively) and their first neighbors in the overall regulatory module. DEG-associatedproteins, DSyPs and DSePs are highlighted with a yellow border
Fig. 7 Caspofungin-induced increased production of the secondary metabolite fumagillin. LC-ESI-ITMS extracted ion chromatograms (EIC) at m/z459.0–459.4 amu (left), HPLC-UV/PDA chromatograms (center) and UV/PDA spectra at RT = 13.67 min (right) of 250 μg/ml fumagillin referencestandard (top) and crude extract of A. fumigatus without (center) and with caspofungin treatment (bottom)
Conrad et al. BMC Systems Biology (2018) 12:88 Page 13 of 18

components by covering more than 60% of KPM modulecomponents. Considering the modules of the single timepoint datasets, e.g. secretome at 8 h, we found an up to6.5-fold higher component number by covering up to 93%of KPM components. Hence, we focused on the results re-ceived by MD. Nevertheless, additional KPM analyses re-garding the overlap of molecular levels and the estimationof the best match of transcriptomic and proteomic timepoints are shown in Additional file 2: Figures S1 and S2and Additional file 4.
DiscussionIn this study, we focused on the integration of omics dataderived from heterogeneous sources. Therefore, we usedexperimental data of an A. fumigatus study investigatingthe stress response to the antifungal drug caspofungin atdifferent molecular levels and time points. For the ana-lyses, we applied SA considering only DEGs/DSyPs/DSePsand the regulatory module-detecting single-seed MD ap-proach considering DEGs/DSyPs/DSePs, non-DEGs/DSyPs/DSePs as well as structural PPIN information. Wefocused on the single-seed approach instead of the alsoavailable multi-seed MD approach since the single-seedapproach is comparable with other well-established max-imal clique enumeration problem-based algorithms (e.g.,Barrenäs et al. [45] or Gustafsson et al. [46]). In addition,Vlaic et al. showed that the multi-seed-identified modulescan be essentially considered as an extension of thesingle-seed modules. However, we also applied themulti-seed approach to our experimental data set. In sum-mary, the multi-seed MD approach allows for effectivelyintegrating multilevel omics data. Multi-seed-generatedresults contain the regulatory modules received by thesingle-seed approach and are even more comprehensive.The overall regulatory module generated by the
multi-seed approach confirms the already observed keyplayers and significantly associated processes. Details onthe analyses can be found in the Additional files 2 and 5.
Relation of transcriptomic, proteomic and secretomicdataThe comparison of all three molecular levels regardingall measured, SA- or MD-considered components re-sulted in only small overlap values. This observation isin agreement with other integrative transcriptomic andproteomic studies reporting that there is no or only aweak correlation between different molecular levels [47–49]. Potential explanations are biological (e.g., transla-tional regulation or differences in protein and mRNAhalf-lives in vivo) or methodological origins (e.g., detec-tion limits of the techniques or the choice of measuredtime points) [48, 49]. Figures 2a and 3 show an appar-ently contradictory outcome regarding the overlap ofdatasets of different molecular levels: Fig. 2a shows thehighest overlap percentage value for transcriptome andproteome, Fig. 3 for proteome and secretome. This canbe explained by the fact that Figs. 2a and 3 are based onanalyses that considered diverse datasets. For Fig. 2a, alldetected genes and proteins were analyzed. In contrast,Fig. 3 comprises only a fraction of these components be-cause of a further filtering step to only compare DEGs/DSyPs/DSePs (SA) or regulatory module components(DEGs/DSyPs/DSePs and associated background pro-teins, MD). Actually, in Fig. 3, both approaches MD andSA showed the highest overlap between proteome andsecretome. On the one hand, this highest overlap per-centage reflects the same underlying measurement tech-nique. In this study, the transcriptome was measured byRNA-Seq, the proteome and secretome by LC-MS/MS.As the techniques themselves are very different, also dif-ferences in their respective outcome can be expected.Therefore, as the intracellular proteome and secretomeare based on the same measurement technique, they aremore similar to each other than, for instance, transcrip-tome and proteome. On the other hand, the highestoverlap also demonstrates the biological similarity interms of immediately consecutive protein-based levels.Thus, both levels consist of proteins which differ only inthe secretion step via classical (i.e., N-terminal secretorysignal peptide triggered) or non-classical (i.e., withoutinvolvement of N-terminal signal peptides) secretorypathways [50]. Hence, proteome and secretome can beconsidered as immediately consecutive levels which canboth be measured by LC-MS/MS.By a general comparison of MD- and SA-received re-
sults, we determined up to 12-fold higher overlap valuesprovided by MD than those calculated by SA. This isreasonable as SA focuses on the comparison of lists ofDEGs, DSyPs and DSePs, exclusively. Hence, non-DEGs/
Table 5 Comparison of ModuleDiscoverer- andKeyPathwayMiner-detected regulatory modules
Underlyingexperimental dataset
Componentnumber of MDmodules
Overlap(percentagevalue regardingKPM module)
Componentnumber ofKPM modules
Transcriptome 0.5 h 511 134 (75.7%) 177
Transcriptome 1 h 256 62 (63.9%) 97
Transcriptome 4 h 313 123 (74.1%) 166
Transcriptome 8 h 256 89 (65.0%) 137
Proteome 4 h 147 36 (75.0%) 48
Proteome 8 h 124 30 (63.8%) 47
Secretome 8 h 293 42 (93.3%) 45
Overall regulatorymodule
894 343 (59.6%) 576
Comparison of ModuleDiscoverer (MD) and KeyPathwayMiner (KPM) regardingtheir number of module components. The overlap is defined as fraction of theintersection of the respective datasets from the KPM datasets
Conrad et al. BMC Systems Biology (2018) 12:88 Page 14 of 18

DSyPs/DSePs measured in the experimental backgroundwere not considered which results in a high loss of datafor the analyses. In contrast, the additional informationconsidered by MD led to a much higher number of(overlapping) components.
Analysis of the overall fungal response and potential keyfactorsWith the aid of the ORM, we analyzed the A. fumigatus re-sponse to caspofungin over all molecular levels and timepoints. We found that ORM clusters are significantlyenriched with biological functions like (1,3)-alpha-D-glucanbiosynthesis and carbohydrate metabolic processes, actinfilament-based processes, activation of protein kinase activityand response to oxidative stress. These results are in agree-ment with a genome-wide expression profiling study ofAspergillus niger in response to caspofungin [51]. Here, manyof the upregulated genes were predicted or confirmed tofunction in cell wall assembly and remodeling, cytoskeletalorganization, signaling and oxidative stress response. Also,genes and proteins of the electron transport chain were spe-cifically enriched which supports the hypothesis that caspo-fungin acts as an effector of mitochondrial oxidativephosphorylation [52]. This is consistent with results fromCagas et al. [47] who analyzed the proteomic response of A.fumigatus to caspofungin and identified the largest change ina mitochondrial protein that has a role in mitochondrial re-spiratory chain complex IV assembly. The significant enrich-ment of genes and proteins of the amino acid metabolicprocess is best explained by the growth inhibitory activity ofcaspofungin that leads to the downregulation of the primarymetabolisms including amino acid biosynthesis [53].The cluster 5 represents (gene-associated) proteins in-
volved in the activation of protein kinase activity.Mitogen-activated kinases (MAPK) are important regula-tors in the fungal response to stress that is induced by en-vironmental changes or the disruption of cell wall integrity([54], and references therein) which are both consequencesof the caspofungin treatment. Also cellular transport mech-anisms were influenced by this antifungal drug leading toosmotic stress as already reported in Altwasser et al. [26].In addition, we observed the association of ORM clustercomponents with the (1,3)-alpha-D-glucan biosynthesis aswell as carbohydrate metabolic processes. Consistently, cas-pofungin inhibits the synthesis of β-(1,3)-glucan which isthe principal component of the fungal cell wall [55]. As acompensatory response, the production of other cell wallpolymers was stimulated. Another interesting finding wasthe increased production of the secondary metabolite fuma-gillin upon exposure of A. fumigatus to caspofungin. So far,only the release of the secondary metabolite gliotoxin hasbeen reported for cultures of A. fumigatus in the presenceof caspofungin [56]. Fumagillin has anti-angiogenic activity[57] and induces cell death in erythrocytes [58]. It is
therefore possible that administration of caspofungin in-duces the production of secondary metabolites that haveadverse effects on host cells during the infection. Anotherinteresting aspect of our finding is that the induction offumagillin production upon caspofungin exposure may rep-resent a form of ‘microbial communication’ between fungi,in particular taking into account that echinocandins likecaspofungin are produced by a diverse set of fungi [59].As Wang et al. [13] reported, studying key factors of a
drug-induced response by analyzing the underlying net-work structure may help to better understand the positionand dynamics of drug targets and associated proteins po-tentially involved in drug-caused side effects. Here, inaddition to the main target β-(1,3)-D-glucan synthase, wedetected polyubiquitin UbiD among the top five nodes ofthe ORM ranked by both node degree and betweennesscentrality. Polyubiquitin is known to encode multipleubiquitin units in tandem, each of these transcribed as asingle transcript. It is involved in several metabolic path-ways and plays an important role in the regulation of theproteasome-based protein degradation processes [43, 60].Some recent studies have already reported the importanceof polyubiquitin in the fungal stress response. In the patho-genic yeast Candida albicans, Leach et al. [61] have shownthat polyubiquitin is required for the adaption to suddenstress induced, e.g., by heat or caspofungin and is criticalfor the fungus’ pathogenicity. In another study in S. cerevi-siae, Lesage et al. [62] described ubiquitin-related proteindegradation as an important process in the compensationfor defects in glucan biosynthesis. We hypothesize thatpolyubiquitin is an important player in the compensatoryresponse of A. fumigatus to caspofungin. In line, the corre-sponding gene ubi4 was shown to be induced uponheat-shock in A. nidulans [43].Exemplarily, CBF/NF-Y family transcription factor was
detected among the list of TFs. Its C. albicans orthologDPB4 represents a putative DNA polymerase epsilonsubunit D and was shown to be involved in filamentousgrowth and maintenance of the mitochondrial DNAgenome [63]. This role in mitochondrial processes inconjunction with caspofungin treatment is in agreementwith the in previous studies shown importance of mito-chondrial functions for drug tolerance and virulence offungal pathogens ([47], and references therein). Also forC. albicans, Khamooshi et al. [64] have reported that de-letion of DPB4 results in a decreased resistance to cas-pofungin in drop plate assays. These facts could indicatean involvement of CBF/NF-Y family transcription factorin the resistance of A. fumigatus to caspofungin.Interestingly, in our study, both the polyubiquitin and
the CBF/NF-Y family transcription factor were detectedin all transcriptome and, in case of CBF/NF-Y familytranscription factor, proteome time points but neither asDEG nor as DSyP. However, their location within the
Conrad et al. BMC Systems Biology (2018) 12:88 Page 15 of 18

ORM had shown that they are closely related to DEGs,DSyPs or DSePs. Consequently, by considering DEGs,DSyPs or DSePs for data analyses by SA, these proteinswould not have been taken into account as factors in thefungal response despite the fact that they likely have astrong influence on DEGs, DSyPs or DSePs as shown inthe ORM. To our knowledge, the role of both the polyu-biquitin and the CBF/NF-Y family transcription factorhas not been examined yet in the context ofcaspofungin-induced stress in A. fumigatus. Hence, ouranalyses offer novel hypotheses which have to be verifiedin future studies.
The module-detecting approach KeyPathwayMinerIn addition to MD, also other approaches identifying regu-latory modules are available, for instance, KPM. Similar toMD, KPM can be used for the analyses of both,single-level and multilevel omics data. However, it doesnot make assumptions about community structures. KPMcombines DEGs, DSyPs or DSePs with non-DEG/DSyP/DSeP exception nodes acting as ‘bridges’ to detect max-imal connected sub-networks [15]. The comparison ofMD- and KPM-generated regulatory modules showed thatMD generates modules with a significant higher numberof components than KPM. Additionally, these MD modulecomponents cover most of the KPM components. Asthese findings indicate that MD-generated modules aremore comprehensive than modules derived by KPM, wefocused on the results obtained by MD.
PPIN information as limiting factorThe basis of module-detecting approaches like MD orKPM is information from underlying organism-specificPPINs. Hence, the quality of results provided by theseapproaches also depends on the comprehensiveness ofthe underlying PPIN itself. Only those components ofthe experimental data which do also occur in the PPINare considered for the regulatory module. For example,the PPIN of A. fumigatus strain A1163 downloaded fromSTRING consists of 4123 proteins. But according tocurrent information provided by CADRE, the fungus it-self is known to comprise 9916 protein-coding genes.Hence, more than half of the known fungal componentscannot be considered for analyses based on this PPIN.Consequently, the available PPIN information can beconsidered as limiting factor in the data analyses. Thus,while our results highlight the benefits and potentialprovided by the regulatory module detection-based ana-lysis of multilevel omics data, future studies will have tofocus on the expansion of organism-specific PPINs.
ConclusionPPINs enable the consideration of both structural and func-tional relationships between network proteins. Thus, they
facilitate a focused view on closely related components interms of modules. In this study, we demonstrated so far un-tested capacity of the module-detecting MD approach tointegrate omics data coming from different molecular levelsand time points. Moreover, we showed that this level of in-tegration is not achievable using a simple approach of com-paring lists of DEGs/DSyPs/DSePs. The integration of thesedata in one ORM can provide an overview of the overall or-ganism’s response to an external stimulus. We presentedseveral approaches for analyzing this response and potentialkey factors contributing to, e.g., drug-caused side effects inmore detail. With the aid of the regulatory module-detect-ing approach, it is possible to identify potential responsekey factors which cannot be detected in commonly usedapproaches comparing DEGs, DSyPs and DSePs,exclusively.
Additional files
Additional file 1: Lists of differentially expressed genes, differentiallysynthesized proteins and differentially secreted proteins. (XLSX 227 kb)
Additional file 2: Supplementary Materials. (PDF 3110 kb)
Additional file 3: Quantification of the secondary metabolitesfumagillin and pseurotin A. (XLSX 21 kb)
Additional file 4: KeyPathwayMiner-generated overall regulatorymodule and significantly enriched biological processes. (XLSX 55 kb)
Additional file 5: Significantly enriched biological processes of the MD-multi-seed-based overall regulatory module. (XLSX 49 kb)
AcknowledgementsThe authors would like to thank Silke Steinbach for excellent technicalassistance. We also thank Dominik Driesch for fruitful discussions.
FundingThis work was supported by the Jena School for Microbial Communication(JSMC) [to TC], Deutsche Forschungsgemeinschaft (DFG) CRC/Transregio 124‘Pathogenic fungi and their human host: Networks of interaction’(subprojects A1 [to AAB], C5 [to IJ], INF [to JL, RG] and Z2 [to OK, TK]),Thüringer Aufbaubank (TAB) [to JL] and the German Federal Ministry ofEducation & Research (BMBF FKZ 0315439) [to AAB, VV].
Availability of data and materialsThe datasets supporting the conclusion of this article are included within thearticle and its additional files. The mass spectrometry proteomics data havebeen deposited to the ProteomeXchange Consortium via the PRIDE [65]partner repository with the dataset identifier PXD008153. The RNA-Seq datathat support the findings of this study are available as mentioned in Altwas-ser et al. [26].
Authors’ contributionsTC, SGH, TK, JL and SV performed the data analyses. OK, DJM and VVperformed the experiments. TC, OK, SGH, RG, IDJ, AAB, SV and JL interpretedthe results. TC, OK, TK, SV and JL wrote the paper. All authors read andapproved the final manuscript.
Ethics approval and consent to participateNot applicable.
Consent for publicationNot applicable.
Competing interestsThe authors declare that they have no competing interests.
Conrad et al. BMC Systems Biology (2018) 12:88 Page 16 of 18

Publisher’s NoteSpringer Nature remains neutral with regard to jurisdictional claims inpublished maps and institutional affiliations.
Author details1Systems Biology/Bioinformatics, Leibniz Institute for Natural ProductResearch and Infection Biology – Hans Knöll Institute, Jena, Germany.2Molecular and Applied Microbiology, Leibniz Institute for Natural ProductResearch and Infection Biology – Hans Knöll Institute, Jena, Germany.3BioControl Jena GmbH, Jena, Germany. 4Biobricks of Microbial NaturalProduct Syntheses, Leibniz Institute for Natural Product Research andInfection Biology – Hans Knöll Institute, Jena, Germany. 5MicrobialImmunology, Leibniz Institute for Natural Product Research and InfectionBiology – Hans Knöll Institute, Jena, Germany. 6Institute for Microbiology,Friedrich Schiller University, Jena, Germany. 7Research Group PiDOMICs,Leibniz Institute for Natural Product Research and Infection Biology – HansKnöll Institute, Jena, Germany. 8Institute for Bacterial Infections andZoonoses, Federal Research Institute for Animal Health – Friedrich LoefflerInstitute, Jena, Germany. 9Present address: PerkinElmer Inc., Rodgau,Germany.
Received: 12 March 2018 Accepted: 8 October 2018
References1. Ebrahim A, Brunk E, Tan J, O’Brien EJ, Kim D, Szubin R, et al. Multi-omic data
integration enables discovery of hidden biological regularities. NatCommun. 2016;7:13091.
2. Wu Y, Williams EG, Dubuis S, Mottis A, Jovaisaite V, Houten SM, et al.Multilayered genetic and omics dissection of mitochondrial activity in amouse reference population. Cell. 2014;158:1415–30. https://doi.org/10.1016/j.cell.2014.07.039.
3. Chen R, Mias GI, Li-Pook-Than J, Jiang L, Lam HYK, Chen R, et al. Personalomics profiling reveals dynamic molecular and medical phenotypes. Cell.2012;148:1293–307.
4. Aebersold R, Mann M. Mass-spectrometric exploration of proteomestructure and function. Nature. 2016;537:347–55.
5. Michalski A, Cox J, Mann M. More than 100,000 detectable peptide specieselute in single shotgun proteomics runs but the majority is inaccessible todata-dependent LC-MS/MS. J Proteome Res. 2011;10:1785–93.
6. List M, Alcaraz N, Dissing-Hansen M, Ditzel HJ, Mollenhauer J, Baumbach J.KeyPathwayMinerWeb: online multi-omics network enrichment. NucleicAcids Res. 2016;44:W98–104.
7. Peng C, Li A, Wang M. Discovery of bladder Cancer-related genes usingintegrative heterogeneous network modeling of multi-omics data. Sci Rep.2017;7:15639.
8. Hua J, Koes D, Kou Z. Finding motifs in protein-protein interaction networks.Proj Final Rep. 2003. www.cs.cmu.edu/~dkoes/research/prot-prot.pdf.
9. Tornow S. Functional modules by relating protein interaction networks andgene expression. Nucleic Acids Res. 2003;31:6283–9. https://doi.org/10.1093/nar/gkg838.
10. Stuart JM, Segal E, Koller D, Kim SK. A gene-coexpression network for globaldiscovery of conserved genetic modules. Science (80- ). 2003;302:249–55.
11. Trevino V, Cassese A, Nagy Z, Zhuang X, Herbert J, Antzack P, et al. Anetwork biology approach identifies molecular cross-talk between Normalprostate epithelial and prostate carcinoma cells. PLoS Comput Biol. 2016;12(4):e1004884.
12. McGee SR, Tibiche C, Trifiro M, Wang E. Network analysis reveals a signalingregulatory loop in the PIK3CA-mutated breast Cancer predicting survivaloutcome. Genomics Proteomics Bioinformatics. 2017;15:121–9.
13. Wang X, Thijssen B, Yu H. Target essentiality and centrality characterize drugside effects. PLoS Comput Biol. 2013;9(7):e1003119.
14. Hartwell LH, Hopfield JJ, Leibler S, Murray AW. From molecular to modularcell biology. Nature. 1999;402:C47–52. https://doi.org/10.1038/35011540.
15. Ulitsky I, Shamir R. Identification of functional modules using networktopology and high-throughput data. BMC Syst Biol. 2007;1:8.
16. Segal E, Shapira M, Regev A, Pe’er D, Botstein D, Koller D, et al. Modulenetworks: identifying regulatory modules and their condition-specificregulators from gene expression data. Nat Genet. 2003;34:166–76.
17. Ulitsky I, Krishnamurthy A, Karp RM, Shamir R. DEGAS: De novo discovery ofdysregulated pathways in human diseases. PLoS One. 2010;5(10):e13367.
18. Alcaraz N, Pauling J, Batra R, Barbosa E, Junge A, Christensen AGL, et al.KeyPathwayMiner 4.0: condition-specific pathway analysis by combiningmultiple omics studies and networks with Cytoscape. BMC Syst Biol.2014;8:99.
19. Vlaic S, Conrad T, Tokarski-Schnelle C, Gustafsson M, Dahmen U, Guthke R,et al. ModuleDiscoverer: identification of regulatory modules in protein-protein interaction networks. Sci Rep. 2018;8(1):433.
20. Van De Veerdonk FL, Gresnigt MS, Romani L, Netea MG, Latgé JP. Aspergillusfumigatus morphology and dynamic host interactions. Nat Rev Microbiol.2017;15:661–74.
21. Moreno-Velásquez SD, Seidel C, Juvvadi PR, Steinbach WJ, Read ND.Caspofungin-mediated growth inhibition and paradoxical growth inAspergillus fumigatus involve fungicidal hyphal tip lysis coupled withregenerative intrahyphal growth and dynamic changes in β-1,3-glucansynthase localization. Antimicrob Agents Chemother. 2017;61. https://doi.org/10.1128/AAC.00710-17.
22. Spriggs KA, Bushell M, Willis AE. Translational regulation of gene expressionduring conditions of cell stress. Mol Cell. 2010;40:228–37.
23. Huber W, Carey VJ, Gentleman R, Anders S, Carlson M, Carvalho BS, et al.Orchestrating high-throughput genomic analysis with Bioconductor. NatMethods. 2015;12:115–21.
24. da Silva Ferreira ME, Kress MR, Savoldi M, Goldman MH, Härtl A, HeinekampT, et al. The akuB KU80 mutant deficient for nonhomologous end joining isa powerful tool for analyzing pathogenicity in Aspergillus fumigatus.Eukaryot Cell. 2006;5:207–11.
25. Brakhage AA, Van den Brulle J. Use of reporter genes to identifyrecessive trans-acting mutations specifically involved in the regulationof Aspergillus nidulans penicillin biosynthesis genes. J Bacteriol. 1995;177:2781–8.
26. Altwasser R, Baldin C, Weber J, Guthke R, Kniemeyer O, Brakhage AA, et al.Network modeling reveals cross talk of MAP kinases during adaptation tocaspofungin stress in aspergillus fumigatus. PLoS One. 2015;10(9):e0136932.
27. Cerqueira GC, Arnaud MB, Inglis DO, Skrzypek MS, Binkley G, Simison M, etal. The Aspergillus genome database: multispecies curation andincorporation of RNA-Seq data to improve structural gene annotations.Nucleic Acids Res. 2014;42:D705–10.
28. Mabey J, Anderson M, Giles P, Miller C, Attwood T, Paton N, et al. CADRE:the central Aspergillus data REpository. Nucleic Acids Res. 2004;1:D401–5.
29. Durinck S, Spellman PT, Birney E, Huber W. Mapping identifiers for theintegration of genomic datasets with the R/ Bioconductor packagebiomaRt. Nat Protoc. 2009;4:1184–91.
30. Baldin C, Valiante V, Krüger T, Schafferer L, Haas H, Kniemeyer O, et al.Comparative proteomics of a tor inducible Aspergillus fumigatus mutantreveals involvement of the Tor kinase in iron regulation. Proteomics. 2015;15:2230–43.
31. Aspergillus fumigatus Af293 Sequence. www.aspergillusgenome.org/download/sequence/A_fumigatus_Af293/current/A_fumigatus_Af293_current_orf_trans_all.fasta.gz. Accessed 27 Sept 2015.
32. Jöhnk B, Bayram Ö, Abelmann A, Heinekamp T, Mattern DJ, Brakhage AA, etal. SCF ubiquitin ligase F-box protein Fbx15 controls nuclear co-repressorlocalization, stress response and virulence of the human pathogenAspergillus fumigatus. PLoS Pathog. 2016;12:e1005899–9.
33. Szklarczyk D, Franceschini A, Wyder S, Forslund K, Heller D, Huerta-Cepas J,et al. STRING v10: protein-protein interaction networks, integrated over thetree of life. Nucleic Acids Res. 2015;43:D447–52.
34. Shannon P, Markiel A, Ozier O, Baliga NS, Wang JT, Ramage D, et al.Cytoscape: a software environment for integrated models of biomolecularinteraction networks. Genome Res. 2003;13:2498–504.
35. Yip AM, Horvath S. Gene network interconnectedness and the generalizedtopological overlap measure. BMC Bioinformatics. 2007;8:22.
36. Neuwirth E. RColorBrewer: ColorBrewer palettes. R Package version 11–2.2014. https://CRAN.R-project.org/package=RColorBrewer.
37. Langfelder P, Horvath S. WGCNA: an R package for weighted correlationnetwork analysis. BMC Bioinformatics. 2008;9:559.
38. Pagès H, Carlson M, Falcon S, Li N. AnnotationDbi: Annotation DatabaseInterface. R Package version 1382. 2017.
39. Morgan M, Falcon S, Gentleman R. GSEABase: Gene set enrichment datastructures and methods. R Package version 1382. 2017.
40. Carlson M. GO.db: A set of annotation maps describing the entire GeneOntology. R Package version 341. 2017.
Conrad et al. BMC Systems Biology (2018) 12:88 Page 17 of 18

41. Falcon S, Gentleman R. Using GOstats to test gene lists for GO termassociation. Bioinformatics. 2007;23:257–8.
42. Gentleman R. Category: Category Analysis. R Package version 2421. 2017.43. Noventa-Jordão MA, do Nascimento AM, Goldman MH, Terenzi HF,
Goldman GH. Molecular characterization of ubiquitin genes from Aspergillusnidulans: mRNA expression on different stress and growth conditions.Biochim Biophys Acta. 2000;1490:237–44 http://www.ncbi.nlm.nih.gov/pubmed/10684969.
44. Finley D, Özkaynak E, Varshavsky A. The yeast polyubiquitin gene is essentialfor resistance to high temperatures, starvation, and other stresses. Cell. 1987;48:1035–46.
45. Barrenäs F, Chavali S, Alves AC, Coin L, Jarvelin MR, Jörnsten R, et al. Highlyinterconnected genes in disease-specific networks are enriched for disease-associated polymorphisms. Genome Biol. 2012;13(6):R46.
46. Gustafsson M, Edström M, Gawel D, Nestor CE, Wang H, Zhang H, et al.Integrated genomic and prospective clinical studies show the importanceof modular pleiotropy for disease susceptibility, diagnosis and treatment.Genome Med. 2014;6(2):17.
47. Cagas SE, Jain MR, Li H, Perlin DS. Profiling the Aspergillus fumigatusproteome in response to caspofungin. Antimicrob Agents Chemother.2011;55:146–54.
48. Nie L, Wu G, Culley DE, Scholten JCM, Zhang W. Integrative analysis oftranscriptomic and proteomic data: challenges, solutions and applications.Crit Rev Biotechnol. 2007;27:63–75.
49. Albrecht D, Guthke R, Brakhage AA, Kniemeyer O. Integrative analysis of theheat shock response in Aspergillus fumigatus. BMC Genomics. 2010;11:32.
50. Bendtsen JD, Jensen LJ, Blom N, Von Heijne G, Brunak S. Feature-basedprediction of non-classical and leaderless protein secretion. Protein Eng DesSel. 2004;17:349–56.
51. Meyer V, Damveld RA, Arentshorst M, Stahl U, Van Den Hondel CAMJJ, RamAFJ. Survival in the presence of antifungals: genome-wide expressionprofiling of aspergillus niger in response to sublethal concentrations ofcaspofungin and fenpropimorph. J Biol Chem. 2007;282:32935–48.
52. Shingu-Vazquez M, Traven A. Mitochondria and fungal pathogenesis: drugtolerance, virulence, and potential for antifungal therapy. Eukaryot Cell.2011;10:1376–83.
53. Bowman JC, Hicks PS, Kurtz MB, Rosen H, Schmatz DM, Liberator PA, et al. Theantifungal echinocandin caspofungin acetate kills growing cells of Aspergillusfumigatus in vitro. Antimicrob Agents Chemother. 2002;46:3001–12.
54. May GS, Xue T, Kontoyiannis DP, Gustin MC. Mitogen activated proteinkinases of Aspergillus fumigatus. Med Mycol. 2005;43(Suppl 1):S83–6.
55. Mayr A, Aigner M, Lass-Flörl C. Caspofungin: when and how? Themicrobiologist’s view. Mycoses. 2012;55:27–35.
56. Eshwika A, Kelly J, Fallon JP, Kavanagh K. Exposure of Aspergillus fumigatusto caspofungin results in the release, and de novo biosynthesis, of gliotoxin.Med Mycol. 2013;51:121–7.
57. Sin N, Meng L, Wang MQW, Wen JJ, Bornmann WG, Crews CM. The anti-angiogenic agent fumagillin covalently binds and inhibits the methionineaminopeptidase, MetAP-2. Proc Natl Acad Sci. 1997;94:6099–103. https://doi.org/10.1073/pnas.94.12.6099.
58. Zbidah M, Lupescu A, Jilani K, Lang F. Stimulation of suicidal erythrocytedeath by fumagillin. Basic Clin Pharmacol Toxicol. 2013;112:346–51.
59. Netzker T, Fischer J, Weber J, Mattern DJ, König CC, Valiante V, et al.Microbial communication leading to the activation of silent fungalsecondary metabolite gene clusters. Front Microbiol. 2015;6:299.
60. Alfano C, Faggiano S, Pastore A. The ball and chain of Polyubiquitinstructures. Trends Biochem Sci. 2016;41:371–85.
61. Leach MD, Stead DA, Argo E, Maccallum DM, Brown AJP. Molecular andproteomic analyses highlight the importance of ubiquitination for the stressresistance, metabolic adaptation, morphogenetic regulation and virulenceof Candida albicans. Mol Microbiol. 2011;79:1574–93.
62. Lesage G, Sdicu AM, Ménard P, Shapiro J, Hussein S, Bussey H. Analysis of β-1,3-glucan assembly in Saccharomyces cerevisiae using a syntheticinteraction network and altered sensitivity to caspofungin. Genetics. 2004;167:35–49.
63. Skrzypek MS, Binkley J, Binkley G, Miyasato SR, Simison M, Sherlock G. TheCandida genome database (CGD): incorporation of assembly 22, systematicidentifiers and visualization of high throughput sequencing data. NucleicAcids Res. 2017;45:D592–6.
64. Khamooshi K, Sikorski P, Sun N, Calderone R, Li D. The Rbf1, Hfl1 and Dbp4of Candida albicans regulate common as well as transcription factor-specificmitochondrial and other cell activities. BMC Genomics. 2014;15:56.
65. Vizcaíno JA, Csordas A, Del-Toro N, Dianes JA, Griss J, Lavidas I, et al. 2016update of the PRIDE database and its related tools. Nucleic Acids Res. 2016;44:D447–56.
Conrad et al. BMC Systems Biology (2018) 12:88 Page 18 of 18