module assembly capacity - alberta, canada assembly capacity of alberta module constructors, ... the...
TRANSCRIPT

NSERC INDUSTRIAL RESEARCH CHAIR IN
CONSTRUCTION ENGINEERING & MANAGEMENT
MODULE ASSEMBLY CAPACITY
A Study of Alberta Module Constructors
June, 2014
_______________________________________________________
Prepared by:
Ronald Ekyalimpa, PhD Candidate
Maria Al-Hussein, Project Coordinator
Dr. Simaan AbouRizk, Supervisor
Gary Trigg, Vice President, Fabrication, PCL Industrial Constructors Inc.
Fred Haney, Executive Director, Design Engineering, Fluor Corporation
Hole School of Construction Engineering
Department of Civil & Environmental Engineering

TABLE OF CONTENTS
EXECUTIVE SUMMARY ............................................................................................................ 1
1.0 INTRODUCTION ............................................................................................................... 2
1.1 MODULES AND MODULARIZATION ........................................................................... 2
1.1.1 Definition ...................................................................................................................... 2
1.1.2 Types of Modules ......................................................................................................... 2
1.1.3 Evolution of Modules ................................................................................................... 4
1.1.4 Module Yard ................................................................................................................. 5
2.0 ASSUMPTIONS MADE IN THIS STUDY........................................................................ 6
3.0 METHODOLOGY .............................................................................................................. 7
4.0 ANALYSIS AND RESULTS .............................................................................................. 8
4.1 MODULE FABRICATION YARDS OPERATED BY EACH COMPANY IN
ALBERTA ...................................................................................................................................... 8
4.1.1 Trendlines Showing Variations in the Number of Yards and Corresponding Module
Fabrication Capacity ................................................................................................................... 9
4.2 TOTAL MODULE YARD RESIDENT CAPACITY AND CAPACITIES BY MODULE
TYPE 10
4.3 SIZES OF THE MODULE YARDS ................................................................................. 13
4.4 DETAILS OF WORKERS IN THE MODULE YARDS.................................................. 14
4.4.1 Supervisor – Craft Worker Ratio ................................................................................ 15
4.5 AGE OF THE MODULE YARDS .................................................................................... 15
4.6 MODULE DENSITY AND WORKER DENSITY IN THE MODULE YARDS............ 16
4.6.1 Module Density in the Module Yards ........................................................................ 16
4.6.2 Worker Density in the Module Yards ......................................................................... 17
4.7 ANALYSIS BASED ON THE CATEGORIZATION OF THE MODULE YARDS ...... 17
4.7.1 Categorization of Module Yards by Resident Capacity ............................................. 17

4.7.2 Categorization of Module Yards by their Size ........................................................... 18
5.0 CONCLUSIONS AND RECOMMENDATIONS ............................................................ 19
ACKNOWLEDGEMENT ............................................................................................................ 21
ETHICS APPROVAL .................................................................................................................. 21
APPENDIX – CUMULATIVE DENSITY FUNCTION CHARTS FOR THE DIFFERENT
ATTRIBUTES OF THE MODULE YARDS............................................................................... 22

1
EXECUTIVE SUMMARY
The Canadian heavy industrial sector is facing an increase in international competition. A
workshop was held at the Modular Offsite Construction Summit (in 2012 in Edmonton, Alberta),
to discuss issues in Alberta heavy industrial modular construction. As a result of these
discussions, a steering committee was built to oversee and coordinate activities on behalf of
module constructors operating in the Alberta industrial construction sector.
Working with the University of Alberta NSERC Industrial Research Chair in Construction
Engineering and Management, the committee began an independent study to establish the true
module assembly capacity of Alberta module constructors, in order to better understand their
competitiveness. The study targeted 18 major module constructor companies operating in
Alberta, and 17 responded to the questionnaire. Although some participating companies
indicated that they own and operate module yards outside Alberta, these modules were not
considered in the analysis and results presented in this report. The report summarizes the
findings of the survey.
Based on the collected data, the total determined resident module assembly capacity is 1,418
modules. Of these modules, 25.32% represented capacity from pipe rack, 20.52% process
modules, 13.47% E-houses, 15.23% building modules, 11.71% stair modules and 13.75%
electrical modules. Results indicated that each module yard has an average of 50.64 modules.
Data from participating companies revealed there is a minimum of 28 module yards operated in
Alberta. These yards utilize a total of 947 acres of land. Results from the study further indicated
that on average, module yards have been in operation for 9.97 years, have an average size of
32.66 acres, and have a resident capacity of 50.64 modules. The study further revealed module
yards on average can hold 1.64 modules per acre.
Analysis of the data on the workforce engaged in module yards indicated during typical seasons,
module yards have an average of 234 craft workers and 24 supervisors per yard. The analysis
further revealed on average, to cope with the work load at peak times, the number of craft
workers is increased by 54.27% and the number of supervisors is increased by an average of
66.67%.
The study established the most commonly fabricated module type is the pipe rack module,
followed by equipment module. The least fabricated module type is the stair module. This trend
could be attributed to the requirements and configurations of the projects the companies
undertake and the nature in which these companies do business.
2
1.0 INTRODUCTION
The objective of this study was to obtain information regarding the module assembly capacity of
module constructors operating in Alberta. Collection of this information is the first step in
understanding and improving the competitiveness of Alberta module constructors, which is
necessary in order to improve competitiveness, especially as international competition increases.
This report summarizes the analysis performed. Basic statistics about module yards, organized
by geographic location, are presented. Then an analysis is run on all module yards collectively
and statistics reported on different module yard attributes such as age, size, workers and resident
capacity. Statistical distributions are also fitted to each of these parameters for the collective set
of module yards. Finally, module yards are independently grouped based on module size
criterion and then by resident capacity criterion. Characteristics of module yards within each
group are then analyzed and reported.
An overview of module products and facilities are briefly discussed in the following sections
before the findings of the study are presented.
1.1 MODULES AND MODULARIZATION
1.1.1 Definition
Modularization is the process of moving work from a construction site into a more controlled
environment. This process is said to deliver productivity, safety and quality benefits to the
construction industry. Modularization involves planning the design and construction of a facility
in a broken-down approach; the entire facility is built from separate components that can be
fabricated, shipped to site and assembled (erected) on site into the final product. These
components are referred to as modules. Modules are unique in nature, so the type, size and
components of a module change from project to project and also vary within the same project.
The different types of modules are discussed in the following section.
1.1.2 Types of Modules
Modules used for erecting industrial facilities vary by type. They are categorized according to
the components that make up the module. The components will vary depending on the type of
construction and the part of the construction in which the module is intended for use. There are
standardized categories of the components typically embedded into modules, and six main types
of modules:
Pipe rack module
Equipment/process module
Electrical module
Stair module
Building module
E-houses

3
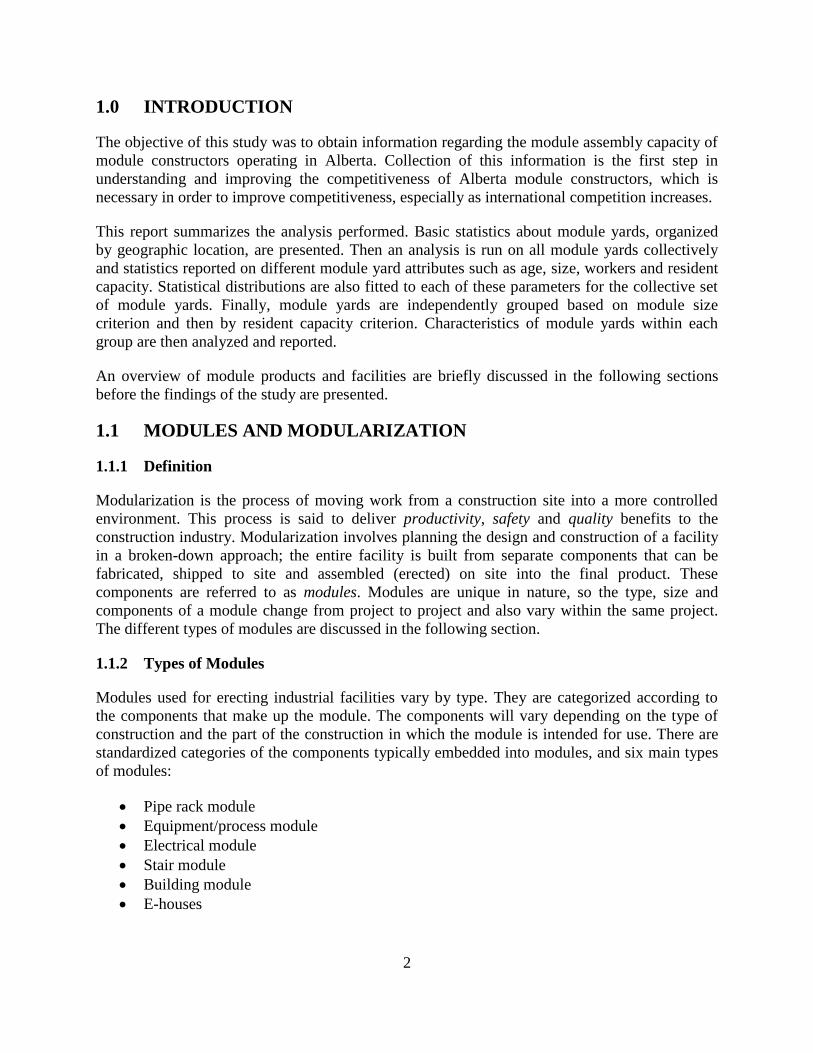
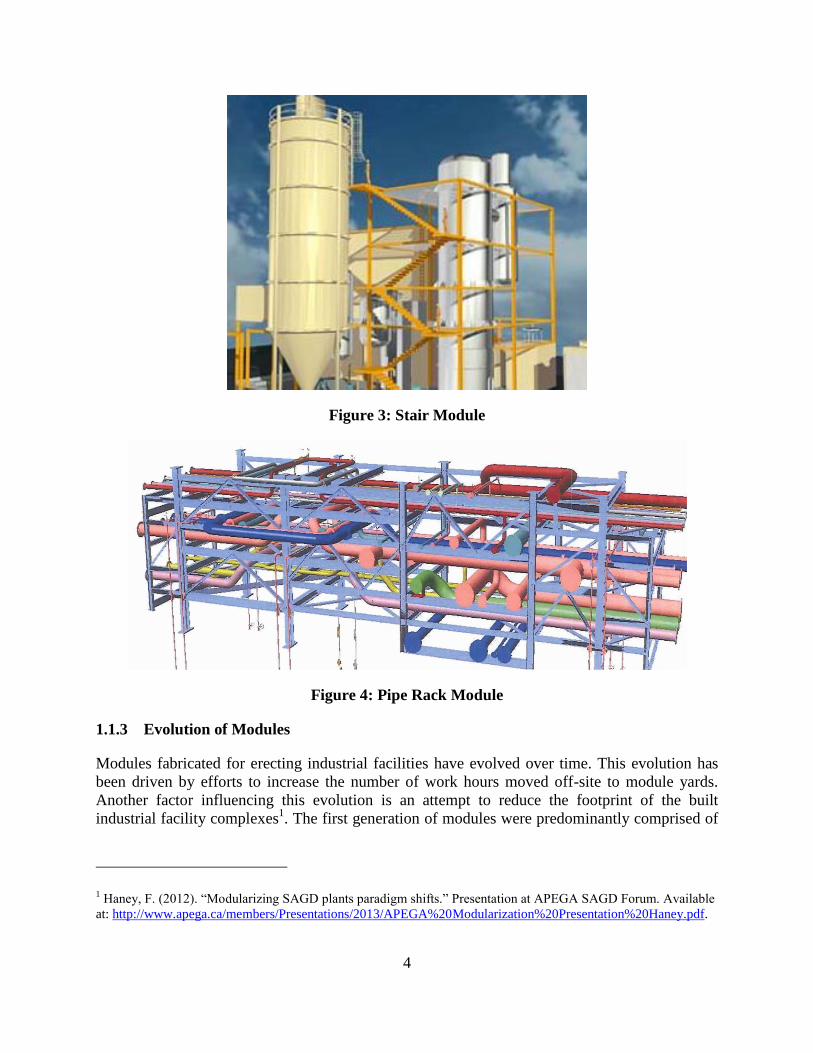
Examples of some of these typical module types are shown in Figures 1 through 4.
Figure 1: Process Module
Figure 2: Equipment Module
4
Figure 3: Stair Module
Figure 4: Pipe Rack Module
1.1.3 Evolution of Modules
Modules fabricated for erecting industrial facilities have evolved over time. This evolution has
been driven by efforts to increase the number of work hours moved off-site to module yards.
Another factor influencing this evolution is an attempt to reduce the footprint of the built
industrial facility complexes1. The first generation of modules were predominantly comprised of
1 Haney, F. (2012). “Modularizing SAGD plants paradigm shifts.” Presentation at APEGA SAGD Forum. Available
at: http://www.apega.ca/members/Presentations/2013/APEGA%20Modularization%20Presentation%20Haney.pdf.

5
pipe racks. Second generation modular construction execution included first generation (pipe
racks) plus equipment and pre-dressed vessels. Third generation modules focused on fabricating
modules to optimize the layout and space occupied by the facility when erected on site. Third
generation modularization reduced the amount of structural steel, piping, electrical and insulation
work required.
1.1.4 Module Yard
A module yard is a designated, flat open space used to assemble modules. Module yards are
typically divided into work areas referred to as bays. Each bay is usually occupied by only one
module being built. The layout of bays in a yard will typically change over time as the type and
number of modules being fabricated changes. The major constraining factor to the resident
capacity of a module yard is the size of the yard.
6
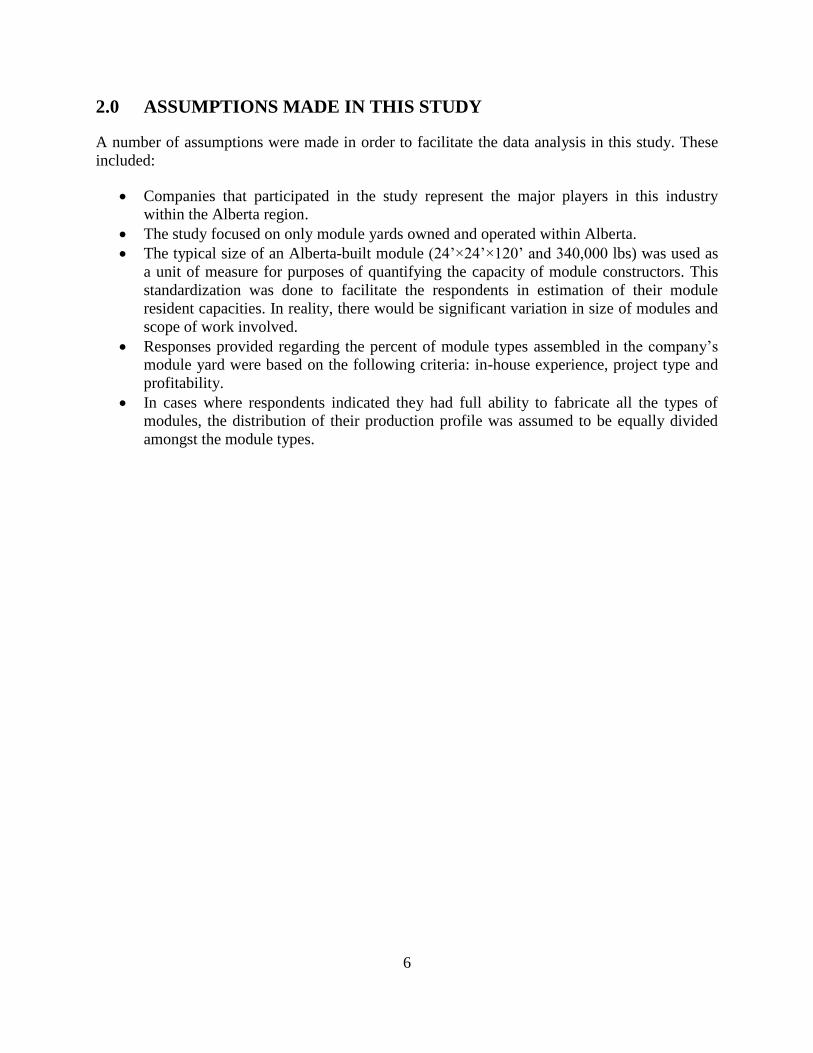
2.0 ASSUMPTIONS MADE IN THIS STUDY
A number of assumptions were made in order to facilitate the data analysis in this study. These
included:
Companies that participated in the study represent the major players in this industry
within the Alberta region.
The study focused on only module yards owned and operated within Alberta.
The typical size of an Alberta-built module (24’×24’×120’ and 340,000 lbs) was used as
a unit of measure for purposes of quantifying the capacity of module constructors. This
standardization was done to facilitate the respondents in estimation of their module
resident capacities. In reality, there would be significant variation in size of modules and
scope of work involved.
Responses provided regarding the percent of module types assembled in the company’s
module yard were based on the following criteria: in-house experience, project type and
profitability.
In cases where respondents indicated they had full ability to fabricate all the types of
modules, the distribution of their production profile was assumed to be equally divided
amongst the module types.

7
3.0 METHODOLOGY
The responses obtained from the questionnaire survey were entered into and analyzed using
Statistical Package for Social Scientists (SPSS). Statistics generated from some of the results
were represented in the form of charts. These charts were also generated using SPSS.
In other cases, statistical distributions were fitted to the empirical data collected. These
distributions were assumed to represent the population from which the data points collected from
responses were generated. Continuous and discrete distributions were fitted depending on
whether the parameter being dealt with was discrete or continuous in nature. Fitted distributions
are represented as Probability Density Functions (PDFs) within the main body of the report and
as Cumulative Density Functions (CDFs) within the Appendix. This representation was chosen
so that the variations in the parameters of the aggregated data would be easily visually displayed
to readers.
The data collected from participants was analyzed from three different perspectives: (1) company
perspective, (2) module yard perspective using module size categorization and (3) module yard
perspective using resident capacity categorization. This approach was used to highlight all
possible trends.
In the first phase of the analysis, all data collected was aggregated and then statistics generated
from them. Confidence intervals are also computed for these statistics. This phase represents an
analysis at a company level. The second phase entailed categorizing module yards according to a
module yard size criterion.

8
4.0 ANALYSIS AND RESULTS
This section of the report discusses and presents results on the module yards, and the different
attributes of the module yards.
4.1 MODULE FABRICATION YARDS OPERATED BY EACH
COMPANY IN ALBERTA
The study tried to establish the number of module yards within Alberta. Results of the study
indicated that there are 28 module yards in total that are currently in operation within Alberta.
Statistics were also generated for the number of module yards owned and operated by each
company. These are summarized in Table 1.
Table 1: Statistics of the Number of Yards Operated by Each Company
Statistic of the Number of
Module Yards
Value for the Statistic
(Number of Yards)
Mean 1.65
Maximum 3.00
Minimum 1.00
Results indicated that companies operate between 1 and 3 module yards in Alberta. The average
number of yards per company was found to be 1.65. The spatial distribution of these module
yards within the province of Alberta was not tracked in this study but can be a parameter tracked
in subsequent studies. A map showing their geographic location can then be generated.
Discrete statistical distributions were fitted to the data on the number of module yards that each
company owns. A Poisson distribution showed the best fit for this data. A screen shot of the
cumulative distribution function (CDF) for the data is shown in Figure 5.
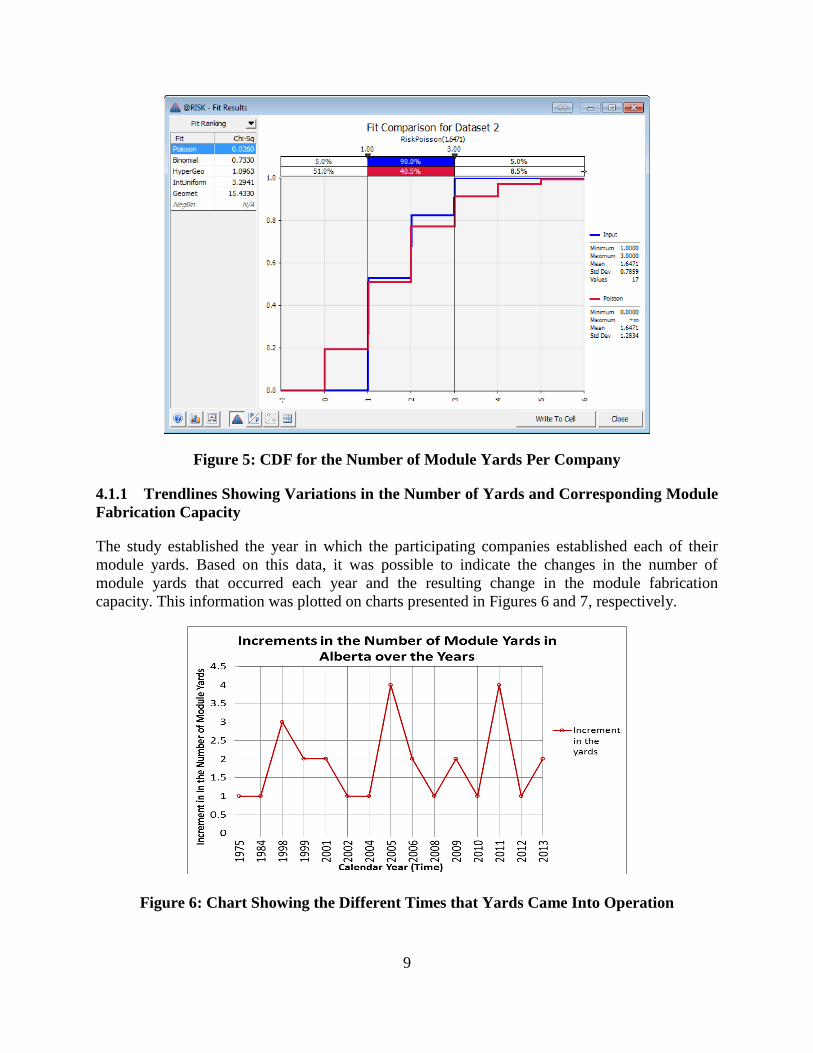
9
Figure 5: CDF for the Number of Module Yards Per Company
4.1.1 Trendlines Showing Variations in the Number of Yards and Corresponding Module
Fabrication Capacity
The study established the year in which the participating companies established each of their
module yards. Based on this data, it was possible to indicate the changes in the number of
module yards that occurred each year and the resulting change in the module fabrication
capacity. This information was plotted on charts presented in Figures 6 and 7, respectively.
Figure 6: Chart Showing the Different Times that Yards Came Into Operation

10
Figure 7: Chart Showing the Different Module Fabrication Capacity Increments over the
Years
The years indicated experienced changes corresponding to the values shown on the charts. In the
years not indicated, there was no change.
4.2 TOTAL MODULE YARD RESIDENT CAPACITY AND
CAPACITIES BY MODULE TYPE
Results obtained indicated that Alberta has a total module residence capacity of 1,418 standard
Alberta-size modules. The average number of modules per module yard was also found to be
50.64 standard Alberta-size modules. The data collected from participants was analyzed at a
more refined level in order to determine the distribution of their residence capacity by module
type. The results obtained are presented in Tables 2 and 3.
Table 2: Total Alberta Module Residence Capacity by Type
Module Type Total Resident Capacity
Pipe rack module 359
Process/Equipment module 291
E-house module 191
Building module 216
Stair module 166
Electrical module 195
Total Capacity 1418
11
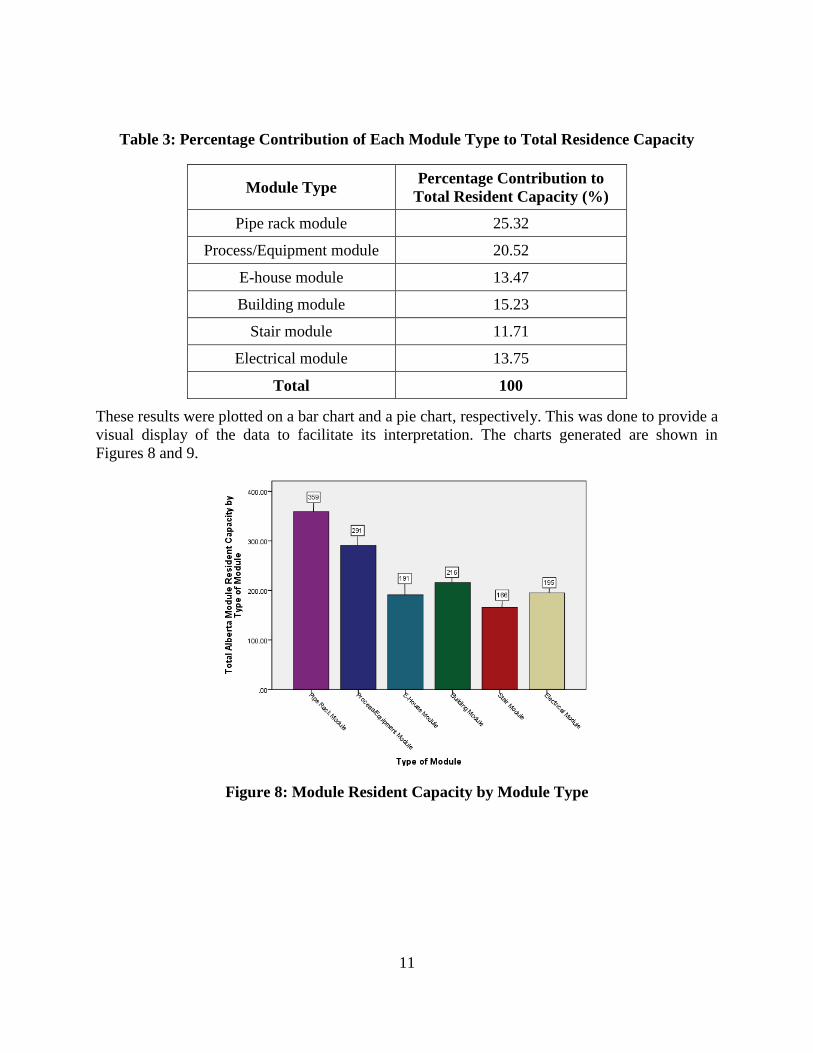
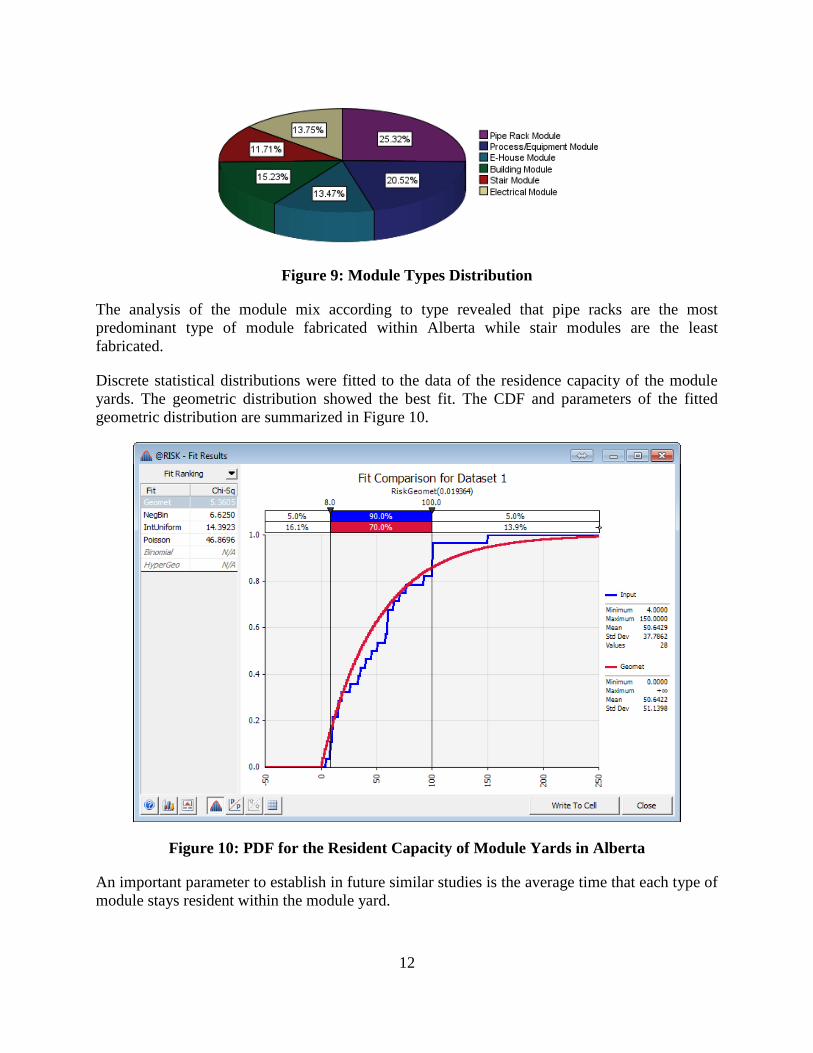
Table 3: Percentage Contribution of Each Module Type to Total Residence Capacity
Module Type Percentage Contribution to
Total Resident Capacity (%)
Pipe rack module 25.32
Process/Equipment module 20.52
E-house module 13.47
Building module 15.23
Stair module 11.71
Electrical module 13.75
Total 100
These results were plotted on a bar chart and a pie chart, respectively. This was done to provide a
visual display of the data to facilitate its interpretation. The charts generated are shown in
Figures 8 and 9.
Figure 8: Module Resident Capacity by Module Type
12
Figure 9: Module Types Distribution
The analysis of the module mix according to type revealed that pipe racks are the most
predominant type of module fabricated within Alberta while stair modules are the least
fabricated.
Discrete statistical distributions were fitted to the data of the residence capacity of the module
yards. The geometric distribution showed the best fit. The CDF and parameters of the fitted
geometric distribution are summarized in Figure 10.
Figure 10: PDF for the Resident Capacity of Module Yards in Alberta
An important parameter to establish in future similar studies is the average time that each type of
module stays resident within the module yard.

13
The study also tried to establish details of the resources required to sustain these reported
fabrication capacities. In order to do that, statistics were generated for the module yard sizes in
acres and total numbers of craft workers and supervisors engaged in these yards in typical and
peak work conditions.
4.3 SIZES OF THE MODULE YARDS
Module yard size is a variable that plays a role in influencing the module yard residence
capacity. The study performed basic statistics on data collected from participants for this
variable. Results obtained are summarized in Table 4.
Table 4: Statistics of Module Yard Sizes
Module Yard Size Statistic Value for the Statistic (Acres)
Mean 32.66
Maximum 80.00
Minimum 4.00
Sum 947.00
These results show that 947 acres of land in Alberta is currently being utilized for module
fabrication for industrial projects. The average module yard size was found to be 32.66 acres
while the smallest and largest were found to be 4 and 80 acres, respectively.
Continuous distributions were fitted to the data on module yard sizes. The Gamma distribution
showed the most suitable fit. The CDF and parameters for this distribution are shown in Figure
11.
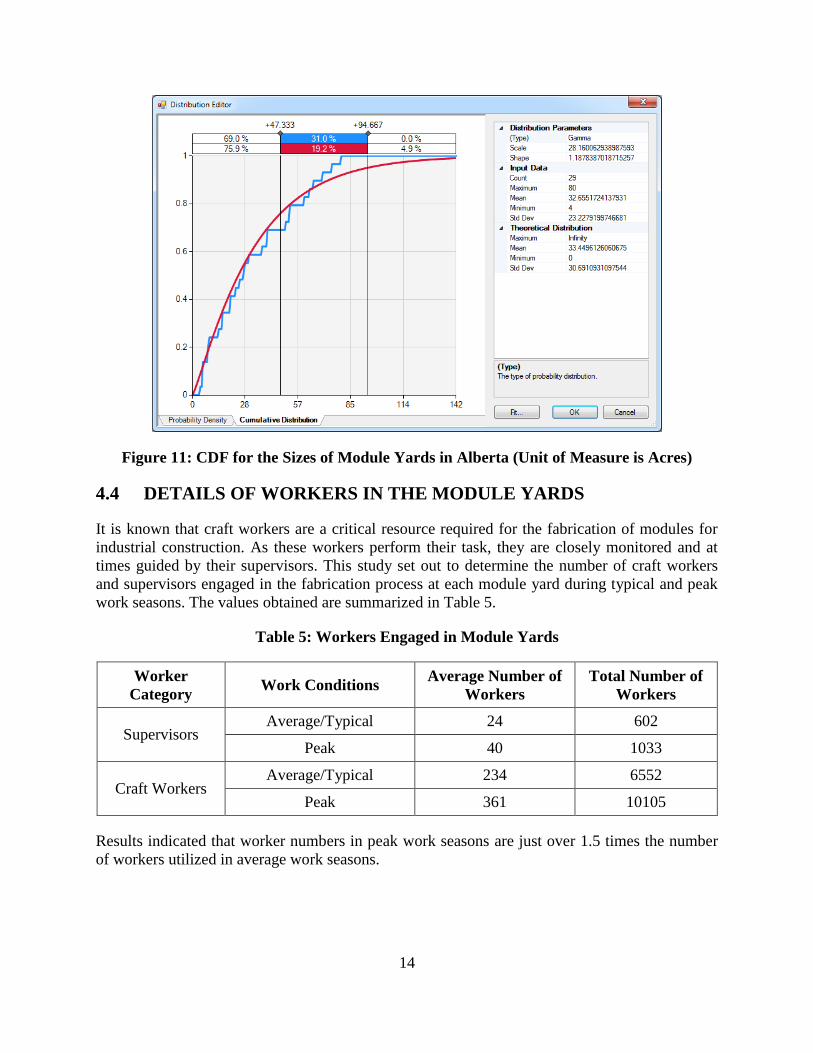
14
Figure 11: CDF for the Sizes of Module Yards in Alberta (Unit of Measure is Acres)
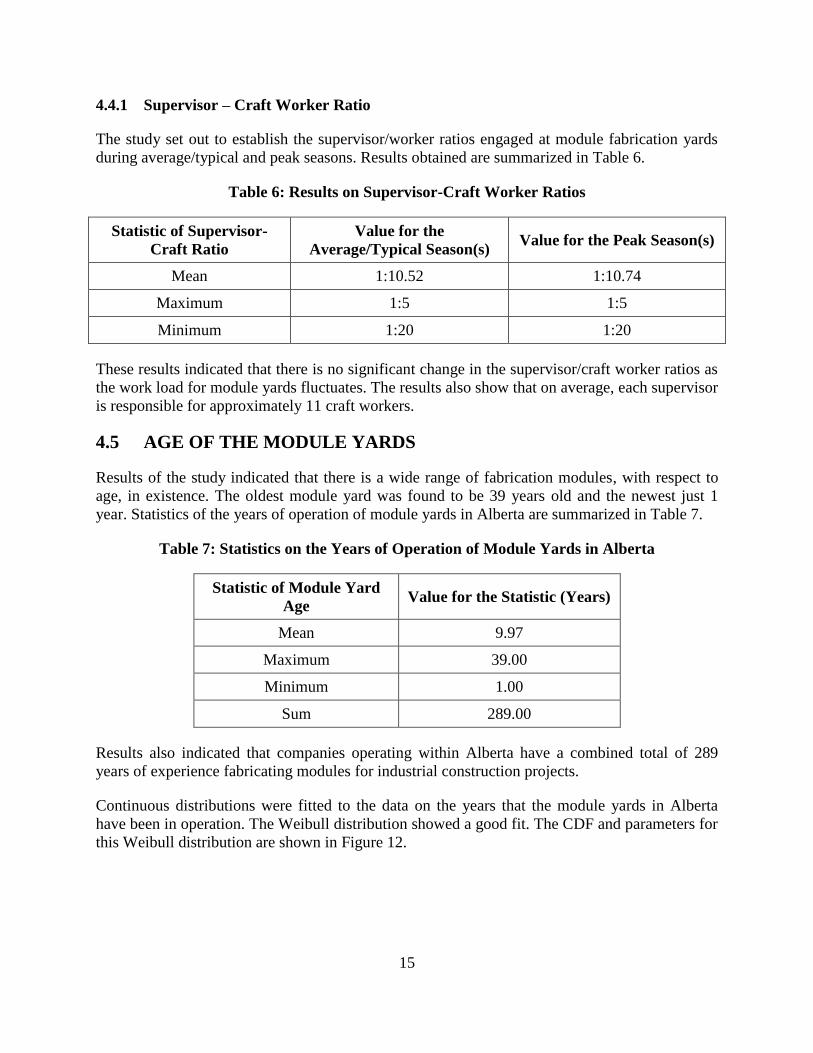
4.4 DETAILS OF WORKERS IN THE MODULE YARDS
It is known that craft workers are a critical resource required for the fabrication of modules for
industrial construction. As these workers perform their task, they are closely monitored and at
times guided by their supervisors. This study set out to determine the number of craft workers
and supervisors engaged in the fabrication process at each module yard during typical and peak
work seasons. The values obtained are summarized in Table 5.
Table 5: Workers Engaged in Module Yards
Worker
Category Work Conditions
Average Number of
Workers
Total Number of
Workers
Supervisors Average/Typical 24 602
Peak 40 1033
Craft Workers Average/Typical 234 6552
Peak 361 10105
Results indicated that worker numbers in peak work seasons are just over 1.5 times the number
of workers utilized in average work seasons.
15
4.4.1 Supervisor – Craft Worker Ratio
The study set out to establish the supervisor/worker ratios engaged at module fabrication yards
during average/typical and peak seasons. Results obtained are summarized in Table 6.
Table 6: Results on Supervisor-Craft Worker Ratios
Statistic of Supervisor-
Craft Ratio
Value for the
Average/Typical Season(s) Value for the Peak Season(s)
Mean 1:10.52 1:10.74
Maximum 1:5 1:5
Minimum 1:20 1:20
These results indicated that there is no significant change in the supervisor/craft worker ratios as
the work load for module yards fluctuates. The results also show that on average, each supervisor
is responsible for approximately 11 craft workers.
4.5 AGE OF THE MODULE YARDS
Results of the study indicated that there is a wide range of fabrication modules, with respect to
age, in existence. The oldest module yard was found to be 39 years old and the newest just 1
year. Statistics of the years of operation of module yards in Alberta are summarized in Table 7.
Table 7: Statistics on the Years of Operation of Module Yards in Alberta
Statistic of Module Yard
Age Value for the Statistic (Years)
Mean 9.97
Maximum 39.00
Minimum 1.00
Sum 289.00
Results also indicated that companies operating within Alberta have a combined total of 289
years of experience fabricating modules for industrial construction projects.
Continuous distributions were fitted to the data on the years that the module yards in Alberta
have been in operation. The Weibull distribution showed a good fit. The CDF and parameters for
this Weibull distribution are shown in Figure 12.
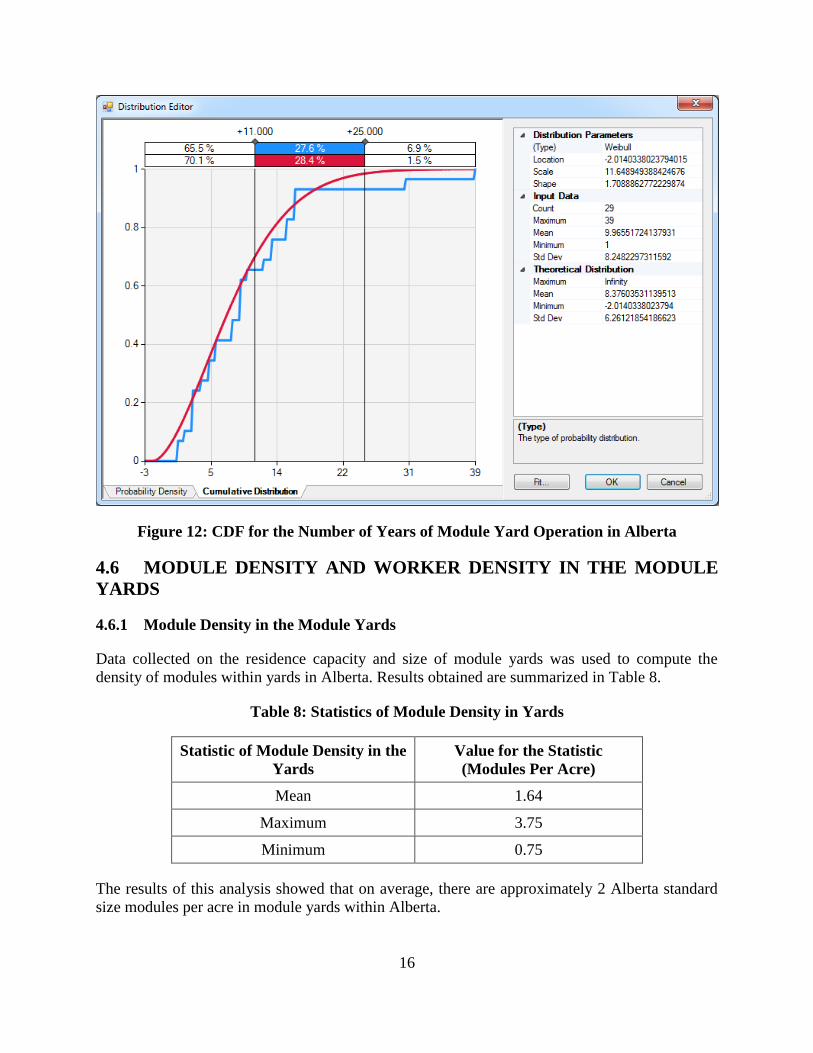
16
Figure 12: CDF for the Number of Years of Module Yard Operation in Alberta
4.6 MODULE DENSITY AND WORKER DENSITY IN THE MODULE
YARDS
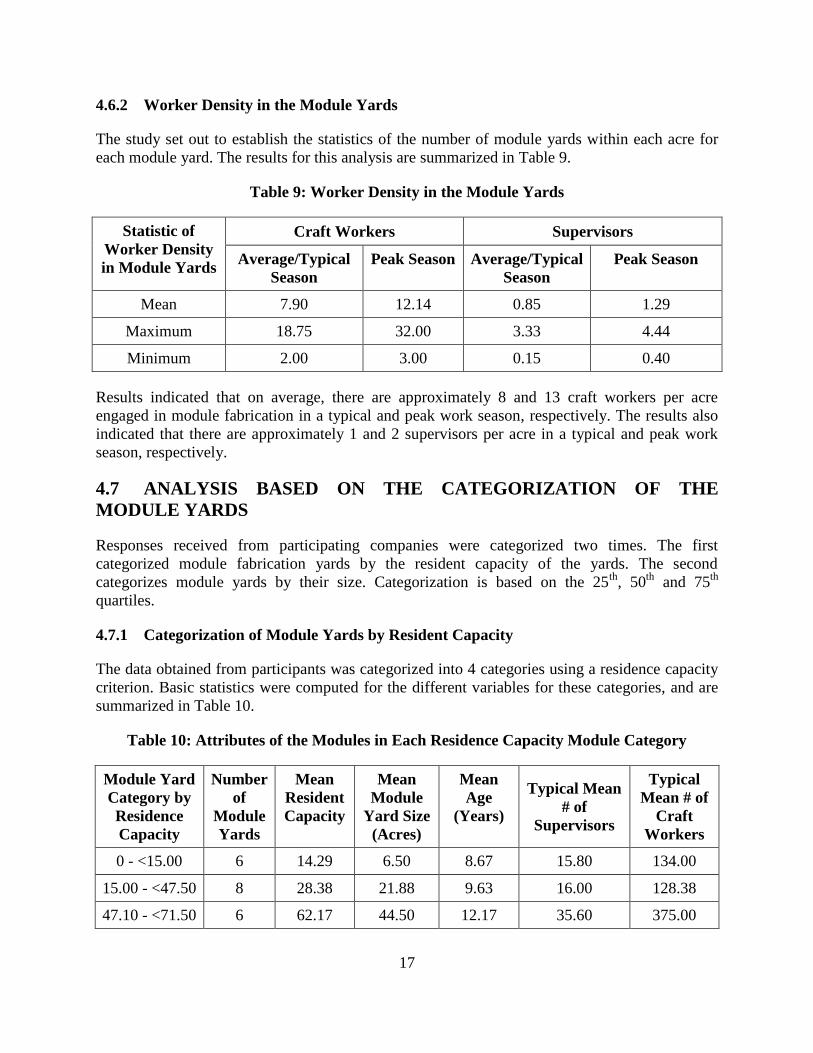
4.6.1 Module Density in the Module Yards
Data collected on the residence capacity and size of module yards was used to compute the
density of modules within yards in Alberta. Results obtained are summarized in Table 8.
Table 8: Statistics of Module Density in Yards
Statistic of Module Density in the
Yards
Value for the Statistic
(Modules Per Acre)
Mean 1.64
Maximum 3.75
Minimum 0.75
The results of this analysis showed that on average, there are approximately 2 Alberta standard
size modules per acre in module yards within Alberta.
17
4.6.2 Worker Density in the Module Yards
The study set out to establish the statistics of the number of module yards within each acre for
each module yard. The results for this analysis are summarized in Table 9.
Table 9: Worker Density in the Module Yards
Statistic of
Worker Density
in Module Yards
Craft Workers Supervisors
Average/Typical
Season
Peak Season Average/Typical
Season
Peak Season
Mean 7.90 12.14 0.85 1.29
Maximum 18.75 32.00 3.33 4.44
Minimum 2.00 3.00 0.15 0.40
Results indicated that on average, there are approximately 8 and 13 craft workers per acre
engaged in module fabrication in a typical and peak work season, respectively. The results also
indicated that there are approximately 1 and 2 supervisors per acre in a typical and peak work
season, respectively.
4.7 ANALYSIS BASED ON THE CATEGORIZATION OF THE
MODULE YARDS
Responses received from participating companies were categorized two times. The first
categorized module fabrication yards by the resident capacity of the yards. The second
categorizes module yards by their size. Categorization is based on the 25th
, 50th
and 75th
quartiles.
4.7.1 Categorization of Module Yards by Resident Capacity
The data obtained from participants was categorized into 4 categories using a residence capacity
criterion. Basic statistics were computed for the different variables for these categories, and are
summarized in Table 10.
Table 10: Attributes of the Modules in Each Residence Capacity Module Category
Module Yard
Category by
Residence
Capacity
Number
of
Module
Yards
Mean
Resident
Capacity
Mean
Module
Yard Size
(Acres)
Mean
Age
(Years)
Typical Mean
# of
Supervisors
Typical
Mean # of
Craft
Workers
0 - <15.00 6 14.29 6.50 8.67 15.80 134.00
15.00 - <47.50 8 28.38 21.88 9.63 16.00 128.38
47.10 - <71.50 6 62.17 44.50 12.17 35.60 375.00

18
Module Yard
Category by
Residence
Capacity
Number
of
Module
Yards
Mean
Resident
Capacity
Mean
Module
Yard Size
(Acres)
Mean
Age
(Years)
Typical Mean
# of
Supervisors
Typical
Mean # of
Craft
Workers
>= 71.50 8 102.57 55.13 10.13 31.43 357.14
Results indicated that module yards with higher residence capacities are generally larger in size
and have been in operation for a longer period of time compared to those with small residence
capacities. The yards with larger residence capacities also have approximately twice the number
of skilled direct human resources engaged in the work compared to those with low residence
capacities.
4.7.2 Categorization of Module Yards by their Size
The data in the study was also categorized into 4 categories using module yard size criteria.
Statistics for the variables of each yard category were calculated and are presented in Table 11.
Table 11: Attributes of the Module Yards in Each Module Yard Size Category
Module Yard
Category by
Yard Size
Number
of
Module
Yards
Mean
Resident
Capacity
Mean
Module
Yard Size
(Acres)
Mean
Age
(Years)
Typical Mean
# of
Supervisors
Typical
Mean # of
Craft
Workers
0 - <14.00 7 9.29 6.29 11.71 7.57 387.00
14.00 - <27.00 7 32.83 19.14 12.29 13.40 135.83
27.00 - <52.00 7 54.14 36.00 6.29 39.57 357.14
>= 52.00 7 97.13 64.63 9.63 29.29 356.25
Results in this table indicated that large size module yards have higher values of residence
capacity compared to small yards. Likewise, larger-size module yards have higher numbers of
craft workers and supervisors. This was the expected trend. The results indicated that module
yards that are larger in size have generally been in operation for a shorter period compared to
smaller module yards.
19
5.0 CONCLUSIONS AND RECOMMENDATIONS
This study was designed to cover a limited scope of issues existing within the module fabrication
industry in Alberta, and aimed at gathering the basic properties of the yards of the participating
companies. The findings presented in this report are based on the data collected in the
questionnaire survey from the 17 participating companies.
Data received indicated there is a total resident capacity of 1,418 modules for fabricator
companies operating in Alberta. Contributions to this overall capacity by the different module
types were as follows:
Pipe rack modules – 25.32%
Process/equipment modules – 20.52%
E-houses – 13.47%
Building modules – 15.23%
Stair modules – 11.71%
Electrical modules – 13.75%
The study established that there is a minimum of 28 module fabrication yards in Alberta that
occupy a total of 947 acres. Companies that participated in the study indicated on average that
they operate 1.65 module yards each.
It was established on average, module yards:
have been operated for 9.97 years,
have a size of 32.66 acres,
have a resident capacity of 50.64 modules, and
can hold 1.64 modules per acre.
The study revealed useful information about the number of workers and supervisors with the
following details.
Typical work season conditions:
Average craft – 234 workers with 24 supervisors.
Peak work season conditions:
Average craft – 361 workers with 40 supervisors.
Supervisor to craft worker ratio in typical work season:
1:10.52.
Supervisor to craft worker ratio in peak work season:
1:10.74.
The values for the various parameters (yard sizes, age of yards, and number of workers) were
represented as statistical distributions to facilitate any subsequent simulation-based studies that
may be intended in follow-up studies.

20
There was some ambiguity in the participants’ responses to the module type question. In future
studies, it is recommended to use design documents (drawings and specifications) of a typical
industrial project that requires the fabrication of different types of modules. Participants in the
study could be informed to assume they have an infinite work load of the type specified in the
design documents. These design documents could then be useful to the respondents in two ways,
namely:
To serve as a basis for participating companies to estimate their production rate for the
different types of modules.
To serve as a basis for companies to estimate the mix of module types they would
configure their operations to produce, given availability of work in each type is not a
constraint.
It is recommended that subsequent studies strive to quantify the module fabrication capacity of
companies in Alberta based on both a resident capacity and throughput capacity criteria.
Furthermore, these studies should establish the utilization rates of these installed modules to
illustrate potential capacity shortages or surpluses.

21
ACKNOWLEDGEMENT
The NSERC Industrial Research Chair in Construction Engineering and Management would like
to express thanks to those who supported this research project. Thank you to all the companies
who participated through completion of the survey – the research would not be possible without
your provided data.
ETHICS APPROVAL
An Assessment of the Steel Fabrication Capacity in Canada, Study ID: Pro00032564, has
undergone independent ethics review through the University of Alberta Research Ethics Office
and been approved.

22
APPENDIX – CUMULATIVE DENSITY FUNCTION CHARTS FOR THE
DIFFERENT ATTRIBUTES OF THE MODULE YARDS
Discrete PDF for the Number of Module Yards for Each Company
Discrete PDF for the Resident Capacity of Module Yards in Alberta
23
Continuous PDF for the Sizes of Module Yards in Alberta (Unit of Measure is Acres)
Continuous PDF for the Number of Years of Operation of Module Yards in Alberta