module 6 costing, assessing & selecting adaptation ... assessing & selecting adaptation...
TRANSCRIPT

Module 6
Costing, assessing & selecting
adaptation & mitigation
Global Climate Change AllianceSupport Facility
adaptation & mitigation
options & measures
Training workshops onmainstreaming climate change
Key topics covered by this module
• Tools for costing and assessing adaptation andmitigation options
• Tools for prioritising and selecting adaptation andmitigation measuresmitigation measures

Assessing adaptation options
• Generic approach proposed by OECD (2009):
1) Identify current and future vulnerabilities and climaterisks Use climate risk screening to support this step
2) Identify possible adaptation measures
3) Evaluate and select adaptation options Based on effectiveness, cost and feasibility
Cost-benefit analysis (CBA) or cost-effectiveness analysis(CEA) are good tools for supporting the identification of ‘no-regrets’, ‘low-regrets’ and ‘robust’ options
4) Monitor and evaluate success of adaptation strategy

Strategic choice of mitigationoptions
• The choice of GHG abatement technologiesshould result from a strategic prioritisation process:
– Initially at least, focusing limited resources and capacitieson a limited range of technological options is likely to beon a limited range of technological options is likely to bemore effective and efficient than a dispersion of efforts
– Abatement technologies must be matched with:• the country’s development strategy
• its natural resource endowment, existing infrastructure,institutional, technical and other characteristics
– Already proven and established technologies and thosealready economically viable are ‘safer bets’

Tools for costing and assessing
adaptation and mitigation options
Cost-benefit analysis (1)
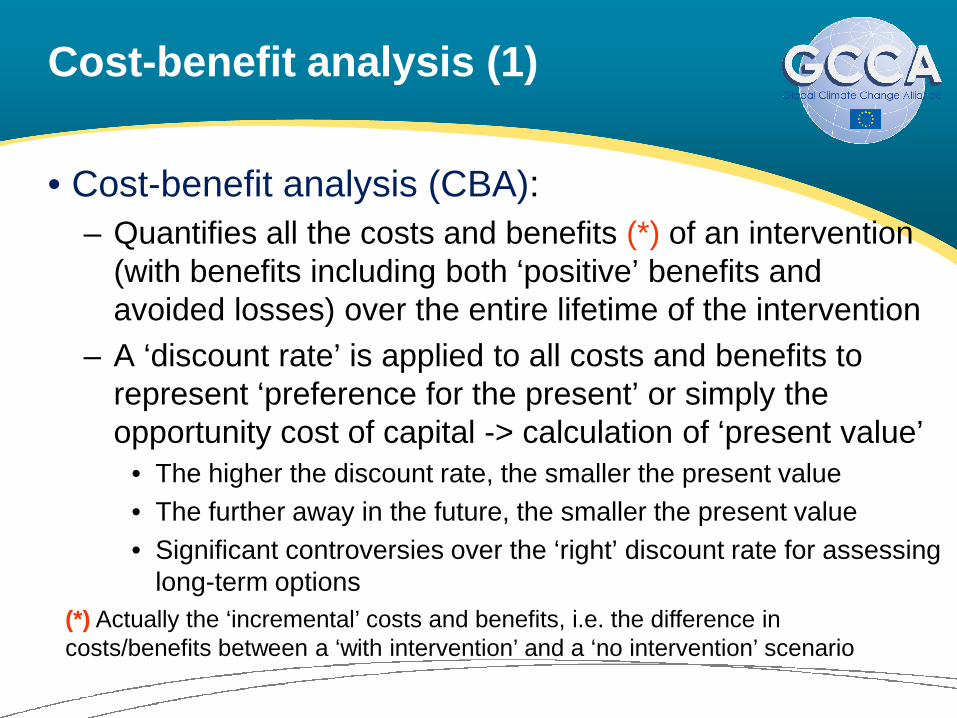
• Cost-benefit analysis (CBA):
– Quantifies all the costs and benefits (*) of an intervention(with benefits including both ‘positive’ benefits andavoided losses) over the entire lifetime of the intervention
– A ‘discount rate’ is applied to all costs and benefits to– A ‘discount rate’ is applied to all costs and benefits torepresent ‘preference for the present’ or simply theopportunity cost of capital -> calculation of ‘present value’
• The higher the discount rate, the smaller the present value
• The further away in the future, the smaller the present value
• Significant controversies over the ‘right’ discount rate for assessinglong-term options
(*) Actually the ‘incremental’ costs and benefits, i.e. the difference incosts/benefits between a ‘with intervention’ and a ‘no intervention’ scenario

Cost-benefit analysis (2)
• Outputs of cost-benefit analysis:
– Benefit-cost ratio (BCR) = ratio of benefits to costscalculated at their present value (the smaller, the better – ‘noregrets’ if BCR > 1)
– Net present value (NPV) = benefits minus costs calculated– Net present value (NPV) = benefits minus costs calculatedat their present value (the larger, the better)
– Internal rate of return (IRR):• technically, the discount rate at which the NPV = 0
• concretely, a measure of the ‘benefit-generating power’ of theoption or intervention
• the higher, the better – should exceed the opportunity cost ofcapital
Cost-benefit analysis (3)
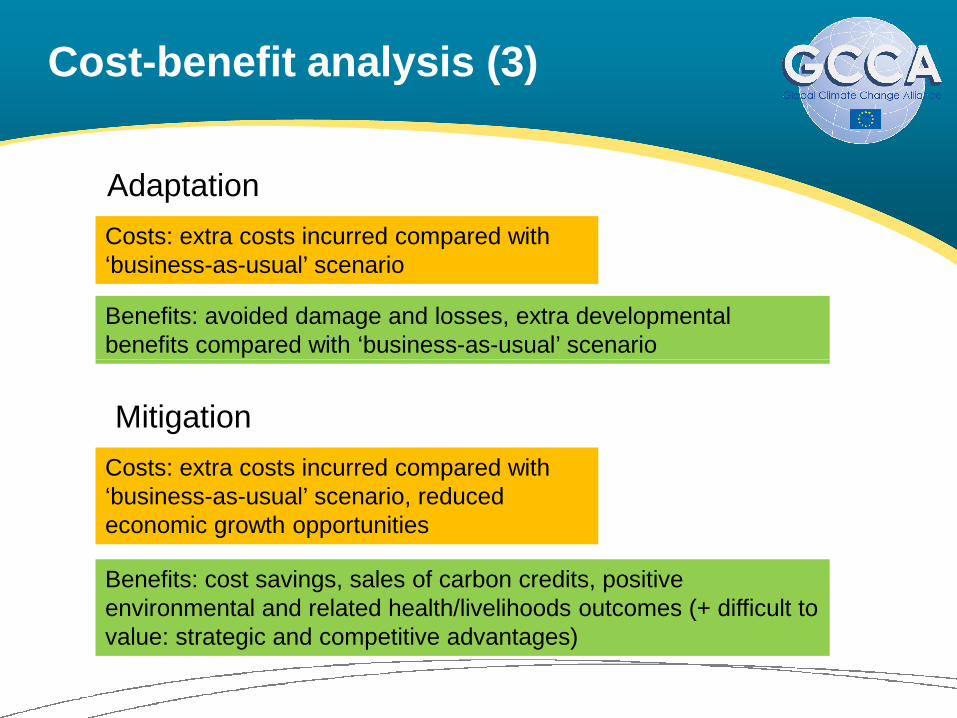
Adaptation
Costs: extra costs incurred compared with‘business-as-usual’ scenario
Benefits: avoided damage and losses, extra developmentalbenefits compared with ‘business-as-usual’ scenario
Mitigation
Costs: extra costs incurred compared with‘business-as-usual’ scenario, reducedeconomic growth opportunities
Benefits: cost savings, sales of carbon credits, positiveenvironmental and related health/livelihoods outcomes (+ difficult tovalue: strategic and competitive advantages)

Illustration of CBA (1)
Risk aversedecisionmakers mightaccept ahigher CBR,
9.0
9.59.1
2.5
3.0
3.5
Cost benefit ratio (CBR)
4.04.1
Exhibit 4 – The overall cost-benefit assessment shows a variety of options toreduce coastal flooding risk/annual expected loss
higher CBR,e.g., 1.52
Back Away Relocation1
0.2
Mobile Barriers
0.2
Revive reefs
0.1
Mangrove
0
0.50.3
Sandbagging
500400300200
1.0
0
1.5
2.0
1000
1.00
1.50
Moveable BuildingsBreakwaters
2.5
Sea walls
1.4
Dikes
1.2
Stilts (old)
1.2
Flood-proof building structures
1.0
Stilts (new)
0.5
0
Flood-adapt contents
Beach nourishment
PV of averted lossesUSD millions
800700
0.5
600
0.2
SOURCE: Team analysis
1 Relocation only includes residential and commercial buildings outside of Apia2 For example, a cost benefit ratio of ~1.5 is implicitly accepted by customers purchasing an insurance contract with a loss ratio between 60 and 70%
Risk neutraldecisionmakers willbasedecision onCBR = 1.0
Source: Economics of Climate Adaptation (2009) Test case on Samoa –Focus on risks caused by sea level rise, Fig. 04, p. 123

Illustration of CBA (2)
Exhibit 5 – Risk transfer is the most efficient way of providing additionalcoverage for low-frequency events
Example of evaluation of alternative options to cover residual risk of coastalflooding in Samoa
• In a risk averse setting,decision makers selectadaptation measures by takinginto account two maincomponents:
– Objective/risk-neutral netvalue
– Subjective assessment of
Loss for 250-year event
In percent of GDP
Loss covered
In percent of residualrisk to be covered
Furtherhard 23
Annual cost1
In USD millions
34
49%
Approach to risk aversedecision making
Risk transfer offers the fulldesired level of coverage andis significantly cheaper thanother considered measures
SOURCE: Team analysis
– Subjective assessment ofcosts and benefits
• The results of subjectiveassessment of costs andbenefits should include twomain elements:
– A reference event to beconsidered while selectingprotection (e.g., a 250-yearevent)
– The maximum bearableloss for the reference event– this can be expressed as apercentage of GDP (e.g.,5%)
hardmeasures
Risktransfer
7
Residualrisk to becovered
Maximumbearableloss
5
Lossavertedby costefficientmeasures
18
Totalloss
11
49%
100%
Source: Economics of Climate Adaptation (2009) Test case on Samoa –Focus on risks caused by sea level rise, Fig. 05, p. 123

Cost-effectiveness analysis (1)
• Cost-effectiveness analysis (CEA):
– Costs are valued in monetary terms, and benefits (*)quantified in ‘physical’ units, over the entire lifetime of theintervention; again, a discount rate is applied to both
– This allows calculating unit costs, as the ratio of totaldiscounted costs to total discounted benefits obtained
– The obtained unit costs support :• the comparison of several options
• comparison with ‘benchmark costs’ for similar interventions, whereavailable
(*) As in cost-benefit analysis, ‘incremental’ rather than absolute costs andbenefits should be taken into account

Cost-effectiveness analysis (2)
• Compared with CBA, CEA:
– is suitable where it is difficult to assign a monetary valueto benefits
– but requires identifying a single, all-encompassingmeasure of benefits – which may be both difficult andreductive)

Illustration of CEA: the McKinseyGHG abatement cost curve
Source: McKinsey (2009), Exhibit 8, p. 17

Financial and economic analysis
• Both CBA and CEA support:
– financial analysis: considers the ‘monetary’ costs andbenefits (or equivalent) accruing to parties directlyconcerned by a project or programme, at their ‘face value’
– economic analysis: broadens the analysis to more– economic analysis: broadens the analysis to moreaccurately reflect costs and benefits to society
• Private sector stakeholders will make decisions onthe basis of financial ratios/indicators
• Public sector stakeholders should in principle makedecisions on the basis of economic ratios/indicators

Complementary tools
• For the assessment of robustness and theintegration of uncertainty, CBA/CEA can becombined with:
– the use of multiple scenarios (e.g. ‘no change’ scenario– the use of multiple scenarios (e.g. ‘no change’ scenarioand various climate change and development scenarios)
– sensitivity analysis (i.e. testing of the effect of changes inscenario assumptions on the BCR, NPV, IRR or unit costs)
– risk analysis (-> risk-benefit analysis includes the probabilityof occurrence of various cost and benefit outcomes incalculations... assuming probabilities are known)

Tools for prioritising and selecting adaptation and
mitigation measures

Supporting decision making
• CBA/CEA support the financial and economicassessment of adaptation options
– They help identify measures that offer the best ‘value formoney’ – a key aspect in situations of budgetaryconstraints
• Other types of assessment and other criteria (e.g.
technical, social, environmental) are nevertheless likelyto be required to fully inform decision makers
• Multi-criteria analysis (MCA) helps integrate variouscriteria

Multi-criteria analysis (1)
• An approach to decision support that usesmore than one criterion to assess performance andrank various options or interventions
• The term actually covers a wide range of methods
• Typically:
– various options or interventions are assessed against apre-determined set of criteria
– qualitative ratings or quantitative scores are given
– rules are then applied to rank options/interventions• Numerical scores can be added up to calculate a total score (with
the possibility of applying different weights to different criteria)
Multi-criteria analysis (2)
• MCA is a useful complement to CBA/CEA
• Allows combining financial/economic criteria withtechnical, environmental and social ones
• It can be used on its own, or in combination with• It can be used on its own, or in combination withCBA/CEA:
– MCA before CBA/CEA: allows reducing the number ofoptions to which CBA/CEA is applied
– MCA after CBA/CEA: CBA/CEA helps eliminate financiallyor economically unviable options, after which MCA allowsmaking the final selection on the basis of additional criteria

MCA: illustration
• Kiribati – Criteria used for final prioritisationof adaptation measures to be mainstreamed in theNational Development Strategy:– results of the national consultations
– capacity to address vulnerability (expert judgment)– capacity to address vulnerability (expert judgment)
– likely cost benefit
– urgency
– likely degree of environmental impact
– cultural acceptability
– degree of community participation
– synergies with poverty reduction
– synergies with international conventions
Source: UNDP-UNEP (2010),based on World Bank (2006)

References
• Economics of Climate Adaptation Working Group (2009) Shaping climate-resilient development: aframework for decision-making. Climate Works Foundation, Global Environment Facility,European Commission, McKinsey & Company, The Rockfeller Foundation, Standard CharteredBank & Swiss Re. Available from:http://www.mckinsey.com/clientservice/Social_Sector/our_practices/Economic_Development/Knowledge_Highlights/Economics_of_climate_adaptation.aspx
• McKinsey & Company (2009) Pathways to a Low-Carbon Economy: Version 2 of the Global• McKinsey & Company (2009) Pathways to a Low-Carbon Economy: Version 2 of the GlobalGreenhouse Gas Abatement Cost Curve. Available from:http://www.mckinsey.com/globalGHGcostcurve
• OECD (2009a) Integrating Climate Change Adaptation into Development Co-operation: Policyguidance. OECD Publishing, Paris. [Read-only, browse-it edition] Available from:http://browse.oecdbookshop.org/oecd/pdfs/browseit/4309171E.PDF
• UNDP-UNEP (2010) Mainstreaming Adaptation to Climate Change into Development Planning: AGuidance Note for Practitioners. Draft version. UNDP-UNEP Poverty-Environment Initiative. Finalversion available from: http://www.unpei.org/knowledge-resources/publications.html
21