module 3.1-measurement scales
DESCRIPTION
research methodology - measurement scalesTRANSCRIPT
Measurement and Scaling

12-2
Measurement
“If you can’t measure it, you can’t manage it.”
Bob Donath, Consultant

Measurement and ScalingMeasurement means assigning numbers or other symbols to characteristics of objects according to certain pre-specified rules.
One-to-one correspondence between the numbers and the characteristics being measured.
The rules for assigning numbers should be standardized and applied uniformly.
Rules must not change over objects or time.
Measurement and Scaling
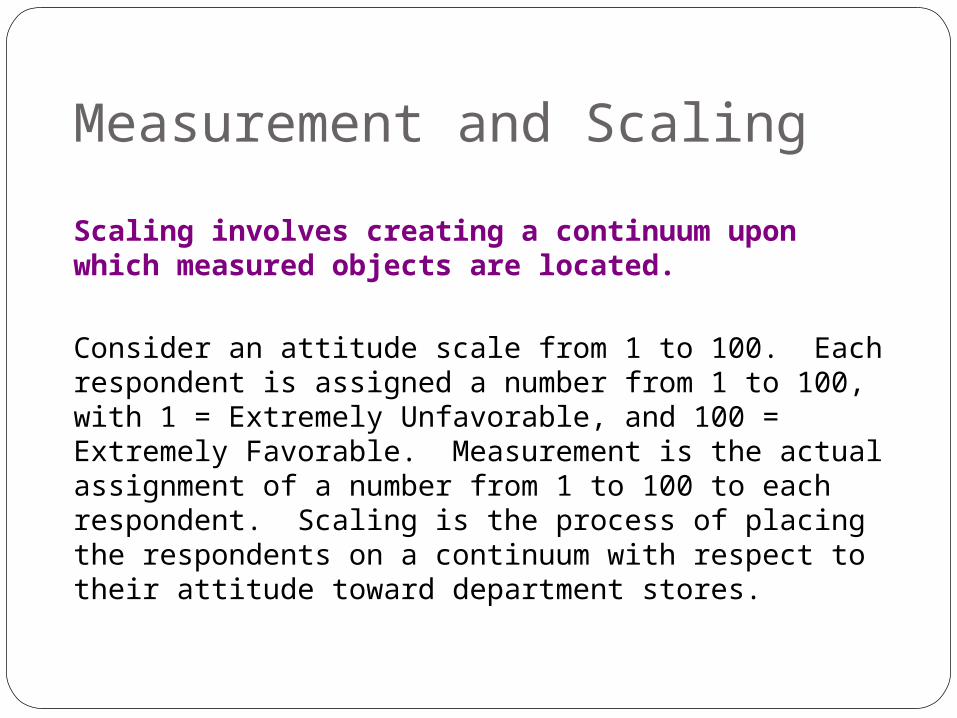
Scaling involves creating a continuum upon which measured objects are located.
Consider an attitude scale from 1 to 100. Each respondent is assigned a number from 1 to 100, with 1 = Extremely Unfavorable, and 100 = Extremely Favorable. Measurement is the actual assignment of a number from 1 to 100 to each respondent. Scaling is the process of placing the respondents on a continuum with respect to their attitude toward department stores.

Primary ScaleNominalOrdinalIntervalRatio

12-6
Types of Scales
OrdinalOrdinal
intervalinterval
RatioRatio
NominalNominal

12-7
Levels of Measurement
OrdinalOrdinal
intervalinterval
RatioRatio
NominalNominal ClassificationClassification

12-8
Nominal ScalesMutually exclusive
and collectively exhaustive categories
Exhibits the classification characteristic only

12-9
Levels of Measurement
OrdinalOrdinal
intervalinterval
RatioRatio
NominalNominal ClassificationClassification
OrderOrderClassificationClassification

12-10
Ordinal ScalesCharacteristics of
nominal scale plus an indication of order
Implies statement of greater than and less than

12-11
Levels of Measurement
OrdinalOrdinal
intervalinterval
RatioRatio
NominalNominal ClassificationClassification
OrderOrderClassificationClassification
OrderOrderClassificationClassification DistanceDistance

12-12
Interval ScalesCharacteristics of
nominal and ordinal scales plus the concept of equality of interval.
Equal distance exists between numbers
12-13
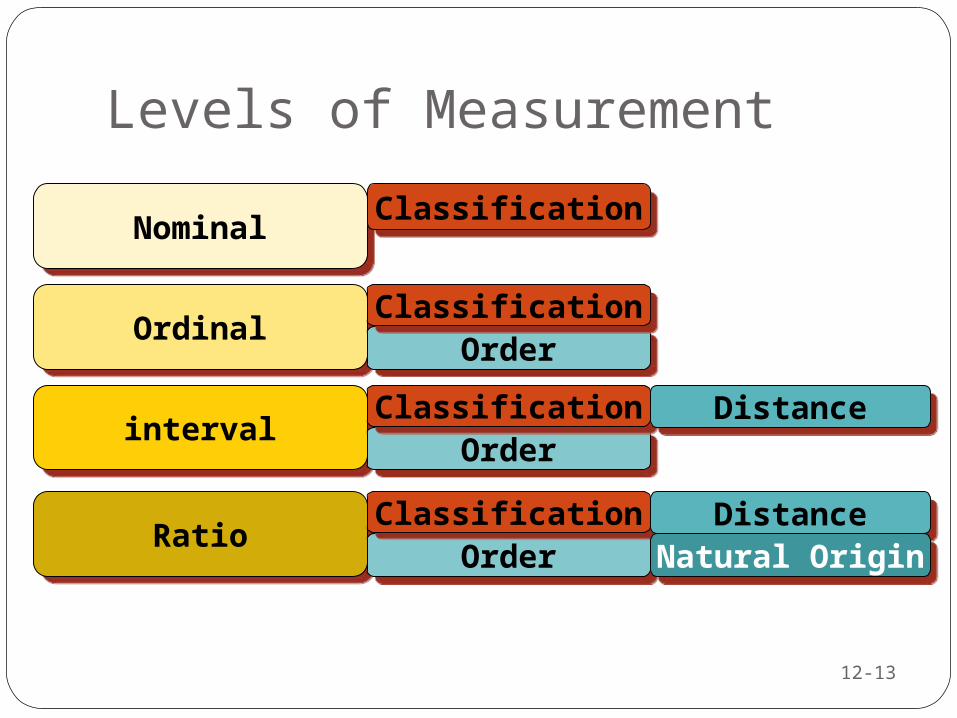
Levels of Measurement
OrdinalOrdinal
intervalinterval
RatioRatio
NominalNominal ClassificationClassification
OrderOrderClassificationClassification
OrderOrderClassificationClassification DistanceDistance
Natural OriginNatural Origin
OrderOrderClassificationClassification DistanceDistance

12-14
Ratio Scales
Characteristics of previous scales plus an absolute zero point
ExamplesWeightHeightNumber of children

Nominal Scale PropertiesUniquely classifies
Sammy Sosa # 21Barry Bonds # 25

Ordinal Scale PropertiesUniquely classifiesPreserves orderWin, place, & show

Interval Scale PropertiesUniquely classifiesPreserves orderEqual intervals
Consumer Price Index (Base 100)Fahrenheit temperature

Ratio Scale PropertiesUniquely classifiesPreserves orderEqual intervals
Natural zeroWeight and distance

Primary Scales of Measurement
7 38
ScaleNominal Numbers
Assigned to Runners
Ordinal Rank Orderof Winners
Interval PerformanceRating on a
0 to 10 Scale
Ratio Time to Finish, in
Seconds
Thirdplace
Secondplace
Firstplace
Finish
Finish
8.2 9.1 9.6
15.2 14.1 13.4

Illustration of Primary Scales of Measurement
Nominal Ordinal RatioScale Scale Scale
Preference $ spent last No. Store Rankings 3 months
1. Parisian2. Macy’s3. Kmart4. Kohl’s5. J.C. Penney 6. Neiman Marcus 7. Marshalls8. Saks Fifth Avenue 9. Sears 10.Wal-Mart
IntervalScale Preference Ratings
1-7 11-17
7 79 5 15 02 25 7 17 2008 82 4 14 03 30 6 16 1001 10 7 17 2505 53 5 15 359 95 4 14 06 61 5 15 1004 45 6 16 010 115 2 12 10

Primary Scales of Measurement
Scale Basic Characteristics
Common Examples
Marketing Examples
Nominal Numbers identify & classify objects
Social Security nos., numbering of football players
Brand nos., store types
Percentages, mode
Chi-square, binomial test
Ordinal Nos. indicate the relative positions of objects but not the magnitude of differences between them
Quality rankings, rankings of teams in a tournament
Preference rankings, market position, social class
Percentile, median
Rank-order correlation, Friedman ANOVA
Ratio Zero point is fixed, ratios of scale values can be compared
Length, weight Age, sales, income, costs
Geometric mean, harmonic mean
Coefficient of variation
Permissible Statistics Descriptive Inferential
Interval Differences between objects
Temperature (Fahrenheit)
Attitudes, opinions, index
Range, mean, standard
Product-moment
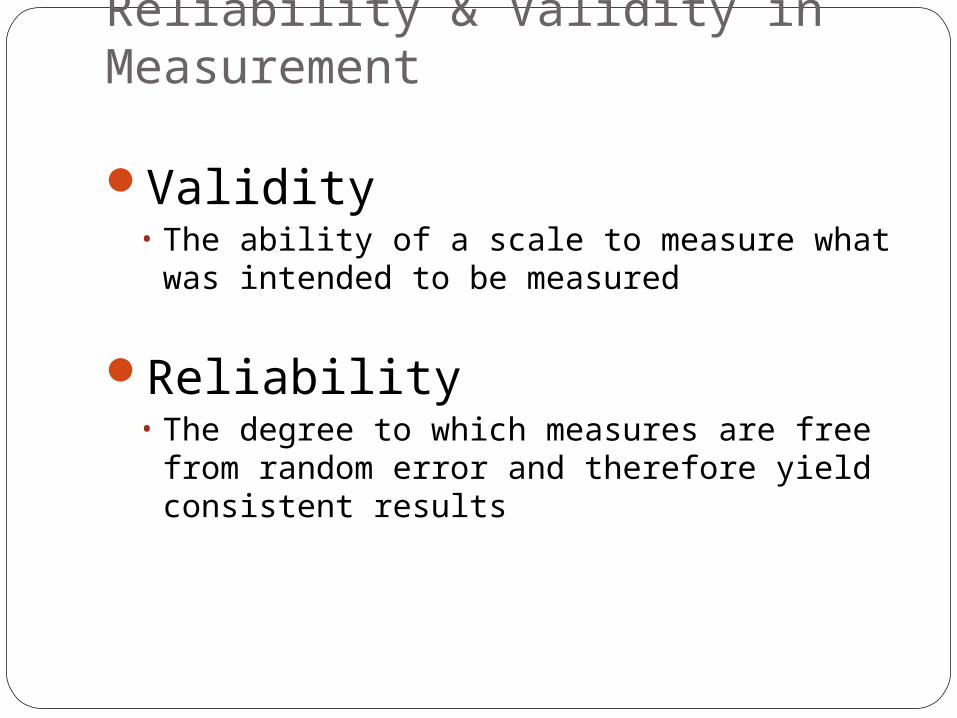
Reliability & Validity in Measurement
Validity • The ability of a scale to measure what was
intended to be measured
Reliability • The degree to which measures are free from
random error and therefore yield consistent results

The Goal of Measurement Validity
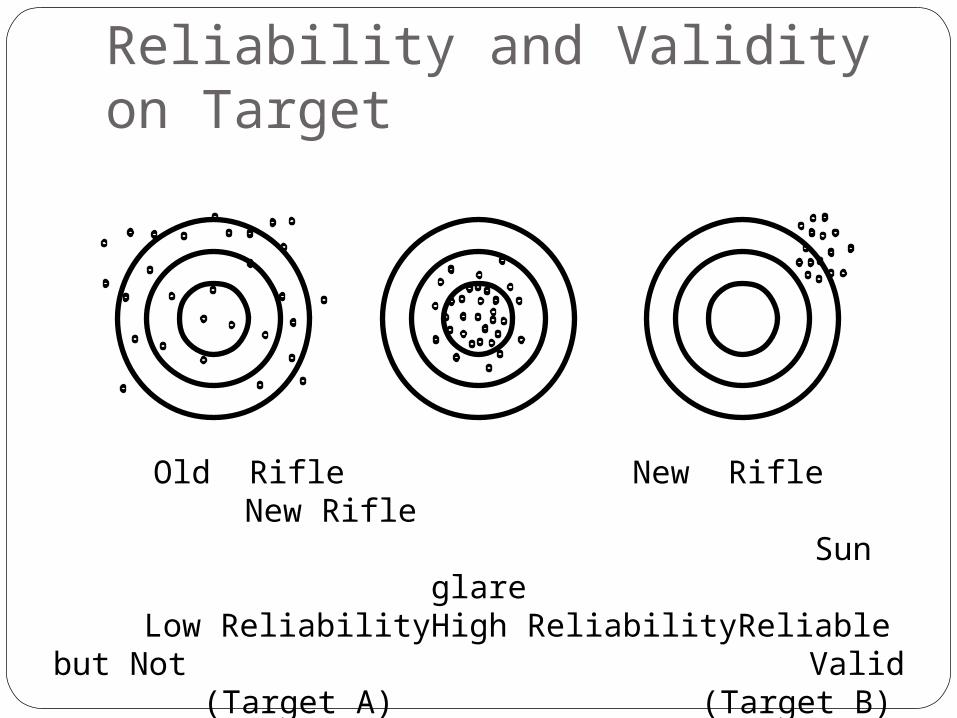
Old Rifle New Rifle New Rifle Sun glare
Low Reliability High Reliability Reliable but Not Valid
(Target A) (Target B) (Target C)
Reliability and Validity on Target

Validity
F A C E O R C O N TE N T
C O N C U R R E N T P R E D IC TIV E
C R ITE R IO N V A L ID ITY C O N S TR U C T V A L ID ITY
V a lid ity

Reliability
TE S T R E TE S T
S TA B IL ITY
E Q U IV A L E N T F O R M S S P L ITTIN G H A L V E S
IN TE R N A L C O N S IS TE N C Y
R E L IA B IL ITY

SensitivityA measurement instrument’s ability to
accurately measure variability in stimuli or responses.

A Classification of Scaling Techniques
Likert Semantic Differential
Stapel
Scaling Techniques
NoncomparativeScales
Comparative Scales
Paired Comparison
Rank Order
Constant Sum
Q-Sort and Other Procedures
Continuous Rating Scales
Itemized Rating Scales
A Comparison of Scaling Techniques
Comparative scales involve the direct comparison of stimulus objects. Comparative scale data must be interpreted in relative terms and have only ordinal or rank order properties.
In noncomparative scales, each object is
scaled independently of the others in the stimulus set. The resulting data are generally assumed to be interval or ratio scaled.

Comparative Scales
Advantages Disadvantages
Small differences between stimulus objects can be detected.
Same known reference points for all respondents.
Easily understood and can be applied.
Involve fewer theoretical assumptions.
Tend to reduce halo or carryover effects from one judgment to another.
Ordinal nature of the data
Inability to generalize beyond the stimulus objects scaled.

Comparative Scaling Techniques-a) Paired Comparison Scaling
A respondent is presented with two objects and asked to select one according to some criterion.
The data obtained are ordinal in nature.
Paired comparison scaling is the most widely-used comparative scaling technique.
With n brands, [n(n - 1) /2] paired comparisons are required.
Under the assumption of transitivity, it is possible to convert paired comparison data to a rank order.

Obtaining Shampoo Preferences Using Paired Comparisons
Instructions: We are going to present you with ten pairs of shampoo brands. For each pair, please indicate which one of the two brands of shampoo you would prefer for personal use. Recording Form:
Jhirmack Finesse Vidal Sassoon
Head & Shoulders
Pert
Jhirmack 0 0 1 0 Finesse 1a 0 1 0 Vidal Sassoon 1 1 1 1 Head & Shoulders 0 0 0 0 Pert 1 1 0 1 Number of Times Preferredb
3 2 0 4 1
a1 in a particular box means that the brand in that column was preferred over the brand in the corresponding row. A 0 means that the row brand was preferred over the column brand. bThe number of times a brand was preferred is obtained by summing
the 1s in each column.

Paired Comparison Selling
The most common method of taste testing is paired comparison. The consumer is asked to sample two different products and select the one with the most appealing taste. The test is done in private and a minimum of 1,000 responses is considered an adequate sample. A blind taste test for a soft drink, where imagery, self-perception and brand reputation are very important factors in the consumer’s purchasing decision, may not be a good indicator of performance in the marketplace. The introduction of New Coke illustrates this point. New Coke was heavily favored in blind paired comparison taste tests, but its introduction was less than successful, because image plays a major role in the purchase of Coke.
A paired comparison taste test

Comparative Scaling Techniques-b) Rank Order Scaling
Respondents are presented with several objects simultaneously and asked to order or rank them according to some criterion.
It is possible that the respondent may dislike the brand ranked 1 in an absolute sense.
Furthermore, rank order scaling also results in ordinal data.
Only (n - 1) scaling decisions need be made in rank order scaling.

Preference for Toothpaste Brands Using Rank Order ScalingInstructions: Rank the various brands of toothpaste in order of preference. Begin by picking out the one brand that you like most and assign it a number 1. Then find the second most preferred brand and assign it a number 2. Continue this procedure until you have ranked all the brands of toothpaste in order of preference. The least preferred brand should be assigned a rank of 10.
No two brands should receive the same rank number.
The criterion of preference is entirely up to you. There is no right or wrong answer. Just try to be consistent.

Preference for Toothpaste Brands Using Rank Order Scaling
Brand Rank Order
1. Crest _________
2. Colgate _________
3. Aim _________
4. Gleem _________
5. Sensodyne _________
6. Ultra Brite _________
7. Close Up _________
8. Pepsodent _________
9. Plus White _________
10. Stripe _________
Form

Comparative Scaling Techniques - c) Constant Sum Scaling
Respondents allocate a constant sum of units, such as 100 points to attributes of a product to reflect their importance.
If an attribute is unimportant, the respondent assigns it zero points.
If an attribute is twice as important as some other attribute, it receives twice as many points.
The sum of all the points is 100. Hence, the name of the scale.
Importance of Bathing Soap AttributesUsing a Constant Sum Scale
Instructions
On the next slide, there are eight attributes of bathing soaps. Please allocate 100 points among the attributes so that your allocation reflects the relative importance you attach to each attribute. The more points an attribute receives, the more important the attribute is. If an attribute is not at all important, assign it zero points. If an attribute is twice as important as some other attribute, it should receive twice as many points.

Fig. 8.5 cont.
Form Average Responses of Three Segments Attribute Segment I Segment II Segment III1. Mildness2. Lather 3. Shrinkage 4. Price 5. Fragrance 6. Packaging 7. Moisturizing 8. Cleaning Power
Sum
8 2 4 2 4 17 3 9 7
53 17 9 9 0 19 7 5 9 5 3 20
13 60 15 100 100 100
Importance of Bathing Soap AttributesUsing a Constant Sum Scale
Non-Comparative Scales

Non-comparative Scaling Techniques
Respondents evaluate only one object at a time, and for this reason non-comparative scales are often referred to as monadic scales.
Non-comparative techniques consist of
continuous scales
itemized rating scales.
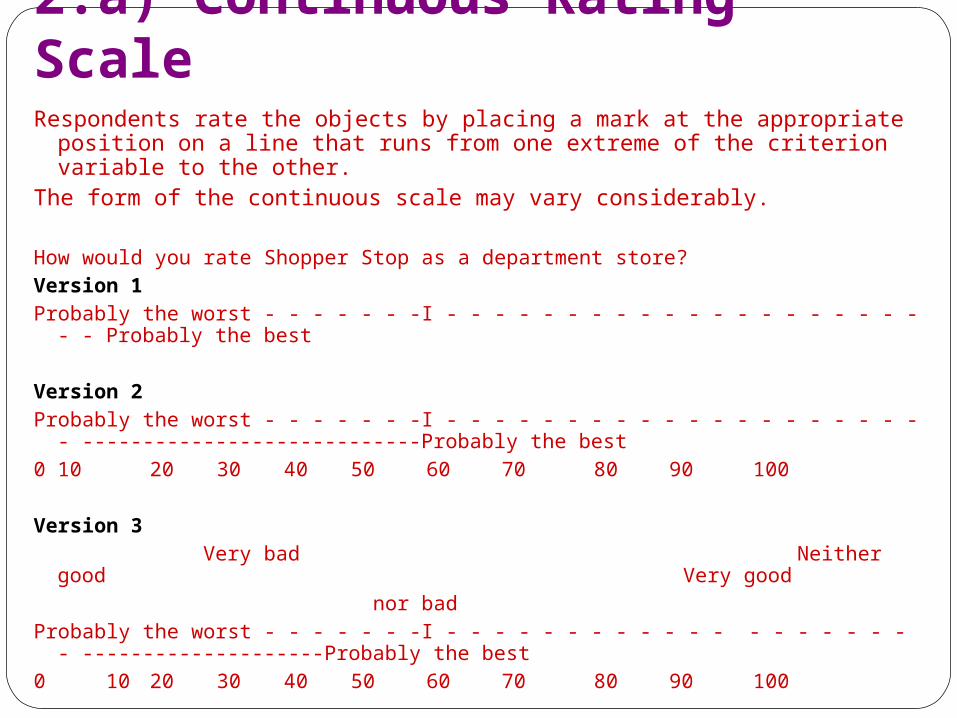
2.a) Continuous Rating ScaleRespondents rate the objects by placing a mark at the appropriate position
on a line that runs from one extreme of the criterion variable to the other.
The form of the continuous scale may vary considerably. How would you rate Shopper Stop as a department store?Version 1Probably the worst - - - - - - -I - - - - - - - - - - - - - - - - - - - - - - Probably the best Version 2Probably the worst - - - - - - -I - - - - - - - - - - - - - - - - - - - - - ----------------------------
Probably the best0 10 20 30 40 50 60 70 80 90 100 Version 3
Very bad Neither good Very good
nor badProbably the worst - - - - - - -I - - - - - - - - - - - - - - - - - - - - --------------------Probably the
best0 10 20 30 40 50 60 70 80 90 100

A relatively new research tool, the perception analyzer, provides continuous measurement of “gut reaction.” A group of up to 400 respondents is presented with TV or radio spots or advertising copy. The measuring device consists of a dial that contains a 100-point range. Each participant is given a dial and instructed to continuously record his or her reaction to the material being tested . .
As the respondents turn the dials, the information is fed to a computer, which tabulates second-by-second response profiles. As the results are recorded by the computer, they are superimposed on a video screen, enabling the researcher to view the respondents' scores immediately. The responses are also stored in a permanent data file for use in further analysis. The response scores can be broken down by categories, such as age, income, sex, or product usage.
RATE: Rapid Analysis and Testing Environment

2. b) Itemized Rating Scales
The respondents are provided with a scale that has a number or brief description associated with each category.
The categories are ordered in terms of scale position, and the respondents are required to select the specified category that best describes the object being rated.
The commonly used itemized rating scales are the Likert, semantic differential, and Stapel scales.

Likert ScaleThe Likert scale requires the respondents to indicate a degree of
agreement or
disagreement with each of a series of statements about the stimulus objects.
Strongly Disagree Neither Agree Strongly
disagree agree nor agree
disagree
1. Sears sells high quality merchandise. 1 2X 3 4 5
2. Sears has poor in-store service. 1 2X 3 4 5
3. I like to shop at Sears. 1 2 3X 4 5
The analysis can be conducted on an item-by-item basis (profile analysis), or a total (summated) score can be calculated.
When arriving at a total score, the categories assigned to the negative statements by the respondents should be scored by reversing the scale.

Semantic Differential Scale
The semantic differential is a seven-point rating scale with end
points associated with bipolar labels that have semantic meaning.
SEARS IS:
Powerful --:--:--:--:-X-:--:--: Weak
Unreliable --:--:--:--:--:-X-:--: Reliable
Modern --:--:--:--:--:--:-X-: Old-fashioned
The negative adjective or phrase sometimes appears at the left side of the scale and sometimes at the right.
This controls the tendency of some respondents, particularly those with very positive or very negative attitudes, to mark the right- or left-hand sides without reading the labels.
Individual items on a semantic differential scale may be scored on either a -3 to +3 or a 1 to 7 scale.

A Semantic Differential Scale for Measuring Self- Concepts, Person Concepts, and Product Concepts
1) Rugged :---:---:---:---:---:---:---: Delicate
2) Excitable :---:---:---:---:---:---:---: Calm
3) Uncomfortable :---:---:---:---:---:---:---: Comfortable
4) Dominating :---:---:---:---:---:---:---: Submissive
5) Thrifty :---:---:---:---:---:---:---: Indulgent
6) Pleasant :---:---:---:---:---:---:---: Unpleasant
7) Contemporary :---:---:---:---:---:---:---: Obsolete
8) Organized :---:---:---:---:---:---:---: Unorganized
9) Rational :---:---:---:---:---:---:---: Emotional
10) Youthful :---:---:---:---:---:---:---: Mature
11) Formal :---:---:---:---:---:---:---: Informal
12) Orthodox :---:---:---:---:---:---:---: Liberal
13) Complex :---:---:---:---:---:---:---: Simple
14) Colorless :---:---:---:---:---:---:---: Colorful
15) Modest :---:---:---:---:---:---:---: Vain
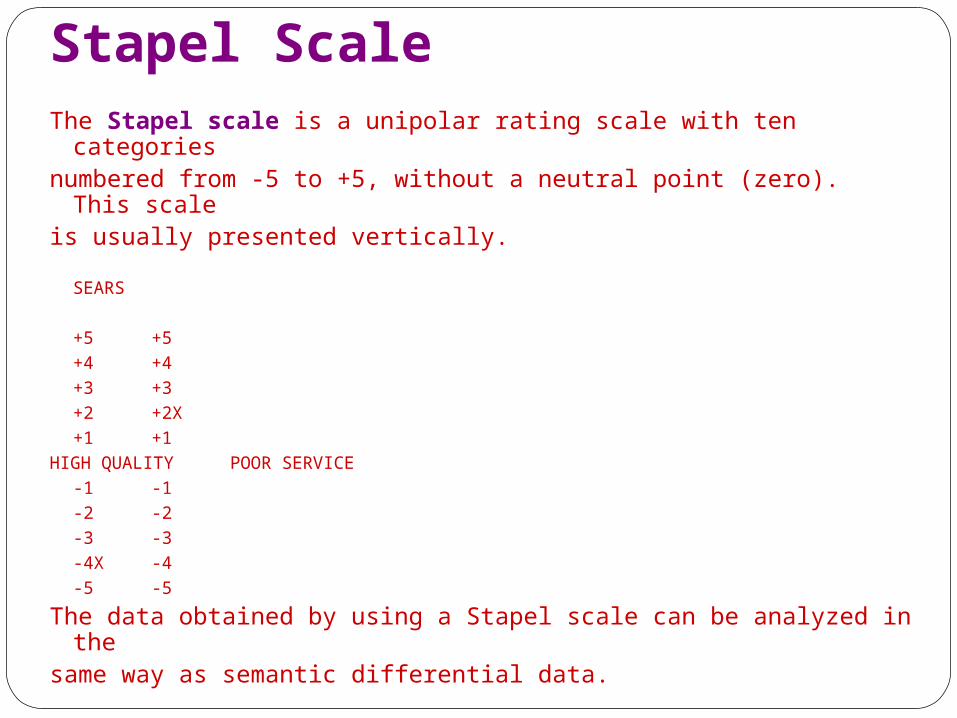
Stapel ScaleThe Stapel scale is a unipolar rating scale with ten categoriesnumbered from -5 to +5, without a neutral point (zero). This
scaleis usually presented vertically.
SEARS
+5 +5+4 +4+3 +3+2 +2X+1 +1
HIGH QUALITY POOR SERVICE-1 -1-2 -2-3 -3-4X -4-5 -5
The data obtained by using a Stapel scale can be analyzed in thesame way as semantic differential data.

Scale Basic Characteristics
Examples Advantages Disadvantages
Continuous Rating Scale
Place a mark on a continuous line
Reaction to TV commercials
Easy to construct Scoring can be cumbersome unless computerized
Itemized Rating Scales
Likert Scale Degrees of
agreement on a 1 (strongly disagree) to 5 (strongly agree)
scale
Measurement of attitudes
Easy to construct, administer, and understand
More time - consuming
Semantic Differential
Seven - point scale with bipolar labels
Brand, product, and company images
Versatile Controversy as to whether the data are interval
Stapel Scale
Unipolar ten - point scale, - 5 to +5, witho ut a neutral point (zero)
Measurement of attitudes and images
Easy to construct, administer over telephone
Confusing and difficult to apply
Basic Noncomparative Scales

Summary of Itemized Scale Decisions
1) Number of categories Although there is no single, optimal number,traditional guidelines suggest that thereshould be between five and nine categories
2) Balanced vs. unbalanced In general, the scale should be balanced to
obtain objective data
3) Odd/even no. of categories If a neutral or indifferent scale response ispossible for at least some respondents,an odd number of categories should be used
4) Forced vs. non-forced In situations where the respondents are
expected to have no opinion, the accuracy ofthe data may be improved by a non-forced
scale
5) Verbal description An argument can be made for labeling all ormany scale categories. The category
descriptions should be located as close to the response categories as possible
6) Physical form A number of options should be tried and thebest selected

Scale Evaluation
Discriminant NomologicalConvergent
Test/ Retest
Alternative Forms
Internal Consistency
Content Criterion Construct
GeneralizabilityReliability Validity
Scale Evaluation

Measurement Accuracy
The true score model provides a framework for understanding the accuracy of measurement.
XO = XT + XS + XR
where
XO = the observed score or measurement
XT = the true score of the characteristic
XS = systematic error
XR = random error
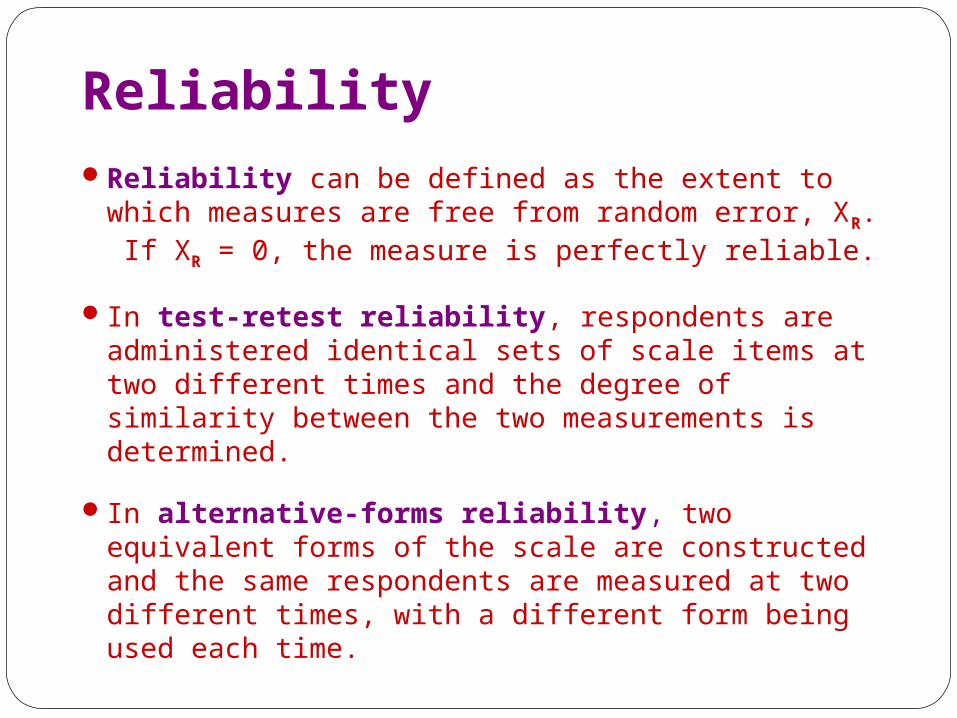
ReliabilityReliability can be defined as the extent to
which measures are free from random error, XR. If XR = 0, the measure is perfectly reliable.
In test-retest reliability, respondents are administered identical sets of scale items at two different times and the degree of similarity between the two measurements is determined.
In alternative-forms reliability, two equivalent forms of the scale are constructed and the same respondents are measured at two different times, with a different form being used each time.

Reliability
Internal consistency reliability determines the extent to which different parts of a summated scale are consistent in what they indicate about the characteristic being measured.
In split-half reliability, the items on the scale are divided into two halves and the resulting half scores are correlated.
The coefficient alpha, or Cronbach's alpha, is the average of all possible split-half coefficients resulting from different ways of splitting the scale items. This coefficient varies from 0 to 1, and a value of 0.6 or less generally indicates unsatisfactory internal consistency reliability.

ValidityThe validity of a scale may be defined as the extent
to which differences in observed scale scores reflect true differences among objects on the characteristic being measured, rather than systematic or random error. Perfect validity requires that there be no measurement error (XO = XT, XR = 0, XS = 0).
Content validity is a subjective but systematic evaluation of how well the content of a scale represents the measurement task at hand.
Criterion validity reflects whether a scale performs as expected in relation to other variables selected (criterion variables) as meaningful criteria.

Validity
Construct validity addresses the question of what construct or characteristic the scale is, in fact, measuring. Construct validity includes convergent, discriminant, and nomological validity.Convergent validity is the extent to which the
scale correlates positively with other measures of the same construct.
Discriminant validity is the extent to which a measure does not correlate with other constructs from which it is supposed to differ.
Nomological validity is the extent to which the scale correlates in theoretically predicted ways with measures of different but related constructs.

Relationship Between Reliability and Validity
If a measure is perfectly valid, it is also perfectly reliable. In this case XO = XT, XR = 0, and XS = 0.
If a measure is unreliable, it cannot be perfectly valid, since at a minimum XO = XT + XR. Furthermore, systematic error may also be present, i.e., XS≠0. Thus, unreliability implies invalidity.
If a measure is perfectly reliable, it may or may not be perfectly valid, because systematic error may still be present (XO = XT + XS).
Reliability is a necessary, but not sufficient, condition for validity.

Chapter SevenValidity Issues
in
Causal or Experimental Research Design:

Definitions and ConceptsIndependent variables are variables or alternatives
that are manipulated and whose effects are measured and compared, e.g., price levels.
Test units are individuals, organizations, or other entities whose response to the independent variables or treatments is being examined, e.g., consumers or stores.
Dependent variables are the variables which measure the effect of the independent variables on the test units, e.g., sales, profits, and market shares.
Extraneous variables are all variables other than the independent variables that affect the response of the test units, e.g., store size, store location, and competitive effort.

Experimental Design
An experimental design is a set of procedures specifying:
the test units and how these units are to be divided into homogeneous subsamples,
what independent variables or treatments are to be manipulated,
what dependent variables are to be measured; and
how the extraneous variables are to be controlled.

Basic Issues of Experimental Design
Manipulation of the Independent Variable
Selection of Dependent Variable
Assignment of Subjects (or other Test Units)
Control Over Extraneous Variables

Manipulation of Independent VariableClassificatory Vs. continuous variablesExperimental and control groupsTreatment levelsMore than one independent variable

Experimental Treatments The alternative manipulations of the
independent variable being investigated
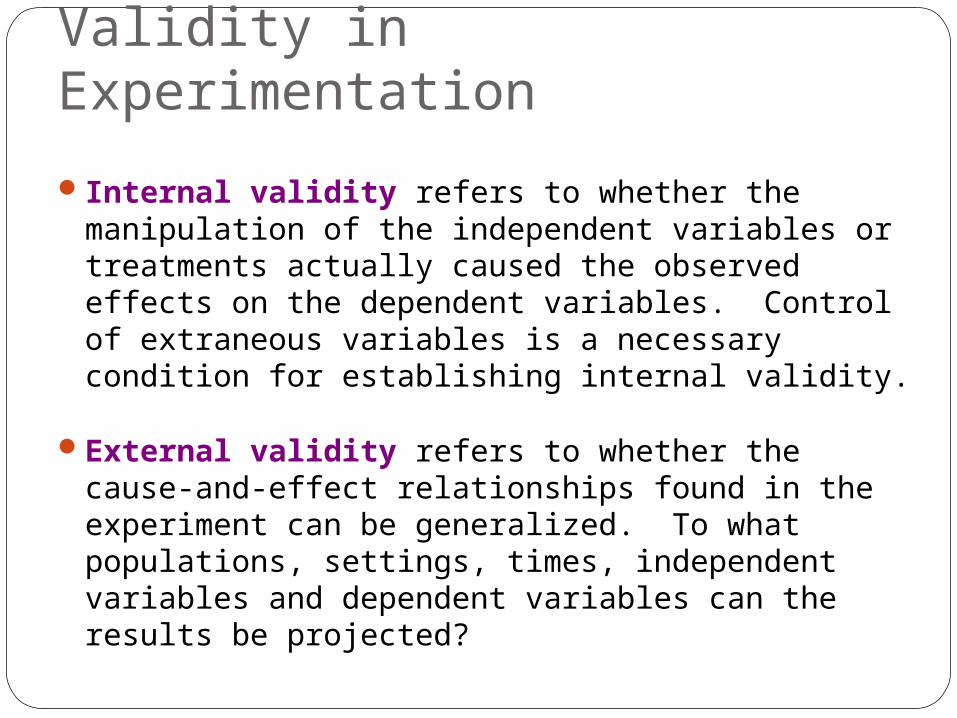
Validity in Experimentation
Internal validity refers to whether the manipulation of the independent variables or treatments actually caused the observed effects on the dependent variables. Control of extraneous variables is a necessary condition for establishing internal validity.
External validity refers to whether the cause-and-effect relationships found in the experiment can be generalized. To what populations, settings, times, independent variables and dependent variables can the results be projected?

History refers to specific events that are external to the experiment but occur at the same time as the experiment.
Maturation (MA) refers to changes in the test units themselves that occur with the passage of time.
Testing effects are caused by the process of experimentation. Typically, these are the effects on the experiment of taking a measure on the dependent variable before and after the presentation of the treatment.
The main testing effect (MT) occurs when a prior observation affects a latter observation.
Extraneous Variables

Extraneous VariablesIn the interactive testing effect (IT), a prior
measurement affects the test unit's response to the independent variable.
Instrumentation (I) refers to changes in the measuring instrument, in the observers or in the scores themselves.
Statistical regression effects (SR) occur when test units with extreme scores move closer to the average score during the course of the experiment.
Selection bias (SB) refers to the improper assignment of test units to treatment conditions.
Mortality (MO) refers to the loss of test units while the experiment is in progress.

Controlling Extraneous VariablesRandomization refers to the random assignment
of test units to experimental groups by using random numbers. Treatment conditions are also randomly assigned to experimental groups.
Matching involves comparing test units on a set of key background variables before assigning them to the treatment conditions.
Statistical control involves measuring the extraneous variables and adjusting for their effects through statistical analysis.
Design control involves the use of experiments designed to control specific extraneous variables.

A Classification of Experimental Designs
Pre-experimental
•One-Shot Case Study
•One Group Pretest-Posttest
•Static Group
True Experimental
•Pretest-Posttest Control Group
•Posttest: Only Control Group
•Solomon Four-Group
Quasi Experimental
Time Series
Multiple Time Series
Statistical
Randomized Blocks
Latin Square
Factorial Design
Figure 7.1
Experimental Designs
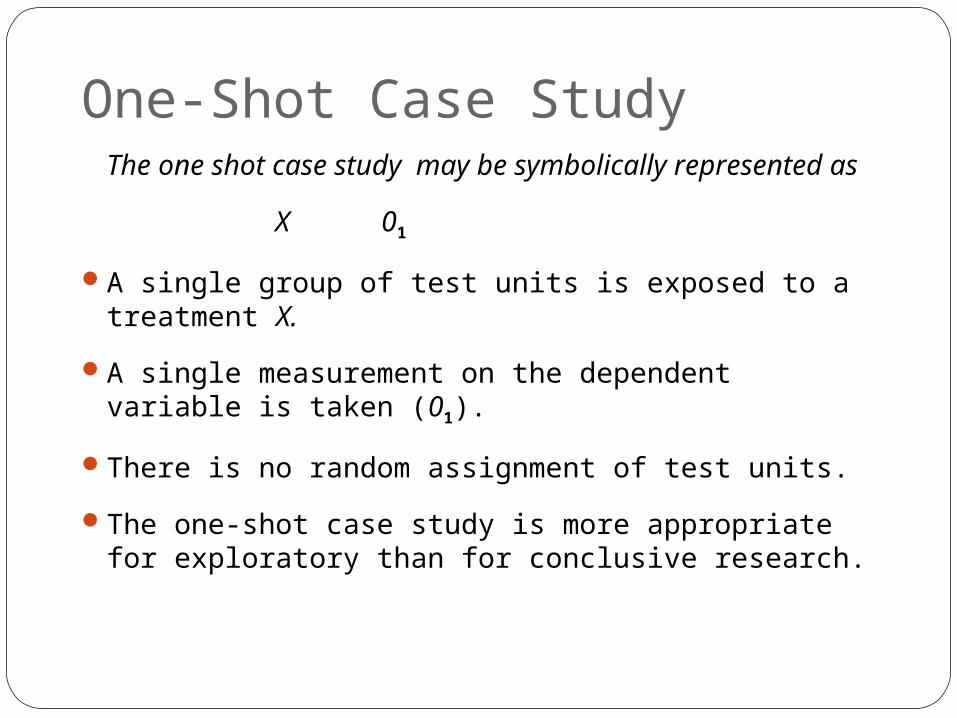
One-Shot Case StudyThe one shot case study may be symbolically represented as
X 01
A single group of test units is exposed to a treatment X.
A single measurement on the dependent variable is taken (01).
There is no random assignment of test units.
The one-shot case study is more appropriate for exploratory than for conclusive research.

One-Group Pretest-Posttest Design
01 X 02
A group of test units is measured twice.
There is no control group.
The treatment effect is computed as 02 – 01.
The validity of this conclusion is questionable since extraneous variables are largely uncontrolled.

Static Group Design
EG: X 01
CG: 02
A two-group experimental design.
The experimental group (EG) is exposed to the treatment, and the control group (CG) is not.
Measurements on both groups are made only after the treatment.
Test units are not assigned at random.
The treatment effect would be measured as 01 - 02.

True Experimental Designs: Pretest-Posttest Control Group Design EG: R 01 X 02
CG: R 03 04
Test units are randomly assigned to either the experimental or the control group.
A pretreatment measure is taken on each group. The treatment effect (TE) is measured as:(02 - 01) - (04 - 03). Selection bias is eliminated by randomization. The other extraneous effects are controlled as follows:
02 – 01= TE + H + MA + MT + IT + I + SR + MO
04 – 03= H + MA + MT + I + SR + MO= EV (Extraneous Variables)
The experimental result is obtained by:
(02 - 01) - (04 - 03) = TE + IT Interactive testing effect is not controlled.

Posttest-Only Control Group Design
EG : R X 01
CG : R 02
The treatment effect is obtained by:
TE = 01 - 02
Except for pre-measurement, the implementation of this design is very similar to that of the pretest-posttest control group design.

Quasi-Experimental Designs: Time Series Design
01 02 03 04 05 X 06 07 08 09 010
There is no randomization of test units to treatments.
The timing of treatment presentation, as well as which test units are exposed to the treatment, may not be within the researcher's control.

Multiple Time Series Design
EG : 01 02 03 04 05 X 06 07 08 09 010
CG : 01 02 03 04 05 06 07 08 09 010
If the control group is carefully selected, this design can be an improvement over the simple time series experiment.
Can test the treatment effect twice: against the pretreatment measurements in the experimental group and against the control group.
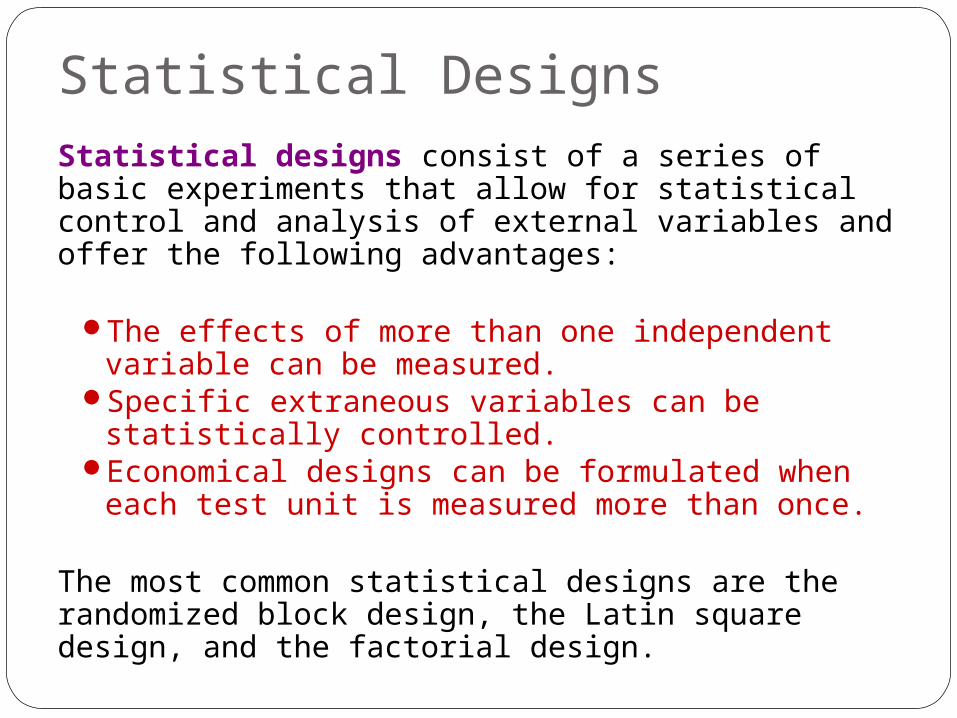
Statistical DesignsStatistical designs consist of a series of basic experiments that allow for statistical control and analysis of external variables and offer the following advantages:
The effects of more than one independent variable can be measured.
Specific extraneous variables can be statistically controlled.
Economical designs can be formulated when each test unit is measured more than once.
The most common statistical designs are the randomized block design, the Latin square design, and the factorial design.

Randomized Block Design
Is useful when there is only one major external variable, such as store size, that might influence the dependent variable.
The test units are blocked, or grouped, on the basis of the external variable.
By blocking, the researcher ensures that the various experimental and control groups are matched closely on the external variable.

Randomized Block Design
Treatment Groups Block Store Commercial Commercial Commercial Number Patronage A B C 1 Heavy A B C 2 Medium A B C 3 Low A B C 4 None A B C
Table 7.4

Latin Square Design Allows the researcher to statistically control two
noninteracting external variables as well as to manipulate the independent variable.
Each external or blocking variable is divided into an equal number of blocks, or levels.
The independent variable is also divided into the same number of levels.
A Latin square is conceptualized as a table (see Table 7.5), with the rows and columns representing the blocks in the two external variables.
The levels of the independent variable are assigned to the cells in the table.
The assignment rule is that each level of the independent variable should appear only once in each row and each column, as shown in Table 7.5.
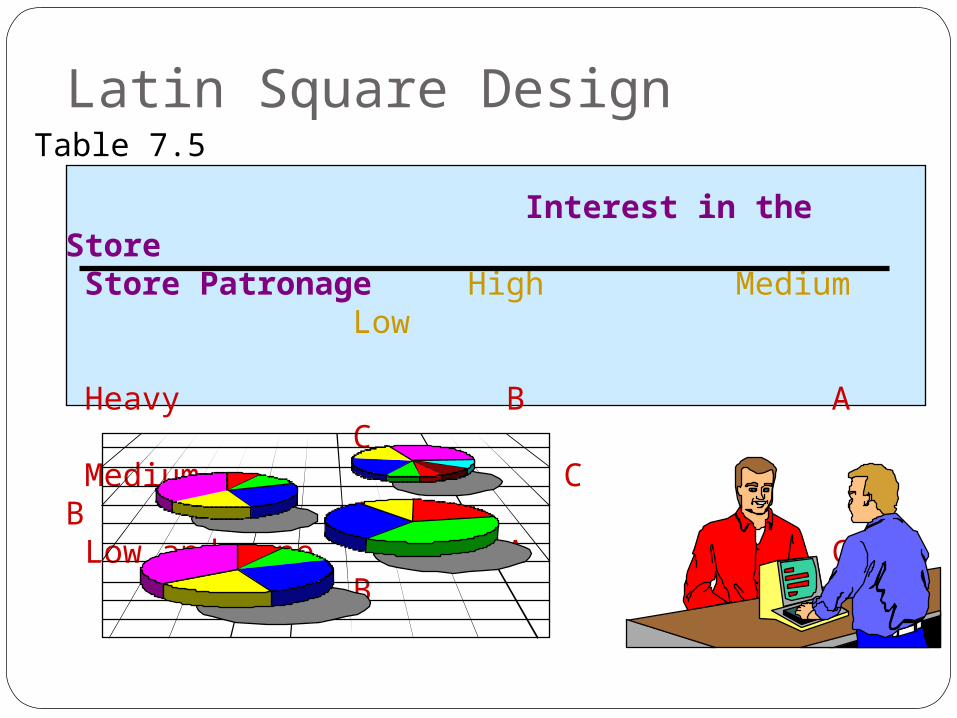
Latin Square DesignTable 7.5
Interest in the Store Store Patronage High Medium
Low
Heavy B A C Medium C B
A Low and none A C B

Factorial Design
Is used to measure the effects of two or more independent variables at various levels.
A factorial design may also be conceptualized as a table.
In a two-factor design, each level of one variable represents a row and each level of another variable represents a column.
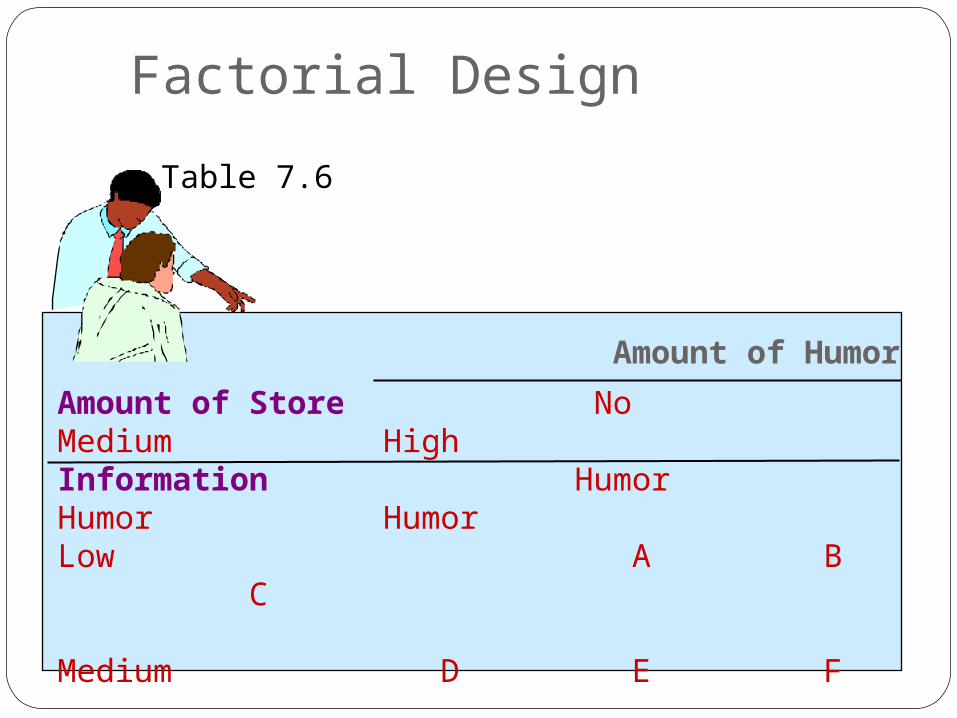
Factorial Design
Table 7.6
Amount of Humor
Amount of Store No Medium High Information Humor Humor HumorLow A B C
Medium D E F
High G H I