module 2: total quality management operations management as a competitive weapon
TRANSCRIPT

Module 2:
Total Quality Management
Operations Management as a Competitive Weapon

2
OM Course Framework
1. Cost
- Design & Selection
2. Quality
- TQM
- SQC
3. Dependability
- Project Management
- JIT
4. Flexibility
- Inventory
- Supply Chain
- Location
- Forecasting
- Aggregate Planning

3Module 02: Total Quality Management
Learning Objectives
At the end of this module, each student will be able to:
1. Characterize various definitions of quality
2. Explain total quality management (TQM)
3. Understand TQM tools

4Module 02: Total Quality Management
1. Some Definitions of Quality
ASQC – customer satisfaction
User – consumer says it is
Design – marketplace
Conformance – meet specifications

5Module 02: Total Quality Management
Traditional Quality Process (Mfg.)
Customer
SpecifiesNeed
Marketing
InterpretsNeed
Engineering Operations
ProducesProduct
PlansQuality
MonitorsQuality
DesignsProduct
DefinesQuality

6Module 02: Total Quality Management
InterpretsNeed
SpecifiesNeed
DesignsProduct
DefinesQuality
ProducesProduct
PlansQuality
MonitorsQuality
Customer Marketing Engineering Operations
Traditional Quality Process
How do the definitions of quality relate How do the definitions of quality relate to the traditional quality process?to the traditional quality process?

7Module 02: Total Quality Management
Traditional Quality Process
InterpretsNeed
SpecifiesNeed
DesignsProduct
DefinesQuality
ProducesProduct
PlansQuality
MonitorsQuality
Customer Marketing Engineering Operations
User Design Conformance

8Module 02: Total Quality Management
2. Total Quality Management
Quality system involving entire organization from supplier to customer
Objective: Meet or exceed customer needs
through company-wide continuous improvement
Early proponents W. Edwards Deming - natural variability Philip B. Crosby - Quality is Free Joseph Juran – Cost of Quality

9Module 02: Total Quality Management
Deming: Natural variability
All process are subject to variability
Natural causes
Assignable causes
Objective: Identify assignable
causes

10Module 02: Total Quality Management
Crosby: Quality is Free
ImprovedQuality
IncreasedProfits
Lower CostsProductivityRework/ScrapWarranty
Market GainsReputationVolumePrice

11Module 02: Total Quality Management
Joseph Juran: Costs of Quality
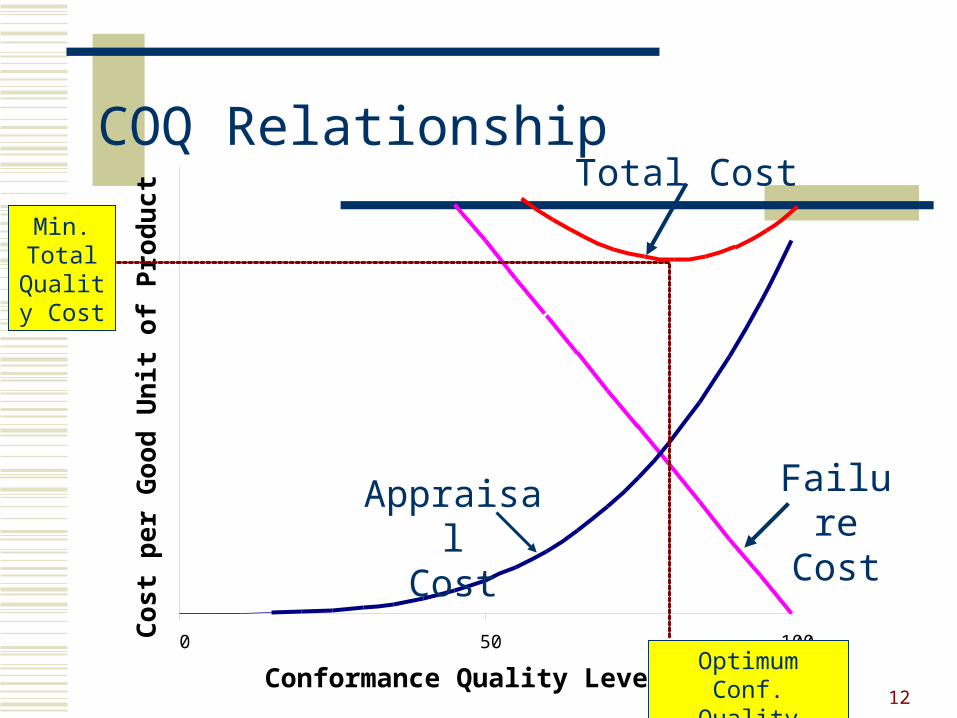
12
COQ RelationshipTotal Cost
FailureCost
50 100
Conformance Quality Level (%)
0
C
ost
per
Good
Un
it o
f P
rod
uct
AppraisalCost
Min. Total
Quality Cost
Optimum Conf.
Quality Level

13Module 02: Total Quality Management
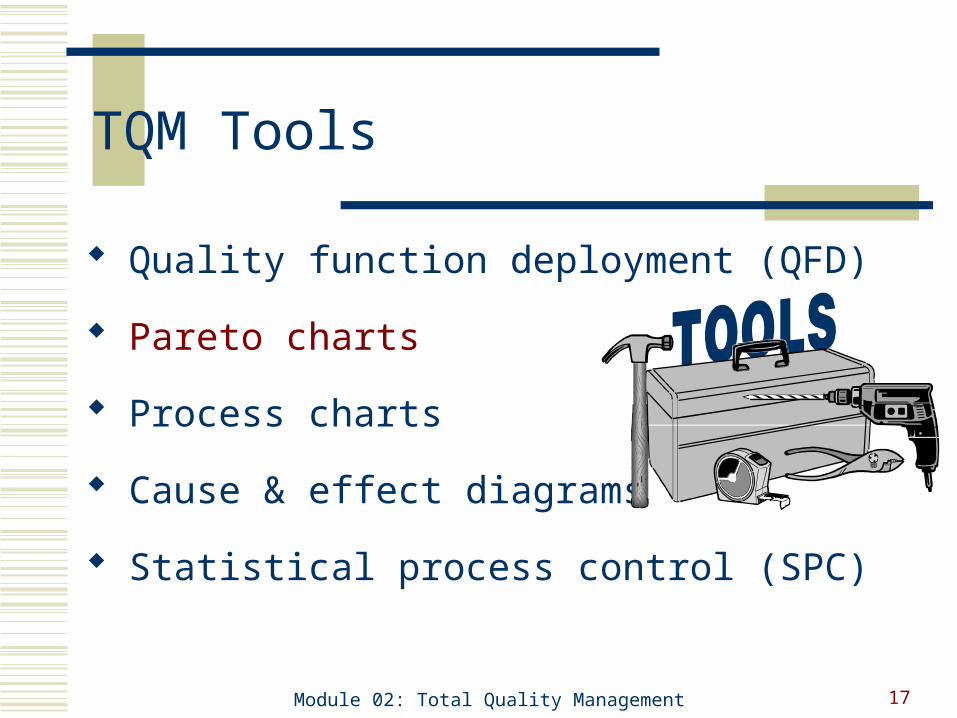
Quality function deployment (QFD)
Pareto charts
Process charts
Cause & effect diagrams
Statistical process control (SPC)
3. TQM Tools
14Module 02: Total Quality Management
Quality Function Deployment
Mitsubishi shipyard Toyota Motor Corporation
Product design process using
cross-functional teams Marketing, engineering, manufacturing
Translates customer preferences into
specific product characteristics

15Module 02: Total Quality Management
Comparing “Voices”
Voice of the
Customer
Voice of the Engineer
Customer-basedBenchmarks
16Module 02: Total Quality Management
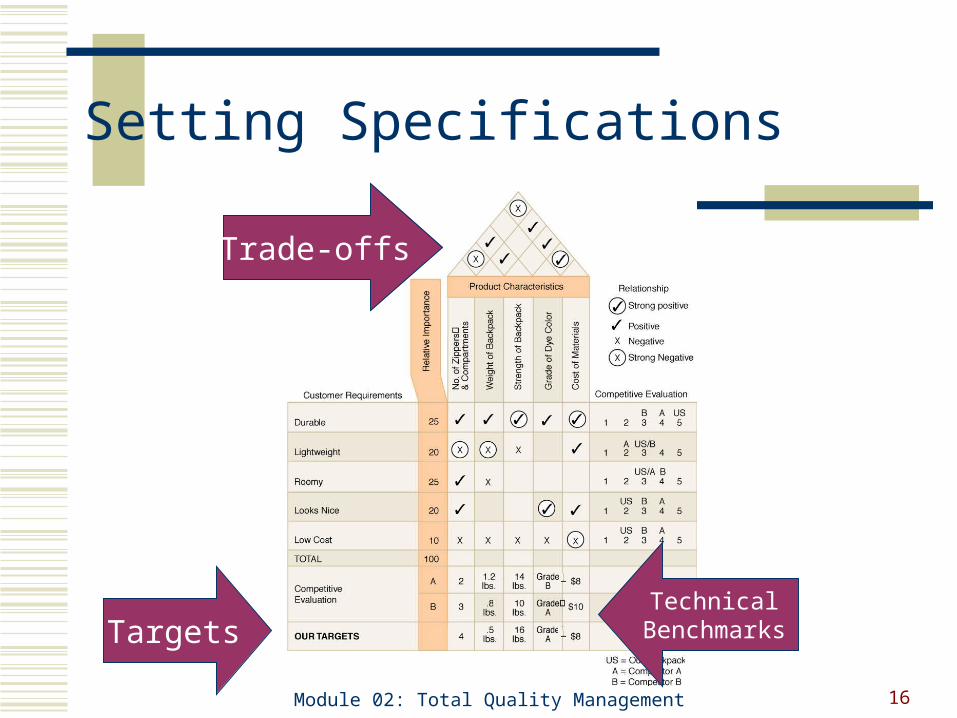
Setting Specifications
Trade-offs
TargetsTechnical
Benchmarks
17Module 02: Total Quality Management
Quality function deployment (QFD)
Pareto charts
Process charts
Cause & effect diagrams
Statistical process control (SPC)
TQM Tools

18Module 02: Total Quality Management
Pareto Analysis
Helps identify the degree of importance of different quality problems

19Module 02: Total Quality Management
Quality function deployment (QFD)
Pareto charts
Process charts
Cause & effect diagrams
Statistical process control (SPC)
TQM Tools

20Module 02: Total Quality Management
Process Charts
Diagrams of the steps involved in an operation or process

21Module 02: Total Quality Management
Quality function deployment (QFD)
Pareto charts
Process charts
Cause & effect diagrams
Statistical process control (SPC)
TQM Tools

22Module 02: Total Quality Management
Cause-and-Effect Diagrams
Also called Fishbone Diagrams Help identify potential causes of
specific ‘effects’ (quality problems)

23Module 02: Total Quality Management
Quality function deployment (QFD)
Pareto charts
Process charts
Cause & effect diagrams
Statistical process control (SPC)
TQM Tools

24Module 02: Total Quality Management
Control Charts
Track whether a process is operating as expected