module 2 sources/types and characteristics of solid …
TRANSCRIPT

MODULE 2
SOURCES/TYPES AND
CHARACTERISTICS OF SOLID WASTE

LECTURE 4
Sampling and Characteristics
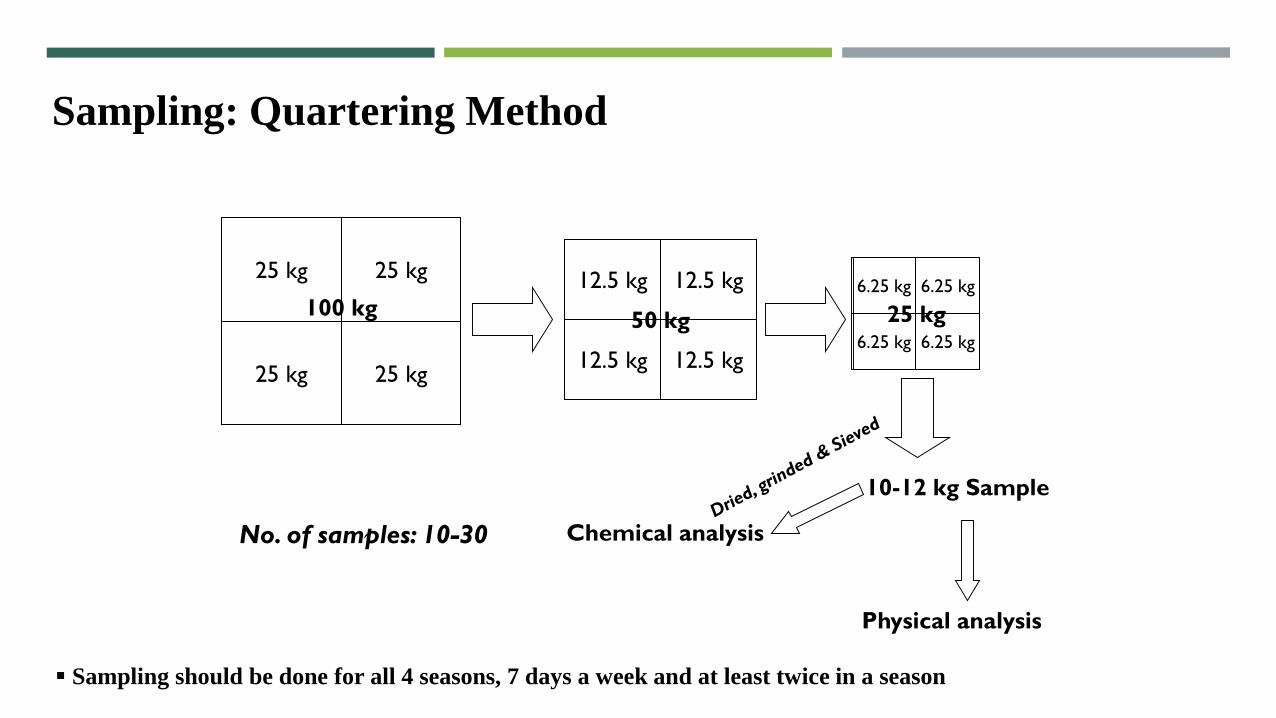
Sampling: Quartering Method
100 kg
25 kg 25 kg
25 kg 25 kg
50 kg
12.5 kg 12.5 kg
12.5 kg 12.5 kg
25 kg
6.25 kg 6.25 kg
6.25 kg 6.25 kg
10-12 kg Sample
Physical analysis
Chemical analysisNo. of samples: 10-30
Sampling should be done for all 4 seasons, 7 days a week and at least twice in a season

Waste Characteristics: Physical
Compositional Analysis
The wastes are separated on the basis physical properties such as dry, wet, paper, glass, metal, household hazardous,
construction and mixed/ miscellaneous.
They are weighed and are represented as a fraction of total waste.
Importance of compositional analysis
Selection and operation of equipment and facilities.
Design of disposal facility.

City Paper
(%)
Textile
(%)
Plastic
(%)
Glass
(%)
Metal
(%)
Inert materials
(%)
Biodegradable matter
(%)
Ahmedabad 6 1 3 - - 50 40
Bangalore 8 5 6 6 3 27 45
Bhopal 10 5 2 1 - 35 45
Mumbai 10 3.6 2 0.2 - 44 40
Kolkata 10 3 8 3 - 35 40
Coimbatore 5 9 1 - - 50 35
Delhi 6.6 4 1.5 1.2 2.5 51.5 31.78
Hyderabad 7 1.7 1.3 - - 50 40
Indore 5 2 1 - - 49 43
Jaipur 6 2 1 2 - 47 42
Kanpur 5 1 1.5 - - 52.5 40
Municipal solid waste (MSW) characteristics of few cities in India as per Central Pollution Control
Board (CPCB, 2000)

City Paper
(%)
Textile
(%)
Plastic
(%)
Glass
(%)
Metal
(%)
Inert materials
(%)
Biodegradable matter
(%)
Kochi 4.9 - 1.1 - - 36 58
Lucknow 4 2 4 - 1 49 40
Ludhiana 3 5 3 - - 30 40
Madras 10 5 3 - - 33 44
Madurai 5 1 3 - - 46 45
Nagpur 4.5 7 1.25 1.2 0.35 53.4 30.4
Patna 4 5 6 2.0 1 35 45
Pune 5 - 5 10 - 15 55
Surat 4 5 3 3 - 45 40
Vadodara 4 - 7 - - 49 40
Varanasi 3 4 10 - - 35 48
Visakhapatnam 3 2 5 5 - 50 35
Cont..

Variation in composition depends on:
1. Location: The commercial activity present,
the food type, hilly or plane, and warm or
cold.
2. Season: One of the key factors affecting the
generation and composition of residual
waste.
3. Economy: Fraction of dry waste generated
from HIG households is high compared to
that of LIG households.
42.21
47.43
42.51
3.63
8.139.63
0.6
9.22 10.11
0.49 0.5 0.630.6 1.01 0.96
45.13
25.16
17
0
10
20
30
40
50
60
1996 2005 2011P
erc
en
tage
Year
Compositional variation of MSW in India
Biodegradables Paper Plastic and rubber
Metal Glass Inert
Source: Planning Commission Report, 2014
Compositional variation

Specific weight is defined as the weight of a material
per unit volume.
Generally, higher waste density (400-600 kg/m3) is
observed in India may be because of high amount of
inert material.
It is helpful to know the collection vehicle capacity
and landfill capacity also.
It is often reported as loose, as found in containers,
uncompacted, or compacted.
It varies with season of the year, geographic location
and length of time in storage.
Typical specific weight values of Asian countries
Specific Weight

Particle Size
The size and distribution of the waste material are an important consideration in the recovery of materials, especially
with mechanical means such as trommel screen and magnetic separator.
The size of the waste component maybe defined by one or more of the following equations:
Sc = size of the component (mm)
l = length (mm)
w – width (mm)
h = height (mm)
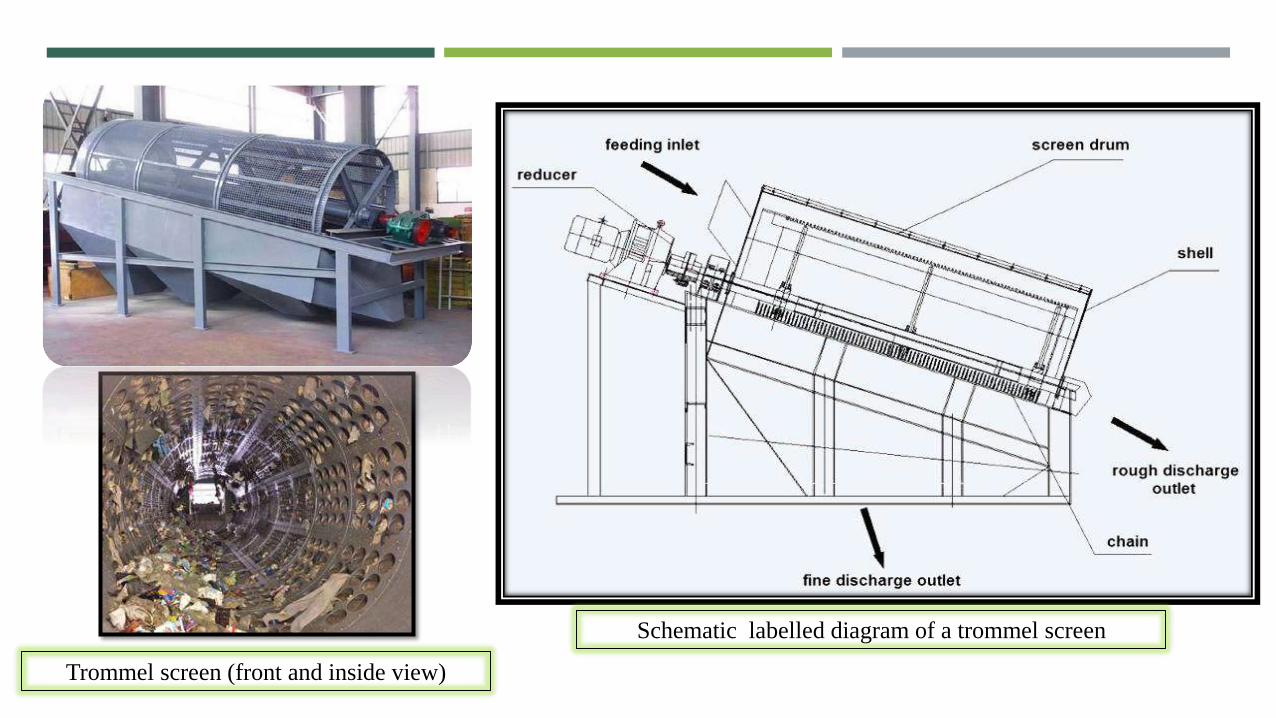
Trommel screen (front and inside view)
Schematic labelled diagram of a trommel screen

Mounted at discharge end
Mounted across the belt
Pictorial representation of a suspended magnetic separator
Working principle of a magnetic separator

Field Capacity
The field capacity of solid waste is the total amount of moisture that can be retained in the waste sample subject to
the downward pull of gravity.
It is very important in determining the formation of leachate in landfill.
Water in excess of the field capacity will be released as leachate.
The field capacity varies with the degree of applied pressure and the state of the decomposition of the wastes.


Waste Characteristics: Chemical
Information on the chemical composition of the components that constitute MSW is important in evaluating alterative
processing and recovery options.
Proximate analysis
The proximate analysis is important in evaluating the combustion properties of waste or waste derived fuel (refuse
derived fuel). The fractions of greatest interest are:
Moisture content:
Loss of moisture occur when heated to 104oC for 24 h.
Moisture adds weight to the waste/fuel without increasing its heating value and the evaporation of water
reduces the heat released from the fuel.
Ash:
Weight of residue after combustion at 550oC (for 2 hours) in an open crucible.
Ash also adds weight without releasing any heat during combustion.

Volatile matter:
Additional loss of weight on ignition at 700-950oC in a covered crucible.
Volatile matter is that portion of the waste that is converted to gas before and during combustion. The gases are
passed through a combustion chamber where rapid combustion occurs.
Fixed carbon:
Combustible residue left after volatile matter is removed.
Fixed carbon represents the carbon remaining on the surface of grates as char. Waste or fuel with a high
proportion of fixed carbon requires a longer retention time on the furnace grates to achieve complete combustion
than does waste/fuel with a low proportion of fixed carbon.
Moisture (%) + Ash (%) + Volatile (%) + Fixed carbon (%) = 100%

An example of a tabulated proximate analysis of MSW of Jalandhar city of Punjab, India
Source: Sethi, Sapna & Kothiyal, N.C. & Nema, Arvind & Kaushik, M.. (2013). Characterization of Municipal Solid Waste in Jalandhar City, Punjab,
India. Journal of Hazardous, Toxic, and Radioactive Waste. 17. 97-106.
28.1
15.69.5
46.6
Average values for proximate analysis of MSW, Bhopal
Moisture (%)
Ash (%)
Fixed carbon (%)
Volatile matter (%)Source: Katiyar, R.B. & Sundaramurthy, Suresh & Sharma, A.K.. (2013).
Characterisation of municipal solid waste generated by the city of Bhopal,
India. International Journal of ChemTech Research. 5. 623-628.
An example of proximate analysis of MSW of Bhopal city of Madhya Pradesh, India
Ultimate analysis
Ultimate analysis of waste is carried out to determine the proportion of carbon, hydrogen, oxygen, nitrogen and
sulphur (C, H, O, N and S).
The ultimate analysis is useful during mass balance calculation for chemical and thermal process.
The results are used to characterize the chemical composition of organic matter of MSW.
Also used to define proper mix to achieve suitable C/N ratio for biological conversion processes.
It can be analyzed by using CHONS analyzer.

An example of a tabulated ultimate analysis of MSW of Jalandhar city of Punjab, India
Source: Sethi, Sapna & Kothiyal, N.C. & Nema, Arvind & Kaushik, M.. (2013). Characterization of Municipal Solid Waste in Jalandhar City, Punjab,
India. Journal of Hazardous, Toxic, and Radioactive Waste. 17. 97-106.
26.6
5.947.7
1.1 0.98
Average values for ultimate analysis of MSW,
Bhopal
C (%)
H (%)
N (%)
O (%)
S (%)
An example of ultimate analysis of MSW of Bhopal city of Madhya Pradesh, India
Source: Katiyar, R.B. & Sundaramurthy, Suresh & Sharma, A.K.. (2013).
Characterisation of municipal solid waste generated by the city of Bhopal,
India. International Journal of ChemTech Research. 5. 623-628.

Energy Content (Calorific Value)
The energy content of the organic components in MSW can be
determined by:
1 BTU = 1055.06 J
2.326 BTU/lb = 1 kJ/kgEnergy content (BTU/lb): 145 C + 610 (H2-1/8 O2 ) + 40 S + 10 N
BOMB CALORIMETER
using a full scale boiler as a calorimeter,
using laboratory bomb calorimeter, or
Calculation, if elemental composition is known.
Because of difficulty in instrumenting a full-scale boiler, most of the
data on the energy content of the organic components of MSW are
based on the results of bomb calorimeter tests.
In India energy content measured in kcal/kg unit.
1 J = 0.24 g cal
C, H2, O2, S, N – percentage by weight

Cities Net Calorific Value
(kcal/kg)
Moisture Content (%)
Min Max Mean Min Max Mean
Cities with population less than 1 lakh 1234 3414 2149 42 65 52
Cities with population of 1-5 lakh 591 3766 2162 24 63 50
Cities with population of 5-10 lakh 591 2391 1481 17 64 48
Cities with population of 10-20 lakh 520 2762 1411 25 65 41
Cities with population above 20 lakh 834 2632 1772 21 63 47
Calorific Value and Moisture Content of MSW in Indian Cities (Source: CPCB:NEERI, 2006)

Calorific Value of Different Fractions of Waste (Source: ISWA, 2013)
Faction Net Calorific Value (kcal/kg)
Paper and cardboard 3821
Organic material 955
Plastic 8359
Glass 0
Metal 0
Textile 4538
Other materials 2627

Metal content (Trace elements)
The metal content (i.e. Cd, Cr, Hg, Ni, Zn, Mn, Pb, As etc.) should also be determined because of its potential harmful
environmental effects.
Fig: Atomic absorption spectroscopy
Principle of AAS

Waste Characteristics: Biological
The most important biological characteristic of the organic fraction of solid waste is that all of the organic components
can be converted biologically to gases and relatively inert organic and inorganic solids. The production of odor and
generation of flies are also related to the putrescible nature of the organic materials.
Volatile Solids
• Volatile solids content is often used as a measure of the biodegradability of the organic fraction of solid waste.
• It is not an exact indicator of biodegradability.
• Some organic constituents are highly volatile but low in biodegradability. Eg: newsprint.
Low
biodegradability,
high volatility

Biodegradable Fraction (BF)
Alternatively, the lignin content of a waste
can be used to estimate the biodegradable
fraction, using the formula:
BF = biological fraction expressed on a VS
basis,
0.83 & 0.028 = empirical constant
LC = lignin Content of the VS expressed as
a percent of dry weight
BF = 0.83 – 0.028 LC
Biodegradable fraction of a typical MSW of a city in India

Odour
• Typically, the formation of odours indicates the anaerobic decomposition of the
readily decomposable organic components found in solid waste are emptied.
Breeding of Flies
• During warm climates, breeding of flies is an important factor to be considered
for the on-sight storage of wastes.
• Flies can mature in less than two weeks after the eggs are laid.
• The larval (maggot), once developed, is very difficult to remove from the
containers.
THE END