module 2: fundamentals of epidemiology
DESCRIPTION
Module 2: Fundamentals of Epidemiology. Observational Studies. Developed through the APTR Initiative to Enhance Prevention and Population - PowerPoint PPT PresentationTRANSCRIPT

Developed through the APTR Initiative to Enhance Prevention and Population Health Education in collaboration with the Brody School of Medicine at East Carolina University with funding from the Centers for Disease Control and Prevention
Observational Studies

APTR wishes to acknowledge the following individual that developed this module:
Jeffrey Bethel, PhDDepartment of Public HealthBrody School of Medicine at East Carolina University
This education module is made possible through the Centers for Disease Control and Prevention (CDC) and the Association for Prevention Teaching and Research (APTR) Cooperative Agreement, No. 5U50CD300860. The module represents the opinions of the author(s) and does not necessarily represent the views of the Centers for Disease Control and Prevention or the Association for Prevention Teaching and Research.

1. Recognize criteria for initiating various observational studies
2. Identify design components of various observational studies
3. Calculate and interpret outcome measures in various observational studies
4. Recognize advantages and disadvantages to various observational studies


Experimental studies (experimental) Cohort studies (observational) Case-control studies (observational) Cross-sectional studies (observational)

Used to study a wider range of exposures than experimental studies
“Natural” experiments
Mitigate many issues which are not feasible in experimental studies

Etiology What are risk factors for developing disease? Includes study of behaviors, occupational or environmental
factors
Prognosis What factors predict mortality or disability? What elements of care predict other health-related outcomes
(e.g. quality of life)?


Smith, AH. The Epidemiologic Research Sequence. 1984

Cohort derived from Latin cohors = warriors, group of persons proceeding together in time
“Exposed” and “unexposed” are selected by the investigators to be followed longitudinally over time to observe difference in the incidence of the outcome
Incidence or follow-up studies

STUDYPOPULATION
EXPOSED UNEXPOSED
Develop Disease
Develop Disease
Do Not Develop Disease
NON-RANDOM ASSIGNMENT
Do Not Develop Disease

STUDYPOPULATION
EXPOSED UNEXPOSED
Develop Disease
Do Not Develop Disease
Develop Disease
NON-RANDOM ASSIGNMENT
Present
Future
Future
Do Not Develop Disease

STUDYPOPULATION
EXPOSED UNEXPOSED
Develop Disease
Do Not Develop Disease
Develop Disease
Do Not Develop Disease
NON-RANDOM ASSIGNMENT
Past
Past
Past

Due to large sample size, long follow-up time required and usual high cost, cohort studies usually initiated when: Sufficient evidence obtained from less expensive studies to indicate association of disease with certain exposure(s)
New agent requires monitoring for possible association with several diseases
• e.g. Oral Contraceptives or Hormone Replacement Therapy

Select groups based on exposure status (exposed and unexposed), follow through time and assess outcome
Select defined population (e.g. occupation, geographic area) before exposure, follow through time to separate by exposure status, and assess outcome
Framingham http://www.framinghamheartstudy.org/
Nurse’s Health Study http://www.channing.harvard.edu/nhs/
Women’s Health Initiative http://www.nhlbi.nih.gov/whi/
Health Professional’s Follow-up Study http://www.hsph.harvard.edu/hpfs/

Women’s Health Study ≥ 45 years No history of coronary heart disease, cerebrovascular
disease, cancer, or other major chronic illness No history of side effects to any of study medications Were not taking any of following meds more than once per
week: aspirin, NSAIDs, supplements of vitamin A, E, or beta-carotene
Were not taking anticoagulants or corticosteroids

Potential sources Occupational cohorts: ease of identification and
adequate number exposed (e.g. Nurse’s Health Study) Prepaid health plan members: ease of identification
and health records Schools, military: ease of identification and follow-up

Questionnaires
Laboratory tests
Physical measurements
Special procedures
Existing records

Compare the outcome for the “exposed” group to the outcome in a “substitute” population
Substitute population represents the “exposed group without the exposure”
Validity of inference depends on finding a valid substitute population

From same sample as exposed but do not have exposure
Strengths Most comparable to exposed group
Weaknesses May be difficult to identify Similar population probably has similar exposures

General population, other occupation
Strengths Accessible, stable data
Weaknesses Lack of comparability with exposed group Results may suffer from healthy worker effect Data on key variables may be missing

Sources of information include: Death certificates (if fatal) Hospital records (if hospitalization required) Disease registries (e.g. cancer, birth defects) Physicians records Physical exam (e.g. Framingham) Laboratory tests (e.g. infectious diseases) Questionnaires (if physical not required)

Large prospective cohort study providing longitudinal data on cardiovascular disease
Recruits residents of Framingham, Massachusetts in whom potential cardiovascular risk factors were first measured nearly 50 years ago

Incidence of coronary heart disease (CHD) increases with age and occurs earlier and more frequently in males
Persons with hypertension develop CHD at a greater rate than those who are normotensive
Elevated blood cholesterol level is associated with an increased risk of CHD
Tobacco smoking and habitual use of alcohol are associated with an increased incidence of CHD

Relative Risk = Incidence in Exposed Incidence in Unexposed
Measure of association used for deriving a causal inference

Develops Disease
Does Not Develop Disease
Totals Incidence of Disease
Exposed a b a+b
Not Exposed c d c+d
a a+b
c c+d
Relative Risk = Incidence in Exposed = a/a+b Incidence in Unexposed c/c+d

If Relative Risk = 1 exposure is NOT associated disease
If Relative Risk > 1 exposure is associated with an increased risk of disease
If Relative Risk < 1 exposure is associated with a decreased risk of disease (i.e. is protective)

CHD No CHD TotalsCHD
Incidence (per 1,000)
Smoke 84 2,916 3,000 28.0
No Smoke 87 4,913 5,000 17.4
Relative Risk = Incidence in Exposed = 28.0 Incidence in Unexposed 17.4
= 1.61
84 _ X 1,000 3,000
87 _ X 1,000 5,000

Life table Kaplan-Meier plot Incidence proportion Hazard ratio Multiple logistic regression

A cohort study of smoking and bladder cancer was conducted in a small island population. There were a total of 1,000 people on the island. Four hundred were smokers and 600 were not. Fifty of the smokers developed bladder cancer. Fifteen of the non-smokers developed bladder cancer.
Calculate and interpret relative risk (RR)

BladderCancer
No BladderCancer Totals Incidence of
Bladder Cancer
Smoke
No Smoke

BladderCancer
No BladderCancer Totals Incidence of
Bladder Cancer
Smoke 50 350 400
No Smoke 15 585 600

BladderCancer
No BladderCancer Totals Incidence of
Bladder Cancer
Smoke 50 350 400 0.125
No Smoke 15 585 600 0.025

Relative Risk = Incidence in Exposed = 0.125 = 5.0 Incidence in Unexposed 0.025
Relative Risk = a/(a+b) = 50/400 = 5.0 c/(c+d) 15/600
Interpretation:
Incidence of bladder cancer is 5 times as great in smokers as in non-smokers

Inefficient for evaluation of rare diseases If outcome has long latent period, study can take a
long time Generally more expensive If retrospective, requires availability of records Validity of results can be seriously affected by losses
to follow-up

Useful design when exposure is rare Examine multiple effects of single exposure (multiple
outcomes) If prospective, minimize bias in ascertainment of
exposure Examine temporal relationship between exposure and
disease Allows direct measurement of incidence of disease in
exposed and unexposed Direct calculation of relative risk


Smith, AH. The Epidemiologic Research Sequence. 1984

DISEASE NO DISEASE
EXPOSEDNOT
EXPOSED EXPOSED NOT EXPOSED
CASES CONTROLS

Disparaging term given to case-control studies because their logic seemed backwards and they seemed more prone to bias than other designs
Case-control studies are a logical extension of cohort studies and an efficient way to learn about associations

Little is known about the disease Exposure data are difficult or expensive to obtain Rare disease Disease with long induction and latent period Dynamic underlying population

Definition of a case Should lead to accurate classification of diseased and non-
diseased individuals
Homogeneous disease entity by strict diagnostic criteria, e.g. distinguishing cancer of the corpus uteri (body of uterus) from cancer of the cervix (neck of uterus)
Applied uniformly

Black or White women (including Hispanic women self-identifying as Black or White) aged 50–79 years, who were residents in the contiguous nine-county Philadelphia, Pennsylvania, region at the time of diagnosis and newly diagnosed with endometrial cancer between July 1, 1999, and June 30, 2002.

All cases in a population Representative sample of all cases Disease registries: e.g. cancer, birth defects All hospitals in a community (for diseases requiring
hospitalization) Particular hospital or health system Physician records

Purpose is to provide information on the exposure distribution in the source population
Controls must be identified independently of exposure status
Controls are a sample of the population that gave rise to the cases Member of control group who gets the disease “would” end
up as a case in the study

General population Used when cases are identified from well-defined
population (e.g. residents of a geographic area)
Sources: RDD, voter reg lists, tax lists, neighborhood
Advantage: generally more representative of non-diseased with respect to exposure
Disadvantage: not as motivated, potentially lower data quality

Cases: active surveillance at 61 of 68 hospitals in 9 counties around Philadelphia
Controls: RDD controls were selected from the same geographic region as the cases

Hospital/Clinic Used when cases are identified from hospital/clinic rosters
Advantage: easily identified, readily available, more aware of prior exposure, same selection factors as hospitalized cases
Disadvantage: difficulty determining appropriate illness (unrelated to exposure and same referral pattern as cases)

Relatives, friends, classmates, coworkers Used in rare circumstances
Advantage: motivated, readily available, less expensive, more similar neighborhood or social class, and more representative of healthy with regard to exposures
Disadvantage: may share exposures (e.g. alcohol, occupation) with cases, cases may be unable or may not wish to nominate friends

Without randomization, cases and controls may differ in characteristics
Individual matching (pairwise or multiple) For each case, select one (or more) controls matched on
variables (e.g. age within 5 years and gender)
Group matching (frequency matching) Distribution of matching characteristic is similar in cases
and controls (e.g. if 30% of cases are women, then 30% of controls should be women)

“Random-digit-dialing controls were selected from thesame geographic region as the cases, frequency matched to the cases on age (in 5-year age groups) and race (Black or White).”

Questionnaires
Laboratory tests
Physical measurements
Special procedures
Existing records

“Telephone interviews, which averaged 60 minutes, wereadministered by trained lay interviewers with no knowledge of the study hypotheses.”

Case Control
Exposed a b
Not Exposed c d
Odds that a case was exposed = =
Odds that a control was exposed = =
Odds ratio = =
a c
b d
a c
b d
ad bc
a/(a+c) c/(a+c)
b/(b+d) d/(b+d)

CHD(cases)
No CHD(controls)
Smoke(exposed)
84a
2,916b
No Smoke(unexposed)
c87
d4,913
Odds Ratio = (a/c)/(b/d) = ad/bc
= = = 1.63 84 x 4913 2916 x 87
412,692 253,692
Odds that a person with CHD smoked is 1.63 times the odds that a person without CHD smoked

When the cases studied are representative, with regard to history of exposure, of all people WITH the disease in the population from which the cases were drawn
When the controls studied are representative, with regard to history of exposure, of all people WITHOUT the disease in the population from which the cases were drawn
When the disease studied does not occur frequently (rare disease assumption)

Suppose that a case-control study was conducted to evaluate the relationship between artificial sweeteners (AS) and bladder cancer. 3,000 cases and 3,000 controls were enrolled in the study. Among the cases, 1,293 had used artificial sweeteners in the past, while 1,707 had never used artificial sweeteners. Of the controls, 855 had used sweeteners and 2,145 had not.
Calculate and interpret odds ratio (OR)

Cases Controls
Exposed to AS
Not Exposed
to AS

Cases Controls
Exposed to AS 1,293 855
Not Exposed to AS 1,707 2,145
TOTAL 3,000 3,000
Odds Ratio = = = 1.90 ad_ bc
(1,293)(2,145) (855)(1,707)

OR = 1.90 Interpretation
Odds that a person with bladder cancer used artificial sweeteners was 1.90 times the odds that a person without bladder cancer used artificial sweeteners

Can investigate only one disease outcome Inefficient for rare exposures Cannot directly compute incidence rates of disease
in exposed and unexposed Temporal relationship between exposure and
disease may be difficult to establish Vulnerable to bias because retrospective (recall bias)

Efficient for rare diseases Efficient for diseases with long induction and
latent periods Can evaluate multiple exposures in relation to a
disease Relatively quick and inexpensive


Smith, AH. The Epidemiologic Research Sequence. 1984

Exposure status and disease status of an individual are measured at one point in time
Disease prevalence in those with and without exposures or at different exposure levels are compared
Useful for health planning

STUDYPOPULATION
Exposed, Diseased
Unexposed, Diseased
Unexposed, No Disease
Gather Data on Exposure and Disease
Exposed, No Disease

Sometimes based on exposure of interest, if readily identifiable e.g. prevalence of disease in particular ethnic group or
geographic area or occupational group
For relatively small numbers, entire population may be included or a representative sample e.g. community or a random sample of households

Generally questionnaires, records, lab tests, physical measures, special procedures (e.g. air samples)
Duration and timing of exposure important to document, if possible, to relate to onset of disease

Determined by questionnaire (e.g. symptoms), physical exam (e.g. joints for arthritis), special procedures (e.g. x-rays, lung function)
For diseases with exacerbations and remission (e.g. asthma), need to ask asymptomatic if they had symptoms in past
Diagnostic criteria determined in advance and applied systematically

2 x 2 tables developed and measures calculated Prevalence ratio
Prevalence of disease in exposed divided by prevalence of disease in unexposed
Prevalence odds Odds that a diseased person was exposed or unexposed
Prevalence odds ratio Ratio of prevalence odds in exposed to prevalence odds in
unexposed

HIV + HIV - Totals
IVDU + 61 75 136
IVDU - 27 312 338
HIV infection and intravenous drug use (IVDU) among women in New York State Prison System
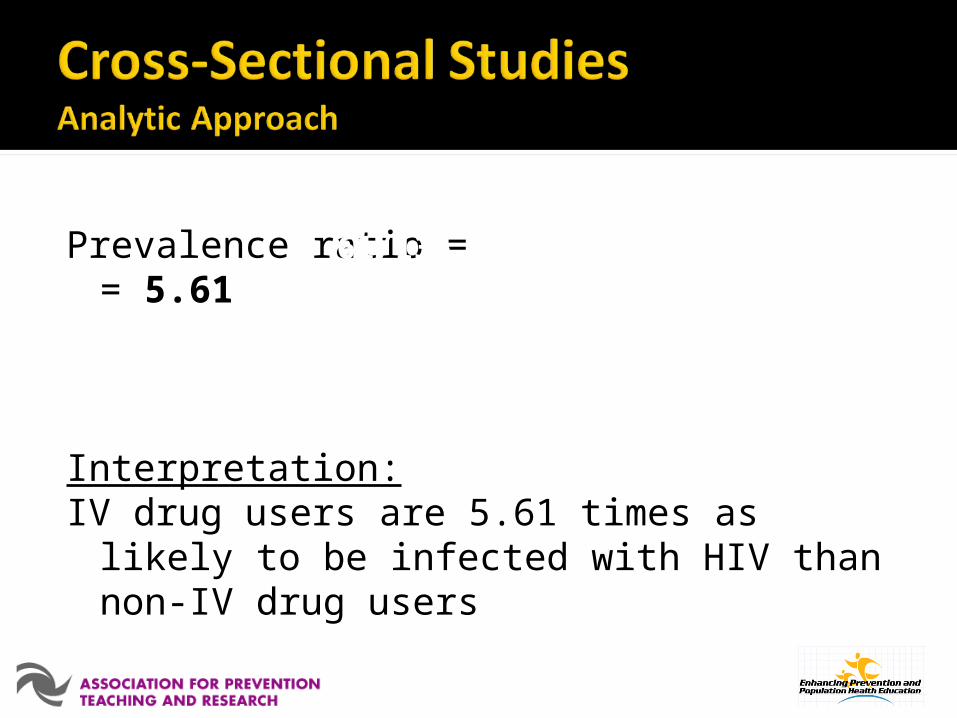
Prevalence ratio = = 5.61
Interpretation:IV drug users are 5.61 times as likely to be infected
with HIV than non-IV drug users
61/136__ 27/338

Prevalence odds ratio = = 9.40
Interpretation:Odds that a HIV+ person uses IV drugs is 9.4 times the
odds that a HIV- person uses IV drugs
61 x 312 75 x 27

Lack of temporal sequence of exposure preceding disease
Tends to include cases with long duration, which may have different characteristics and risk factors than series of incident cases
Potential misclassification of disease status if disease has exacerbations and remissions (e.g. asthma, multiple sclerosis, lupus) or if disease is being treated (e.g. hypertension)

Often have reasonably good generalizability
Data on individuals, not groups as in ecologic studies
Often conducted in a relatively short period of time
Less costly than cohort and case-control studies

Observational studies are “natural experiments” Cohort studies explicitly incorporates passage of
time Case-control studies are retrospective Uniformity in data collection is key to increased
validity Relative risk (cohort) and odds ratio (case-control
and cross-sectional) are the key measures of association
Center for Public Health Continuing EducationUniversity at Albany School of Public Health
Department of Community & Family MedicineDuke University School of Medicine


Sharon Hull, MD, MPHPresident
Allison L. LewisExecutive Director
O. Kent Nordvig, MEdProject Representative