module 1, lesson 1 the basics and geographic inquiry...
TRANSCRIPT

Mapping Our World Using ArcGIS Online
Module 1: Lesson 1-2 1
Module 1, Lesson 1
The basics and geographic inquiry method This computer activity will show you how to start the ArcGIS Online program. You will be guided through the basics of using ArcGIS Online map viewer to explore maps. After you do this activity, you will be prepared to complete other GIS activities.
Task 1: Open the map
1. If you do not intend to save your work: a) Launch an internet browser. b) Go to this link:
http://www.arcgis.com/home/webmap/viewer.html?webmap=8bbb186907f5421682383f0cb90b6e7a
c) Skip Step 2 and proceed with the lesson.
2. If you wish to save in a Public or Organization account open the document entitled #Introduction – Mapping Our World, Student Save Environment and follow the directions.
A map document has been created for you to use in this exercise. When the map document opens, you see a map of the world. The ArcGIS Online Map Viewer title is in the top left corner of the window.
3. Look at the ArcGIS Online map window and observe the following:
On the right side you see a map.

Mapping Our World Using ArcGIS Online
Module 1: Lesson 1-2 2
On the left side you see a column that displays the legend for the map.
In the top right corner you will see a “Modify Map” link.
4. Click on the Modify Map link.
5. Look at the top of the ArcGIS Online map viewer window and notice the different buttons. You will use some of these buttons as you progress through this lesson.
Task 2: Enlarge the ArcGIS Online window If the ArcGIS Online Map Viewer window is small when the map document first opens, you may wish to enlarge it.
6. In the upper right corner (PC) or upper left corner (Mac) of your ArcGIS Online window there are three
buttons. Click the middle button (PC) or the right green button (Mac).
PC
Mac
Now the ArcGIS Online Map Viewer window fills your whole screen.
You can also change the size of your ArcGIS Online window by stretching it. Stretching the window instead of maximizing it allows you to organize other windows and dialog boxes as they appear.
7. Place the cursor on any corner of the ArcGIS Online window that is not at the edge of your screen. The
cursor changes to a diagonal double-headed arrow. Click and drag the window outward until the ArcGIS Online window fills about two-thirds of the screen. Let go of the mouse button.
Task 3: Work with layers
8. Click on Show Contents of Map button.
Mapping Our World Using ArcGIS Online
Module 1: Lesson 1-2 3
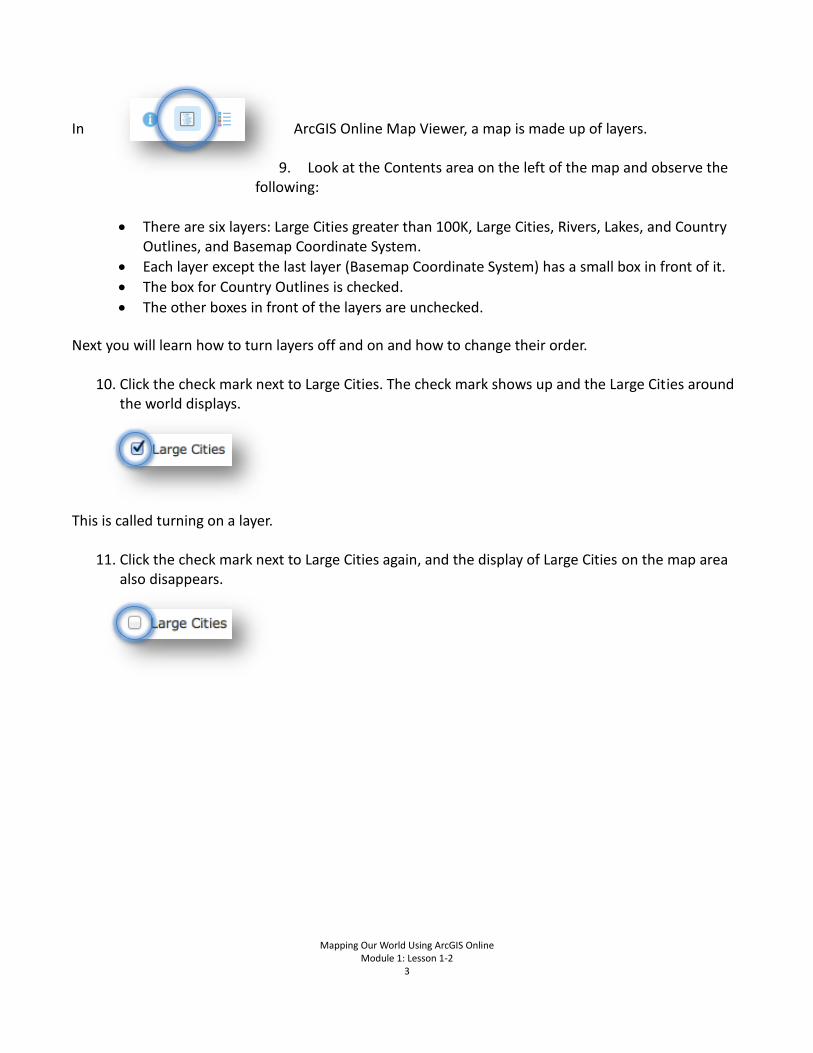
In ArcGIS Online Map Viewer, a map is made up of layers.
9. Look at the Contents area on the left of the map and observe the following:
There are six layers: Large Cities greater than 100K, Large Cities, Rivers, Lakes, and Country Outlines, and Basemap Coordinate System.
Each layer except the last layer (Basemap Coordinate System) has a small box in front of it.
The box for Country Outlines is checked.
The other boxes in front of the layers are unchecked.
Next you will learn how to turn layers off and on and how to change their order.
10. Click the check mark next to Large Cities. The check mark shows up and the Large Cities around the world displays.
This is called turning on a layer.
11. Click the check mark next to Large Cities again, and the display of Large Cities on the map area
also disappears.

Mapping Our World Using ArcGIS Online
Module 1: Lesson 1-2 4
12. Click the box next to the Large Cities layer to turn it on.
13. Turn on the Rivers and Lakes layers.
Answers to questions in this activity should be recorded on the answer sheet.
Q1: Which layers are turned on in the Contents and visible on the map?
Task 4: The geographic inquiry process Much like scientific analysis, geographic inquiry involves a process of asking questions and looking for answers. The geographic inquiry process consists of the following five steps:
In next part of this activity, you will learn how maps and GIS can help you in the geographic inquiry process. At the same time, you will be practicing ArcGIS Online skills.

Mapping Our World Using ArcGIS Online
Module 1: Lesson 1-2 5
Task 5: Ask a geographic question and develop a hypothesis You might look at a map and then think of a question that it might help you answer. Or you might think of the question first and then look for maps or GIS layers that might help you answer the question. In this lesson you will try to answer the following geographic question: Do the number of phone lines vary proportionately with the number of people among the world’s most populous countries?
Q2: What makes this a geographic question?
Q3: Write a hypothesis that answers the geographic question, as you would for any scientific inquiry.
A hypothesis is an educated guess. Your hypothesis may be right or wrong in the end. The goal is not to know the answer before you start your research but to have a kind of “ballpark idea” or hunch about what the answer might be. Your research will help you determine whether your hypothesis is likely true or false.
Task 6: Add a layer to your map Next, you need to identify the kind of information that will help you answer your question. You want to display this data as layers in your ArcGIS Online map.
14. Click on the Add Data down arrow and Search for Layers.

Mapping Our World Using ArcGIS Online
Module 1: Lesson 1-2 6
15. Choose ArcGIS Online from the dropdown menu in the In: box.
16. Then type in WorldCountriesPopPhone in the Find: box and click on Go.
17. Choose Add to add layer. Click the DONE ADDING LAYERS button at the bottom of the Contents.
Q4: What is the name of the layer that has been added to your table of contents?
Q5: Can you guess as to what data this layer has in it by its name?
Note: If at any time the countries don’t fit on top of the map, zoom out and zoom in once and they will layer one on top of the other.

Mapping Our World Using ArcGIS Online
Module 1: Lesson 1-2 7
Task 7: Explore the World Phone Lines Land map Currently the WorldCountriesPopPhone layer is one color. You will thematically map (map by color) the layer that will arrange the data for the countries by color from light to dark. This will enable you to visually explore the data.
18. Hover over WorldCountriesPopPhone layer and click on the right arrow that appears.
19. Click on Change Style.
20. Change Choose an attribute to show to PHONLNS.
Note the Counts and Amounts (Color) drawing style is now chosen. 21. Click on OPTIONS.

Mapping Our World Using ArcGIS Online
Module 1: Lesson 1-2 8
22. Click on Symbols and choose an orange color ramp.
23. Click OK.
24. Place checkmark in Classify Data box and choose Natural Breaks and 5 classes from the pull down menus.
25. Place checkmark in “Draw features with out
of range or no value” to ensure that the -99 (null data) will be separated in your color ramp.
26. Click OK to accept color ramp changes and Done to exit Change Style.
27. Hover over WorldCountriesPopPhone layer and click on the right arrow that appears, click on Rename, and type in World Phone Lines Land – PHONLNS.
28. Click on the layer name link World Phone Lines Land – PHONLNS to expand the legend for that
layer.

Mapping Our World Using ArcGIS Online
Module 1: Lesson 1-2 9
Look at the map you have now and answer the following questions by looking at the change in the color ramp (lightness to darkness).
Q6: What color in the legend for the World Phone Lines Land layer indicates countries with the fewest phone
lines?
Q7: What color indicates countries with the most phone lines?
Q8: What color indicates countries with no data
available for this layer? Notice that the colors in the legend change gradually from lightest to darkest. The name for this type of legend is a graduated color legend.
Q9: Does any other layer in your map have a graduated color legend?
To answer the following questions, you will need to make a copy of the World Countries layer.
29. Hover on the World Phone Lines Land – PHONLNS layer and click on down arrow. Click on copy to make a copy of this layer.
30. Follow Steps 18 – 26 to color the new map layer using these Change Symbols choices. Remember to click on the OK and Done buttons to apply your new graduated coloring.
31. Choose 100000 for Round classes to make the numbers easier to read.
Attribute to Show:
POP2007
Symbols: Blue Ramp
Classify Data: By
Natural Breaks
Classify Data: With
5 Classes
No Value: Check Mark

Mapping Our World Using ArcGIS Online
Module 1: Lesson 1-2 10
32. Hover over World Phone Lines Land – PHONLNS Copy layer and click on the right arrow that appears, click on Rename, and type in World Countries Population – POP2007.
You will now turn layers on or off to identify and find out a country’s name. To identify a country name, click on the country shape. You may need to click on the arrow in the top right corner of the identify window until you come to the country name.
33. Click on the World Phone Lines Land - PHONLNS layer name to display the legend. Do the same for World Countries Population –POP2007.
Q10: Which two countries have the most phone lines?
Q11: On which continent are most of the countries with the fewest phone lines?
Q12: Which two countries have the largest populations?
Q13: Name the two countries that are in the same population class (color) as the United
States.
Q14: Which of the two countries, if any, are in the same phone line class (color) as the United States?
34. Click on the United States.
35. Read the geographic question again.
Geographic question: Do the number of phone lines vary proportionately with the number of people among the world’s most populous countries?
36. Scroll down slowly in the Identify window and look at the different fields.

Mapping Our World Using ArcGIS Online
Module 1: Lesson 1-2 11
Q15: What two fields might help in answering the geographic question?
37. Close the Identify popup window.
Task 8: Investigate the relationship between phone lines and population in China
38. Click in the Find window at the top right of the map and type in China.
China will be centered on the map.
39. Click on China to open the Identify window. (If you get more than one result for China, click on the arrow until the World Countries: China layer is displayed.)
Q16 What was the population of China in 2007?
Q17 How many phone lines did China have in 2007? (Scroll down and look for the PHONLNS
attribute.)
Remember not to worry about the disparity between the population year and the year that phone line data was collected.
40. Close the Identify popup window.
41. On your computer, click Start, Programs, Accessories, Calculator (PC) or the Applications folder (Mac) to start the calculator.
42. Divide the population of China by the number of phone lines. This number is the phone line density or the number of people per phone lines in China.
Q18: What was the number of people per phone line in China? (Round off the result to the nearest two decimal places.)
Task 9: Investigate the relationship between population and phone lines for all countries in the list

Mapping Our World Using ArcGIS Online
Module 1: Lesson 1-2 12
43. Enter the population, phone lines, and phone line density for China on the answer sheet on
Q19. (These numbers have been entered for you as an example.)
Q19: For each country in the table, what is the population, number of phone lines, and number of people per phone line? (Use Steps 25 – 29 to fill out the table.)
Task 10: Analyze the results of your research
Q20: In the table on the answer sheet, the column on the left ranks the countries by population from highest to lowest. In the column on the right, rank the countries from the lowest number of people per phone line to the highest number of people per phone line, using the data from Q18. Then draw lines connecting the name of each country in one column with the name of the same country in the other column.
L2 Q21: Which country has the fewest people per phone line? What is the number of people per
phone line in this country?
Q22: How does the country in Q21 rank in population size among the eight countries in your table?
Q23: Which country has the most people per phone line? What is the number of people per phone line in this country?
Q24: How does the country in Q23 rank in population size among the eight countries in your table?
Q25: What is the population of Japan? What is the number of people per phone line in Japan?
Q26: What country has the most phone lines? How does the number of people per phone line in this country compare with the numbers of people per phone line in the seven other countries in your table?
Q27: Russia and Pakistan have about the same number of people. Why do you suppose these two countries have such different numbers of people per phone line? What factors do you think contribute to this disparity?
Q28: What is the answer to the geographic question: Do the number of phone lines vary proportionately with the number of people among the world’s most populous countries?
Q29: Compare your initial hypothesis (Q2) with your answer in Q28. How does your hypothesis compare with your answer to the geographic question?

Mapping Our World Using ArcGIS Online
Module 1: Lesson 1-2 13
Task 11: Develop a plan of action The last step of the geographic inquiry process is to act on what you have learned. Your action plan might be simply to repeat the process; thinking about what you’ve learned often leads to deeper, more interesting geographic questions. Imagine that you are an expert specializing in telecommunications. You need to devise a plan for China, Brazil, Indonesia, or the United States that deals effectively with the basic concern of your original geographic question. To develop an effective plan, you may need to conduct further research on the phone system within your country. If you decided, for instance, that increasing the number of phone lines operating in your chosen country would improve the quality of life there, you could come up with a written plan of action for telecommunications officials, pointing out strengths and weaknesses, and explaining where and why expansion would be most beneficial.
Q30: What country did you choose? Use the information in the table in Q20 to describe the phone line situation in your chosen country.
Q31: Do you think that increasing the number of phone lines operating in your chosen country would improve the quality of life there? Why or why not?
Q32: List three concerns you have about increasing the number of phone lines in your chosen country.
Q33: List two new geographic questions that you would like to investigate to help you develop a sound plan.