module 1 introduction to the simulation tools€¦ · module 1 introduction to the ... 13 lesson...
TRANSCRIPT

Module 1
Introduction to the Simulation Tools

MOST – Hands On Signal Timing Training (Isolated Intersections) Participant Workbook
CONTENTS (MODULE 1) Introduction .......................................................................................................................................................................... 1
Purpose ............................................................................................................................................................................ 1 Goals and Learning Outcomes .................................................................................................................................................. 1 Organization and Time Allocation ............................................................................................................................................. 1
Lesson #1: Simulation and The Real world ...................................................................................................................................... 2 Learning Outcome ................................................................................................................................................................ 2 Overview ........................................................................................................................................................................... 2 Questions to Consider ........................................................................................................................................................... 2 List of Steps ....................................................................................................................................................................... 2 Running the Experiment ......................................................................................................................................................... 3 Considering the Questions ...................................................................................................................................................... 4
Lesson #2: Using The MOST Interface ............................................................................................................................................ 5 Learning Outcome ................................................................................................................................................................ 5 Overview ........................................................................................................................................................................... 5 Questions to Consider ........................................................................................................................................................... 5 List of Steps ....................................................................................................................................................................... 5 Running the Experiment ......................................................................................................................................................... 6 Considering the Questions ...................................................................................................................................................... 9
Lesson #3: Exploring VISSIM ..................................................................................................................................................... 10 Learning Outcome .............................................................................................................................................................. 10 Overview ......................................................................................................................................................................... 10 Questions to Consider ......................................................................................................................................................... 10 5.4 List of Steps ................................................................................................................................................................ 10 Running the Experiment ....................................................................................................................................................... 11 Considering the Questions .................................................................................................................................................... 13
Lesson #4: Navigating The ASC/3 Controller .................................................................................................................................. 14
MOST – Hands On Signal Timing Training (Isolated Intersections) Participant Workbook
Learning Outcome .............................................................................................................................................................. 14 Overview ......................................................................................................................................................................... 14 Questions to Consider ......................................................................................................................................................... 14 List of Steps ..................................................................................................................................................................... 14 Running the Experiment ....................................................................................................................................................... 15 Considering the Questions .................................................................................................................................................... 26
Closure: Summary of Key Points Learned ..................................................................................................................................... 27 Glossary ............................................................................................................................................................................. 28
MOST – Hands On Signal Timing Training (Isolated Intersections) Participant Workbook
1-1
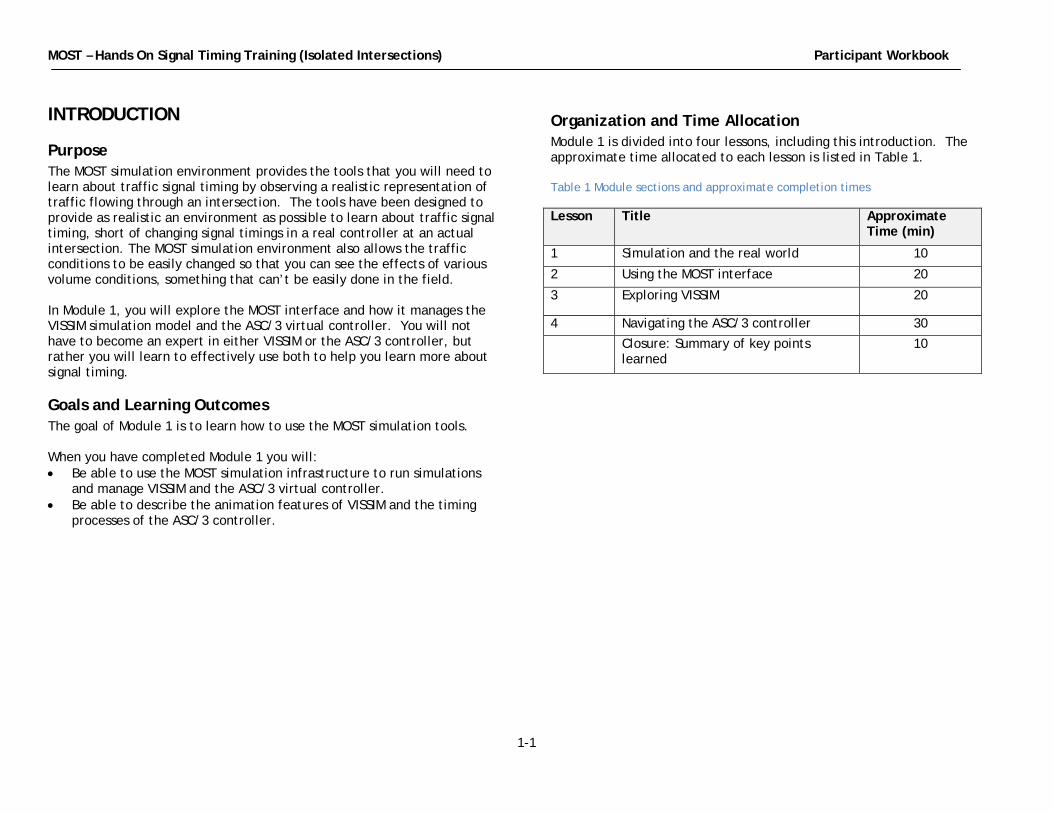
INTRODUCTION
Purpose The MOST simulation environment provides the tools that you will need to learn about traffic signal timing by observing a realistic representation of traffic flowing through an intersection. The tools have been designed to provide as realistic an environment as possible to learn about traffic signal timing, short of changing signal timings in a real controller at an actual intersection. The MOST simulation environment also allows the traffic conditions to be easily changed so that you can see the effects of various volume conditions, something that can’t be easily done in the field. In Module 1, you will explore the MOST interface and how it manages the VISSIM simulation model and the ASC/3 virtual controller. You will not have to become an expert in either VISSIM or the ASC/3 controller, but rather you will learn to effectively use both to help you learn more about signal timing.
Goals and Learning Outcomes The goal of Module 1 is to learn how to use the MOST simulation tools. When you have completed Module 1 you will: • Be able to use the MOST simulation infrastructure to run simulations
and manage VISSIM and the ASC/3 virtual controller. • Be able to describe the animation features of VISSIM and the timing
processes of the ASC/3 controller.
Organization and Time Allocation Module 1 is divided into four lessons, including this introduction. The approximate time allocated to each lesson is listed in Table 1. Table 1 Module sections and approximate completion times
Lesson Title Approximate Time (min)
1 Simulation and the real world 10
2 Using the MOST interface 20
3 Exploring VISSIM 20
4 Navigating the ASC/3 controller 30
Closure: Summary of key points learned
10
MOST – Hands On Signal Timing Training (Isolated Intersections) Participant Workbook
1-2
LESSON #1: SIMULATION AND THE REAL WORLD
Learning Outcome • Be able to determine how realistic the simulation environment is by
comparing it with a video of actual field operations.
Overview Not all models realistically duplicate traffic flow conditions found in the field. However, if a simulation model such as VISSIM is calibrated correctly, the results can closely approximate conditions that you would observe in the field. The purpose of this Lesson is to provide you with the opportunity to observe how realistic simulation can be in replicating traffic flow at a real signalized intersection. You will observe two videos, each of the intersection of State Highway 8 and Line Street. The video on the left shows the VISSIM animation while the one on the right shows a video from the field showing traffic flow at the intersection.
Questions to Consider As you begin lesson #1, consider the following question. You will come back to this question once you have completed the lesson. • How realistic does the simulation appear to be?
List of Steps You will follow these steps during this lesson: • Open the movie file. • Watch the video and make judgments about the realism of the
simulation.

MOST – Hands On Signal Timing Training (Isolated Intersections) Participant Workbook
1-3
Running the Experiment In Lesson #1 you will compare a field video with the simulation of the same intersection and conditions. When you start the movie file using Windows Media Player, your computer screen will look like Figure 1. Three detector status indicators and the phase 2 green indication are imprinted in black boxes on the video frames. When a detector is “ON,” the black text box corresponding to the detector is filled with the name of the detector. The detector names are indicated in parentheses in Figure 1. When the phase 2 green is “ON,” the corresponding black text box is filled with “P2,” for phase 2. In Figure 1, the two circled vehicles are queued in both fields of view and are calling for service on phase 2 as can be seen by the fact that the stop bar detector is on. Step 1. Open the movie file. • Locate the “MOST input files” folder. • Go to the “Lab1” folder, then the “Exp1” folder. • Open the file: “lab1-exp1.wmv.” • Select “Pause” from Windows Media Player (or the player that you are
using) until after you have read the following discussion describing the video.
Step 2. Watch the video and make judgments about the realism of the simulation. • Restart the movie file observing both the animation and the field
views. • Follow vehicles in both windows and observe how much the vehicle
movements are alike. • Verify that phase 2 extends and gaps out when it should. (The Minimum
Green time is set to 5.0 seconds; the Passage Time is set to 2.0 seconds.)
Figure 1 Field validation video
Stop bar detectorStatus (FTh2)
Advanced detectorStatus (BTh2)
Phase 2 greenIndication (P2)
Left turn bay detector
Status (FLt5)

MOST – Hands On Signal Timing Training (Isolated Intersections) Participant Workbook
1-4
Considering the Questions Let’s now consider the question that was presented at the beginning of this experiment. • How realistic does the simulation appear to be? Take a few minutes to review this question and write a brief answer to the question in the box on the right based on your observations from this experiment.
Answer to question:

MOST – Hands On Signal Timing Training (Isolated Intersections) Participant Workbook
1-5
LESSON #2: USING THE MOST INTERFACE
Learning Outcome • Be able to use the MOST interface to run simulations.
Overview The MOST interface allows you to control the VISSIM simulation model and the ASC/3 virtual traffic controller. As part of this experiment, you will learn to use the MOST interface.
Questions to Consider As you begin this lesson, consider the following questions. You will come back to these questions once you have completed the experiment. • What are the two Run modes that are available and in what context
would you use each mode? • Why would you use the “Pause At” feature? • Why would you change the simulation speed? • Why would you use the side-by-side feature?
List of Steps You will follow these steps during this experiment: • Start the MOST software and observe the interface window. • Open file. • Pause the simulation. • Adjust the simulation speed. • Run side-by-side simulation.
MOST – Hands On Signal Timing Training (Isolated Intersections) Participant Workbook
1-6
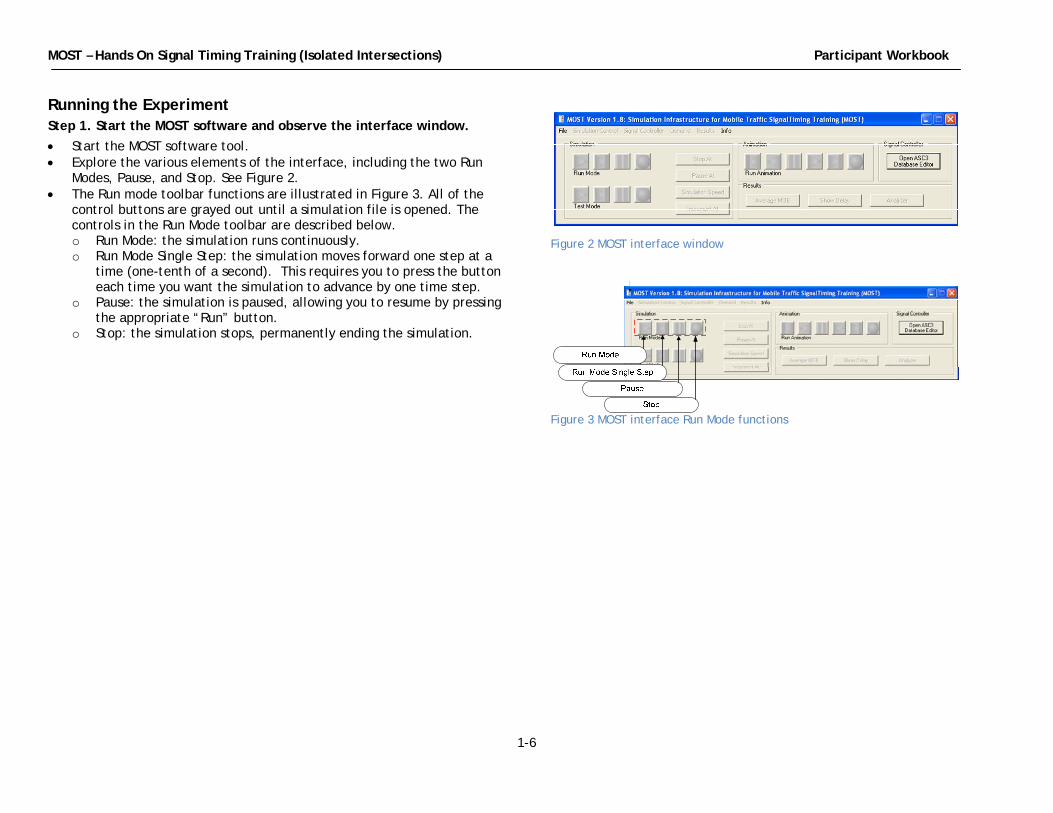
Running the Experiment Step 1. Start the MOST software and observe the interface window. • Start the MOST software tool. • Explore the various elements of the interface, including the two Run
Modes, Pause, and Stop. See Figure 2. • The Run mode toolbar functions are illustrated in Figure 3. All of the
control buttons are grayed out until a simulation file is opened. The controls in the Run Mode toolbar are described below. o Run Mode: the simulation runs continuously. o Run Mode Single Step: the simulation moves forward one step at a
time (one-tenth of a second). This requires you to press the button each time you want the simulation to advance by one time step.
o Pause: the simulation is paused, allowing you to resume by pressing the appropriate “Run” button.
o Stop: the simulation stops, permanently ending the simulation.
Figure 2 MOST interface window
Figure 3 MOST interface Run Mode functions
Figure 2
MOST – Hands On Signal Timing Training (Isolated Intersections) Participant Workbook
1-7
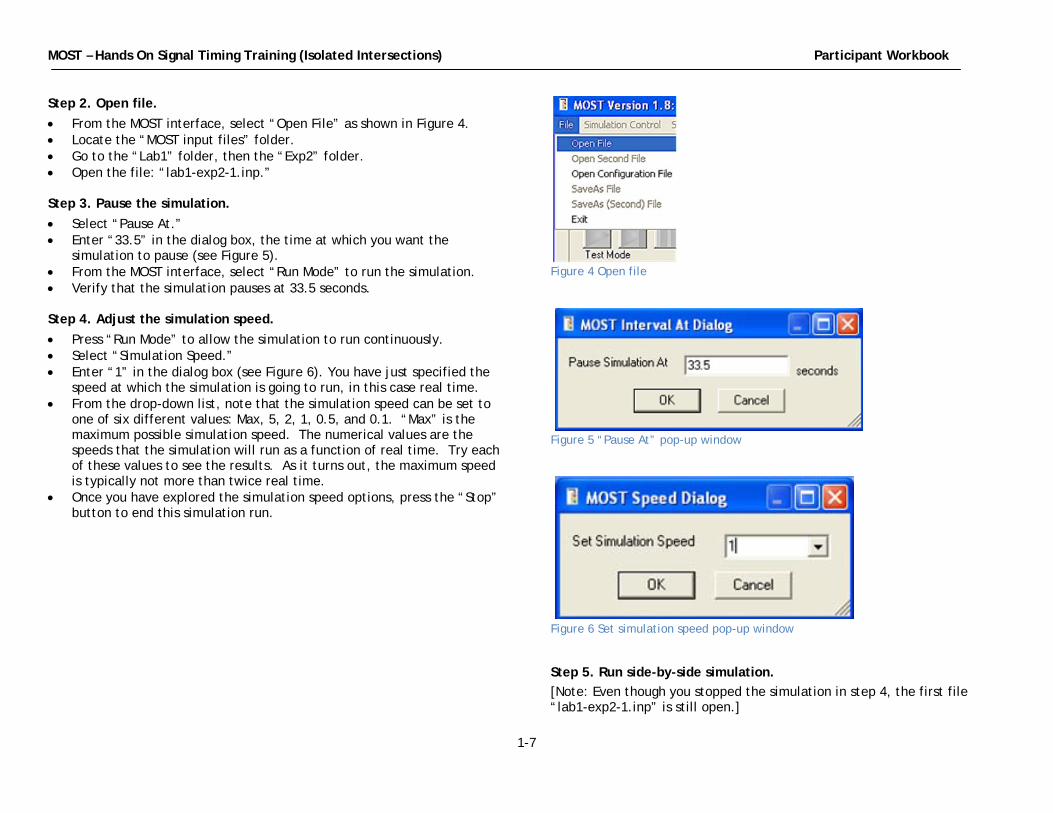
Step 2. Open file. • From the MOST interface, select “Open File” as shown in Figure 4. • Locate the “MOST input files” folder. • Go to the “Lab1” folder, then the “Exp2” folder. • Open the file: “lab1-exp2-1.inp.” Step 3. Pause the simulation. • Select “Pause At.” • Enter “33.5” in the dialog box, the time at which you want the
simulation to pause (see Figure 5). • From the MOST interface, select “Run Mode” to run the simulation. • Verify that the simulation pauses at 33.5 seconds. Step 4. Adjust the simulation speed. • Press “Run Mode” to allow the simulation to run continuously. • Select “Simulation Speed.” • Enter “1” in the dialog box (see Figure 6). You have just specified the
speed at which the simulation is going to run, in this case real time. • From the drop-down list, note that the simulation speed can be set to
one of six different values: Max, 5, 2, 1, 0.5, and 0.1. “Max” is the maximum possible simulation speed. The numerical values are the speeds that the simulation will run as a function of real time. Try each of these values to see the results. As it turns out, the maximum speed is typically not more than twice real time.
• Once you have explored the simulation speed options, press the “Stop” button to end this simulation run.
Figure 4 Open file
Figure 5 “Pause At” pop-up window
Figure 6 Set simulation speed pop-up window
Step 5. Run side-by-side simulation. [Note: Even though you stopped the simulation in step 4, the first file “lab1-exp2-1.inp” is still open.]
MOST – Hands On Signal Timing Training (Isolated Intersections) Participant Workbook
1-8
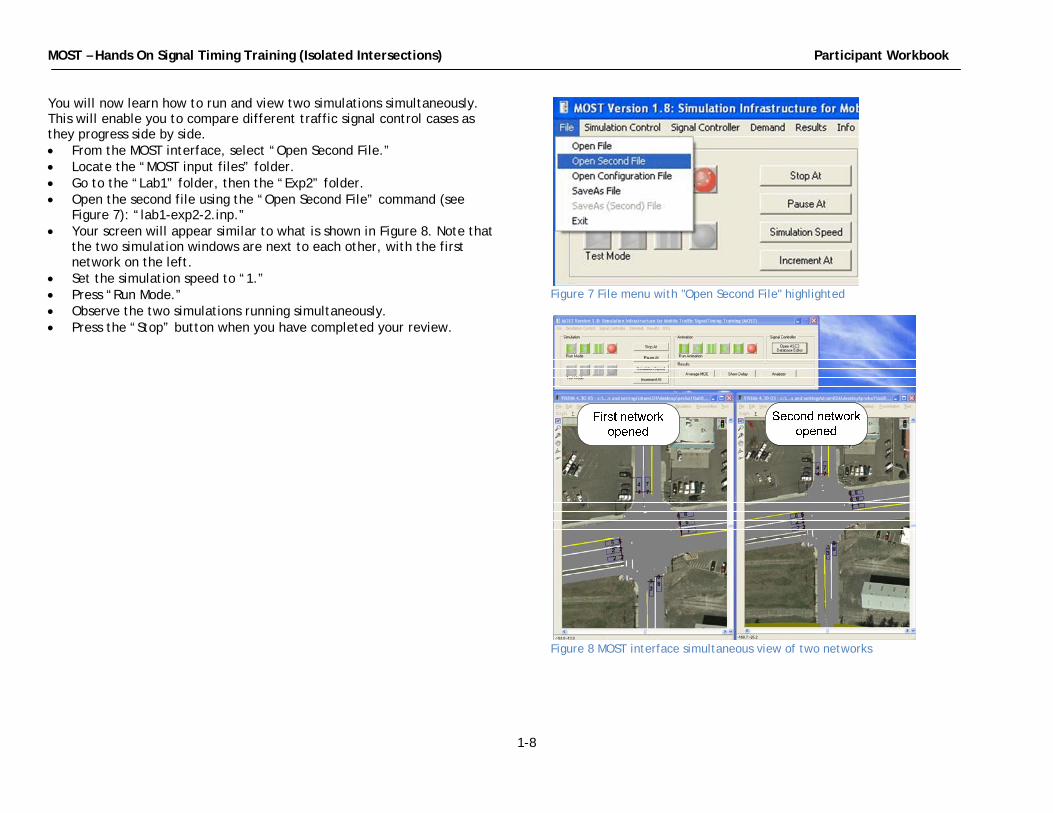
You will now learn how to run and view two simulations simultaneously. This will enable you to compare different traffic signal control cases as they progress side by side. • From the MOST interface, select “Open Second File.” • Locate the “MOST input files” folder. • Go to the “Lab1” folder, then the “Exp2” folder. • Open the second file using the “Open Second File” command (see
Figure 7): “lab1-exp2-2.inp.” • Your screen will appear similar to what is shown in Figure 8. Note that
the two simulation windows are next to each other, with the first network on the left.
• Set the simulation speed to “1.” • Press “Run Mode.” • Observe the two simulations running simultaneously. • Press the “Stop” button when you have completed your review.
Figure 7 File menu with "Open Second File" highlighted
Figure 8 MOST interface simultaneous view of two networks
MOST – Hands On Signal Timing Training (Isolated Intersections) Participant Workbook
1-9
Considering the Questions Let’s now consider the questions that were presented at the beginning of Lesson #2. • What are the two Run modes that are available and in what context
would you use each mode? • Why would you use the “Pause At” feature? • Why would you change the simulation speed? • Why would you use the side-by-side feature? Take a few minutes to review each question and write brief answers to each question in the box on the right based on your observations from this experiment.
Answers to questions:
MOST – Hands On Signal Timing Training (Isolated Intersections) Participant Workbook
1-10
LESSON #3: EXPLORING VISSIM
Learning Outcome • Be able to effectively use the VISSIM window to learn about traffic flow
and intersection operations.
Overview The primary underlying engine for the simulation tools is the VISSIM model. VISSIM is one of several commonly used and powerful simulation models on the market today. It includes components for how drivers interact with the roadway design, the control system, and with other drivers. It includes several options for emulating the traffic control system. We have emphasized that the MOST course is not about learning to use any particular simulation model, including VISSIM. However, it is important for you to learn some of the key features of VISSIM and how you will use them as you do learn about traffic signal timing.
Questions to Consider As you begin Lesson #3, consider the following questions. You will come back to these questions once you have completed the experiment. • What are the three tools available to you in the VISSIM window? • What are the different speeds at which you can run the simulation?
5.4 List of Steps You will follow these steps during this experiment: • Start the MOST software and open the input file. • Observe the simulation time clock. • Observe the simulation process. • Use the zoom tools.

MOST – Hands On Signal Timing Training (Isolated Intersections) Participant Workbook
1-11
Running the Experiment In this experiment you will learn about the information that is provided in the VISSIM simulation window (see Figure 9). Three functions are shown in the upper left corner of the VISSIM window and are noted in the figure: • Show entire network: zooms out the VISSIM view to see all parts of the
network. • Zoom: user defines the area to be shown. • Zoom by factor: user defines a scale by which to zoom. Three other kinds of information are also shown in the window: • Detector locations are denoted by the boxes at the stop bar. • The numbers shown in the boxes are both the detector numbers and
the phase numbers; in this case, the numbers are the same for both the phase and the detector.
Figure 9 VISSIM window showing phase and detector numbers
Phase
Detector

MOST – Hands On Signal Timing Training (Isolated Intersections) Participant Workbook
1-12
Step 1. Start the MOST software and open the input file. • Start the MOST software tool and select “Open File.” • Locate the “MOST input files” folder. • Go to the “Lab1” folder, then the “Exp3” folder. • Open the file: “lab1-exp3.inp.” Step 2. Observe the simulation time clock. • Start the simulation by selecting “Run Mode.” • The simulation time clock is located on the lower bar of the VISSIM
window. See Figure 10. The time clock is shown in seconds and tenths of seconds after the beginning of the simulation.
• In future experiments, you will often be asked to observe when certain events occur (such as when a green indication begins) or to note the time between events (such as the headway between two vehicles departing from a standing queue). The simulation time clock will be an essential tool to accomplish these tasks.
• All aspects of the simulation are updated every tenth of a second, including the locations of all vehicles and the timing processes in the traffic controllers. This is a very high degree of precision, allowing you to observe the effects of the timing plans that you develop as part of this course.
• Change the simulation speed and observe the results. Which speeds allow you to best observe the simulation process?
Step 3. Observe the simulation process. • Spend a few minutes advancing the simulation using the “Run Mode
Single Step” button. • As you do this, observe the simulation time clock. • Observe the changing positions of the vehicles as you advance the
simulation each time step. • Observe how the vehicles respond to a change in the signal indications
both at the beginning of the green display and when the green display changes to yellow. How quickly does the standing queue begin to move? How quickly do vehicles respond to the yellow and either stop or move through the intersection without stopping?
Figure 10 Simulation time step
Step 4. Use the zoom tools. • Use the three zoom tools located in the upper left portion of the VISSIM
window to see how changing the scale or zoom factor improves or degrades your ability to observe the traffic flow and the signal timing processes. See Figure 9.
• When you are ready, select “Stop.”

MOST – Hands On Signal Timing Training (Isolated Intersections) Participant Workbook
1-13
Considering the Questions Let’s now consider the two questions that were presented at the beginning of this experiment. • What are the three tools available to you in the VISSIM window? • What are the different speeds at which you can run the simulation? Take a few minutes to review each question and write brief answers to each question in the box on the right based on your observations from this experiment.
Answers to questions:

MOST – Hands On Signal Timing Training (Isolated Intersections) Participant Workbook
1-14
LESSON #4: NAVIGATING THE ASC/3 CONTROLLER
Learning Outcome • Be able to describe the range of information provided in the ASC/3
controller.
Overview The ASC/3 controller emulator included as part of the MOST simulation tools is the most realistic traffic controller ever included in a microsimulation model. It includes essentially the same software and logic that are included in the physical ASC/3 controller that is used in the field in a traffic cabinet. The purpose of this experiment is to learn about the ASC/3 signal controller, its functionality and the kinds of information that it displays. Learning about this functionality and information will help you to understand more about traffic signal timing and the controller processes that determine how effective a timing plan will be.
Questions to Consider As you begin Lesson #4, consider the following questions. You will come back to these questions once you have completed the experiment. • Which screen shows the status of the phasing and timing processes? • Where are the timing parameters stored? • How can you verify that a vehicle call has been placed?
List of Steps You will follow these steps during this experiment: • Start the MOST software tool and open the input file. • Navigate to the Main Menu of the ASC/3 controller. • Navigate to the Controller Status display. • Navigate to the Detector Status display. • Read the Detector Status window. • Relate vehicle position to detector status. • Identify a vehicle call. • Determine when a phase has started. • Access and open the controller database. • Navigate to the Vehicle Extension parameter in the Controller Timing
Plan table.

MOST – Hands On Signal Timing Training (Isolated Intersections) Participant Workbook
1-15
Running the Experiment In this experiment you will learn to use the ASC/3 controller emulator and its various functions. IMPORTANT REMINDER: You can only access the controller front panel while the simulation is running. If you need additional time to execute a task, change the simulation speed to 0.1 (before or during simulation) by pressing the “Simulation Speed” button in the MOST interface and entering “0.1.” This simulation speed (10 percent of real time) will slow down the simulation process significantly, allowing you to more carefully observe the ASC/3 timing processes. Figure 11 shows the ASC/3 controller front panel window, labeled “1001 ASC/3 Virtual Controller.” This front panel is identical to the actual controller used in the field. • “MM” accesses the Main Menu. • The “Status” button accesses the Controller Status screen, including
the current values of the various timing parameters. • The cursor keys allow navigation, including “up,” “down,” “left,” and
“right.” • The numeric keypad is used to enter numbers for menu choices or
numeric data.
Figure 11 ASC/3 Controller front panel window
MOST – Hands On Signal Timing Training (Isolated Intersections) Participant Workbook
1-16
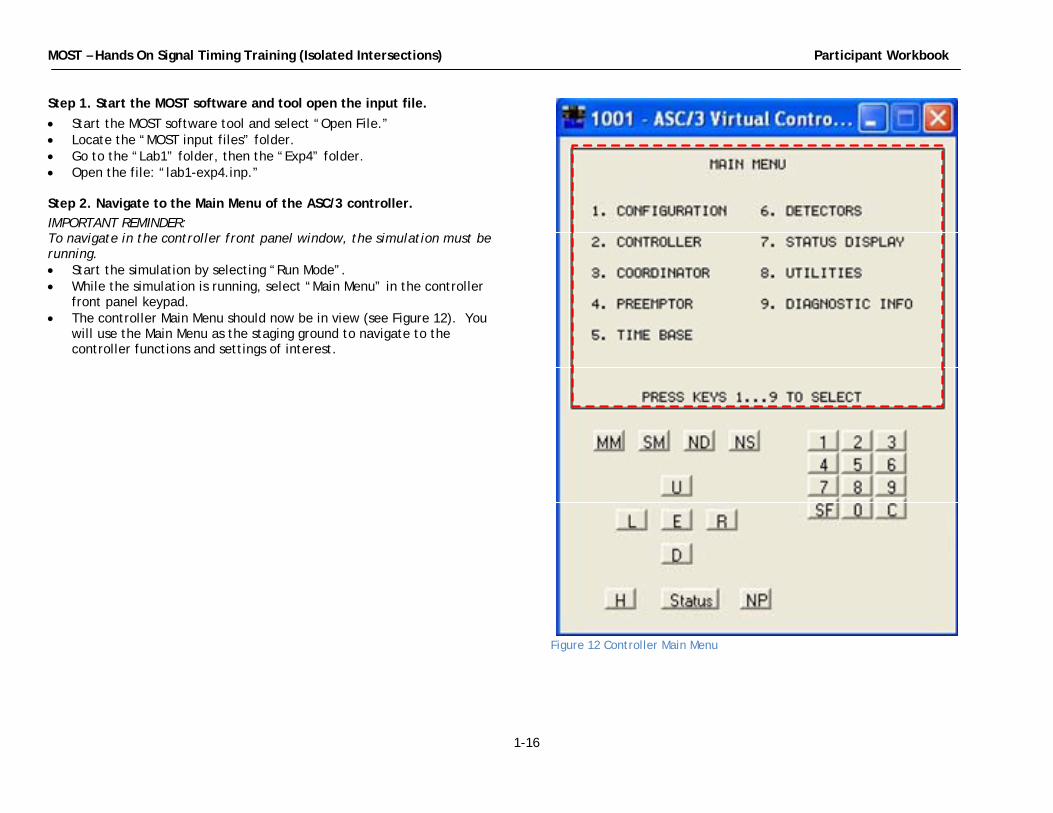
Step 1. Start the MOST software and tool open the input file. • Start the MOST software tool and select “Open File.” • Locate the “MOST input files” folder. • Go to the “Lab1” folder, then the “Exp4” folder. • Open the file: “lab1-exp4.inp.” Step 2. Navigate to the Main Menu of the ASC/3 controller. IMPORTANT REMINDER: To navigate in the controller front panel window, the simulation must be running. • Start the simulation by selecting “Run Mode”. • While the simulation is running, select “Main Menu” in the controller
front panel keypad. • The controller Main Menu should now be in view (see Figure 12). You
will use the Main Menu as the staging ground to navigate to the controller functions and settings of interest.
Figure 12 Controller Main Menu
MOST – Hands On Signal Timing Training (Isolated Intersections) Participant Workbook
1-17
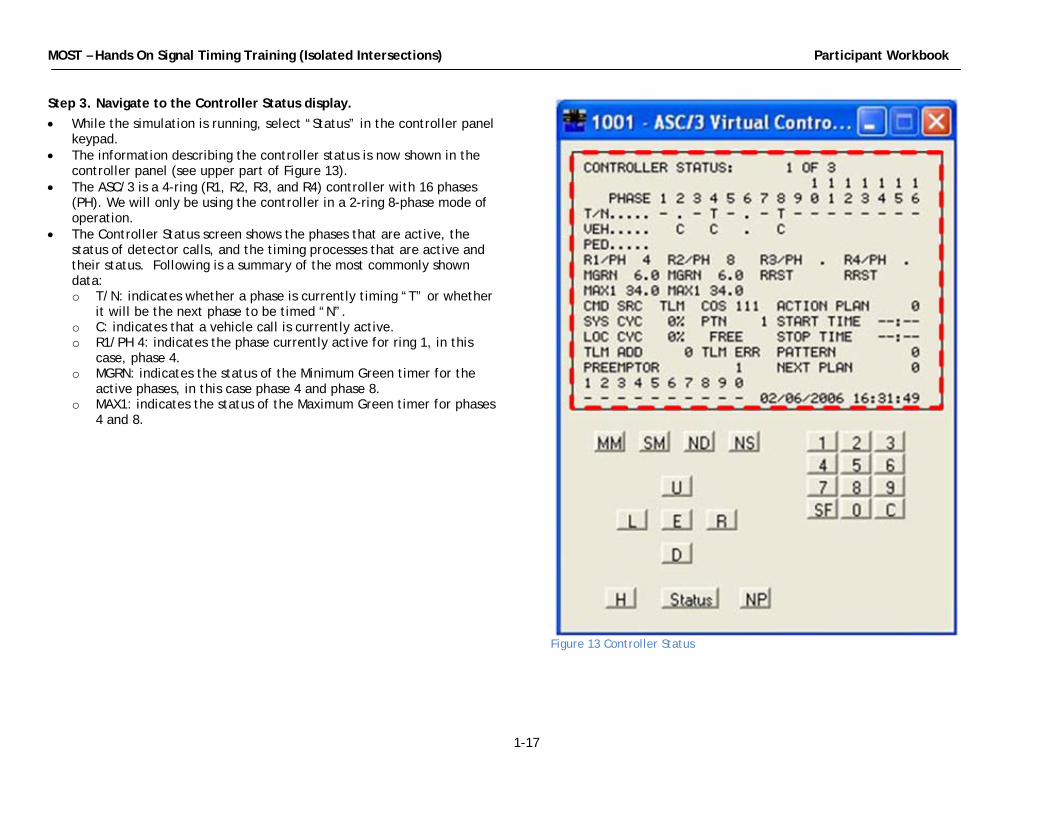
Step 3. Navigate to the Controller Status display. • While the simulation is running, select “Status” in the controller panel
keypad. • The information describing the controller status is now shown in the
controller panel (see upper part of Figure 13). • The ASC/3 is a 4-ring (R1, R2, R3, and R4) controller with 16 phases
(PH). We will only be using the controller in a 2-ring 8-phase mode of operation.
• The Controller Status screen shows the phases that are active, the status of detector calls, and the timing processes that are active and their status. Following is a summary of the most commonly shown data: o T/N: indicates whether a phase is currently timing “T” or whether
it will be the next phase to be timed “N”. o C: indicates that a vehicle call is currently active. o R1/PH 4: indicates the phase currently active for ring 1, in this
case, phase 4. o MGRN: indicates the status of the Minimum Green timer for the
active phases, in this case phase 4 and phase 8. o MAX1: indicates the status of the Maximum Green timer for phases
4 and 8.
Figure 13 Controller Status

MOST – Hands On Signal Timing Training (Isolated Intersections) Participant Workbook
1-18
Step 4. Navigate to the Detector Status display. • While the simulation is running, navigate to the Detector Status
window by completing the following sequence: o Select “Main Menu” in the controller front panel keypad. o Select “Status Display” in the menu by selecting “7” on the keypad. o Select “Detectors” in the menu by selecting “6” on the keypad.
• The information shown in the controller panel is the current status for all of the detectors. In the example shown in Figure 14, there are active calls on detectors 2, 4, and 8, since an “X” is shown under these detector numbers.
• It should be noted that all the detectors in the MOST labs are operating in the presence mode. Whenever the detection zone is occupied, a call is being continuously sent to the controller. We are not using any features which store the call after the vehicle leaves the detection zone.
• Once you have completed a review of this screen, select “Stop” in the MOST window to end the simulation.
Figure 14 Detector Status

MOST – Hands On Signal Timing Training (Isolated Intersections) Participant Workbook
1-19
Step 5. Read the Detector Status window. • Restart the simulation and set “Pause At” to 33.5. • While the simulation is running, navigate to the detector status window
by selecting the sequence: “MM,” “7,” and “6” on the ASC/3 controller.
• When the simulation reaches 33.5 seconds, the VISSIM window will appear as shown in Figure 15. Which detectors are occupied? The only detector that is occupied is on the southbound approach, detector 4.
• The status of each detector is shown in Figure 16. What is the status of detector 4? Detector 4 is on, as noted by the “X” under the detector number. This is consistent with the previous bullet, where we saw that a vehicle is occupying detector 4.
Figure 15 Intersection at simulation time step 33.5 seconds
Figure 16 Detector Status at simulation time step 33.5 seconds

MOST – Hands On Signal Timing Training (Isolated Intersections) Participant Workbook
1-20
Step 6. Relate vehicle position to detector status. • The simulation should still be paused at 33.5 seconds, as per step 5. • Press “Run Mode Single Step” until you see the vehicle on the WB
approach, the circled vehicle in Figure 17. How does this vehicle affect the status of detector 6?
• Press “Run Mode Single Step” repeatedly until you see the detector status for detector 6 change to “ON,” when the “X” is indicated on detector 6 (See Figure 18). This occurs when the simulation time reaches 38.9 seconds and the vehicle is just entering the detection zone.
Figure 17 Intersection at simulation time step 38.9 seconds
Figure 18 Detector status at simulation time step 38.9 seconds

MOST – Hands On Signal Timing Training (Isolated Intersections) Participant Workbook
1-21
Step 7. Identify a vehicle call. • The simulation should still be paused (at time = 38.9 seconds). • Select “Pause At,” and enter “63.0.” • In the MOST interface, select “Run Mode” to run the simulation. • Navigate to the Controller Status window by executing the following
sequence: “MM,” “7,” “1.” • When the simulation reaches t = 63.0 seconds, review the simulation
window and the controller status. • Note the vehicle on the southbound approach waiting to be served
(shown in circle, phase 4, Figure 19). • Figure 20 shows the controller status at t = 63 seconds. Note the
following key points: o Row 1 shows each of the eight phases. o Row 2 shows that phases 2 and 6 are currently timing (noted by the
“T”). Phase 4 will time after phases 2 and 6, noted by “N,” for “phase next.”
o Row 3 shows that phases 4 and 6 have active calls, noted by “C.” Figure 19 shows that detectors 4 and 6 are both occupied.
o There are no active pedestrian calls (row 4). o Phase 2 (ring 1) and phase 6 (ring 2) are currently timing as shown
in row 5. For these phases you can see that the current indication is yellow with 1.7 seconds left on the yellow timer (row 6).
o Row 7 shows that both of these phases are terminating by gap out.
Figure 19 Intersection at simulation time = 63.0 seconds
Figure 20 Controller Status at simulation time = 63.0 seconds

MOST – Hands On Signal Timing Training (Isolated Intersections) Participant Workbook
1-22
Step 8. Determine when a phase has started. • The simulation should be paused (with a simulation time of 63.0
seconds). • Determine the time that phase 4 starts, using the following steps.
o Select “Run Mode Single Step” in the MOST interface repeatedly until you see that the indication changes from red to green for phase 4. However, you should advance the simulation slow enough so that you can observe both the traffic flow and the controller status. Take time to observe all that is occurring in the simulation.
o Note that phase 4 starts at the simulation time of 66.8 seconds. Figure 21 shows the intersection view for this simulation time as well as the controller status at this time.
o The top of Figure 21 shows the VISSIM window and the green indication for phase 4.
o The bottom of the figure shows that phase 4 is timing (“T”) and that there is a call active (“C”). The Minimum Green timer (“MGRN”) has started and its current value is 6.9 seconds.
Figure 21 Intersection and controller status at simulation time = 66.8 seconds
Green indications
Phase 4 is timing with an active call
Minimum Green timer is timing with current value of 6.9 seconds
NB
EB
SB
WB
MOST – Hands On Signal Timing Training (Isolated Intersections) Participant Workbook
1-23
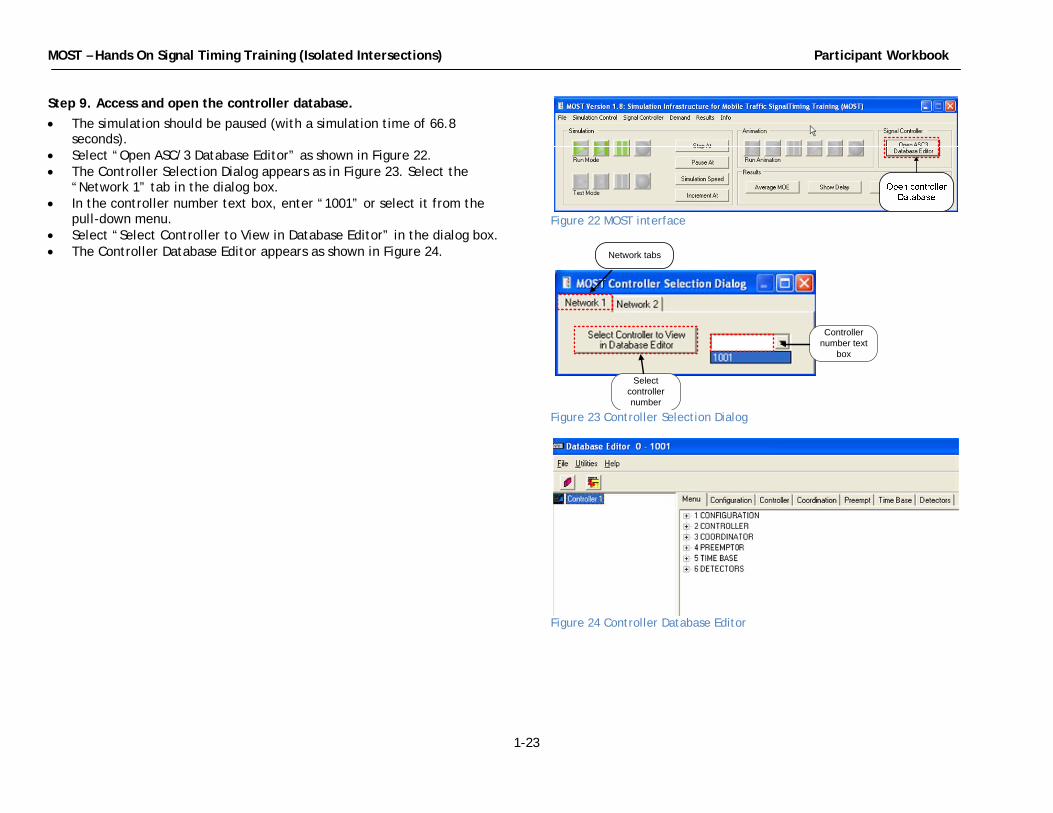
Step 9. Access and open the controller database. • The simulation should be paused (with a simulation time of 66.8
seconds). • Select “Open ASC/3 Database Editor” as shown in Figure 22. • The Controller Selection Dialog appears as in Figure 23. Select the
“Network 1” tab in the dialog box. • In the controller number text box, enter “1001” or select it from the
pull-down menu. • Select “Select Controller to View in Database Editor” in the dialog box. • The Controller Database Editor appears as shown in Figure 24.
Figure 22 MOST interface
Figure 23 Controller Selection Dialog
Figure 24 Controller Database Editor
Network tabs
Controller number text
box
Select controller number
MOST – Hands On Signal Timing Training (Isolated Intersections) Participant Workbook
1-24
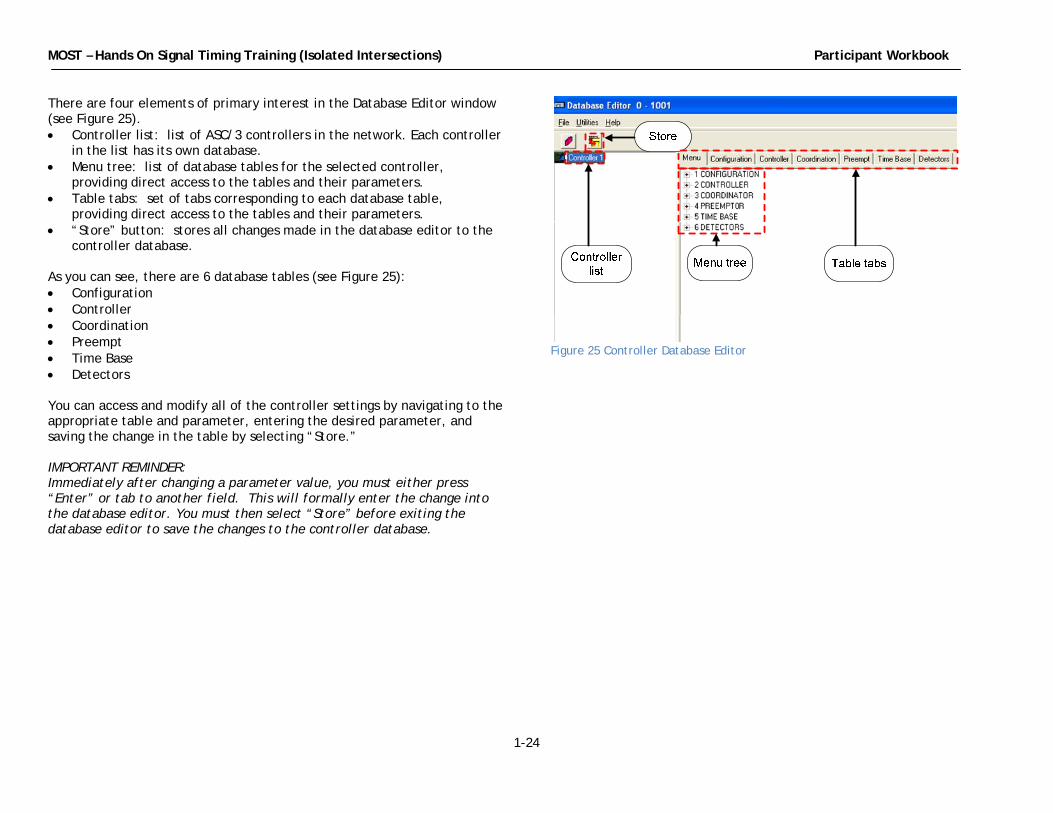
There are four elements of primary interest in the Database Editor window (see Figure 25). • Controller list: list of ASC/3 controllers in the network. Each controller
in the list has its own database. • Menu tree: list of database tables for the selected controller,
providing direct access to the tables and their parameters. • Table tabs: set of tabs corresponding to each database table,
providing direct access to the tables and their parameters. • “Store” button: stores all changes made in the database editor to the
controller database. As you can see, there are 6 database tables (see Figure 25): • Configuration • Controller • Coordination • Preempt • Time Base • Detectors You can access and modify all of the controller settings by navigating to the appropriate table and parameter, entering the desired parameter, and saving the change in the table by selecting “Store.” IMPORTANT REMINDER: Immediately after changing a parameter value, you must either press “Enter” or tab to another field. This will formally enter the change into the database editor. You must then select “Store” before exiting the database editor to save the changes to the controller database.
Figure 25 Controller Database Editor

MOST – Hands On Signal Timing Training (Isolated Intersections) Participant Workbook
1-25
Step 10. Navigate to the Vehicle Extension parameter in the Controller Timing Plan table. • Select the “Controller” tab (see Figure 26). • Locate the field in the row labeled “Vehicle Ext” and the column for
phase 4. This is the phase 4 Vehicle Extension time field (see Figure 26).
• Change the Vehicle Extension time setting for phase 4 in controller 1001. Select the phase 4 Vehicle Extension time field to put your cursor in the field.
• Enter “5.0.” • Press the “Enter” key. • Select “Store” to save this change to the controller database. • Exit from the Database Editor. • Close the MOST Controller Database Selection Dialog. • Stop the simulation.
Figure 26 Controller table in the Database Editor

MOST – Hands On Signal Timing Training (Isolated Intersections) Participant Workbook
1-26
Considering the Questions Let’s now consider each of the three questions that were presented at the beginning of Lesson #4. • Which screen shows the status of the phasing and timing processes? • Where are the timing parameters stored? • How can you verify that a vehicle call has been placed? Take a few minutes to review each question and write brief answers to each question in the box on the right based on your observations from this experiment.
Answers to questions:

MOST – Hands On Signal Timing Training (Isolated Intersections) Participant Workbook
1-27
CLOSURE: SUMMARY OF KEY POINTS LEARNED In Module 1 you learned about the simulation tools that you will use in the remainder of the MOST course. The simulation tools consist of three components, the MOST interface, the VISSIM simulation model, and the ASC/3 controller emulator. In Lesson #1, you saw that the MOST simulation environment produces realistic results when compared with a video of the operation of a real intersection. In the other three lessons you learned how to use the MOST interface, some of the features of the VISSIM simulation model, and how to navigate the ASC/3 controller You will use these tools extensively, starting in Module 2. Here you will learn about how the detector design and the timing parameters on the cross street of an isolated intersection affect the operation of the intersection.

MOST – Hands On Signal Timing Training (Isolated Intersections) Participant Workbook
1-28
GLOSSARY Standard definitions for traffic signal terminology are provided by the National Electrical Manufacturers Association (NEMA) [9] and by the National Transportation Communications for ITS Protocol (NTCIP) 1202 document, “Object Definitions for Actuated Traffic Signal Controller Units” [2]. Definitions are also provided in the Federal Highway Administration’s Traffic Signal Timing Manual [5]. The definitions presented here are adapted from these sources. Term Definition ASC/3 Virtual Controller
A software version of the ASC/3 controller, a NEMA-NTCIP compliant product, manufactured by Econolite.
NEMA Used to describe the set of standards developed by the National Electrical Manufacturers Association for actuated traffic control systems that are used in conjunction with NTCIP 1202.
NTCIP Acronym for the National Transportation Communications for ITS (Intelligent Transportation Systems) Protocol, a set of standards developed to enable open communications between various devices used in transportation systems. The standards document 1202, addressing protocols and objects for actuated traffic control systems, is used as a basis for terms and concepts throughout these lessons.
VISSIM A simulation model developed by PTV Vision and the model that is used as part of MOST. It is one of several microscopic simulation models available today. It models traffic flow of individual vehicles including cars and trucks at signalized intersections and provides the realism of the varying performance of each vehicle.