modis-derived daily par simulation from cloud-free images and its validation
TRANSCRIPT

Available online at www.sciencedirect.com
www.elsevier.com/locate/solener
Solar Energy 82 (2008) 528–534
MODIS-derived daily PAR simulation from cloud-free images andits validation
Liangfu Chen a,b,*, Yanhua Gao a,c, Lei Yang a,d, Qinhuo Liu a,Xingfa Gu a,b, Guoliang Tian a,b
a State Key Laboratory of Remote Sensing Science, Jointly Sponsored by Institute of Remote Sensing Applications of Chinese Academy of Sciences
and Beijing Normal University, Beijing 100101, Chinab The Center for National Spaceborne Demonstration, Beijing 100101, China
c Institute of Geographic Sciences and Natural Resources Research, Chinese Academy of Sciences, Beijing 100101, Chinad Jilin University, Changchun 130026, China
Received 2 February 2007; received in revised form 27 November 2007; accepted 4 December 2007Available online 2 January 2008
Communicated by: Associate Editor Frank Vignola
Abstract
In this paper, a MODIS-derived daily PAR (photosynthetically active radiation) simulation model from cloud-free image over landsurface has been developed based on Bird and Riordan’s model. In this model, the total downwelling spectral surface irradiance isdivided into two parts: one is beam irradiance, and another is diffuse irradiance. The attenuation of solar beam irradiance comprisesscattering by the gas mixture, absorption by ozone, the gas mixture and water vapor, and scattering and absorption by aerosols. Thediffuse irradiance is scattered out of the direct beam and towards the surface. The multiple ground–air interactions have been taken intoaccount in the diffuse irradiance model. The parameters needed in this model are atmospheric water vapor content, aerosol optical thick-ness and spectral albedo ranging from 400 nm to 700 nm. They are all retrieved from MODIS data. Then, the instantaneous photosyn-thetically available radiation (IPAR) is integrated by using a weighted sum at each of the visible MODIS wavebands. Finally, a dailyPAR is derived by integration of IPAR. In order to validate the MODIS-derived PAR model, we compared the field PAR measurementsin 2003 and 2004 against the simulated PAR. The measurements were made at the Qianyanzhou ecological experimental station, ChineseEcosystem Research Network. A total of 54 days of cloud-free MODIS L1B level images were used for the PAR simulation. Our resultsshow that the simulated PAR is consistent with field measurements, where the correlation coefficient of linear regression between calcu-lated PAR and measured PAR is 0.93396. However, there were some uncertainties in the comparison of 1 km pixel PAR with the towerflux stand measurement.� 2007 Elsevier Ltd. All rights reserved.
Keywords: MODIS; PAR; Albedo
1. Introduction
Global terrestrial ecosystems have been taking up sub-stantial CO2 from the atmosphere, offsetting a part of
0038-092X/$ - see front matter � 2007 Elsevier Ltd. All rights reserved.
doi:10.1016/j.solener.2007.12.001
* Corresponding author. Address: State Key Laboratory of RemoteSensing Science, Jointly Sponsored by Institute of Remote SensingApplications of Chinese Academy of Sciences and Beijing NormalUniversity, Beijing 100101, China. Tel.: +86 10 64836589.
E-mail address: [email protected] (L. Chen).
human-induced increases in atmospheric CO2 concentra-tion and the greenhouse effect (Schimel et al., 2001). Sincethe terrestrial carbon uptake is affected by numerous envi-ronmental, biological and human factors, it has high spa-tial heterogeneity and temporal variations. Its accuratequantification is essential for realistic prediction of globalclimate change and effective implementation of the Kyotoprotocol. Although extensive and intensive studies havebeen conducted, there are still many uncertainties in

L. Chen et al. / Solar Energy 82 (2008) 528–534 529
estimating the magnitude, spatial distribution, and tempo-ral variation of the terrestrial carbon sink, and also inunderstanding its underlying mechanisms (Schimel et al.,2001). As the largest continent, Asia encompasses a vast ter-ritory, and has complicated topography, various climatestype, and abundant ecosystem diversity. Our 54 flux obser-vation sites belonging to the three regional networks (i.e.AsiaFlux, KoFlux and ChinaFLUX) (YU Guirui et al.,2005) are not well distributed in different ecosystems, andare not enough to illustrate the spatio-temporal patternsof carbon sink/source of terrestrial ecosystems. Further-more, there are no sufficient meteorological observationsdistributed in Asia, so it is necessary to combine remotesensing with flux observations and meteorological measure-ments to enhance the overall research on flux observationsand to promote the comprehensive regional carbon budget.
Since the pioneering work of Tucker et al. on the corre-lation between remote sensing-derived vegetation index(e.g., the normalized difference vegetation index, NDVI)and photosynthetic activity (Tucker et al., 1985), satelliteremote sensing has become a primary source of data onregional ecosystem patterns and productivity (Schimel,1995; Field et al., 1995). Absorption of photosyntheticallyactive radiation (PAR) is a very important parameter inboth remote sensing-based and process-based models.Monteith’s original logic suggested that the net primaryproduction (NPP) of well-watered and fertilized annualcrop plants was linearly related to the amount of absorbedPAR (Monteith, 1972). Nevertheless, at this time, in mostof the existing carbon cycle models, such as the model dri-ven by satellites or remote sensing data and the process-based mechanism model, spatial PAR is obtained frommeteorological station PAR measurements (Running andCoughlan, 1988; Raich et al., 1991; Potter et al., 1993;Ruimy et al., 1994; Prince and Goward, 1995; Liu et al.,1997; Cao and Woodward, 1998; Chen et al., 1999; Itoand Oikawa, 2002; Xiao et al., 2004). In those models,the incident PAR is generally regarded as a constant partof solar total shortwave irradiance, where the constantsare assumed to be 0.47–0.5. Then, the spatio-temporalPAR is provided by interpolating meteorological measure-ments of PAR to regional or global scale. Even for theMODIS daily photosynthesis (PSN) and annual net pri-mary production (NPP) product (MOD17), its incidentshortwave solar radiation was obtained from the DataAssimilation Office (DAO), which assimilated diagnosticsurface energy budget datasets with a spatial resolutionof 1� by 1� geographic resolution on the geographic grid(Running et al., 1999). In fact, starting with Leckner(1978), a series of solar irradiance models have been devel-oped based on the radiation transfer equations, for exam-ple, those of Justus and Paris (1985), Bird and Riordan(1986), Green and Chai (1988), Gregg and Carder (1990),Eck and Dye (1991), Li et al. (1997), Knyazikhin and Mar-shak (1999), and Frouin et al. (2000). In order to determinethe instantaneous photosynthetically available radiationand absorbed radiation by phytoplankton, MODIS Ocean
Science Team used Gregg and Carder’s (1990) model tocalculate maritime irradiance by adapting the data inputsfrom MODIS and other EOS sensors. In their algorithm,the multiple sea surface-boundary-layer/atmosphere inter-actions are not considered because of the very low reflec-tance of the sea surface (Carder et al., 1999).
In order to promote the study of spatio-temporal pat-terns of carbon sink/source of terrestrial ecosystems byusing remotely sensed data, regional PAR simulation with1 km by 1 km geographic resolution over land surfaces isaddressed in this paper using the MODIS data as inputs.The algorithm of the PAR in this paper is based on thealgorithm that has its theoretical basis in document ATBD20, which extends from Gregg and Carder’s (1990) model.But, the big difference is that the model we used is well-sui-ted for terrigenous aerosols. In addition, the multiple landsurface-boundary-layer/atmosphere interactions are con-sidered over the land surface, and the important parame-ters for IPAR calculation, such as the atmospheric watervapor and aerosol with 1 km by 1 km spatial resolution,and the land surface albedo, with a wavelength rangingfrom 400 nm to 700 nm, are all derived from the MODISdata in this paper. The main goal of the research presentedin this paper is to validate the remote sensing-based esti-mates of daily PAR, using the solar incident measurementsover the land surface. Therefore, after we obtained thePAR simulation from cloud-free MODIS images from2003 to 2004, the comparison was conducted with thePAR measurements obtained from the Qianyanzhou exper-imental station of CERN (Chinese ecosystem research net-work) located in the mid-subtropical monsoon landscapezone of South East China. Finally, the effects of satellite-derived parameter on PAR are analyzed in this paper.The method of MODIS-derived daily PAR simulationfrom cloud-free images is addressed in detail in second sec-tion, and the third section presents the PAR simulatedresults and some discussions. The final section containsthe conclusions of this paper.
2. Methods
2.1. IPAR simulation over land surface algorithm
IPAR is most useful in measuring spatial incident irradi-ance. It is the total downwelling photon flux just above theland surface, integrated over the wavelength range 400–700 nm, which can be expressed as
IPAR ¼ 1
hc
Z 700
400
EdðkÞdk ð1Þ
where h is Planck’s constant, c is the speed of light, Ed(k) issolar spectral incident irradiance, the k means the specificwavelength. The IPAR algorithm is also based on Greggand Carder (1990) model, which is suitable for terrigenousaerosols mode used in this paper. Here is a brief descriptionof the IPAR calculation algorithm.

530 L. Chen et al. / Solar Energy 82 (2008) 528–534
Solar spectral incident irradiance over land surface isseparated into its beam and diffuse components,
EdðkÞ ¼ EddðkÞ þ EdsðkÞ ð2Þ
where the subscripts dd and ds refer to beam and diffusecomponents, respectively.
The beam component Edd(k) is calculated from absorp-tion and scattering by each atmospheric, it is
EddðkÞ ¼ F 0ðkÞ cosðhÞT rðkÞT ozðkÞT oðkÞT wðkÞT aðkÞ ð3Þ
where F0(k) is the mean extraterrestrial irradiance correctedfor earth–sun distance and orbital eccentricity proposed byGordon et al. (1983). The solar radiative spectrum on thetop of atmosphere used in this article was gained fromWorld Radiation Center (Neckel and Labls, 1981); h is so-lar zenith angle, and Tr(k), Toz(k), To(k), Tw(k) and Ta(k)represent transmittances after absorption and/or scatteringby Rayleigh scattering, ozone, other gases, water vapor,and aerosols, respectively. In Eq. (3), the Rayleigh totaltransmittance is taken from Bird and Riordan (1986),
T rðkÞ ¼ exp � M 0ðhÞ115:6406k4 � 1:335k2
� �ð4Þ
where k is in lm and M 0ðhÞ is the atmospheric path lengthcorrected for atmospheric pressure P.
M 0ðhÞ ¼ MðhÞP=P 0 ð5Þ
where M(h) is atmospheric path length calculated by Kas-ten model (Kasten, 1966), and P and P0 are the measuredatmospheric pressure and standard atmospheric pressure.
The ozone transmittance in Eq. (3) is computed by
T ozðkÞ ¼ exp½�aozðkÞO3MozðhÞ� ð6Þ
where aoz(k) is the ozone absorption coefficient, O3 is thevertical ozone mass and Moz(h) is the ozone path length ci-ted from Paltridge empirical model (Paltridge and Platt,1976),
MozðhÞ ¼1:0035
ðcos2 hþ 0:007Þ1=2ð7Þ
The oxygen and water vapor transmittances were takenfrom Bird and Riordan (1986)
T oðkÞ ¼ exp1:41aoðkÞM 0ðhÞ
½1þ 118:3aoðkÞM 0ðhÞ�0:45
( )ð8Þ
T wðkÞ ¼ exp0:2385awðkÞW �MðhÞ
½1þ 20:37awðkÞW �MðhÞ�0:45
( )ð9Þ
where the ao(k) and aw(k) are the oxygen and water vaporabsorption coefficients which derived from transmittancecalculations with the 6S Code (Vermote et al., 1997), W
is the total precipitable water vapor in cm, which isMODIS product MOD05, we get it in our PAR simulationoperation system using the same algorithm described laterin this paper.
The aerosol transmittance is computed by
T aðkÞ ¼ exp½�saðkÞMðhÞ� ð10Þwhere sa(k) is aerosol optical thicknesses, it is directly re-trieved from MODIS data.
The diffuse component Eds(k) comprises three parts ofcontributions from Rayleigh scattering, aerosol scatteringand multiple ground–air interactions respectively.
EdsðkÞ ¼ I rðkÞ þ IaðkÞ þ IgðkÞ ð11Þwhere Ir(k), Ia(k) and Ig(k) represent the diffuse componentsof incident irradiance arising from Rayleigh scattering, aer-osol scattering, and multiple ground–air interactions,respectively. Thereinto, the Rayleigh scattering Ir(k) iscomputed by
I rðkÞ ¼ F 0ðkÞ cos h � T ozðkÞT aðkÞT wðkÞT aaðkÞð1� T 0:95
r ðkÞÞ � 0:5 ð12Þ
where Taa is the transmittance after aerosol absorption, it isthe function of the single-scattering albedo of the aerosolxa(k), aerosol optical thicknesses sa(k) and aerosol pathlength M(h), which is calculated by Justus and Paris model(Justus and Paris, 1985),
T aaðkÞ ¼ exp½�ð1� xaðkÞ� � saðkÞMðhÞ ð13Þsingle-scattering albedo of the aerosol is calculated by
xa ¼ 0:945 � exp½�0:095 � ðlog10ðkÞ=0:4Þ2� ð14ÞAerosol scattering Ia(k) is computed by
IaðkÞ ¼ F 0ðkÞ cos h � T ozðkÞT aðkÞT wðkÞT 1:5r ðkÞ
ð1� T asðkÞÞ � F aðkÞ ð15Þ
where Tas(k) represents transmittance due to aerosol scat-tering, it is calculated by
T asðkÞ ¼ exp½�xaðkÞsaðkÞMðhÞ� ð16ÞFa(k) in Eq. (15) presents the forward scattering probabilityof the aerosol. According to Bird and Riordan model, it iscomputed (Bird and Riordan, 1986) by,
F a ¼ 1� 0:5 exp½ðB1 þ B2 cos hÞ cos h� ð17Þwhere B1 and B2 is a function of asymmetry parametercosh, which is an anisotropy factor for the aerosol scatter-ing phase function and can be computed by Bird and Rior-dan model (Bird and Riordan, 1986).
The multiple ground–air interactions, Ig(k) is set to zeroover sea surface because of too rare multiple sea surface-boundary-layer/atmosphere interactions (Gordon andCastano, 1987). But over land surface, the multipleground–air interactions must be taken into account. Ig(k)is computed by
IgðkÞ ¼ IdðkÞ � BSAshort � rs þ ½I rðkÞ þ IaðkÞ��WSAshort � rs
þ ½IdðkÞ � BSAshort � rs þ ½I rðkÞ þ IaðkÞ� �WSAshort � rs�1�WSAshort � rs
ð18Þ

L. Chen et al. / Solar Energy 82 (2008) 528–534 531
where rs is atmospheric albedo; BSAshort and WSAshort areblack-sky albedo and white-sky albedo of land surfacerespectively; rs, BSAshort and WSAshort are all widely bandaveraged albedo ranging from 400 nm to 700 nm. The firstterm in right side of Eq. (18) represents the reflected beamincident irradiances by land surface toward to atmosphereand then reflected back again by atmosphere. The secondterm represents the reflected diffuse incident irradiancesby land surface toward to atmosphere and then reflectedback again by atmosphere. The third term is the multipleground–air interactions more than two times includingthe incident beam and diffuse irradiance.
2.2. The integration of IPAR in a day
The IPAR is instantaneous from remote sensed data,and it has to be integrated into an entire day or more inorder to be used in NPP simulation. In this paper, theday is chosen to be time step and the IPAR is integratedinto PAR for a whole day. The following approach is usedto calculate PAR,
PARday ¼pðsin / sin dþ cos / cos d cos xÞ
dðx0 sin / sin dþ cos / cos d cos x0ÞIPAR ð19Þ
where PARday is the daily PAR over land surface, / is thelatitude of the location, d represents the latitude of the sun,x is the solar angle while the satellite passing and x0 is theangle while sunset. The d, x and x0 can be computed by
d ¼ 0:006894� 0:39512 cos hþ 0:072075 sin h
� 0:006799 cos 2hþ 0:000896 sin 2h� 0:002689 cos 3h
þ 0:001516 sin 3h ð20Þ
x ¼ arccossin h� sin / sin d
cos / cos d
� �ð21Þ
x0 ¼ arccosð� tan / tan dÞ ð22Þ
where h is the solar high, it can be calculated according toFrouin model (Frouin et al., 1990),
h ¼ 2pðdn� 1Þ=365 ð23Þwhere dn is the day sequence number in a year, which is as-sumed to corresponding region [0,2p].
2.3. The parameterization of the model
The PAR calculation needs the atmospheric watervapor, aerosol optical thickness and the land surfacealbedo as inputs. Because the PAR algorithm in this paperis utilized to build satellite-derived NPP simulation opera-tion system and the albedo in this paper is only rangingfrom 400 nm to 700 nm, the relative aerosol product, watervapor product and BRDF/albedo product are not directlyused in this paper, but their algorithms are used. The fol-lowing is the briefly description of the algorithms.
There are several kinds of algorithms to retrieve watervapor from 850 nm to 1050 nm channel such as absorptioncoefficient algorithm (Bennartz and Fischer, 2001), the
ratio of narrow and wide bands algorithm (Frouin et al.,1990). In this paper, the total water vapor can be calculatedby Kaufman and Gao model (Kaufman and Gao, 1992),which is based on a comparison between the reflected solarradiation in the absorption channel and in nearby non-absorption channels. Aerosol optical depth is oftenretrieved based on the dark object algorithm because thereflectance of vegetation and water in the near-IR spectralrange is very low and the sensor signal is mainly from thescattering of atmospheric aerosol. Thus, the aerosol opticaldepth can be retrieved from a look-up-table based on the6S code (King et al., 1992; Kaufman et al., 1977; Tanreet al., 1998). But this algorithm is not available for thesparsely vegetated area and the effect of surface reflectancehas to be considered. For this point, land surface reflectiv-ity database which covered the whole world at0.1 � 0.1 deg grid had been used to retrieve aerosol opticalthickness of arid and semiarid area (Hsu et al., 2004) used.In this article, the surface reflectance models for dense andsparse vegetation are used to separate the surface reflectioncontribution from radiance. The aerosol optical thicknessis retrieved based on a look-up-table using 6S code.
The land surface albedo is a dimensionless ratio of theradiant energy scattered away by a surface to that received,regardless of direction. It depends on both the BRDF ofthe surface and the scattering behavior of the atmosphereabove it. In this paper, we used the algorithm for MODISbidirectional reflectance anisotropies of the land surface(AMBRALS) (Strahler et al., 1995) to get the BRDF of sur-face. Here the difference is the black-sky albedo and white-sky albedo for PAR computation is integrated only from400 nm to 700 nm in this paper. So the MODIS visible albedoproduct including black-sky and white-sky albedo over 400–700 nm has also been downloaded to calculate the land-atmospheric multi-response effects. Since the albedo productis produced based on 16 days images, we developed an algo-rithm to get albedo when there are less than 8 days cloud-freeimages in this paper based on the AMBRALS method.
2.4. Study site
The experimental site is located in the Qianyanzhou agri-culture experimental station (26�4404800N, 115�0401300E) ofred soil and hilly land of CERN (Chinese EcosystemResearch Network), CAS (Chinese Academy of Sciences).Qianyanzhou is situated on the typical red earth hilly regionin the mid-subtropical monsoon landscape zone of SouthChina. According to the statistics of meteorological datafrom 1985 to 2002, the mean annual temperature is17.9 �C, annual precipitation 1542.4 mm, annual evaporate1110.3 mm, mean relative humidity 84%. The coniferousforest plantation was mainly planted after 1985, whichdominated by Pinus massoniana, Pinus elliotti Engelm, Cun-
ninghamia lanceolata Hook, Schima crenata Korthaos, Cit-
rus L., etc. the area of evergreen vegetation is about 76%of the total area. In the Qianyanzhou station, a flux tower(26�44029.100N, 115�03029.200E) was set up on a patch with
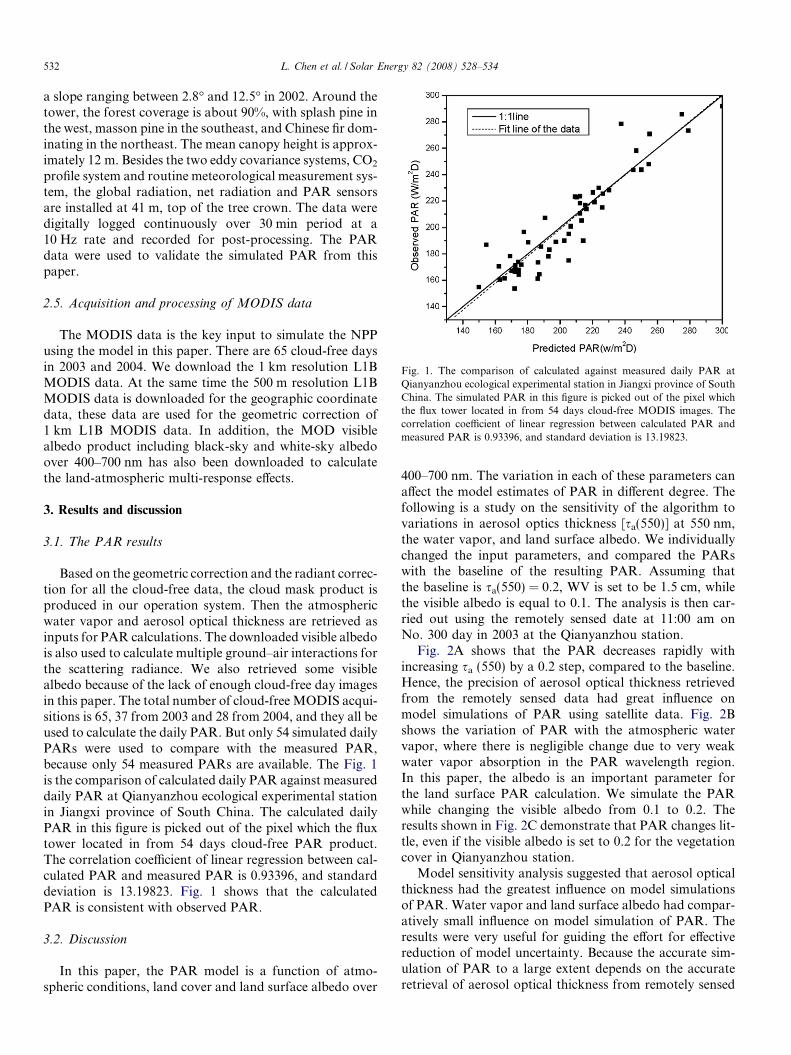
Fig. 1. The comparison of calculated against measured daily PAR atQianyanzhou ecological experimental station in Jiangxi province of SouthChina. The simulated PAR in this figure is picked out of the pixel whichthe flux tower located in from 54 days cloud-free MODIS images. Thecorrelation coefficient of linear regression between calculated PAR andmeasured PAR is 0.93396, and standard deviation is 13.19823.
532 L. Chen et al. / Solar Energy 82 (2008) 528–534
a slope ranging between 2.8� and 12.5� in 2002. Around thetower, the forest coverage is about 90%, with splash pine inthe west, masson pine in the southeast, and Chinese fir dom-inating in the northeast. The mean canopy height is approx-imately 12 m. Besides the two eddy covariance systems, CO2
profile system and routine meteorological measurement sys-tem, the global radiation, net radiation and PAR sensorsare installed at 41 m, top of the tree crown. The data weredigitally logged continuously over 30 min period at a10 Hz rate and recorded for post-processing. The PARdata were used to validate the simulated PAR from thispaper.
2.5. Acquisition and processing of MODIS data
The MODIS data is the key input to simulate the NPPusing the model in this paper. There are 65 cloud-free daysin 2003 and 2004. We download the 1 km resolution L1BMODIS data. At the same time the 500 m resolution L1BMODIS data is downloaded for the geographic coordinatedata, these data are used for the geometric correction of1 km L1B MODIS data. In addition, the MOD visiblealbedo product including black-sky and white-sky albedoover 400–700 nm has also been downloaded to calculatethe land-atmospheric multi-response effects.
3. Results and discussion
3.1. The PAR results
Based on the geometric correction and the radiant correc-tion for all the cloud-free data, the cloud mask product isproduced in our operation system. Then the atmosphericwater vapor and aerosol optical thickness are retrieved asinputs for PAR calculations. The downloaded visible albedois also used to calculate multiple ground–air interactions forthe scattering radiance. We also retrieved some visiblealbedo because of the lack of enough cloud-free day imagesin this paper. The total number of cloud-free MODIS acqui-sitions is 65, 37 from 2003 and 28 from 2004, and they all beused to calculate the daily PAR. But only 54 simulated dailyPARs were used to compare with the measured PAR,because only 54 measured PARs are available. The Fig. 1is the comparison of calculated daily PAR against measureddaily PAR at Qianyanzhou ecological experimental stationin Jiangxi province of South China. The calculated dailyPAR in this figure is picked out of the pixel which the fluxtower located in from 54 days cloud-free PAR product.The correlation coefficient of linear regression between cal-culated PAR and measured PAR is 0.93396, and standarddeviation is 13.19823. Fig. 1 shows that the calculatedPAR is consistent with observed PAR.
3.2. Discussion
In this paper, the PAR model is a function of atmo-spheric conditions, land cover and land surface albedo over
400–700 nm. The variation in each of these parameters canaffect the model estimates of PAR in different degree. Thefollowing is a study on the sensitivity of the algorithm tovariations in aerosol optics thickness [sa(550)] at 550 nm,the water vapor, and land surface albedo. We individuallychanged the input parameters, and compared the PARswith the baseline of the resulting PAR. Assuming thatthe baseline is sa(550) = 0.2, WV is set to be 1.5 cm, whilethe visible albedo is equal to 0.1. The analysis is then car-ried out using the remotely sensed date at 11:00 am onNo. 300 day in 2003 at the Qianyanzhou station.
Fig. 2A shows that the PAR decreases rapidly withincreasing sa (550) by a 0.2 step, compared to the baseline.Hence, the precision of aerosol optical thickness retrievedfrom the remotely sensed data had great influence onmodel simulations of PAR using satellite data. Fig. 2Bshows the variation of PAR with the atmospheric watervapor, where there is negligible change due to very weakwater vapor absorption in the PAR wavelength region.In this paper, the albedo is an important parameter forthe land surface PAR calculation. We simulate the PARwhile changing the visible albedo from 0.1 to 0.2. Theresults shown in Fig. 2C demonstrate that PAR changes lit-tle, even if the visible albedo is set to 0.2 for the vegetationcover in Qianyanzhou station.
Model sensitivity analysis suggested that aerosol opticalthickness had the greatest influence on model simulationsof PAR. Water vapor and land surface albedo had compar-atively small influence on model simulation of PAR. Theresults were very useful for guiding the effort for effectivereduction of model uncertainty. Because the accurate sim-ulation of PAR to a large extent depends on the accurateretrieval of aerosol optical thickness from remotely sensed
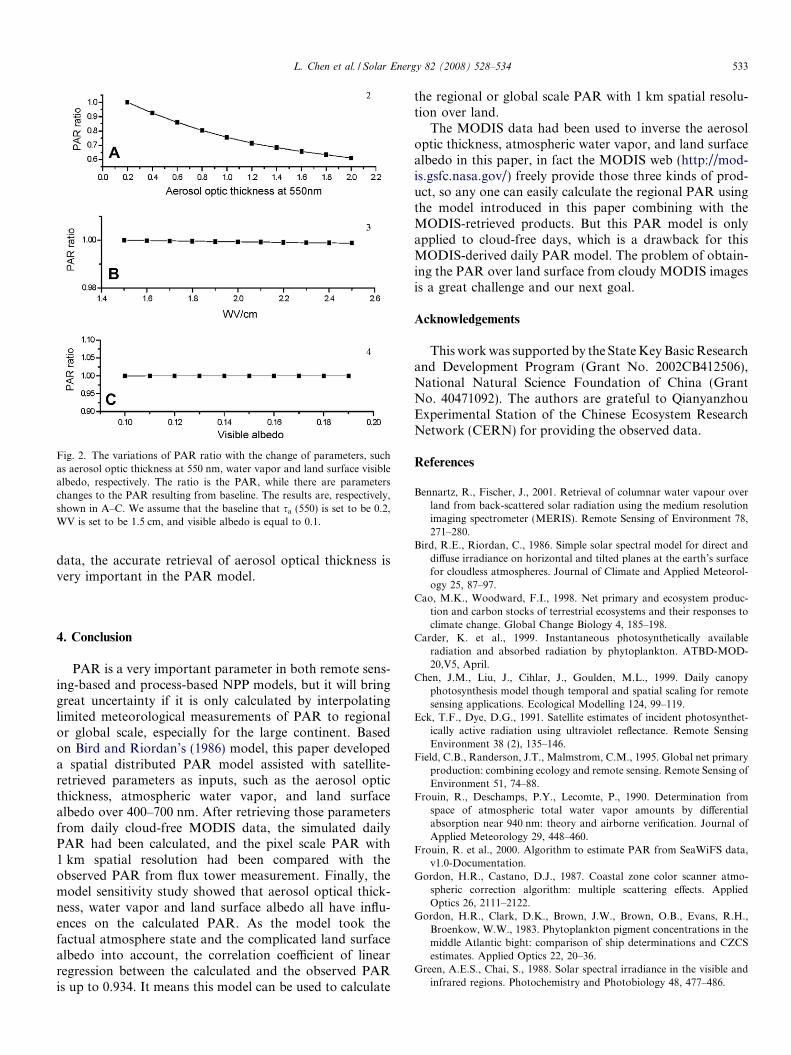
Fig. 2. The variations of PAR ratio with the change of parameters, suchas aerosol optic thickness at 550 nm, water vapor and land surface visiblealbedo, respectively. The ratio is the PAR, while there are parameterschanges to the PAR resulting from baseline. The results are, respectively,shown in A–C. We assume that the baseline that sa (550) is set to be 0.2,WV is set to be 1.5 cm, and visible albedo is equal to 0.1.
L. Chen et al. / Solar Energy 82 (2008) 528–534 533
data, the accurate retrieval of aerosol optical thickness isvery important in the PAR model.
4. Conclusion
PAR is a very important parameter in both remote sens-ing-based and process-based NPP models, but it will bringgreat uncertainty if it is only calculated by interpolatinglimited meteorological measurements of PAR to regionalor global scale, especially for the large continent. Basedon Bird and Riordan’s (1986) model, this paper developeda spatial distributed PAR model assisted with satellite-retrieved parameters as inputs, such as the aerosol opticthickness, atmospheric water vapor, and land surfacealbedo over 400–700 nm. After retrieving those parametersfrom daily cloud-free MODIS data, the simulated dailyPAR had been calculated, and the pixel scale PAR with1 km spatial resolution had been compared with theobserved PAR from flux tower measurement. Finally, themodel sensitivity study showed that aerosol optical thick-ness, water vapor and land surface albedo all have influ-ences on the calculated PAR. As the model took thefactual atmosphere state and the complicated land surfacealbedo into account, the correlation coefficient of linearregression between the calculated and the observed PARis up to 0.934. It means this model can be used to calculate
the regional or global scale PAR with 1 km spatial resolu-tion over land.
The MODIS data had been used to inverse the aerosoloptic thickness, atmospheric water vapor, and land surfacealbedo in this paper, in fact the MODIS web (http://mod-is.gsfc.nasa.gov/) freely provide those three kinds of prod-uct, so any one can easily calculate the regional PAR usingthe model introduced in this paper combining with theMODIS-retrieved products. But this PAR model is onlyapplied to cloud-free days, which is a drawback for thisMODIS-derived daily PAR model. The problem of obtain-ing the PAR over land surface from cloudy MODIS imagesis a great challenge and our next goal.
Acknowledgements
This work was supported by the State Key Basic Researchand Development Program (Grant No. 2002CB412506),National Natural Science Foundation of China (GrantNo. 40471092). The authors are grateful to QianyanzhouExperimental Station of the Chinese Ecosystem ResearchNetwork (CERN) for providing the observed data.
References
Bennartz, R., Fischer, J., 2001. Retrieval of columnar water vapour overland from back-scattered solar radiation using the medium resolutionimaging spectrometer (MERIS). Remote Sensing of Environment 78,271–280.
Bird, R.E., Riordan, C., 1986. Simple solar spectral model for direct anddiffuse irradiance on horizontal and tilted planes at the earth’s surfacefor cloudless atmospheres. Journal of Climate and Applied Meteorol-ogy 25, 87–97.
Cao, M.K., Woodward, F.I., 1998. Net primary and ecosystem produc-tion and carbon stocks of terrestrial ecosystems and their responses toclimate change. Global Change Biology 4, 185–198.
Carder, K. et al., 1999. Instantaneous photosynthetically availableradiation and absorbed radiation by phytoplankton. ATBD-MOD-20,V5, April.
Chen, J.M., Liu, J., Cihlar, J., Goulden, M.L., 1999. Daily canopyphotosynthesis model though temporal and spatial scaling for remotesensing applications. Ecological Modelling 124, 99–119.
Eck, T.F., Dye, D.G., 1991. Satellite estimates of incident photosynthet-ically active radiation using ultraviolet reflectance. Remote SensingEnvironment 38 (2), 135–146.
Field, C.B., Randerson, J.T., Malmstrom, C.M., 1995. Global net primaryproduction: combining ecology and remote sensing. Remote Sensing ofEnvironment 51, 74–88.
Frouin, R., Deschamps, P.Y., Lecomte, P., 1990. Determination fromspace of atmospheric total water vapor amounts by differentialabsorption near 940 nm: theory and airborne verification. Journal ofApplied Meteorology 29, 448–460.
Frouin, R. et al., 2000. Algorithm to estimate PAR from SeaWiFS data,v1.0-Documentation.
Gordon, H.R., Castano, D.J., 1987. Coastal zone color scanner atmo-spheric correction algorithm: multiple scattering effects. AppliedOptics 26, 2111–2122.
Gordon, H.R., Clark, D.K., Brown, J.W., Brown, O.B., Evans, R.H.,Broenkow, W.W., 1983. Phytoplankton pigment concentrations in themiddle Atlantic bight: comparison of ship determinations and CZCSestimates. Applied Optics 22, 20–36.
Green, A.E.S., Chai, S., 1988. Solar spectral irradiance in the visible andinfrared regions. Photochemistry and Photobiology 48, 477–486.
534 L. Chen et al. / Solar Energy 82 (2008) 528–534
Gregg, W.W., Carder, K.L., 1990. A simple spectral solar irradiancemodel for cloudless maritime atmospheres. Limnology and Oceanog-raphy 35 (8), 1657–1675.
Hsu, Christina, Tsay, SiChee, King, Michael D., 2004. Aerosol propertiesover bright-reflecting source regions. IEEE TGARS 42 (3), 557–569.
Ito, A., Oikawa, T., 2002. A simulation model of the carbon cycle in landecosystems (Sim-CYCLE): a description based on dry-matter produc-tion theory and plot-scale validation. Ecological Modelling 151, 143–176.
Justus, C.G., Paris, M.V., 1985. A model for solar spectral irradiance atthe bottom and top of a cloudless atmosphere. Journal of Climate andApplied Meteorology 24, 193–205.
Kasten, F., 1966. A new table and approximate formula for relativeoptical air mass. Archives of Meteorology Geophysics and Bioclima-tology B 14, 206–223.
Kaufman, Y.J., Gao, B.-C., 1992. Remote sensing of water vapor in thenear IR from EOS/MODIS. IEEE Transactions on Geoscience andRemote Sensing 30, 871–884.
Kaufman, Y.J., Wald, A.E., Remer, L.A., Gao, B.C., Li, R.R., Flynn, L.,1997. The MODIS 2. 1-lm channel-correlation with visible reflectancefor use in remote sensing of aerosol. IEEE Transactions on Geoscienceand Remote Sensing 35 (5), 1286–1298.
King, M.D., Kaufman, Y.J., Menzel, W.P., Tanre, D., 1992. Remotesensing of cloud, aerosol, and water vapor properties from themoderate resolution imaging spectrometer (MODIS). IEEE Transac-tions on Geoscience and Remote Sensing 30, 1–27.
Knyazikhin, Y., Marshak, A., 1999. Mathematical aspects of BRDFmodeling: adjoint problem and Green‘s Function. Remote SensingReviews 18, 263–280.
Leckner, B., 1978. The spectral distribution of solar radiation at theEarth’s surface elements of a model. Solar Energy 20, 143–150.
Li, Z., Moreau, L., Arking, A., 1997. On solar energy disposition: aperspective from observation and modeling. Bulletin of the AmericanMeteorological Society 78, 53–70.
Liu, J., Chen, J.M., Cihlar, J., Park, W.M., 1997. A process-based borealecosystem productivity simulator using remote sensing inputs. RemoteSensing of Environment 62, 158–175.
Monteith, J.L., 1972. Solar radiation and productivity in tropicalecosystems. Journal of Application of Ecology 9 (4), 747–766.
Neckel, H., Labls, D., 1981. Improved data of solar spectral irradiancefrom 0.33 to 1.25 lm. Solar Physics 74, 231–249.
Paltridge, G.W., Platt, C.M.R., 1976. Radiative Processes in Meteorologyand Climatology. Elsevier.
Potter, C.S., Randerson, J.T., Field, C.B., Matson, P.A., Vitousek, P.M.,Mooney, H.A., Klooster, S.A., 1993. Terrestrial ecosystem production:
a process model based on global satellite and surface data. GlobalBiogeochemical Cycles 7 (4), 811–841.
Prince, S.D., Goward, S.J., 1995. Global primary production: a remotesensing approach. Journal of Biogeography 22, 815–835.
Raich, J.W., Rastetter, E.B., Melillo, J.M., et al., 1991. Potential netprimary productivity in south America: application of a global model.Ecological Application 4, 399–429.
Ruimy, A., Saugier, B., Dedieu, G.M., 1994. Methodology for theestimation of net primary production from remotely sensed data.Journal of Geophysical Research 99, 5263–5283.
Running, S.W., Nemani, Ramakrishna, Glassy, Joseph M., Thornton,Peter E., 1999. MODIS daily photosynthesis (PSN) and annual netprimary production (NPP) product (MOD17), Algorithm TheoreticalBasis Document,Version 3.0.
Running, S.W., Coughlan, J.C., 1988. A general model of forest ecosystemprocesses for regional applications, I. Hydrologic balance, canopy gasexchange and primary production processes. Ecological Modelling 42,125–154.
Schimel, D.A., 1995. Terrestrial biogeochemical cycle: global estimateswith remote sensing. Remote Sensing of Environment 51, 49–56.
Schimel, D.A., House, J.I., Hibbard, K.A., et al., 2001. Recent patternsand mechanisms of carbon exchange by terrestrial ecosystems. Nature414, 169–172.
Strahler, A.H., Barnsley, M.J., d’Entremont, R., Hu, B., Lewis, P., Li, X.,Muller, J.-P., Barker, Schaaf, Wanner, W., Zhang, B., 1995. MODISBRDF/Albedo Product: Algorithm Theoretical Basis DocumentVersion 3.2. NASA EOS, May 1995.
Tanre, D., Deschamps, P.Y., Devaux, C., Herman, M., 1998. Estimationof Saharan aerosol optical thickness from blurring effects in The-matic Mapper data. Journal of Geophysical Research 93, 15955–15964.
Tucker, C.J., Townshend, J.R.G., Goff, T.E., 1985. African land-coverclassification using satellite data. Science 227, 369–375.
Vermote, E.F., Tanre, D., Deuze, J.L., Herman, M., Morcrette, J.J., 1997.Second simulation of the satellite signal in the solar spectrum: anoverview. IEEE Transactions on Geoscience and Remote Sensing 35(3), 675–686.
Xiao, X., Hollinger, D., Aber, J., Goltz, M., Davidson, E.A., Zhang, Q.,Moore III, B., 2004. Satellite-based modeling of gross primaryproduction in an evergreen needle leaf forest. Remote Sensing ofEnvironment 89, 519–534.
YU Guirui, ZHANG Leiming, SUN Xiaomin, FU Yuling, LIZhengquan, 2005. Advances in carbon flux observation and researchin Asia. Science in China Series D Earth Sciences 48 (Supp. I), 51–62.