modified level ii streambed-scour analysis for structure … · the methods and model outlined in...
TRANSCRIPT
Modified Level II Streambed-Scour Analysis for Structure 1-69-64-4767 Crossing Tippey Ditch in Grant County, Indiana
By BRET A. ROBINSON, DAVID C. VOELKER, and ROBERT L MILLER
Prepared in cooperation with theINDIANA DEPARTMENT OF TRANSPORTATION
U.S. GEOLOGICAL SURVEY
Open-File Report 97-318
Indianapolis, Indiana
1997

U.S. DEPARTMENT OF THE INTERIOR
BRUCE BABBITT, Secretary
U.S. GEOLOGICAL SURVEY
Gordon P. Eaton, Director
For additional information, write to:District ChiefU.S. Geological SurveyWater Resources Division5957 Lakeside BoulevardIndianapolis, IN 46278-1996
Copies of this report can be purchased from:U.S. Geological SurveyBranch of Information ServicesBox 25286Federal CenterDenver, CO 80225
CONTENTS
Abstract................................................................... 1
Introduction................................................................ 1
Background and Scope ................................................... 1
Site Description......................................................... 2
Evaluation Methods ......................................................... 3
Special Considerations ....................................................... 6
Results.................................................................... 6
References................................................................. 6
Appendix.................................................................. 7
Water Surface PROfile Model (WSPRO) Input File............................. 8
Water Surface PROfile Model (WSPRO) Output............................... 9
Tables
1. Cumulative scour depths for the modeled discharges at structure 1-69-64-4767crossing Tippey Ditch in Grant County, Indiana ............................. 5
Contents iii

CONVERSION FACTORS AND ABBREVIATIONS
Multiply By To obtain
inch (in.)
foot (ft)
square foot (ft2)
feet per second (ft/s)
cubic foot per second (ftVs)
mile (mi)
square mile (mi2)
25.4
0.3048
929.0
0.3048
0.02832
1.609
2.590
millimeter
meter
square centimeter
meters per second
cubic meter per second
kilometer
square kilometer
Abbreviations used in this report:
D50 median diameter of bed material
Q100 100-year discharge
FEMA Federal Emergency Management Agency
HEC Hydraulic Engineering Circular
IDNR Indiana Department of Natural Resources
INDOT Indiana Department of Transportation
USGS U. S. Geological Survey
WSPRO Water Surface PROfile model
iv Modified Level II, 1-69-64-4767, Tippey Ditch, Grant County, Indiana
Modified Level II Streambed-Scour Analysis for Structure 1-69-64-4767 Crossing Tippey Ditch in Grant County, Indiana
By Bret A. Robinson, David C. Voelker, and Robert L. Miller
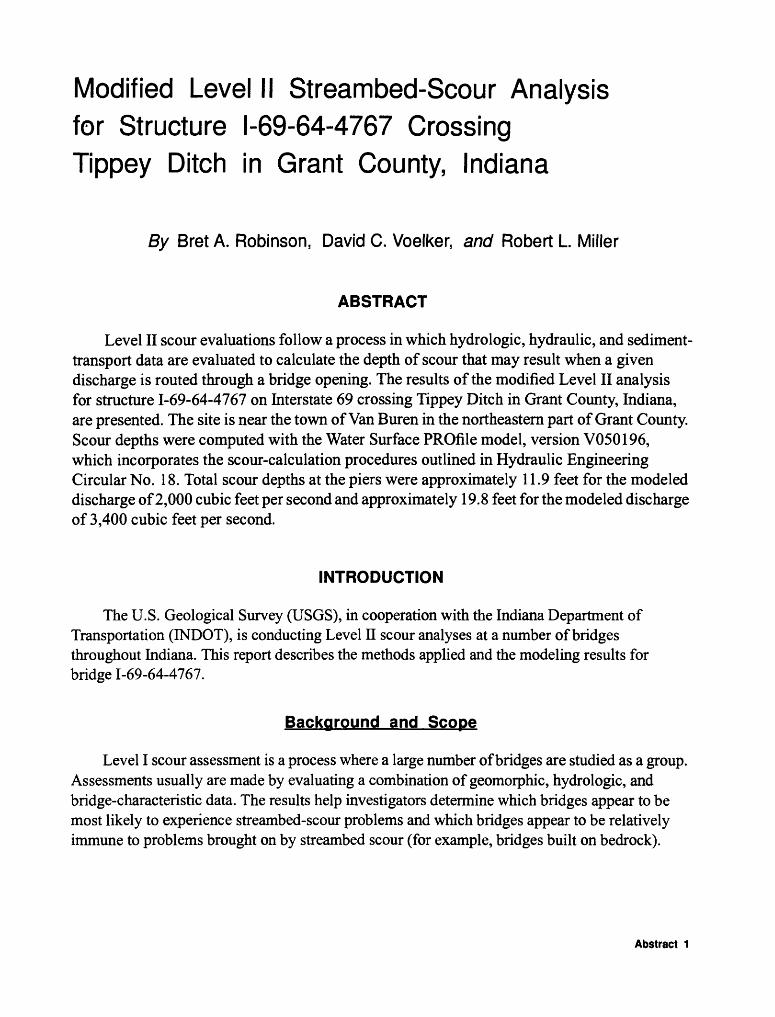
ABSTRACT
Level II scour evaluations follow a process in which hydrologic, hydraulic, and sediment- transport data are evaluated to calculate the depth of scour that may result when a given discharge is routed through a bridge opening. The results of the modified Level II analysis for structure 1-69-64-4767 on Interstate 69 crossing Tippey Ditch in Grant County, Indiana, are presented. The site is near the town of Van Buren in the northeastern part of Grant County. Scour depths were computed with the Water Surface PROfile model, version V050196, which incorporates the scour-calculation procedures outlined in Hydraulic Engineering Circular No. 18. Total scour depths at the piers were approximately 11.9 feet for the modeled discharge of 2,000 cubic feet per second and approximately 19.8 feet for the modeled discharge of 3,400 cubic feet per second.
INTRODUCTION
The U.S. Geological Survey (USGS), in cooperation with the Indiana Department of Transportation (INDOT), is conducting Level II scour analyses at a number of bridges throughout Indiana. This report describes the methods applied and the modeling results for bridge 1-69-64-4767.
Background and Scope
Level I scour assessment is a process where a large number of bridges are studied as a group. Assessments usually are made by evaluating a combination of geomorphic, hydrologic, and bridge-characteristic data. The results help investigators determine which bridges appear to be most likely to experience streambed-scour problems and which bridges appear to be relatively immune to problems brought on by streambed scour (for example, bridges built on bedrock).
Abstract 1
When applied correctly, Level I scour assessments provide an investigator with information to identify those bridges that appear to be relatively safe and those bridges that fall into higher risk categories. «.
Level II scour evaluations describe the process for an investigator to apply a model to a bridge site and calculate the potential depth of scour that may result from a given flood event. Level II analyses involve the application of basic hydrologic, hydraulic, and sediment-transport engineering concepts and may include an evaluation of flood history, channel hydraulic conditions (for example, water-surface profile analysis), and basic sediment-transport analyses such as scour calculations (Lagasse and others, 1995).
The methods and model outlined in Hydraulic Engineering Circular (HEC) No. 18 (Richardson and Davis, 1995) formulate the basis for Level II scour evaluations. Methods used in this study for Level II scour evaluations are a modification of the HEC-18 standards. These modifications were made to comply with the methodology requested by INDOT (Merril Dougherty, Indiana Department of Transportation, oral commun., 1996). Descriptions of the specific modifications are given in the "Evaluation Methods" section of this report.
This report presents the methods followed for modeling, special considerations for this study site, and the input for and the output from the Water Surface PROfile (WSPRO) model.
Site Description
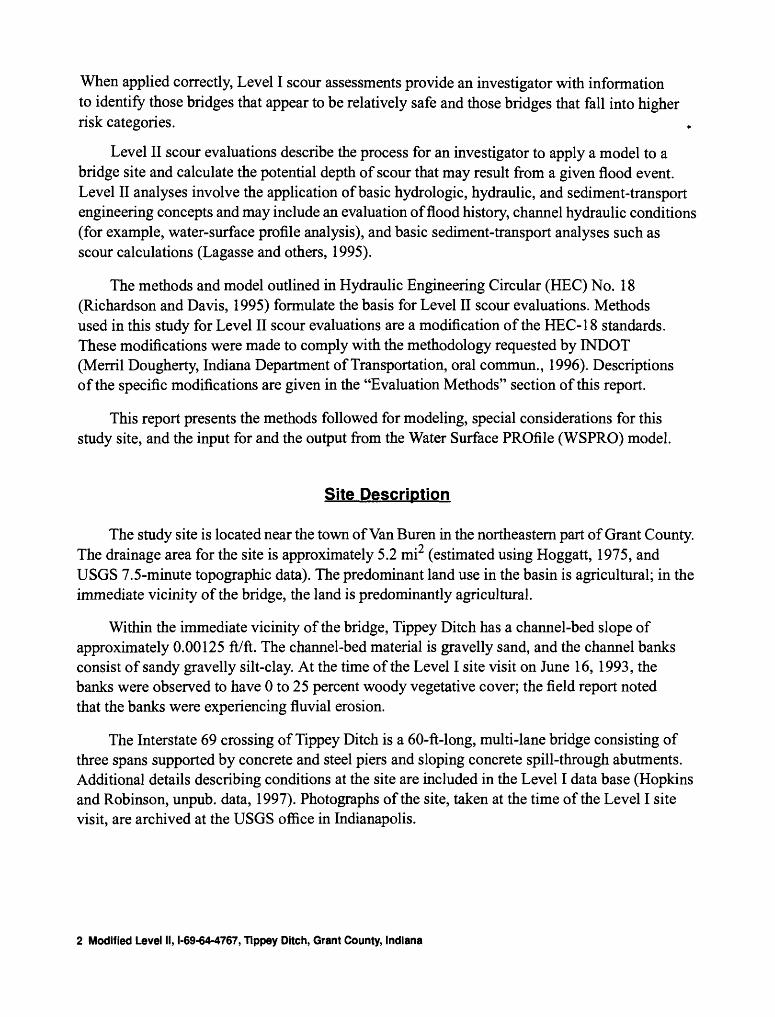
The study site is located near the town of Van Buren in the northeastern part of Grant County.^
The drainage area for the site is approximately 5.2 mi (estimated using Hoggatt, 1975, and USGS 7.5-minute topographic data). The predominant land use in the basin is agricultural; in the immediate vicinity of the bridge, the land is predominantly agricultural.
Within the immediate vicinity of the bridge, Tippey Ditch has a channel-bed slope of approximately 0.00125 ft/ft. The channel-bed material is gravelly sand, and the channel banks consist of sandy gravelly silt-clay. At the time of the Level I site visit on June 16, 1993, the banks were observed to have 0 to 25 percent woody vegetative cover; the field report noted that the banks were experiencing fluvial erosion.
The Interstate 69 crossing of Tippey Ditch is a 60-ft-long, multi-lane bridge consisting of three spans supported by concrete and steel piers and sloping concrete spill-through abutments. Additional details describing conditions at the site are included in the Level I data base (Hopkins and Robinson, unpub. data, 1997). Photographs of the site, taken at the time of the Level I site visit, are archived at the USGS office in Indianapolis.
2 Modified Level II, 1-69-64-4767, Tippey Ditch, Grant County, Indiana
EVALUATION METHODS
The methods described in this section apply to a number of bridge sites in Indiana being evaluated for scour and outline the procedures requested by INDOT for these modified Level II scour analyses. The principal modification requested by INDOT was that the input data to the model come from or be estimated from existing data sources; no additional field data were collected. Actual methods used in the scour evaluation at this particular bridge site use the most applicable method possible, given the data available.
To determine drainage area, either published values found in Hoggatt (1975) or 7.5-minute topographic maps with Hoggatt's original drainage-area delineations were used. Where there are no published data, drainage-area segments measured from the maps produced by Hoggatt were either subtracted from downstream sites or added to upstream sites published by Hoggatt (1975).
In Indiana, flood discharges are coordinated by agreement among State and Federal agencies. At sites where flood discharges officially are coordinated among State and Federal agencies in Indiana, the coordinated 100-year discharge (Q100) was modeled. INDOT also provided an additional flood discharge for these coordinated sites in excess of the Q100 to be modeled.
If a flood discharge was not coordinated, the USGS examined Federal Emergency Management Agency (FEMA) studies for Q100 determinations. Where FEMA studies did not produce a Q100, the USGS contacted IDNR for an estimated Q100 in the vicinity of the site being studied. If IDNR did not have a Q100, data from nearby USGS streamflow-gaging stations were analyzed with nearby and similar drainage basins that have been coordinated. At sites having no coordinated discharge data, the two discharges used in the model were 1) the approximated Q100 and 2) a discharge equal to 1.7 times the approximated Q100.
Most of the cross-section and bridge-opening geometry data were taken from the bridge plans (Indiana State Highway Commission, 1962) provided by INDOT. Bridge plans are presumed to be representative of current conditions at the site. To determine the cross-section geometry, a line was drawn on the bridge plans parallel to the bridge stationing and approximately one bridge width from the bridge. For sites where the bridge plans did not extend far enough laterally for collection of all cross-section data required for WSPRO model analysis, additional data were collected from 7.5-minute topographic maps.
The roadway and embankment profile was taken from the bridge and highway plans for those sites where roadway overtopping was expected. The INDOT bridge plans and 7.5-minute topographic maps were used as a guide, based on the water-surface elevations calculated by the WSPRO model, to determine if roadway overtopping might occur.
Evaluation Methods 3
Roughness values (^-values) for the main channel were estimated by viewing photographs archived from the Level I scour assessments. The ^-values for the overbanks were assigned on the basis of the surface-cover data summarized in the Level I data base (Hopkins and Robinson, unpub. data, 1997). From those data, the following roughness values were assigned to the surface-cover categories: urban 0.050, suburban 0.035, row crop 0.045, pasture 0.035, brush 0.120, forest 0.100, and wetland (any area covered by standing water) 0.100. The H-values for the overbanks were adjusted if the Level I photographs provided sufficient detail to warrant an adjustment.
WSPRO version V050196 was used to model flow through the study site. Starting water- surface elevation was obtained with a slope-conveyance computation. The channel-bed slope in the immediate vicinity of the bridge was estimated from the 7.5-minute topographic map and was used as the slope of the energy grade line for this computation.
WSPRO version V050196 includes a field that allows the input of up to four scour-adjustment factors (Kl to K4). For this modeling, the default value for K4 (bed armoring) was chosen. For scour-adjustment factors Kl and K2 (pier-nose shape and angle of attack, respectively), input values were determined by evaluating the data archived in the Level I data base (Hopkins and Robinson, unpub. data, 1997). For the K3 factor (bed forms), a value of 1.1 was applied in all cases.
In some cases, piers set on the overbanks are constructed with footings that are higher in elevation than pier footings in the main channel. In these situations, if the channel position changes, the piers that were initially constructed on the overbank may become part of the main channel. Therefore, to evaluate total potential scour, the model results obtained for contraction scour and deepest local scour in the main channel were added and applied to all piers in the bridge opening. This methodology allowed for an evaluation of potential undermining of pier supports in the event that future channel movement placed overbank piers in the main channel.
Where bridge pairs have a continuous abutment or fill between the bridges that does not allow expansion of flow, the bridge pair was modeled as one bridge. Sites with discontinuous abutments, allowing expansion between the bridges, were modeled as two separate bridges. In those cases, a valley cross section was measured between the bridges and used as the approach section for the downstream bridge and as the exit section for the upstream bridge.
At sites with no embankment to function as a weir or at sites where the tailwater drowns out the embankment, a composite bridge and road section was used to compute flow. Those sites were computed with friction-loss equations rather than with a bridge routine.
Total scour is taken as the sum of local scour plus contraction scour. If the model predicted negative contraction scour (aggradation), the contraction-scour value was assumed to be zero in determining the total scour depth (table 1). This assumption was made so that a negative contraction scour would not mask the potentially detrimental effects of local scour at a pier. No abutment scour evaluations were made in this study.
4 Modified Level II, 1-69-64-4767, Tippey Ditch, Grant County, Indiana
Table 1 . Cumulative scour depths for the modeled discharges at structure I-69-64-4767 crossing Tippey Ditch in Grant County, Indiana [--, no value]
Pier number1
Stationing from
bridge plans2
Initialbed-
elevation at pier (feet)
Main-channelcontrac
tion scour depth (feet)
Local scour depth (feet)
Worst-casetotal- scour depth3 (feet)
Bottom elevation
of pier (feet)
Worst- casebed
elevation after
scour4
(feet)
Modeled discharge5 is 2,000 cubic feet per second
1
2
298+34
298+60
837
837
7.1
7.1
4.8
4.8
11.9
11.9
827
827
819.8
819.8
Modeled discharge is 3,400 cubic feet per second
1
2
298+34
298+60
837
837
14.0
14.0
5.8
5.8
19.8
19.8
827
827
811.9
811.9
*Pier numbers were assigned from left to right as shown on the bridge plans.
2Stationing is the center line of the pier as determined from the bridge plans. Stationing from bridge plan, 298+34, represents a point 29,834 feet from an arbitrary starting location referenced on the bridge plans.
3Worst-case total-scour depths are generated by summing the calculated contraction-scour depth with the worst case of local scour.
4Worst-case bed elevation is computed by subtracting the worst-case total-scour depth from the lowest initial bed elevation in the bridge opening (831.7 feet).
5Not a coordinated discharge.
Evaluation Methods 5
SPECIAL CONSIDERATIONS
Model runs indicate the water-surface elevation at the bridge is lower than the low-steel elevation for the modeled discharges. Therefore, there should be no pressure flow through the bridge opening for the discharges modeled.
The piers supporting this bridge are set on the sloping concrete spill-through abutments. Therefore, even though the results shown in table 1 indicate that scour could undermine the piers, scour could only take place after the concrete abutments were removed or by erosion of bed sediment from under the protective abutments.
RESULTS
Scour depths were computed with a version of WSPRO (Larry Arneson, Federal High way Administration, written commun., 1996) modified from Shearman (1990). This version of WSPRO includes scour calculations in the model output. Scour depths were calculated assuming an infinite depth of material that could erode and a homogeneous particle-size distribution. The results of the scour analysis are presented in table 1; a complete input file and output results are presented in the appendix.
REFERENCES
Hoggatt, R.E., 1975, Drainage areas of Indiana streams: U.S. Geological Survey, Water Resources Division, 231 p.
Indiana State Highway Commission, 1962, Bridge plans Interstate Route 69: Bridge File 1-69-64-4767.
Lagasse, P.F.; Schall, J.D.; Johnson, F.; Richardson, E.V.; and Chang, F., 1995, Stream stability at highway structures (2d ed.): Federal Highway Administration, Hydraulic Engineering Circular No. 20, Publication FHWA-IP-90-014, 144 p.
Richardson, E.V., and Davis, S.R., 1995, Evaluating scour at bridges (3d ed.): Federal High way Administration, Hydraulic Engineering Circular No. 18, Publication FHWA-IP-90-017, 204 p.
Shearman, J.O., 1990, User's manual for WSPRO, a computer model for water-surface profile computations: Federal Highway Administration Publication FHWA-IP-89-027, 177 p.
6 Modified Level II, 1-69-64-4767, Tippey Ditch, Grant County, Indiana

APPENDIX
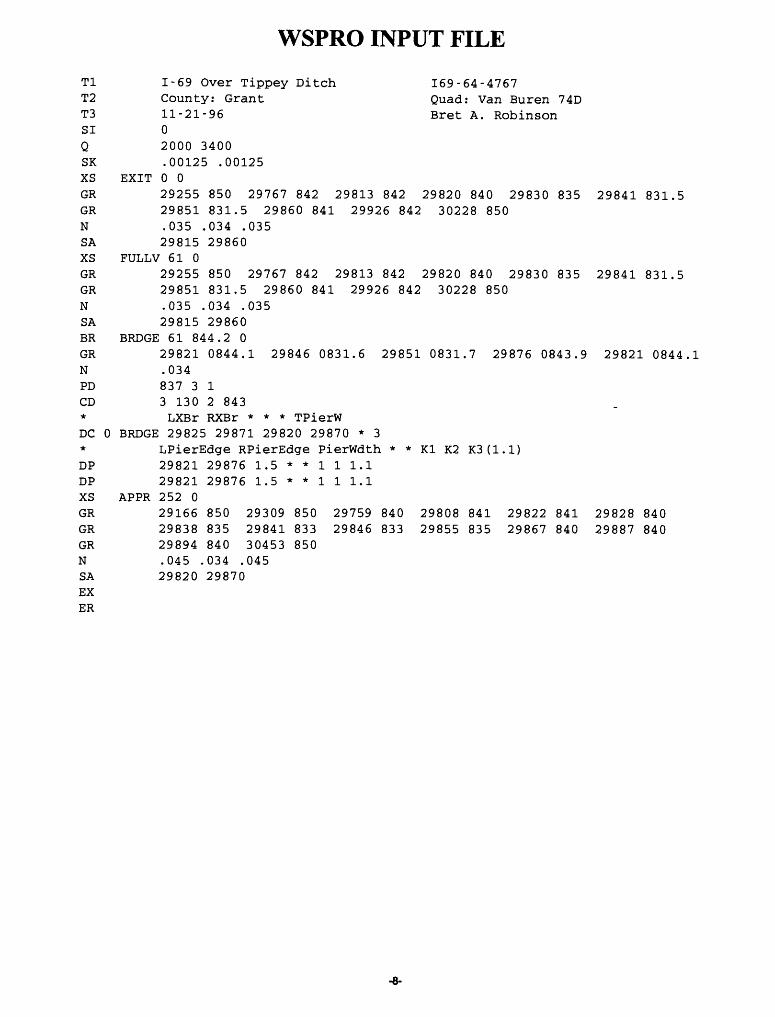
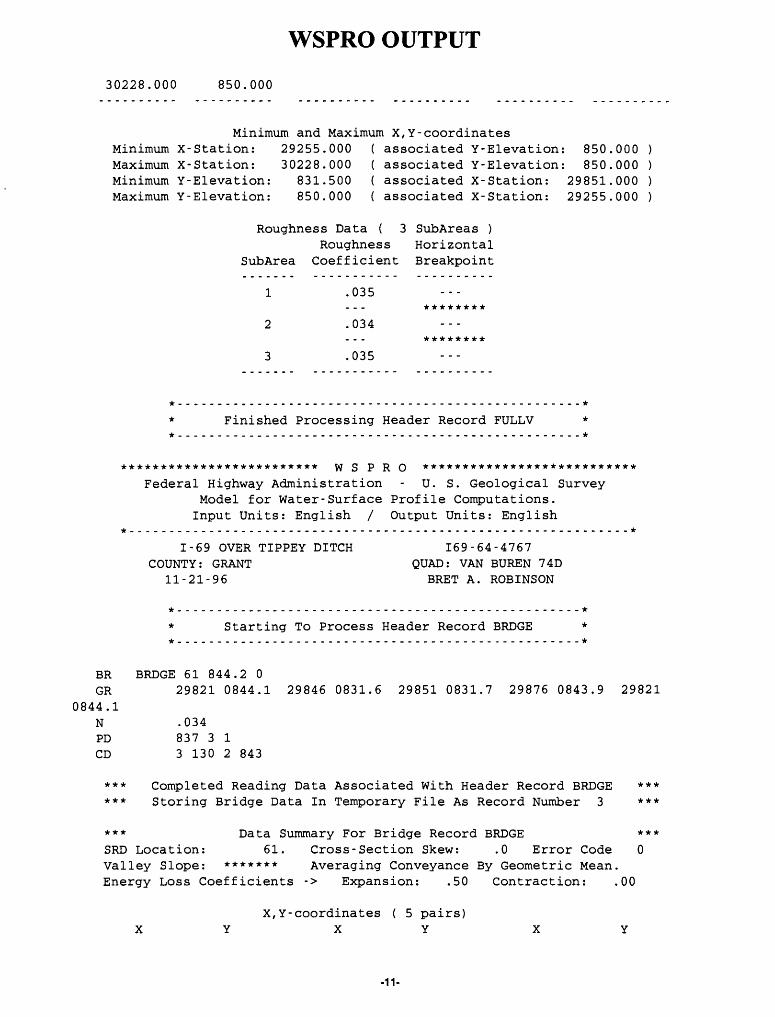
WSPRO INPUT FILE
Tl 1-69 Over Tippey Ditch 169-64-4767T2 County: Grant Quad: Van Buren 74DT3 11-21-96 Bret A. RobinsonSI 0Q 2000 3400SK .00125 .00125XS EXIT 0 0GR 29255 850 29767 842 29813 842 29820 840 29830 835 29841 831.5GR 29851 831.5 29860 841 29926 842 30228 850N .035 .034 .035SA 29815 29860XS FULLY 61 0GR 29255 850 29767 842 29813 842 29820 840 29830 835 29841 831.5GR 29851 831.5 29860 841 29926 842 30228 850N .035 .034 .035SA 29815 29860BR BRDGE 61 844.2 0GR 29821 0844.1 29846 0831.6 29851 0831.7 29876 0843.9 29821 0844.1N .034PD 837 3 1CD 3 130 2 843* LXBr RXBr * * * TPierWDC 0 BRDGE 29825 29871 29820 29870 * 3* LPierEdge RPierEdge PierWdth * * Kl K2 K3(l.l)DP 29821 29876 1.5 * * 1 1 1.1DP 29821 29876 1.5 * * 1 1 1.1XS APPR 252 0GR 29166 850 29309 850 29759 840 29808 841 29822 841 29828 840GR 29838 835 29841 833 29846 833 29855 835 29867 840 29887 840GR 29894 840 30453 850N .045 .034 .045SA 29820 29870EXER

Tl T2 T3 SI Q
WSPRO OUTPUT
WSPRO Federal Highway Administration - U. S. Geological Survey
Model for Water-Surface Profile Computations. Run Date & Time: 8/ 6/97 6:45 am Version V050196 Input File: 4767.dat Output File: 4767.LST
I-69 OVER TIPPEY DITCH COUNTY: GRANTII-21-96
02000 3400
169-64-4767QUAD: VAN BUREN 74DBRET A. ROBINSON
*** Processing Flow Data; Placing Information into Sequence 1 ***
SK .00125 .00125
WSPRO Federal Highway Administration - U. S. Geological Survey
Model for Water-Surface Profile Computations. Input Units: English / Output Units: English
1-69 OVER TIPPEY DITCH COUNTY: GRANT
11-21-96
169-64-4767QUAD: VAN BUREN 74DBRET A. ROBINSON
Starting To Process Header Record EXIT
XSGR
831.5 GR N SA
* *** **
EXIT 0 029255 850 29767 842 29813 842 29820 840 29830 835 29841
29851 831.5 29860 841 29926 842 30228 850.035 .034 .03529815 29860
Completed Reading Data Associated With Header Record EXIT Storing X-Section Data In Temporary File As Record Number 1
**** **
*** Data Summary For Header Record EXIT 3RD Location: 0. Cross-Section Skew: .0 Error Code Valley Slope: .00000 Averaging Conveyance By Geometric Mean. Energy Loss Coefficients -> Expansion: .50 Contraction: .00
X,Y-coordinates (10 pairs) X Y X Y X Y
0
29255.00029820.00029851.00030228.000
850.000840.000831.500850.000
29767.00029830.00029860.000
842.000835.000841.000
29813.00029841.00029926.000
842.000831.500842.000
Minimum and Maximum X,Y-coordinates

WSPRO OUTPUT
Minimum X-Station: 29255.000 { associated Y-Elevation: 850.000 )Maximum X-Station: 30228.000 ( associated Y-Elevation: 850.000 )Minimum Y-Elevation: 831.500 ( associated X-Station: 29851.000 )Maximum Y-Elevation: 850.000 ( associated X-Station: 29255.000 )
Roughness Data ( 3 SubAreas )Roughness Horizontal
SubArea Coefficient Breakpoint
1 .035--- ********
2 .034... ********
3 .035
*__-.-----------------------------------------------*
* Finished Processing Header Record EXIT * a...------------------------------------------------*
r********************** WSPRO ********************* **1
Federal Highway Administration - U. S. Geological SurveyModel for Water-Surface Profile Computations. Input Units: English / Output Units: English
1-69 OVER TIPPEY DITCH 169-64-4767COUNTY: GRANT QUAD: VAN BUREN 74D
11-21-96 BRET A. ROBINSON
*-__.-----------------------------------------------*
* Starting To Process Header Record FULLV **
XS FULLV 61 0GR 29255 850 29767 842 29813 842 29820 840 29830 835 29841
831.5GR 29851 831.5 29860 841 29926 842 30228 850 N .035 .034 .035 SA 29815 29860
*** Completed Reading Data Associated With Header Record FULLV ****** Storing X-Section Data In Temporary File As Record Number 2 ***
*** Data Summary For Header Record FULLV *** 3RD Location: 61. Cross-Section Skew: .0 Error Code 0 Valley Slope: .00000 Averaging Conveyance By Geometric Mean. Energy Loss Coefficients -> Expansion: .50 Contraction: .00
X,Y-coordinates (10 pairs) X Y X Y X Y
29255.000 850.000 29767.000 842.000 29813.000 842.00029820.000 840.000 29830.000 835.000 29841.000 831.50029851.000 831.500 29860.000 841.000 29926.000 842.000
-10-
WSPRO OUTPUT
30228.000 850.000
Minimum and Maximum X,Y-coordinatesMinimum X-Station: 29255.000 ( associated Y-Elevation: 850.000 ) Maximum X-Station: 30228.000 ( associated Y-Elevation: 850.000 ) Minimum Y-Elevation: 831.500 ( associated X-Station: 29851.000 ) Maximum Y-Elevation: 850.000 ( associated X-Station: 29255.000 )
Roughness Data ( 3 SubAreas )Roughness Horizontal
SubArea Coefficient Breakpoint
1 .035.._ ********
2 .034... ********
3 .035
.....-_......---........-..--.-.....----.-....*
Finished Processing Header Record FULLY * ,.-____..----..-.---........-.........-.----._*
Federal Highway Administration - U. S. Geological SurveyModel for Water-Surface Profile Computations.Input Units: English / Output Units: English
*--.------.-.-------.----------------------------------------.--*
1-69 OVER TIPPEY DITCH 169-64-4767COUNTY: GRANT QUAD: VAN BUREN 74D
11-21-96 BRET A. ROBINSON
Starting To Process Header Record BRDGE *
BR BRDGE 61 844.2 0GR 29821 0844.1 29846 0831.6 29851 0831.7 29876 0843.9 29821
0844.1N .034PD 837 3 1CD 3 130 2 843
*** Completed Reading Data Associated With Header Record BRDGE ****** Storing Bridge Data In Temporary File As Record Number 3 ***
*** Data Summary For Bridge Record BRDGE *** 3RD Location: 61. Cross -Section Skew: .0 Error Code 0 Valley Slope: ******* Averaging Conveyance By Geometric Mean. Energy Loss Coefficients -> Expansion: .50 Contraction: .00
X,Y- coordinates ( 5 pairs) X Y X Y X Y
-11-
WSPRO OUTPUT
29821.000 29876.000
844.100 843.900
29846.000 29821.000
831.600 29851.000 844.100
831.700
Minimum and Maximum X,Y-coordinatesMinimum X-Station: 29821.000Maximum X-Station: 29876.000Minimum Y-Elevation: 831.600Maximum Y-Elevation: 844.100
( associated Y-Elevation: 844.100 ) ( associated Y-Elevation: 843.900 ) ( associated X-Station: 29846.000 ) ( associated X-Station: 29821.000 )
Roughness Data ( 1 SubAreas )Roughness Horizontal
SubArea Coefficient Breakpoint
1 .034
Discharge coefficient parametersBRType BRWdth EMBSS EMBElv UserCD
3 130.000 2.00 843.000 **********
Pressure flow elevationsAVBCEL PFElev
********* 844.200
ABSLPL ABSLPRAbutment Parameters XTOELT YTOELT XTOERT YTOERT
******* ******* ********* *********
Pier/Pile Data ( 1 Group(s) ) Code Indicates Bridge Uses Piers
Group Elevation Gross Width Number
837.000 3.000
Finished Processing Header Record BRDGE
WSPRO Federal Highway Administration - U. S. Geological Survey
Model for Water-Surface Profile Computations. Input Units: English / Output Units: English
1-69 OVER TIPPEY DITCH COUNTY: GRANT
11-21-96
DC 0 BRDGE 29825 29871 29820 29870 * 3 DP 29821 29876 1.5 * * 1 1 1.1 DP 29821 29876 1.5 * * 1 1 1.1
169-64-4767QUAD: VAN BUREN 74DBRET A. ROBINSON
12-

WSPRO OUTPUT
Starting To Process Header Record APPR
XS APPR 252 0GR 29166 850 29309 850GR 29838 835 29841 833GR 29894 840 30453 850N .045 .034 .045SA 29820 29870
29759 84029846 833
29808 84129855 835
29822 84129867 840
29828 84029887 840
*** Completed Reading Data Associated With Header Record APPR ****** Storing X-Section Data In Temporary File As Record Number 4 ***
*** Data Summary For Header Record APPR SRD Location: 252. Cross-Section Skew: .0 Error Code Valley Slope: .00000 Averaging Conveyance By Geometric Mean. Energy Loss Coefficients -> Expansion: .50 Contraction: .00
0
XX,Y-coordinates (14 pairs)
X Y X
29166.00029808.00029838.00029855.00029894.000
850.000841.000835.000835.000840.000
29309.00029822.00029841.00029867.00030453.000
850.000841.000833.000840.000850.000
29759.00029828.00029846.00029887.000
840.000840.000833.000840.000
Minimum and Maximum X,Y-coordinatesMinimum X-Station: 29166.000 Maximum X-Station: 30453.000 Minimum Y-Elevation: 833.000 Maximum Y-Elevation: 850.000
( associated Y-Elevation: 850.000 ) ( associated Y-Elevation: 850.000 ) ( associated X-Station: 29846.000 ) ( associated X-Station: 29166.000 )
Roughness Data ( 3 SubAreas )Roughness Horizontal
SubArea Coefficient Breakpoint
1 .045
2
3
.034
.045
********
Bridge datum projection(s) : XREFLT XREFRT FDSTLT FDSTRT******* ******* ******* *******
Finished Processing Header Record APPR
WSPRO
-13-
WSPRO OUTPUT
Federal Highway Administration - U. S. Geological SurveyModel for Water-Surface Profile Computations. Input Units: English / Output Units: English
1-69 OVER TIPPEY DITCH 169-64-4767 COUNTY: GRANT QUAD: VAN BUREN 74D
11-21-96 BRET A. ROBINSON EX
*===================================================*
* Summary of Boundary Condition Information **===================================================*
Reach Water Surface Friction # Discharge Elevation Slope Flow Regime
1 2000.00 ******** .0013 Sub-Critical2 3400.00 ******** .0013 Sub-Critical
* Beginning 2 Profile Calculation(s) **===================================================*
Federal Highway Administration - U. S. Geological SurveyModel for Water-Surface Profile Computations.Input Units: English / Output Units: English
1-69 OVER TIPPEY DITCH 169-64-4767 COUNTY: GRANT QUAD: VAN BUREN 74D
11-21-96 BRET A. ROBINSON ==150 WARNING: SLOPE-CONVEYANCE CONVERGENCE FAILURE.
Used final trial values. QCOMP, WSTRY: 1992. 842.69
WSEL VHDEGEL HFCRWS HO
Q V FR #
AREA K SF
SRDL FLEN ALPHA
LEW REW ERR
Section: EXIT Header Type: XS 3RD: .000
842.686 .423843.109 ******838.468 ******
2000.0004.245.641
471.10756349.36
******
29723.070 29951.910
1.509 ******
Section: FULLV Header Type: FV 3RD: 61.000
842.800 .391843.192 .074838.468 .000
2000.0004.017.615
497.87458747.60
.0012
61.000 29715.77061.000 29956.2201.559 .009
<« The Preceding Data Reflect The "Unconstricted" Profile >»
===135 CONVEYANCE RATIO OUTSIDE OF RECOMMENDED LIMITS AT SECID "APPR " KRATIO: 1.44
-14-

WSPRO OUTPUT
Section: APPR Header Type: AS 3RD: 252.000
843.236843.345841.178
.109
.154
.000
2000.0001.843.305
1085.47584380.31
.0008
191.000 29613.400191.000 30074.870
2.070 -.001
<« The Preceding Data Reflect The "Unconstricted" Profile >»
<« The Following Data Reflect The "Constricted" Profile >» <« Beginning Bridge/Culvert Hydraulic Computations »>
Section: BRDGE Header Type: BR 3RD: 61.000
Specific Bridge Information Bridge Type 3 Flow Type 1 Pier/Pile Code 0
WSELEGELCRWS
842.462843.377839.656
VHDHFHO
.915
.117
.150
QVFR
20006
#
.000
.879
.554
AREAKSF
290.39115
* **
735.89* * *
SRDLFLENALPHA
61.00061.0001.243
LEWREWERR
29824.29873.
- .
280050001
C P/A PFELEV BLEN
,8969 .056 844.200
XLAB XRAB
******** ********
Section: APPRleader Type: AS3RD: 252.000
WSELEGELCRWS
843.762843.831841.178
VHDHFHO
.070
.073
.381
QVFR
20001
#
.000
.490
.231
AREAKSF
1342.107351
SRDLFLENALPHA
225.50
.0008
61.72.2.
000363014
LEWREWERR
29589.30104.
.
720280004
Approach Section APPR M( G ) M( K ) KQ
Flow Contraction Information XLKQ XRKQ OTEL
.891 .509 52635.8 843.762
<« End of Bridge Hydraulics Computations >»
WSPROFederal Highway Administration - U. S. Geological Survey
Model for Water-Surface Profile Computations.Input Units: English / Output Units: English
L-69 OVER TIPPEY DITCH COUNTY: GRANT
11-21-96
169-64-4767QUAD: VAN BUREN 74DBRET A. ROBINSON
WSEL VHDEGEL HFCRWS HO
Q V FR #
AREA K SF
SRDL FLEN ALPHA
LEW REW ERR
-15-

WSPRO OUTPUT
Section: EXIT Header Type: XS 3RD: .000
Section: FULLY Header Type: FV 3RD: 61.000
844.079 844.507 840.700
844.198 844.588 840.700
.428 ************
.390
.073
.000
3400.000 888.451 ********* 29633.9503.827 96082.66 ********* 30004.480.597 ****** 1.880 ******
3400.000 933.408 61.000 29626.3003.643 100664.30 61.000 30008.990.565 .0012 1.888 .008
<« The Preceding Data Reflect The "Unconstricted" Profile >»
===135 CONVEYANCE RATIO OUTSIDE OF RECOMMENDED LIMITS AT SECID "APPR ". KRATIO: 1.53
Section: APPR 844.623 .103 3400.000 1822.677 191.000 29550.980 Header Type: AS 844.726 .143 1.865 153564.10 191.000 30152.4103RD: 252.000 842.105 .000 .261 .0007 1.911
<« The Preceding Data Reflect The "Unconstricted" Profile >»
<« The Following Data Reflect The "Constricted" Profile >» <« Beginning Bridge/Culvert Hydraulic Computations >»
===220 FLOW CLASS 1(4) SOLUTION INDICATES POSSIBLE PRESSURE FLOW.WS3, WSIU, WS1, PFELV: 843.49 846.11 846.18 844.20
===245 ATTEMPTING FLOW CLASS 2(5) SOLUTION.
005
Section: BRDGEHeader Type: BR3RD: 61.000
Specific BridgeBridge Type 3Pier/Pile Code
Section: APPRHeader Type: AS3RD: 252.000
WSELEGELCRWS
844.100845.567841.895
InformationFlow Type 20
WSELEGELCRWS
847.100847.123842.105
VHDHFHO
1.467************
C
.4924
VHDHFHO
.023
.049
.709
QVFR #
3391.6809.713.680
AREAKSF
349.200
SRDLFLENALPHA
61.00054041.84 *********
******
P/A PFELEV BLEN
.057 844
QVFR #
3400.000.939.103
.200 ********
AREAKSF
3622.159355168.20
.0007
1.000
XLAB
LEWREWERR
29821.00029876.000
******
XRAB
******** ********
SRDLFLENALPHA
61.00077.1151.660
LEWREWERR
29439.50030290.890
-.002
Approach Section APPR Flow Contraction Information M( G ) M( K ) KQ XLKQ XRKQ OTEL
******** ******** ********* ******** ******** 847.100
-16-
WSPRO OUTPUT
<« End of Bridge Hydraulics Computations >»
WSPRO Federal Highway Administration - U. S. Geological Survey
Model for Water-Surface Profile Computations. Input Units: English / Output Units: English
it...........-----.-.-.......-----.----.-------.....-.......-.... it
1-69 OVER TIPPEY DITCH 169-64-4767COUNTY: GRANT QUAD: VAN BUREN 74D
11-21-96 BRET A. ROBINSON
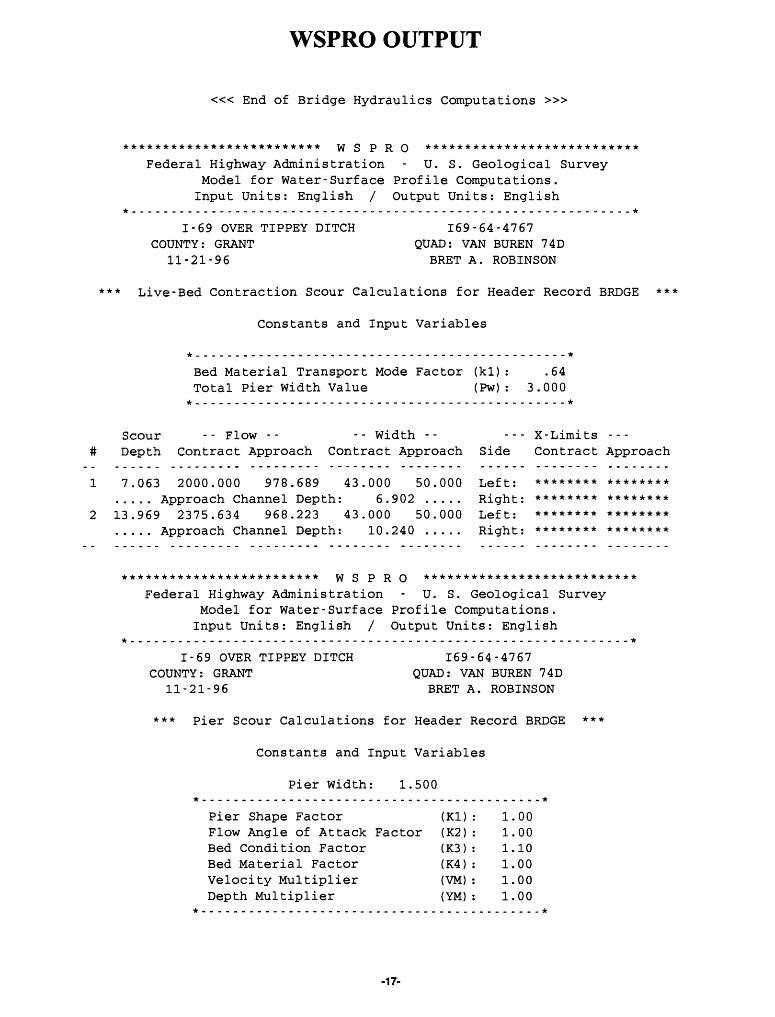
*** Live-Bed Contraction Scour Calculations for Header Record BRDGE ***
Constants and Input Variables
Bed Material Transport Mode Factor (kl): .64 Total Pier Width Value (Pw): 3.000
Scour -- Flow -- -- Width -- --- X-Limits ---
# Depth Contract Approach Contract Approach Side Contract Approach
1 7.063 2000.000 978.689 43.000 50.000 Left: ********..... Approach Channel Depth: 6.902 ..... Right: ********
2 13.969 2375.634 968.223 43.000 50.000 Left:..... Approach Channel Depth: 10.240 ..... Right: ******** ********
WSPRO Federal Highway Administration - U. S. Geological Survey
Model for Water- Surf ace Profile Computations. Input Units: English / Output Units: English
..... .............................................. ..........it
1-69 OVER TIPPEY DITCH 169-64-4767COUNTY: GRANT QUAD: VAN BUREN 74D
11-21-96 BRET A. ROBINSON
*** Pier Scour Calculations for Header Record BRDGE ***
Constants and Input Variables
Pier Width: 1.500*
Pier Shape Factor (Kl)Flow Angle of Attack Factor (K2)Bed Condition Factor (K3)Bed Material Factor (K4)Velocity Multiplier (VM)Depth Multiplier (YM)
1.001.001.101.001.001.00
-17-

WSPRO OUTPUT
#
12
ScourDepth
4.755.75
- - - - Localized Hydraulic Properties - - - - - - X- Stations - -Flow
2000.0003391.680
WSE Depth Velocity Froude # Left Right
842.844 11.244 8.622 .453 29821.000 29876.000844.809 13.209 12.792 .620 29821.000 29876.000
WSPRO Federal Highway Administration - U. S. Geological Survey
Model for Water-Surface Profile Computations. Input Units: English / Output Units: English
1-69 OVER TIPPEY DITCH COUNTY: GRANT
11-21-96
169-64-4767QUAD: VAN BUREN 74DBRET A. ROBINSON
*** pier Scour Calculations for Header Record BRDGE ***
Constants and Input Variables
Pier Width: 1.500
Pier Shape Factor (Kl) Flow Angle of Attack Factor (K2)Bed Condition Factor (K3)Bed Material Factor (K4)Velocity Multiplier (VM)Depth Multiplier (YM)
0000100000
1.00
#
12
Scour Depth
4.75 5.75
---- Localized Hydraulic Flow WSE Depth
2000 3391
.000
.680842.844 844.809
11.244 13.209
Properties Velocity Froude #
812
.622
.792.453 .620
-- X- Stations -- Left Right
29821 29821
.000
.00029876.000 29876.000
ER
Normal end of WSPRO execution. ***************** Elapsed Time: 0 Minutes 3 Seconds
-18-