modified demark analysis for the jse · strategy and its stop loss positioning means that even when...
TRANSCRIPT

JSE DeMark Setup Analysis
© 2 0 1 4 , P o w e r S t o c k s R e s e a r c h – J S E D e M a r k S e t u p A n a l y s i s V 1 . 0
Page 1
MODIFIED
DEMARK ANALYSIS
FOR THE JSE
USER-GUIDE V1.1,
20 September 2014.
“CONVENTIONAL INDICATORS ARE TYPICALLY TREND FOLLOWERS
WHEREAS DEMARK IS DESIGNED SPECIFICALLY TO
ANTICIPATE TREND REVERSALS.” -TOM DEMARK
POWERSTOCKS WILL BE IMPLEMENTING A FEW OF THE MORE POPULAR DEMARK ANALYSIS
TOOLS ON THE JSE, STARTING WITH THE DEMARK SEQUENTIAL: SETUP ANALYSIS.

JSE DeMark Setup Analysis
© 2 0 1 4 , P o w e r S t o c k s R e s e a r c h – J S E D e M a r k S e t u p A n a l y s i s V 1 . 0
Page 2
A. INTRODUCTION The technical analysis indicators developed by Tom DeMark enjoy a reputation for reliability amongst its small group of market users that exceeds that of the average price or volume indicator. DeMark remains one of the lesser known market indicators and is seldom covered in technical analysis syllabi or textbooks. This is largely because DeMark availability has been confined to the professional market and its reputation has spread mainly by word-of-mouth. Consequently, DeMark enjoys a certain degree of exclusivity and so is not yet part of mainstream technical analysis theory". A recent back test of the DeMark Sequential signals showed them to be around 70% accurate. DeMark is essentially a risk-reward strategy and its stop loss positioning means that even when the indicators occasionally underperform, losses are cut to a minimum. The Sequential is perhaps the most commonly used DeMark indicator and has an impressive record of identifying and anticipating turning points across the FX, bond, equity and commodity markets. The Sequential Indicator identifies when a trend is becoming, or has become, exhausted. On daily charts, for example, DeMark identifies precisely which day to enter into a new position or liquidate an existing one. This total absence of ambiguity with regard to market timing makes the Sequential stand out. B. MECHANICS The TD Sequential Indicator consists of two patterns, a TD Setup and a TD Countdown. We have not implemented the COUNTDOWN phase on our analysis as we have not found it accurate enough for our needs. We have taken the algorithms described in Jason Perle's reference work "The DeMark Indicators" and back tested the TD-Setup indicator over 20 years of historical J200 TOP40 Index data. We have made some modifications to the original algorithms to achieve better performance on the JSE since the JSE has its own inherent characteristics that need to be catered for over multiple business cycles, bull markets and bear markets. To this end, we feel we have something that is statistically significant enough to provide a distinct edge in the markets. The basic DeMark BUY-SETUP consists of the following:
Prerequisite is a bearish price-flip, which indicates a switch from positive to negative momentum. This is when the close today is less than the close 4 days ago, but the close yesterday was higher than the close 4 days before that.
After a bearish price-flip, there must be at least nine consecutive closes, each one less than the corresponding close four bars earlier.
The number of consecutive closes that are less than the corresponding close 4 bars earlier are shown by red numbers on the top of each bar
Cancellation - If at any point a bar closes higher than the close four bars earlier (a bullish price flip) the setup is canceled and we are waiting for another bearish price-flip
BUY Signal occurs when there is a cancellation after at least nine consecutive closes, each one less than the corresponding close four bars earlier
The basic DeMark SELL-SETUP consists of the following:
Prerequisite is a bullish price-flip, which indicates a switch from negative to positive momentum. This is when the close today is greater than the close 4 days ago, but the close yesterday was lower than the close 4 days before that.
After a bullish price-flip, there must be at least nine consecutive closes, each one more than the corresponding close four bars earlier.
The number of consecutive closes that are more than the corresponding close 4 bars earlier are shown by green numbers on the top of each bar
Cancellation - If at any point a bar closes lower than the close four bars earlier (a bearish price flip) the setup is canceled and we are waiting for another bullish price-flip
SELL Signal occurs when there is a cancellation after at least eleven consecutive closes, each one more than the corresponding close four bars earlier
After a setup reaches its optimal threshold count values (9 for BUYS or 12 for SELLS), a market reaction in opposite direction has a higher probability during the next 1-5 bars. Note that a setup does not guarantee a reaction in the opposite direction-for instance, if momentum is too strong in the trend direction, a reaction may be muted. A sideways move or continuation of the trend following a setup indicates a weaker setup. In general therefore, the higher the set-up count achieved the higher the probability of success. This is why it is good to employ strong risk management when trading setups (i.e. stops.)
Whilst the indicator has good success at warning of market trough reversals, it is remarkable for its ability to warn of market tops - something most indicators struggle to do. Market top warnings are therefore the strongest aspect of this indicator.

JSE DeMark Setup Analysis
© 2 0 1 4 , P o w e r S t o c k s R e s e a r c h – J S E D e M a r k S e t u p A n a l y s i s V 1 . 0
Page 3
C. THE CHART The TD-SETUP chart is displayed in CHARTS>JBAR>TDS. The chart is live intraday, with a 15-minute delay which means the last candle on the right of the chart together with the respective BUY or SELL setup counter is updated whenever you open the page or refresh it. There is a CANCEL orange line displayed through the last 5 candles. This is bullish or bearish price flip threshold that will cancel the current setup phase.
If you are in a BUY setup then this line shows you where todays candle must close above in order to constitute a bullish price flip. If the count is less than 9 then this cancels the BUY setup and we enter a new SELL setup. If the count is however greater than or equal to 9 then this is your BUY signal.
If you are in a SELL setup then this line shows you where todays candle must close below in order to constitute a bearish price flip. If the count is less than 11 then this cancels the SELL setup and we enter a new BUY setup. If the count is however greater than or equal to 11 then this is your SELL signal.
The chart also displays a green "Probability of reversal" line which uses the respective setup counts and their 20-year historical frequency distribution to estimate probability of direction changes. Obviously the higher the setup count when you observe a completion signal, the more the probability of a turnaround in the market, since the more likely you are observing an "outlier event". If we witness a BUY setup count of 18 then the calculation observes that the count has never gone higher than 18 in 20 years, so we can assume we have a 100% probability of a reversal. Similarly, if we witness a SELL setup count of 18 and sell setup-counts larger than 18 have only occurred 2% of the time, we can assume the probability of a reversal is 98%. BUY or SELL signals are shown on the bottom of the chart, in line with the candle that generated the signal.
This is just a basic summary of a DeMark setup. Not all valid opportunities are identified by DeMark setup analysis and therefore for more effective use, be sure to combine your full arsenal of technical indicators/analysis. For example on SELL signals, confer with the STL chart, and on BUY signals, confer with your TF4 chart.

JSE DeMark Setup Analysis
© 2 0 1 4 , P o w e r S t o c k s R e s e a r c h – J S E D e M a r k S e t u p A n a l y s i s V 1 . 0
Page 4
The chart below shows an intraday snapshot of the TDS chart which was in a BUY-SETUP counting phase. We were on 7 consecutive days where each day closed lower then the 4 days prior. The last price bar is currently showing a close above the orange CANCEL line meaning that if we were to assume the JSE closed at this moment in time, the BUY-SETUP would be cancelled since the countdown had not yet reached nine. The last candle shows a green “1” indicating we had a bullish price-flip and were entering a SELL-SETUP counting phase.
The above chart is an INTRADAY snapshot (15min delayed) as shown by the blue time stamp and there is a possibility the JSE reverses her gains for the day and actually closes below the orange line meaning the BUY-SETUP would remain in force. It’s therefore best to wait until near the market close to make BUY or SELL assumptions.
D. THE CHART ALERTS The TD-SETUP chart has 4 alerts you can configure in the PowerALERT settings:
JSE DeMark Setup Analysis
© 2 0 1 4 , P o w e r S t o c k s R e s e a r c h – J S E D e M a r k S e t u p A n a l y s i s V 1 . 0
Page 5
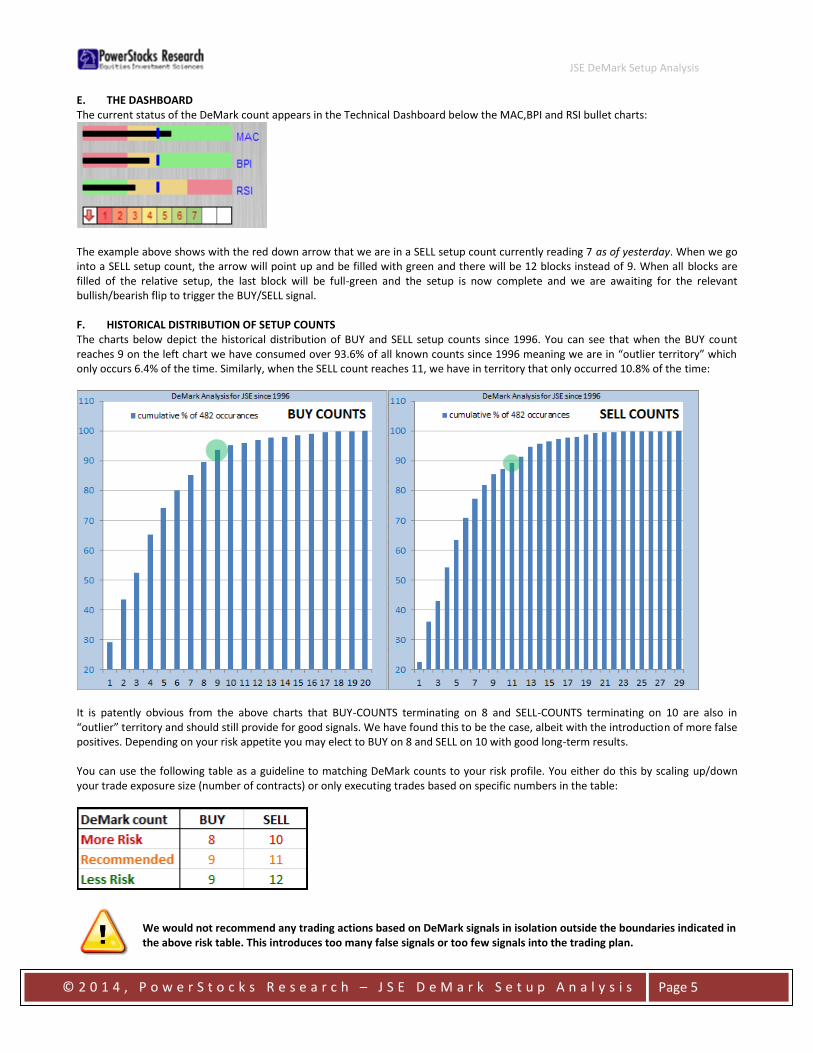
E. THE DASHBOARD The current status of the DeMark count appears in the Technical Dashboard below the MAC,BPI and RSI bullet charts:
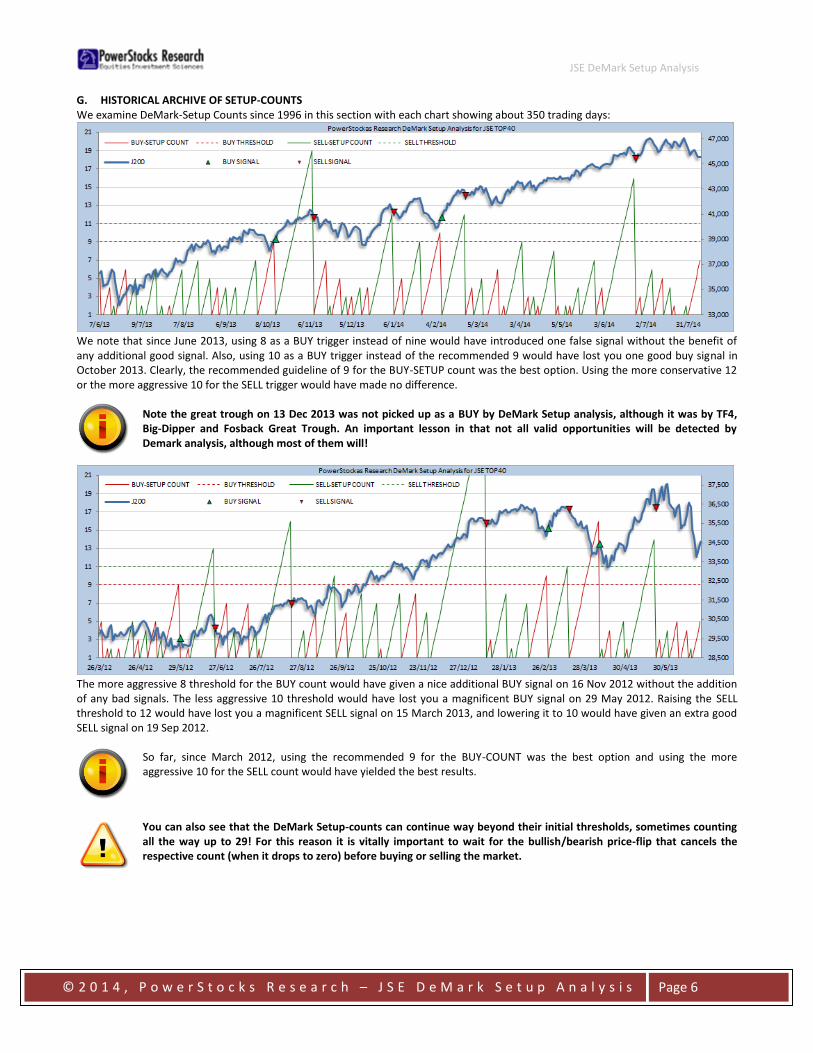
The example above shows with the red down arrow that we are in a SELL setup count currently reading 7 as of yesterday. When we go into a SELL setup count, the arrow will point up and be filled with green and there will be 12 blocks instead of 9. When all blocks are filled of the relative setup, the last block will be full-green and the setup is now complete and we are awaiting for the relevant bullish/bearish flip to trigger the BUY/SELL signal. F. HISTORICAL DISTRIBUTION OF SETUP COUNTS The charts below depict the historical distribution of BUY and SELL setup counts since 1996. You can see that when the BUY count reaches 9 on the left chart we have consumed over 93.6% of all known counts since 1996 meaning we are in “outlier territory” which only occurs 6.4% of the time. Similarly, when the SELL count reaches 11, we have in territory that only occurred 10.8% of the time:
It is patently obvious from the above charts that BUY-COUNTS terminating on 8 and SELL-COUNTS terminating on 10 are also in “outlier” territory and should still provide for good signals. We have found this to be the case, albeit with the introduction of more false positives. Depending on your risk appetite you may elect to BUY on 8 and SELL on 10 with good long-term results. You can use the following table as a guideline to matching DeMark counts to your risk profile. You either do this by scaling up/down your trade exposure size (number of contracts) or only executing trades based on specific numbers in the table:
We would not recommend any trading actions based on DeMark signals in isolation outside the boundaries indicated in the above risk table. This introduces too many false signals or too few signals into the trading plan.
JSE DeMark Setup Analysis
© 2 0 1 4 , P o w e r S t o c k s R e s e a r c h – J S E D e M a r k S e t u p A n a l y s i s V 1 . 0
Page 6
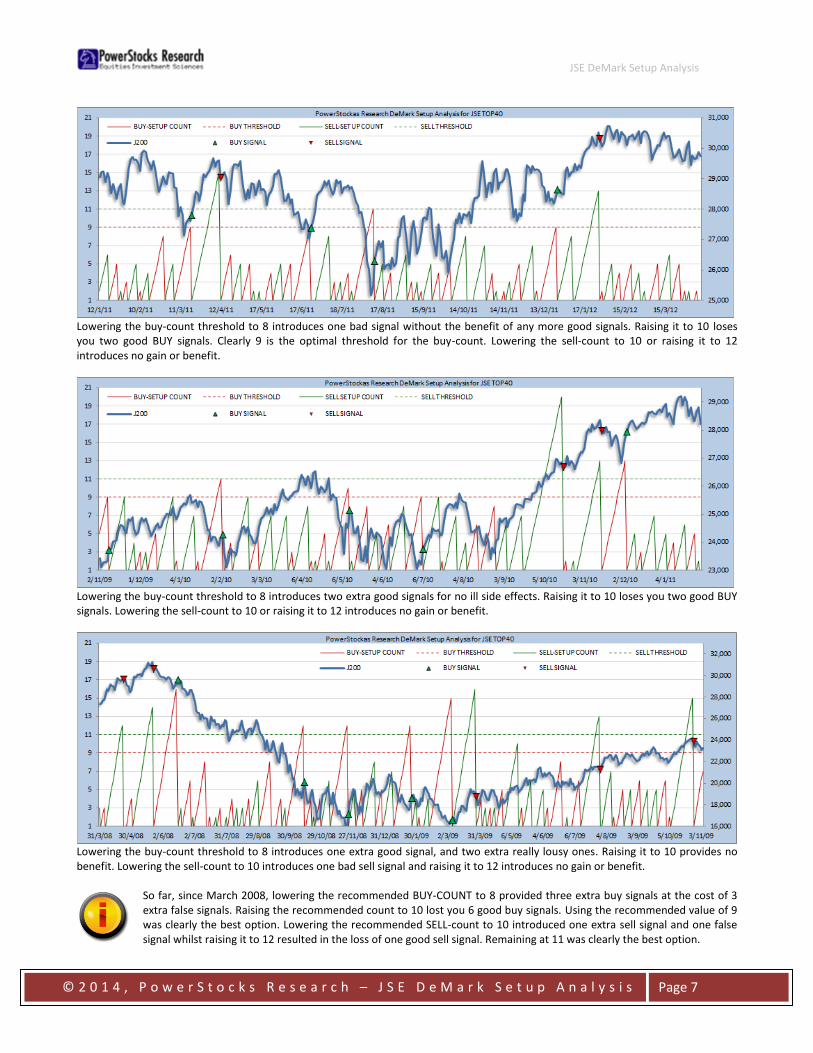
G. HISTORICAL ARCHIVE OF SETUP-COUNTS We examine DeMark-Setup Counts since 1996 in this section with each chart showing about 350 trading days:
We note that since June 2013, using 8 as a BUY trigger instead of nine would have introduced one false signal without the benefit of any additional good signal. Also, using 10 as a BUY trigger instead of the recommended 9 would have lost you one good buy signal in October 2013. Clearly, the recommended guideline of 9 for the BUY-SETUP count was the best option. Using the more conservative 12 or the more aggressive 10 for the SELL trigger would have made no difference.
Note the great trough on 13 Dec 2013 was not picked up as a BUY by DeMark Setup analysis, although it was by TF4, Big-Dipper and Fosback Great Trough. An important lesson in that not all valid opportunities will be detected by Demark analysis, although most of them will!
The more aggressive 8 threshold for the BUY count would have given a nice additional BUY signal on 16 Nov 2012 without the addition of any bad signals. The less aggressive 10 threshold would have lost you a magnificent BUY signal on 29 May 2012. Raising the SELL threshold to 12 would have lost you a magnificent SELL signal on 15 March 2013, and lowering it to 10 would have given an extra good SELL signal on 19 Sep 2012.
So far, since March 2012, using the recommended 9 for the BUY-COUNT was the best option and using the more aggressive 10 for the SELL count would have yielded the best results.
You can also see that the DeMark Setup-counts can continue way beyond their initial thresholds, sometimes counting all the way up to 29! For this reason it is vitally important to wait for the bullish/bearish price-flip that cancels the respective count (when it drops to zero) before buying or selling the market.
JSE DeMark Setup Analysis
© 2 0 1 4 , P o w e r S t o c k s R e s e a r c h – J S E D e M a r k S e t u p A n a l y s i s V 1 . 0
Page 7
Lowering the buy-count threshold to 8 introduces one bad signal without the benefit of any more good signals. Raising it to 10 loses you two good BUY signals. Clearly 9 is the optimal threshold for the buy-count. Lowering the sell-count to 10 or raising it to 12 introduces no gain or benefit.
Lowering the buy-count threshold to 8 introduces two extra good signals for no ill side effects. Raising it to 10 loses you two good BUY signals. Lowering the sell-count to 10 or raising it to 12 introduces no gain or benefit.
Lowering the buy-count threshold to 8 introduces one extra good signal, and two extra really lousy ones. Raising it to 10 provides no benefit. Lowering the sell-count to 10 introduces one bad sell signal and raising it to 12 introduces no gain or benefit.
So far, since March 2008, lowering the recommended BUY-COUNT to 8 provided three extra buy signals at the cost of 3 extra false signals. Raising the recommended count to 10 lost you 6 good buy signals. Using the recommended value of 9 was clearly the best option. Lowering the recommended SELL-count to 10 introduced one extra sell signal and one false signal whilst raising it to 12 resulted in the loss of one good sell signal. Remaining at 11 was clearly the best option.

JSE DeMark Setup Analysis
© 2 0 1 4 , P o w e r S t o c k s R e s e a r c h – J S E D e M a r k S e t u p A n a l y s i s V 1 . 0
Page 8
JSE DeMark Setup Analysis
© 2 0 1 4 , P o w e r S t o c k s R e s e a r c h – J S E D e M a r k S e t u p A n a l y s i s V 1 . 0
Page 9

JSE DeMark Setup Analysis
© 2 0 1 4 , P o w e r S t o c k s R e s e a r c h – J S E D e M a r k S e t u p A n a l y s i s V 1 . 0
Page 10
H. THE DEMARK BUY SUMMATION Whilst the charts above show that the BUY-SETUP offers respectable trough signals, we observed an Achilles-heel for the BUY-SETUP indicator. On many occasions a JSE correction would ensue with the BUY-SETUP count rising accordingly. Then for 1 or 2 or even up to 3 occasions in the correction, we would observe a bullish price flip (JSE closes higher than 4 days prior) which would then reset the BUY-SETUP count to zero. These short-lived rallies in an ongoing correction would result in the correction eventually bottoming out with a BUY-SETUP count registering less than the required 9 and we would fail to generate a buy signal on what was otherwise a rather respectable correction. A classic example of this problem appears below, but using the SP-500 as the example where we use a threshold of +8 for the buy-trigger instead of the +9 we use on the JSE:
To counter this problem, we found that a summation of BUY setups as opposed to a sequential count, worked rather well. In this instance we are counting the frequency of occurrences when the SP-500 is less than 4 days prior as opposed to the number of uninterrupted such occurrences:
The summation method DOES NOT replace the standard DeMark BUY-Setup method. When you witness a standard DeMark BUY signal, when we have a bullish flip when the BUY Setup count is 9 or more, this should still be acted upon first as this is the highest-confidence trough detection method of the two. The only reason we have the Summation method to complement it is that the standard method, due to its cautious nature, may miss some very attractive opportunities. For this reason, we categorize our DeMark BUY signals as follows, in order of highest confidence first:
Class-A BUY : Bullish flip when Setup-count >=9
Class-B BUY : Summation drops below 9

JSE DeMark Setup Analysis
© 2 0 1 4 , P o w e r S t o c k s R e s e a r c h – J S E D e M a r k S e t u p A n a l y s i s V 1 . 0
Page 11
The BUY Summation appears as a thin solid blue line in the TDS chart, together with its +9 threshold (blue horizontal dotted line) as shown in the illustration below:
This is a classic rendition of the Summation in action. A correction ensues on 3 June 2013 with the BUY-Setup count rising to 5 only to be reset with a bullish flip on the 10 June. The flip is short-lived and the correction ensues until 17 June where we have another short-lived bullish flip resetting the BUY setup count which only reached 4 this time. However, despite a setup count of only 4, the summation has reached the required threshold of 9 meaning that as far as the Summation method is concerned, it is “Game on”. After the “dead cat bounce” on the 17th, the correction resumes with the BUY-setup count reaching only 6 before the next bullish flip which marked the end of the correction. A massive long term rally ensued but using the original buy-setup count method we would have MISSED the trough reversal signal since the count only reached +6. However on 1 July the summation dropped below +9 triggering a Class-B BUY alert as flagged in blue at the bottom of the chart. There are also two SMS/Email PowerALERTS you can configure regarding the Demark BUY Summation as shown below:
JSE DeMark Setup Analysis
© 2 0 1 4 , P o w e r S t o c k s R e s e a r c h – J S E D e M a r k S e t u p A n a l y s i s V 1 . 0
Page 12
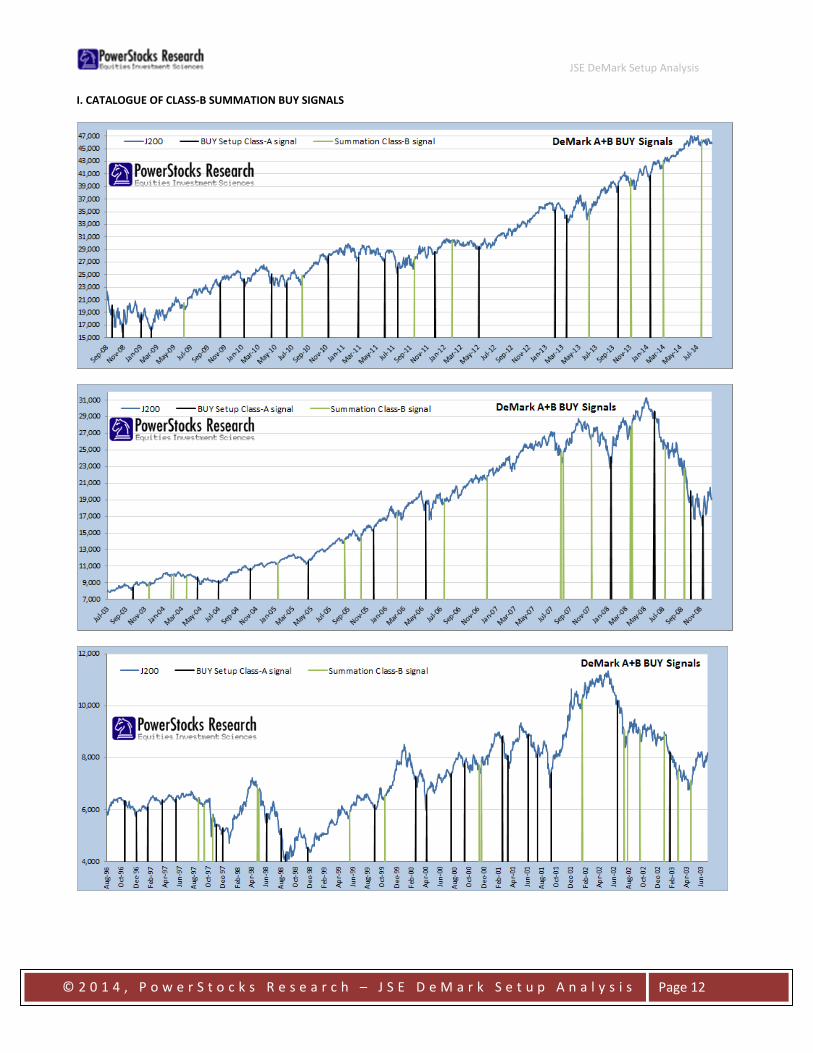
I. CATALOGUE OF CLASS-B SUMMATION BUY SIGNALS