modied fuzzy logic method for materials selection in
TRANSCRIPT
Modi�ed Fuzzy Logic Method for MaterialsSelection in Mechanical Engineering DesignMostafa Sharifan
Sharif University of TechnologyAli Abedian ( [email protected] )
Sharif University of Technology https://orcid.org/0000-0003-4724-7433Pardis Razaghian
Sharif University of Technology
Research Article
Keywords: Fuzzy logic, Multi-criteria decision making, Materials selection, Materials Indices
Posted Date: October 21st, 2021
DOI: https://doi.org/10.21203/rs.3.rs-892307/v1
License: This work is licensed under a Creative Commons Attribution 4.0 International License. Read Full License

1
Title:
Modified fuzzy logic method for materials selection in mechanical
engineering design
Authors:
Mostafa Sharifan (First Author)
Affiliation: Department of Aerospace Engineering, Sharif University of Technology, Tehran, Iran
Email: [email protected]
Ali Abedian (Corresponding Author)
Affiliation: Department of Aerospace Engineering, Sharif University of Technology, Tehran, Iran
Email: [email protected]
Pardis Razaghian
Affiliation: Department of Aerospace Engineering, Sharif University of Technology, Tehran, Iran
Email: [email protected]
2
Abstract:
Materials selection is one of the primary steps in designing products, including mechanical
ones. As a result, researchers are continuously developing simple, accurate, and feasible
techniques to enhance the performance of the designed component by selecting the optimum
materials from a wide variety of candidate materials. In this research work, a modified fuzzy
approach referred to as Modified Fuzzy Logic Method (MFLM) is proposed to provide some
highly appreciated advantages besides resolving some of the substantial shortcomings of the
existing solutions. Customizing the method based on the designer’s knowledge and level of
expertise, simultaneous consideration of qualitative and quantitative properties, and high
accuracy in the ranking of candidate materials are some of the significant benefits of MFLM in
comparison to the available alternative methods. While, complexity, high volume
computational efforts, and more are amongst the resolved drawbacks. Moreover, the
produced results show the power and simplicity of the technique in solving complex problems
like materials selection for a gas turbine blade which involves a high range working
temperature.
Keywords:
Fuzzy logic, Multi-criteria decision making, Materials selection, Materials Indices
3
1 Introduction
Multi-Criteria Decision-Making (MCDM) problems are frequent in human beings’ daily life.
Engineers also deal with these problems and consistently seek to find the optimum choices in
different stages of the design cycle. In the meantime, materials selection is one of the most
challenging steps, owing to the fact that a wide range of materials available coupled with
various and sometimes hard-to-process criteria make it even more demanding. During the past
decades, researchers have proposed several strategies for materials selection to face the
difficulties. Ashby [1–4] by utilizing materials selection charts as well as multi-objective
optimization method, and Farag [5] and Manshdi [6] by introducing weighted property method
(WPM) and modified digital logic (MDL), respectively, are amongst the pioneers who tried to
simplify the procedure of materials selection.
Furthermore, Shanian [7] has proposed the TOPSIS method, a simple and recognized technique
by active researchers in this field. Analytical hierarchy process [8] (AHP) is also another admired
approach. Among newfound methods, Electre [9] by pairwise comparison of candidate
materials, Z-transformation [10] by using statistical operators, and Jahan’s technique [11] by
applying ordinal data strived to enhance the procedure of materials selection. Moreover, many
of the criteria weighting techniques [12–14] have provided subjective and objective weighting
coefficients for different attributes.
In more recent attempts, due to advancements in computing techniques, several researchers
have investigated the use of relevant Machine Learning (ML) methods to assist the
manufacturing process by adopting the most suitable materials for the assumed applications
according to their properties and in-service operation. Under this focus, both supervised and
unsupervised learning models can perform classifications and regressions on materials data
[15–19]. These computing systems are robust in learning complex non-linear functions and

4
extracting information from large datasets; nevertheless, they require preliminary training and
can be computationally demanding. Also, hyperparameters tuning is an inevitable and
challenging part of applying any ML algorithm.
To be noted, as another related direction, some researchers have developed various strategies
for multi-material (hybrid) design of components to select the proper materials for their
intended functions [20–24]. These systems endeavor to select the discrete variables (i.e.,
material types) and optimize the continuous parameters like components’ geometry to
simultaneously achieve multiple objectives, such as satisfying structural performance, low cost,
and lightweight. Solving such multi-objective optimization (MOO) problems is challenging due
to the presence of various variables and goals, as well as highly nonlinear constraints [25].
Therefore, some recent works have employed metaheuristic (nature-inspired) optimization
approaches like Genetic Algorithms [25, 26], Simulated Annealing [26], and Bat Algorithm [27]
to find the ideal solutions based on the presumed constraints and defined objective functions.
These algorithms are proven to be powerful in minimizing the cost functions and detecting
global optima [28, 29]; however, when more than one objective is targeted, metaheuristic
approaches should be supported with a multi-criteria decision analysis approach. MCDM
methods provide a systematic trade-off between the assumed targets, and help one form
proper objective functions. As an instance, Zhang [25] applied the well-known TOPSIS decision-
making technique [7] to optimize concrete mixture proportions based on metaheuristic and ML
algorithms.
The above-said MCDM methodologies work well when reliable, accurate, and adequate
numerical data is at hand, an assumption that is not well-fitted with the vague and uncertain
nature of materials selection problems. Data acquisition can become a time-consuming,
expensive, and sometimes infeasible task. Accordingly, many material attributes are described
either with ranges of numbers rather than precise amounts or with linguistic terms. With this in
mind, also add the fact that variations in the working environments of components can cause
the properties of their constituent materials to change. In this sense, having a concrete way of
modeling uncertainties can ease the decision-making process and enhance the reliability of
5
outputs. The fuzzy logic concept [30], which provides us with the formal principles of
approximate reasoning, has been widely used for materials selection in the past two decades.
Rao [31] employed Graph theory in the fuzzy space. Sarfaraz [32] utilized fuzzy membership
functions and tried to select the optimum materials based on defined IF-THEN rules. Moreover,
Babu [33] proposed a similar work using the Grey relational analysis concept in the fuzzy
environment. However, the high complexity of these methods in defining IF-THEN rules
prevents their extensive application. Some researchers have also tried to implement
conventional numerical methods in the fuzzy scope. Rathod [34] and Mayyas [35] separately
modified the TOPSIS technique to apply it in the fuzzy environment, taking into account the
fuzzy membership functions for materials properties and the weighting coefficients of the
criteria, as well as using a few simple operators. Reddy [36] also ranked the materials by
presenting a TOPSIS-based framework in the fuzzy space while considering a combination of
subjective and objective weighting values for the criteria. Gul [37] implemented the Promethee
method in the fuzzy space by defining a set of operators for trapezoidal membership functions.
Applying the mentioned approaches is not recommended while only dealing with measurable
attributes because the fuzzy functions cannot correctly differentiate the properties of the
materials. Consequently, the accuracy of the ranking system deteriorates.
Efforts have not been limited to employing conventional approaches in the fuzzy environment;
some researchers strived to introduce the principles of axiomatic design (i.e., independence
and information axioms) to the field of multi-attribute decision-making based on vague and
uncertain data. Kulak [38] developed a Fuzzy multi-attribute selection approach by combining
the concept of axiomatic design with the analytic hierarchy process [8]. Cieck [39] modified the
fuzzy axiomatic design-model selection interface (FAD-MSI) [40] to make it compliance with the
nature of the materials selection scheme. Khandekar [41] also offered an axiomatic design-
based approach considering triangular fuzzy membership functions for the design ratings,
materials properties, and weighting coefficients of attributes. However, in many cases, the
fuzzy membership functions of the design ratings stand far from the functions of materials
properties, and the proper evaluation cannot be obtained.
6
In the following, an easily programed fuzzy logic-based method for materials selection is
proposed to remove the aforesaid drawbacks and reduce the computational efforts. Also, the
capabilities of the method are examined using common problems in mechanical engineering
design.
2 Method description
MFLM falls under the weighted property category of materials selection methodologies [5]. It
means that it is a form of criteria weighting technique combined with a ranking system that
usually converts crisp data into normalized values. In the following, the step-by-step procedure
of the MFLM is explained.
2.1 Step 1: Parametric study of the problem to specify the constraints and
performance requirements of the component
In materials selection schemes, choosing either materials properties or materials indices is the
first move of the process. In mechanical cases where extraction of materials indices is
applicable, authors prefer to employ them, as long as the correlations between indices are
considered in the criteria weighting process (see reference [14]). However, in many other
applications, such as resin selection for a mechanical composite part, it is not pragmatic to
practice materials indices. Therefore, materials properties can be considered for these types of
applications. Of Note, in the proposed method, there are no limits in choosing either of the said
criteria; thus, the decision-maker can use any of them based on conditions of the problem and
availability of the required information. Materials properties or indices are assumed either
beneficial or cost, meaning that their higher or lower values are more favorable for the
application, respectively.
7
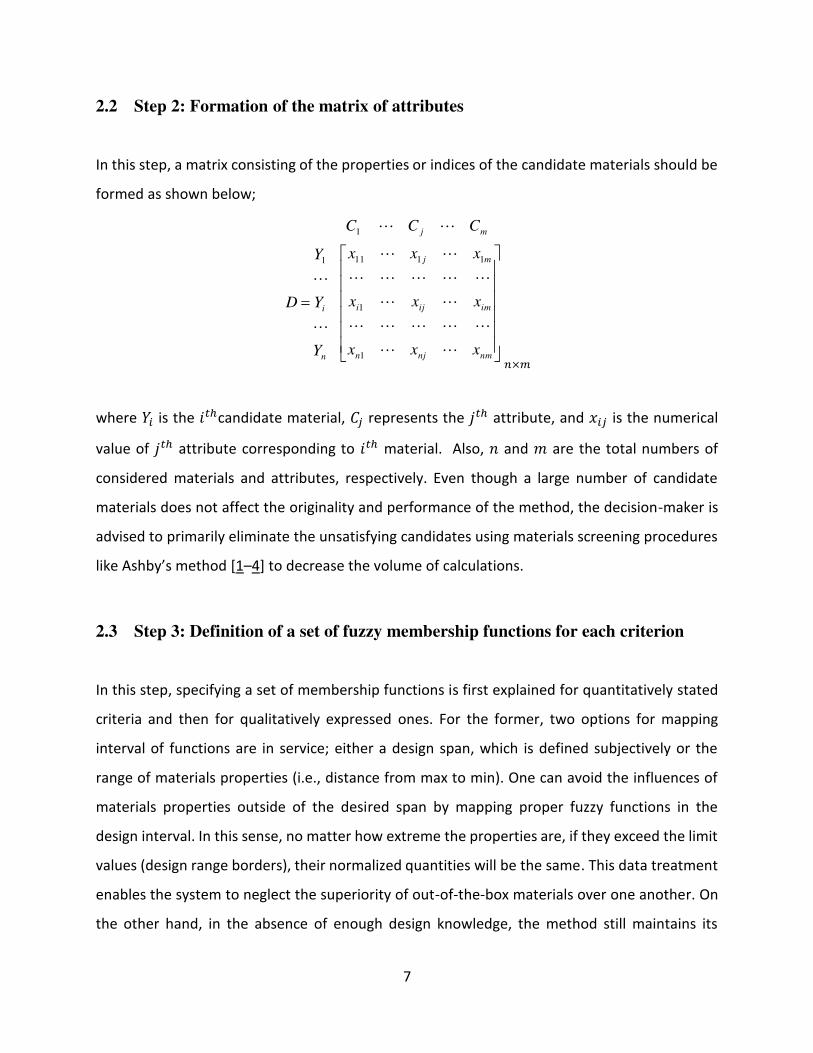
2.2 Step 2: Formation of the matrix of attributes
In this step, a matrix consisting of the properties or indices of the candidate materials should be
formed as shown below;
nmnjn
imiji
mj
n
i
mj
xxx
xxx
xxx
Y
Y
Y
D
CCC
1
1
11111
1
𝑛×𝑚
where 𝑌𝑖 is the 𝑖𝑡ℎcandidate material, 𝐶𝑗 represents the 𝑗𝑡ℎ attribute, and 𝑥𝑖𝑗 is the numerical
value of 𝑗𝑡ℎ attribute corresponding to 𝑖𝑡ℎ material. Also, 𝑛 and 𝑚 are the total numbers of
considered materials and attributes, respectively. Even though a large number of candidate
materials does not affect the originality and performance of the method, the decision-maker is
advised to primarily eliminate the unsatisfying candidates using materials screening procedures
like Ashby’s method [1–4] to decrease the volume of calculations.
2.3 Step 3: Definition of a set of fuzzy membership functions for each criterion
In this step, specifying a set of membership functions is first explained for quantitatively stated
criteria and then for qualitatively expressed ones. For the former, two options for mapping
interval of functions are in service; either a design span, which is defined subjectively or the
range of materials properties (i.e., distance from max to min). One can avoid the influences of
materials properties outside of the desired span by mapping proper fuzzy functions in the
design interval. In this sense, no matter how extreme the properties are, if they exceed the limit
values (design range borders), their normalized quantities will be the same. This data treatment
enables the system to neglect the superiority of out-of-the-box materials over one another. On
the other hand, in the absence of enough design knowledge, the method still maintains its
8
efficiency, and sets of functions can be in the distance from maximum to minimum of materials
properties. A linguistic term is also assigned to each membership function that shows the
assumed qualitative perspective.
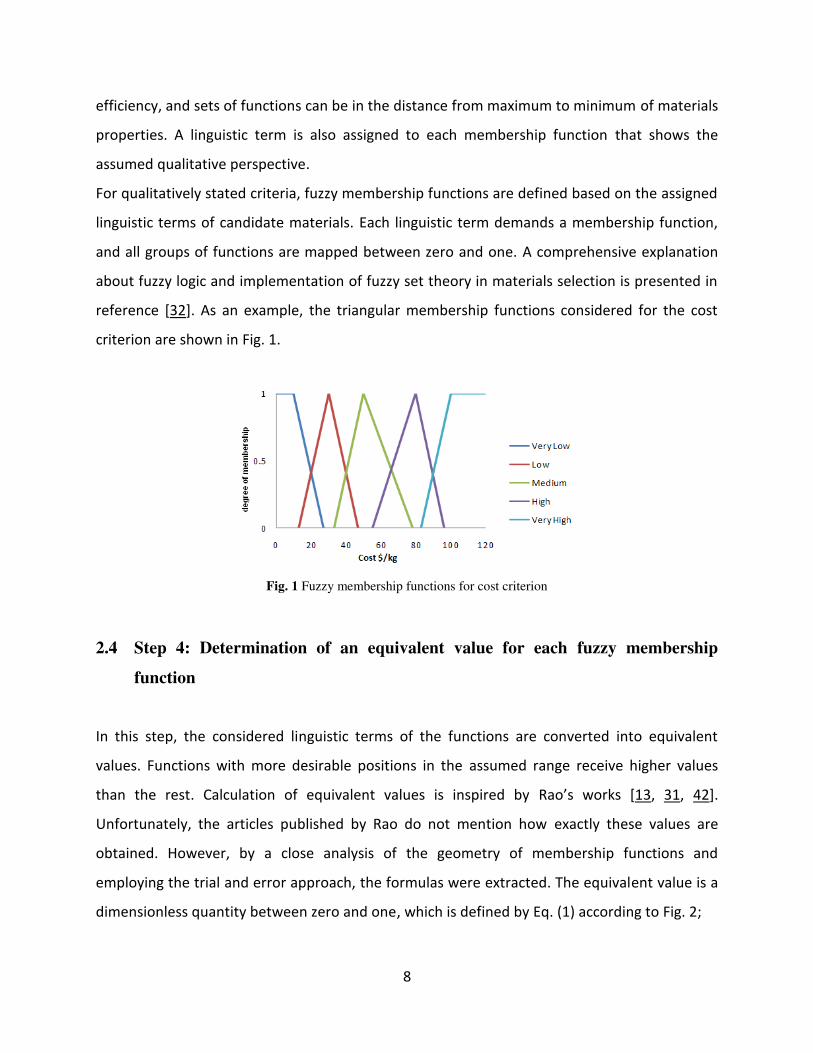
For qualitatively stated criteria, fuzzy membership functions are defined based on the assigned
linguistic terms of candidate materials. Each linguistic term demands a membership function,
and all groups of functions are mapped between zero and one. A comprehensive explanation
about fuzzy logic and implementation of fuzzy set theory in materials selection is presented in
reference [32]. As an example, the triangular membership functions considered for the cost
criterion are shown in Fig. 1.
Fig. 1 Fuzzy membership functions for cost criterion
2.4 Step 4: Determination of an equivalent value for each fuzzy membership
function
In this step, the considered linguistic terms of the functions are converted into equivalent
values. Functions with more desirable positions in the assumed range receive higher values
than the rest. Calculation of equivalent values is inspired by Rao’s works [13, 31, 42].
Unfortunately, the articles published by Rao do not mention how exactly these values are
obtained. However, by a close analysis of the geometry of membership functions and
employing the trial and error approach, the formulas were extracted. The equivalent value is a
dimensionless quantity between zero and one, which is defined by Eq. (1) according to Fig. 2;

9
(1) {𝑈𝑓𝑖 = 1 + (𝑍𝑀𝑖 − 𝑍𝐺𝑖)2 for beneficial criteria𝑈𝑓𝑖 = 1 − (𝑍𝑀𝑖 − 𝑍𝐺𝑖)2 for cost criteria where 𝑈𝑓𝑖 is the equivalent value and 𝑍𝑀𝑖 and 𝑍𝐺𝑖 depend on the geometrical status of the
membership function. 𝑍𝑀𝑖 and 𝑍𝐺𝑖 are the measuring tools for the right and left branches of a
triangular function and help the designer to identify the location of a membership function in
the defined scope and assign a numerical value to each one. To elaborate on Eq. (1), consider
shifting the membership function in Fig. 2 to the right side of the design span. As it goes further, 𝑍𝑀𝑖 increases and 𝑍𝐺𝑖 decreases, meaning that the equivalent value for a function
corresponding to a beneficial criterion rises. In other words, for a beneficial criterion, as a
membership function approaches the maximum value of the design range (𝑥𝑚𝑎𝑥), its equivalent
value increases. Eventually, if the decision-maker considers an “exactly equal to” type function,
in which 𝑎𝑖, 𝑏𝑖, and 𝑐𝑖 happen to be equal to the value of 𝑥𝑚𝑎𝑥, the equivalent value for that
function would be one which is the maximum number that a function can receive. Note that
vice versa of the above applies to cost criterion functions.
Fig. 2 Calculation of equivalent values for membership functions
This value should be calculated for all membership functions. For triangular functions, the
values of 𝑍𝑀𝑖 and 𝑍𝐺𝑖 are calculated using Eq. (2);

10
(2)
𝑍𝑀𝑖 = (𝑐𝑖 − 𝑥𝑚𝑖𝑛)((𝑥𝑚𝑎𝑥 − 𝑥𝑚𝑖𝑛) − (𝑏𝑖 − 𝑐𝑖))
𝑍𝐺𝑖 = (𝑥𝑚𝑎𝑥 − 𝑎𝑖)((𝑥𝑚𝑎𝑥 − 𝑥𝑚𝑖𝑛) + (𝑏𝑖 − 𝑎𝑖))
𝑥𝑚𝑖𝑛 and 𝑥𝑚𝑎𝑥 determine the presumed scope; while, 𝑎𝑖, 𝑏𝑖, and 𝑐𝑖 fully identify the position of
the function, and all of them are geometrically shown in Fig. 2. Eq. (2) is obtained by calculating
the intersection values of the function and its crossing lines.
2.5 Step 5: Normalizing the attributes matrix [D] using fuzzy membership
functions and their equivalent values
Given the matrix of attributes [D] and sets of membership functions as input data, the
normalized values of candidate materials for different criteria can be calculated. For example,
assuming 𝑥𝑖𝑗 is the cost of 𝑖𝑡ℎ material. The normalized value of 𝑥𝑖𝑗 is calculated based on Eq.
(3) and Fig. 3:
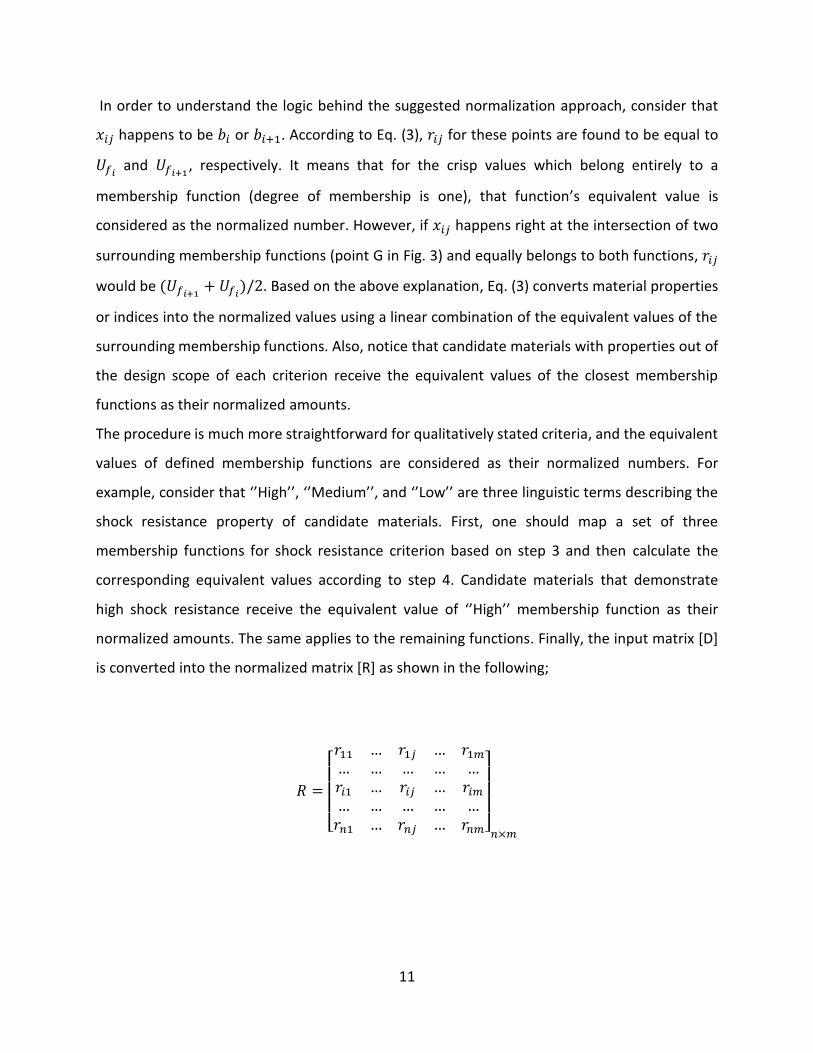
𝑟𝑖𝑗 = 12 [(𝑓𝑖+1(𝑥𝑖𝑗) − 𝑓𝑖(𝑥𝑖𝑗)) × (𝑈𝑓𝑖+1− 𝑈𝑓𝑖)(1 − min (𝑓𝑖+1(𝑥𝑖𝑗), 𝑓𝑖(𝑥𝑖𝑗))) + (𝑈𝑓𝑖+1 + 𝑈𝑓𝑖)] , 𝑏𝑖 ≤ 𝑥𝑖𝑗 ≤ 𝑏𝑖+1 (3)
Fig. 3 Normalizing the crisp data of candidate materials
11
In order to understand the logic behind the suggested normalization approach, consider that 𝑥𝑖𝑗 happens to be 𝑏𝑖 or 𝑏𝑖+1. According to Eq. (3), 𝑟𝑖𝑗 for these points are found to be equal to 𝑈𝑓𝑖 and 𝑈𝑓𝑖+1, respectively. It means that for the crisp values which belong entirely to a
membership function (degree of membership is one), that function’s equivalent value is
considered as the normalized number. However, if 𝑥𝑖𝑗 happens right at the intersection of two
surrounding membership functions (point G in Fig. 3) and equally belongs to both functions, 𝑟𝑖𝑗
would be (𝑈𝑓𝑖+1 + 𝑈𝑓𝑖)/2. Based on the above explanation, Eq. (3) converts material properties
or indices into the normalized values using a linear combination of the equivalent values of the
surrounding membership functions. Also, notice that candidate materials with properties out of
the design scope of each criterion receive the equivalent values of the closest membership
functions as their normalized amounts.
The procedure is much more straightforward for qualitatively stated criteria, and the equivalent
values of defined membership functions are considered as their normalized numbers. For
example, consider that ‘’High’’, ‘’Medium’’, and ‘’Low’’ are three linguistic terms describing the
shock resistance property of candidate materials. First, one should map a set of three
membership functions for shock resistance criterion based on step 3 and then calculate the
corresponding equivalent values according to step 4. Candidate materials that demonstrate
high shock resistance receive the equivalent value of ‘’High’’ membership function as their
normalized amounts. The same applies to the remaining functions. Finally, the input matrix [D]
is converted into the normalized matrix [R] as shown in the following;
𝑅 = [ 𝑟11 … 𝑟1𝑗 … 𝑟1𝑚… … … … …𝑟𝑖1 … 𝑟𝑖𝑗 … 𝑟𝑖𝑚… … … … …𝑟𝑛1 … 𝑟𝑛𝑗 … 𝑟𝑛𝑚]
𝑛×𝑚
12
2.6 Step 6: Calculation of the weighting vector
In this step, a coefficient between zero and one is assigned to each criterion which shows the
importance of attributes in satisfying the desired purposes of the application. These values can
be obtained utilizing objective, subjective, or integrated weighting methods [12–14]. In the
present research work, MDL [6] is applied to calculate the weighting coefficients. The weighting
vector would be as follows:
][ 21 mj wwww W𝑇𝑚×1
where 𝑚 is the number of criteria.
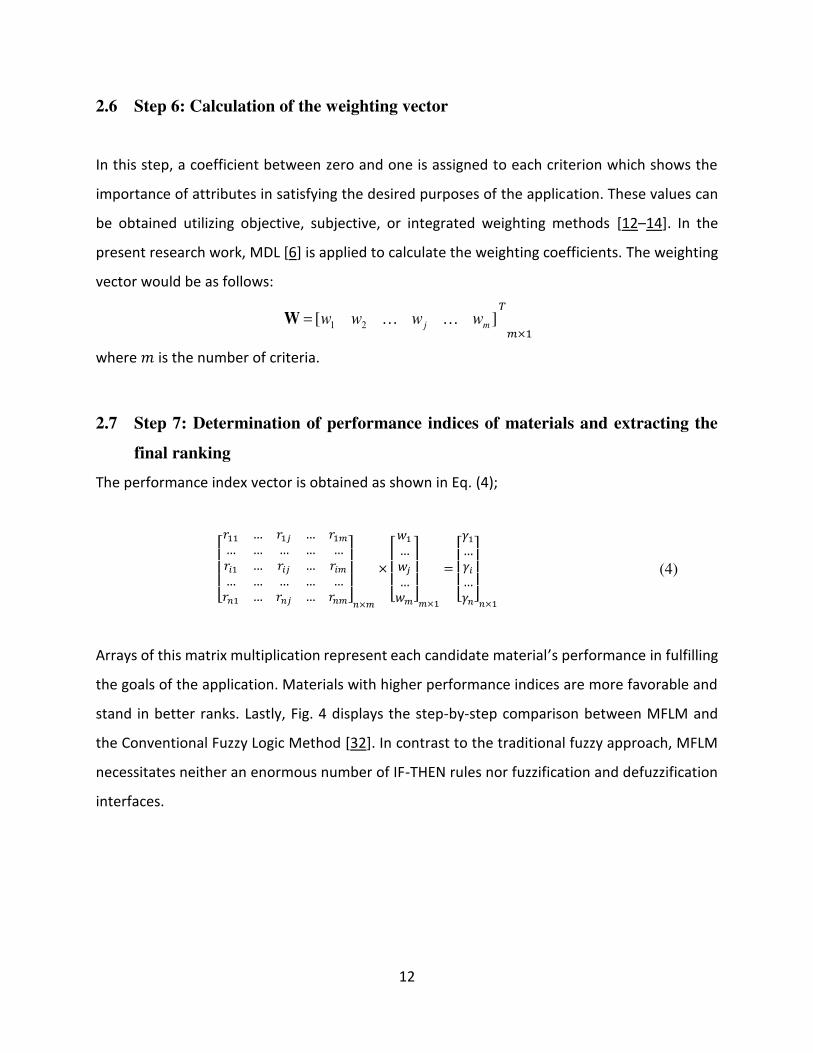
2.7 Step 7: Determination of performance indices of materials and extracting the
final ranking
The performance index vector is obtained as shown in Eq. (4);
[ 𝑟11 … 𝑟1𝑗 … 𝑟1𝑚… … … … …𝑟𝑖1 … 𝑟𝑖𝑗 … 𝑟𝑖𝑚… … … … …𝑟𝑛1 … 𝑟𝑛𝑗 … 𝑟𝑛𝑚]
𝑛×𝑚
× [ 𝑤1…𝑤𝑗…𝑤𝑚]
𝑚×1
= [ 𝛾1…𝛾𝑖…𝛾𝑛]
𝑛×1
(4)
Arrays of this matrix multiplication represent each candidate material’s performance in fulfilling
the goals of the application. Materials with higher performance indices are more favorable and
stand in better ranks. Lastly, Fig. 4 displays the step-by-step comparison between MFLM and
the Conventional Fuzzy Logic Method [32]. In contrast to the traditional fuzzy approach, MFLM
necessitates neither an enormous number of IF-THEN rules nor fuzzification and defuzzification
interfaces.

13
Parametric Study of the
Problem to Specify the
Constraints & Performance
Requirements
Step 1
Definition of a Set of Fuzzy
Functions for each Criterion
Step 3
Determination of an Equivalent
Value for each Membership
Function
Step 4
Extraction of Materials
Properties or Indices &
Formation of Attribute Matrix
Step 2
Normalizing the Attribute
Matrix Using Fuzzy Membership
Function & their Equivalent
Values
Step 5
Calculation of the Weighting
Vector
Step 6
Computation of Performance
Indices of Materials & Extracting
the Final Ranking
Step 7
Definition of Fuzzy IF-THEN
Rules
Step 4 Transforming the Crisp Inputs
into a Degree of Match with
Linguistic Values Using
Fuzzification Interface
Step 6 Transforming the Fuzzy Results
into Performance Indices Using
Defuzzification Interface &
Extracting the Final Ranking
Step 7
Reduction of IF-THEN Rules
Using Limiting Logics
Step 5
Final Steps of the Proposed MFLM
Final Steps of the Conventional Fuzzy Logic Method
Pre
lim
ina
ry S
tep
s o
f M
FLM
& C
on
ve
nti
on
al
Fu
zzy
Lo
gic
Me
tho
d
Fig. 4 Step-by-step comparison between MFLM and the Conventional Fuzzy Logic Method

14
Supplementary notes
A Matlab code is developed to execute the method. This code performs all of the
computational steps (i.e., steps 4 to 7) of the proposed technique. It receives a matrix of
attributes [D], a matrix of fuzzy functions, a vector that specifies the number of functions for
each criterion, and finally, a binary vector that separates cost and beneficial criteria as input
data. Then, utilizing the defined functions calculates the performance indices and final ranking
of materials. Since the offered ranking system is based on simple algebraic equations, there is
no major computational hurdle that must be tackled.
Indeed, the only challenge of applying the presented technique is defining the characteristics of
fuzzy membership functions, including their number, mapping interval, and location (i.e., step
3). These functions inform the system of how accurate our data is and how the data should be
normalized by dividing the considered range of materials properties into some groups. In other
words, sets of fuzzy membership functions capture the qualitative viewpoint of the designer
and apply it to simplify the procedure of decision-making based on uncertainties. Some of the
fuzzy-based approaches have tried to limit the functions to certain ones with fixed locations to
reduce the difficulties of function mapping [31, 42]. However, by doing so, functions lose their
flexibility to represent unclear data. MFLM offers designers the chance to map their tailored
fuzzy membership functions and customize the selection scheme. Bear in mind that, in many
other fuzzy-based ranking systems such as the Conventional Fuzzy Logic method [32], which
formed the foundation of the current research, the nomination of functions is left to designers’
hands. MFLM, similar to other existing approaches, guarantees reliable results unless the
functions are not well-fitted to the data. Consequently, decision-makers are not advised to
apply MFLM if either precise numerical data is available or satisfying function mapping is
beyond reach.
15
3 Verification of the proposed method
In this section, MFLM has been applied to three standard mechanical design cases, and the final
rankings are compared with some reliable methods such as TOPSIS [7], Z-transformation [10],
and the conventional Fuzzy Logic [32].
3.1 Cryogenic Storage tanks
Liquid hydrogen, oxygen, nitrogen, and liquefied natural gas (LNG) are among the gases stored
at cryogenic temperature for various applications such as fuel cell, power generation, etc. [43].
Consequently, candidate materials for a cryogenic storage tank should possess adequate
specific strength, specific stiffness, and toughness at the operating temperature. Satisfying
weldability and processability, and good heat insulation are among other necessities. The
requirements mentioned above lead the decision-maker to choose the proper cost and
beneficial criteria for the materials selection procedure.
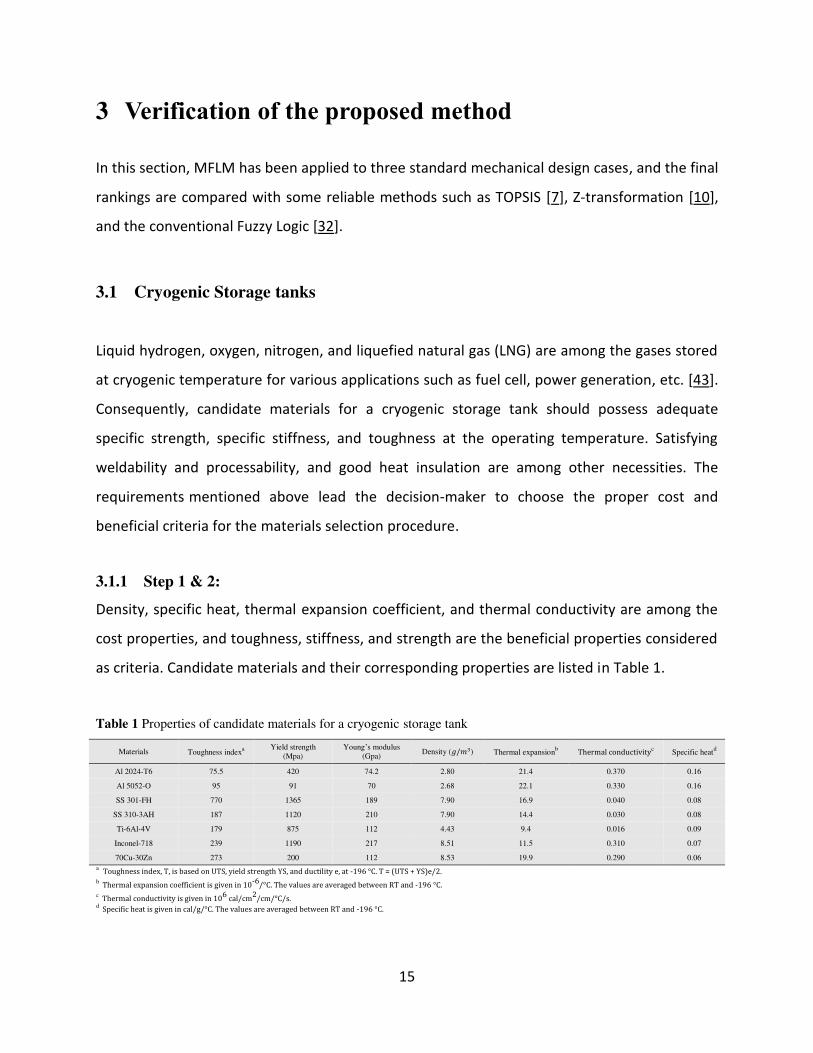
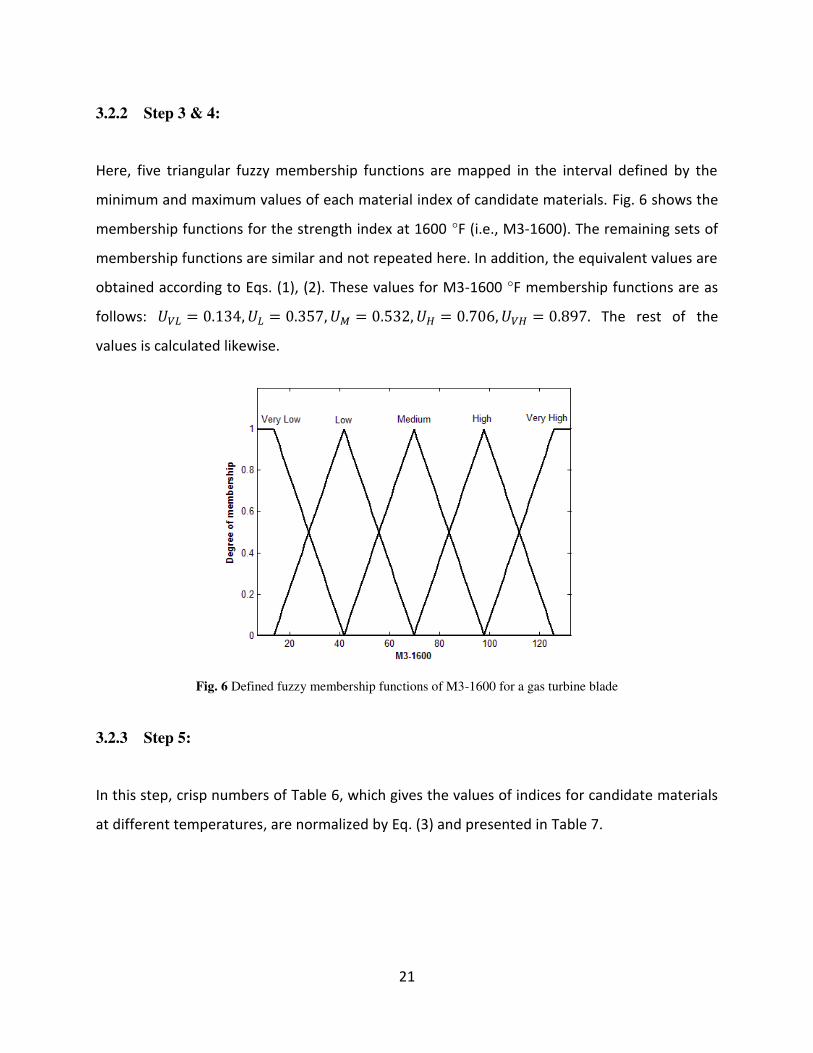
3.1.1 Step 1 & 2:
Density, specific heat, thermal expansion coefficient, and thermal conductivity are among the
cost properties, and toughness, stiffness, and strength are the beneficial properties considered
as criteria. Candidate materials and their corresponding properties are listed in Table 1.
Table 1 Properties of candidate materials for a cryogenic storage tank
Materials Toughness indexa
Yield strength
(Mpa)
Young’s modulus
(Gpa) Density (𝑔/𝑚3) Thermal expansion
b Thermal conductivity
c Specific heat
d
Al 2024-T6 75.5 420 74.2 2.80 21.4 0.370 0.16
Al 5052-O 95 91 70 2.68 22.1 0.330 0.16
SS 301-FH 770 1365 189 7.90 16.9 0.040 0.08
SS 310-3AH 187 1120 210 7.90 14.4 0.030 0.08
Ti-6Al-4V 179 875 112 4.43 9.4 0.016 0.09
Inconel-718 239 1190 217 8.51 11.5 0.310 0.07
70Cu-30Zn 273 200 112 8.53 19.9 0.290 0.06
a Toughness index, T, is based on UTS, yield strength YS, and ductility e, at -196 °C. T = (UTS + YS)e/2.
b Thermal expansion coefficient is given in 10
-6/°C. The values are averaged between RT and -196 °C.
c Thermal conductivity is given in 10
6 cal/cm
2/cm/°C/s.
d Specific heat is given in cal/g/°C. The values are averaged between RT and -196 °C.

16
3.1.2 Step 3 & 4:
In this step, a set of triangular fuzzy membership functions for each attribute is defined. Also,
the equivalent values of the functions are calculated by applying Eqs. (1), (2). These values are
shown in Table 2.
Fig. 5 Defined fuzzy membership functions for a cryogenic storage tank
Table 2 Equivalent values of fuzzy membership functions for a cryogenic storage tank
Membership functions Toughness Index Yield strength Young’s modulus Density Thermal expansion Thermal conductivity Specific heat
Low 0.125 0.111 0.204 0.857 0.833 0.875 0.821
Medium 0.5 0.518 0.561 0.571 0.5 0.525 0.462
High 0.875 0.889 0.882 0.143 0.167 0.125 0.091
3.1.3 Step 5 & 6 & 7:
The crisp data of candidate materials (Table 1) are converted into normalized values using Eq.
(3). The obtained normalized matrix is listed in Table 3. The weighting vector is also calculated
based on MDL [6] method, and the values are as in Table 4.

17
Table 3 Normalized values of the candidate materials for a cryogenic storage tank
Materials Toughness index Yield strength Young’s modulus Density Thermal expansion Thermal conductivity Specific heat
Al 2024-T6 0.125 0.131 0.204 0.587 0.167 0.125 0.091
Al 5052-O 0.125 0.111 0.204 0.599 0.167 0.125 0.091
SS 301-FH 0.875 0.889 0.673 0.143 0.218 0.569 0.611
SS 310-3AH 0.217 0.889 0.839 0.143 0.273 0.656 0.611
Ti-6Al-4V 0.192 0.584 0.287 0.376 0.521 0.834 0.518
Inconel-718 0.414 0.889 0.87 0.143 0.441 0.125 0.725
70Cu-30Zn 0.466 0.111 0.287 0.143 0.168 0.125 0.785
Table 4 Application of modified digital logic method to the cryogenic storage tank
Materials Properties Number of possible decisions Positive Weighting
1 2 3 4 5 6 7 8 9 10 11 12 13 14 15 16 17 18 19 20 21 decisions Coefficient
Toughness index 3 3 3 3 3 3 18 0.214
Yield strength 1 3 1 2 3 3 13 0.155
Young modulus 1 1 1 1 3 3 10 0.119
Density 1 3 3 3 3 3 16 0.19
Thermal expansion 1 2 3 1 3 3 13 0.155
Thermal conductivity 1 1 1 1 1 2 7 0.083
Specific heat 1 1 1 1 1 2 7 0.083
Finally, the performance indices for the candidate materials are obtained using Eq. (4). The final
ranking of the candidate materials by the proposed method and other conventional ranking
approaches are listed in Table 5.
Table 5 Performance indices and ranking of candidate materials for a cryogenic storage tank
Materials MFLM TOPSIS [7]
Z-transformation [10]
Conventional Fuzzy [32] 𝛾 Rank 𝛾 Rank 𝛾 Rank 𝛾 Rank
SS 301-FH 0.564 1 0.748 1 0.78 1 50.00 1
Inconel-718 0.496 2 0.344 3 0.27 3 43.83 2
SS 310-3AH 0.459 3 0.300 4 0.26 4 35.74 4
Ti-6Al-4V 0.430 4 0.348 2 0.39 2 38.42 3
70Cu-30Zn 0.280 5 0.252 7 -0.49 5 16.14 6
Al 2024-T6 0.227 6 0.259 5 -0.56 6 17.58 5
Al 5052-O 0.227 7 0.258 6 -0.65 7 16.10 7
According to Table 5, TOPSIS and Z-transformation methods allocate the second rank to Ti-6Al-
4V; however, based on MFLM and Conventional Fuzzy ranking results, Inconel-718 stands in
second place. Ti-6Al-4V demonstrates an extraordinarily low thermal conductivity compared to
other candidate materials, and its density is less than Inconel-718. Nevertheless, its
performance corresponding to all other beneficial criteria is weaker than Inconel-718 and even
SS 310-3AH. TOPSIS and Z-transformation methods cannot identify a design scope
18
corresponding to each criterion for the application; as a result, materials with only one or two
exceptional property values would earn better rankings. It is also the case for the third and
fourth ranks of the Conventional Fuzzy method. This major flaw is resolved in MFLM by
mapping the membership functions in each criterion’s favorable design interval. To elaborate
on this, see the set of membership functions for the Thermal conductivity property in Fig. 5.
Values of candidate materials corresponding to this property range from 0.016 to 0.370;
however, the design span for this criterion in which membership functions are mapped is from
0 to 0.12. It allows the decision-maker to balance the adverse influences of a material with an
extraordinary property on the overall ranking results. Note that the final ranking would be
much closer to the results of the mentioned methods if the set of fuzzy functions were defined
in the total interval values of candidate materials.
3.2 Gas turbine blades
3.2.1 Step 1 & 2:
Unlike the previous example, materials indices are considered as criteria to show the capability
of the proposed method in solving problems under different circumstances. Materials indices
that are obtained based on operating conditions and also fatigue requirements are as follows: 𝑀1 = (𝜎𝑦𝜌 )0.5 , 𝑀2 = (𝐸𝜌) ,𝑀3 = 𝜎𝑦 , 𝑀4 = (𝐸𝜌)0.5 , 𝑀5 = (𝜎𝑦𝐸𝛼) ,𝑀6 = ( 𝑘𝜌𝑐) , 𝑀7: Creep rupture
stress, 𝑀8 = (elongation × (𝜎𝑦+𝜎𝑢𝑡)2 ), 𝑀9 = 𝑇𝑚, 𝑀10: Oxidation resistance, 𝑀11: Corrosion
resistance, where 𝜎𝑦 , 𝜎𝑢𝑡 , 𝜌, 𝐸, 𝛼, 𝑘, c, and 𝑇𝑚 are yield stress, ultimate tensile stress, density,
Young’s modulus, thermal expansion coefficient, thermal conductivity, specific heat, and
melting temperature, respectively. Details of extracting these indices can be found in reference
[14]. Since a turbine blade experiences a wide temperature range in its working environment,
accurate properties of the candidate materials at different temperature points should be
considered. Over the past two decades, the working temperature of gas turbines has risen from
1000-1300 °F to 1300-1800 °F. Also, the non-operating temperature is assumed to be 70 °F.

19
Table 6 provides the selected material indices and their values for screened candidate
materials, respectively.

20
Table 6 Indices of candidate materials at different temperature points for a gas turbine blade
Superalloys
M1
-70
M1
-1000
M1
-1200
M1
-1400
M1
-1600
M1
-1800
M2
-70
M2
-1000
M2
-1200
M2
-1400
M2
-1600
M2
-1800
M3
-70
M3
-1000
M3
-1200
M3
-1400
M3
-1600
M3
-1800
M4
-70
M4
-1000
M4
-1200
M4
-1400
M4
-1600
M4
-1800
M5
-1000
Hastelloy S 15.02 12.84 12.71 12.17 11.31 7.34 103.7 88.89 84.85 81.14 76.09 70.71 67 49 48 44 38 16 10.18 9.428 9.211 9.008 8.723 8.409 0.221
Hastelloy X 13.19 11.53 10.52 10.37 9.413 6.414 94.3 81.65 78.16 73.73 70.25 64.56 55 42 35 34 28 13 9.711 9.036 8.841 8.587 8.382 8.035 0.22
Haynes HR-120 12.52 9.398 9.25 9.343 9.632 8.165 98.28 81.1 77.32 73.2 68.73 64.6 45.6 25.7 24.9 25.4 27 19.4 9.914 9.006 8.793 8.555 8.29 8.038 0.121
Haynes HR-160 12.5 9.345 9.382 9.197 8.7 6.082 104.8 87.67 83.56 78.42 74.32 67.81 45.6 25.5 25.7 24.7 22.1 10.8 10.24 9.363 9.141 8.856 8.621 8.235 0.12
Haynes 230 13.72 11.65 11.6 12.03 10.23 7.495 94.44 81.48 78.09 74.38 71.3 67.59 61 44 43.6 46.9 33.9 18.2 9.718 9.027 8.837 8.625 8.444 8.221 0.219
Haynes 282 18.65 17.73 17.64 17.45 15.73 7.972 105.4 90.97 86.96 82.61 76.59 68.9 104 94 93 91 74 19 10.26 9.538 9.325 9.089 8.751 8.3 0.461
Haynes 625 15.26 13.43 13.31 12.8 9.918 6.273 99.02 83.93 79.67 74.75 69.51 61.31 71 55 54 50 30 12 9.951 9.162 8.926 8.646 8.337 7.83 0.265
Inconel 600 12.65 11.72 11 9.218 7.231 5.113 101.6 87.25 83.33 79.41 74.51 68.63 49 42 37 26 16 8 10.08 9.341 9.129 8.911 8.632 8.284 0.187
Inconel 601 10.93 9.05 9.599 9.776 7.838 6.127 102.4 86.69 82.25 76.79 69.97 62.8 35 24 27 28 18 11 10.12 9.311 9.069 8.763 8.365 7.925 0.111
Inconel 625 15.58 14.03 14.26 14.03 11.59 8.098 98.69 84.92 80.98 76.39 70.16 63.93 74 60 62 60 41 20 9.934 9.215 8.999 8.74 8.376 7.996 0.297
Inconel 718 24.07 22.73 22.32 20.18 12.58 8.308 97.64 83.5 79.8 75.08 68.01 58.59 172 153.5 148 121 47 20.5 9.881 9.138 8.933 8.665 8.247 7.654 0.764
Haynes 556 14.33 10.86 10.7 10.54 9.881 7.34 100 77.78 73.4 73.4 70.37 67.68 61 35 34 33 29 16 10 8.819 8.567 8.567 8.389 8.227 0.172
Incoloy 800 11.2 11.04 10.56 8.755 6.858 4.939 98.95 81.53 77.7 73.52 69.69 65.51 36 35 32 22 13.5 7 9.948 9.03 8.815 8.574 8.348 8.094 0.159
Incoloy 800H 11.04 7.919 7.696 7.919 7.696 6.73 98.95 81.53 77.7 73.52 69.69 65.51 35 18 17 18 17 13 9.948 9.03 8.815 8.574 8.348 8.094 0.082
Incoloy 800HT 11.04 7.919 7.696 7.919 7.696 6.73 98.95 81.53 77.7 73.52 69.69 65.51 35 18 17 18 17 13 9.948 9.03 8.815 8.574 8.348 8.094 0.082
Haynes 188 14.41 11.39 11.07 10.96 10.53 7.658 85.19 80.86 76.85 72.84 68.83 64.81 67.3 42 39.7 38.9 35.9 19 9.23 8.992 8.767 8.535 8.296 8.051 0.208
Haynes 25 (L-605) 14.46 10.44 12.06 11.15 10.44 7.385 98.48 78.18 73.64 69.09 64.85 60.3 69 36 48 41 36 18 9.924 8.842 8.581 8.312 8.053 7.766 0.174
MAR-M-247 19.98 20.86 20.94 21.01 20.23 18.02 64.94 56.17 53.25 50.32 47.4 44.81 123 134 135 136 126 100 8.058 7.495 7.297 7.094 6.885 6.694 0.922
CMSX-4 20.7 21.33 21.8 21.18 19.88 17.48 119.6 116.3 113.3 109.6 106.3 102.3 129 137 143 135 119 92 10.94 10.78 10.64 10.47 10.31 10.12 0.483
Superalloys
M5-1
200
M5-1
400
M5-1
600
M5-1
800
M6-7
0
M6-1
000
M6-1
200
M6-1
400
M6-1
600
M6-1
800
M7-1
200
M7-1
400
M7-1
500
M7-1
600
M7-1
800
M8
M9-7
0
M9-1
000
M9-1
200
M9-1
400
M9-1
600
M9-1
800
M10-1
800
M10-2
000
M11
Hastelloy S 0.221 0.207 0.187 0.083 2587 4011 4261 4339 4274 4521 58 24.5 16 11.8 5.2 2300 4728 4025 4208 4580 2088 1054 0.5 1.3 29.5
Hastelloy X 0.186 0.182 0.152 0.074 1719 3311 3438 3479 3449 3352 48 22.5 14.3 10.6 3.7 2435 3652 3060 3186 2677 2117 1268 0.9 2.7 29.5
Haynes HR-120 0.12 0.126 0.139 0.104 2393 3411 3580 3798 3890 4002 47 21.6 14.9 10.3 4.4 2375 3790 3224 2937 2235 1913 1920 3.7 7.7 0.9
Haynes HR-160 0.122 0.121 0.111 0.057 2335 3626 3674 3834 3863 4019 34 13 9.9 6.8 3.5 2360 5331 4077 3553 3168 2567 1404 5.9 10.3 1.1
Haynes 230 0.213 0.234 0.171 0.093 2014 3665 3409 3616 3810 4094 56 27 19 13.7 6 2375 4392 3942 4013 3809 2948 1080 0.7 1.3 12.6
Haynes 282 0.459 0.455 0.371 0.099 2315 3640 3918 3946 3958 4134 85 57 38 23 6.2 2370 4050 4046 3798 2365 2418 1562 1.8 10.9 2.2
Haynes 625 0.265 0.252 0.154 0.067 3186 3924 4028 4206 4401 4616 77 29 16.2 8.6 2.7 2350 4949 5163 4592 3631 2160 792 0.7 4.8 13.7
Inconel 600 0.169 0.12 0.077 0.041 2382 3245 3401 3479 3591 3674 23 8.4 6.3 4.8 2.8 2470 3020 2313 2639 2025 1197 650 0.9 1.6 12.5
Inconel 601 0.126 0.135 0.092 0.061 3208 3882 4011 4100 4209 4283 33 10.6 7.3 4.9 2.3 2375 3535 2725 2401 2720 1767 1260 1.3 2.6 2.9
Inconel 625 0.306 0.303 0.218 0.114 2911 3536 3655 3786 3906 4016 77 29 16.2 8.6 2.7 2350 5350 4656 3111 3150 5125 3020 0.72 4.8 1.7
Inconel 718 0.743 0.617 0.25 0.12 2636 3173 3298 3367 3430 3488 76.1 26.4 14.2 6.9 1.7 2300 3610 2877 2928 2846 2990 3465 0.5 1 0.2
Haynes 556 0.173 0.165 0.148 0.084 2427 3833 4051 4315 4449 4512 53 25 17 11.5 4.8 2425 4230 3456 3146 2575 2014 1408 1.1 2.6 3.8
Incoloy 800 0.149 0.105 0.066 0.035 2534 3510 3653 3830 4017 4575 24 9.5 6 4.4 1.9 2475 2684 2071 2139 2044 1344 810 1.4 8.2 0.4
Incoloy 800H 0.079 0.086 0.083 0.066 2534 3510 3653 3830 4017 4575 22.5 9.4 6.1 3.9 1.7 2475 3207 2160 1731 1088 1755 1296 1.8 7.4 11
Incoloy 800HT 0.079 0.086 0.083 0.066 2534 3510 3653 3830 4017 4575 22.5 9.4 6.1 3.9 1.7 2475 3207 2160 1731 1088 1755 1296 1.7 7.1 16
Haynes 188 0.194 0.194 0.183 0.099 2291 3491 3694 3935 3949 4167 72 37 17.5 11.6 4.3 2240 5419 4590 4219 4057 3069 1599 0.6 1.3 3.3
Haynes 25 (L-605) 0.241 0.209 0.185 0.096 2141 3497 3726 3968 4242 4523 69 36 24.7 17.5 7.2 2425 5483 4484 4680 2814 2160 936 0.7 10.2 1.8
MAR-M-247 0.823 0.713 0.591 0.429 1743 3571 3732 3816 3944 4058 127 90.6 72 53 28 2400 1676 1465 1446 1371 1420 1748 0.5 1.1 2.1
CMSX-4 0.477 0.46 0.387 0.293 2161 4972 5287 5478 5596 5157 145 130 113 82 42 2901 1587 1358 1444 1770 2080 2024 0.7 1.3 3
21
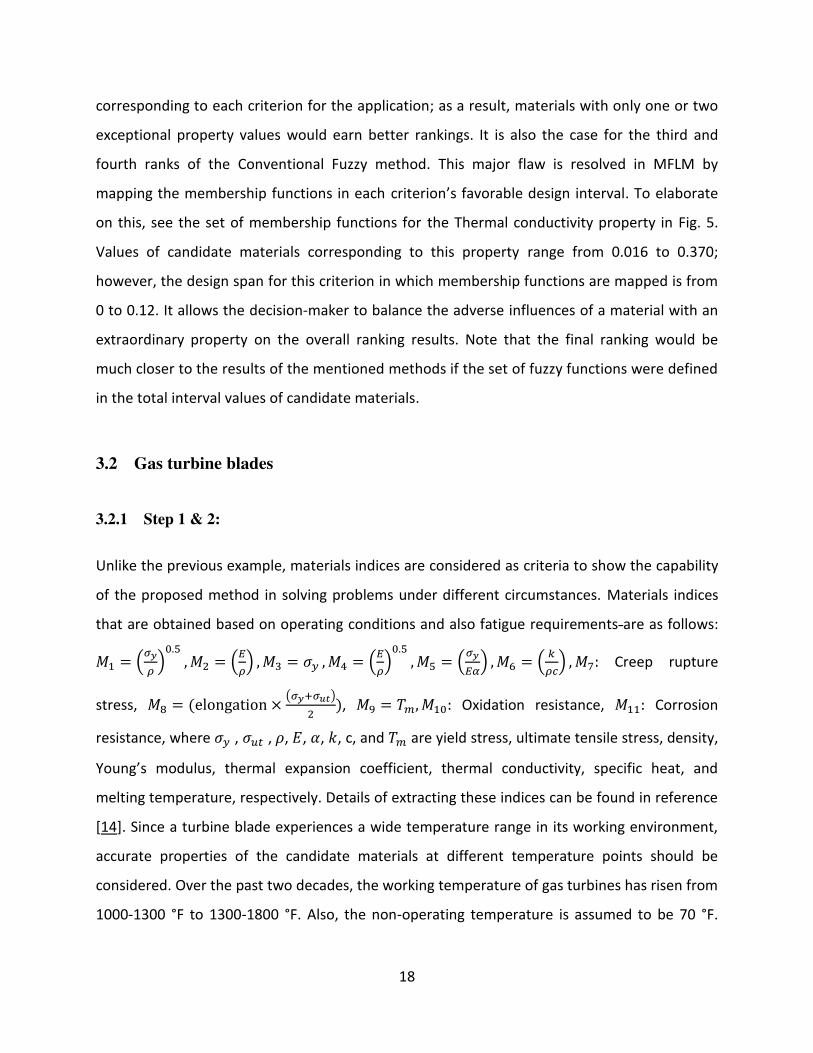
3.2.2 Step 3 & 4:
Here, five triangular fuzzy membership functions are mapped in the interval defined by the
minimum and maximum values of each material index of candidate materials. Fig. 6 shows the
membership functions for the strength index at 1600 °F (i.e., M3-1600). The remaining sets of
membership functions are similar and not repeated here. In addition, the equivalent values are
obtained according to Eqs. (1), (2). These values for M3-1600 °F membership functions are as
follows: 𝑈𝑉𝐿 = 0.134, 𝑈𝐿 = 0.357, 𝑈𝑀 = 0.532, 𝑈𝐻 = 0.706, 𝑈𝑉𝐻 = 0.897. The rest of the
values is calculated likewise.
Fig. 6 Defined fuzzy membership functions of M3-1600 for a gas turbine blade
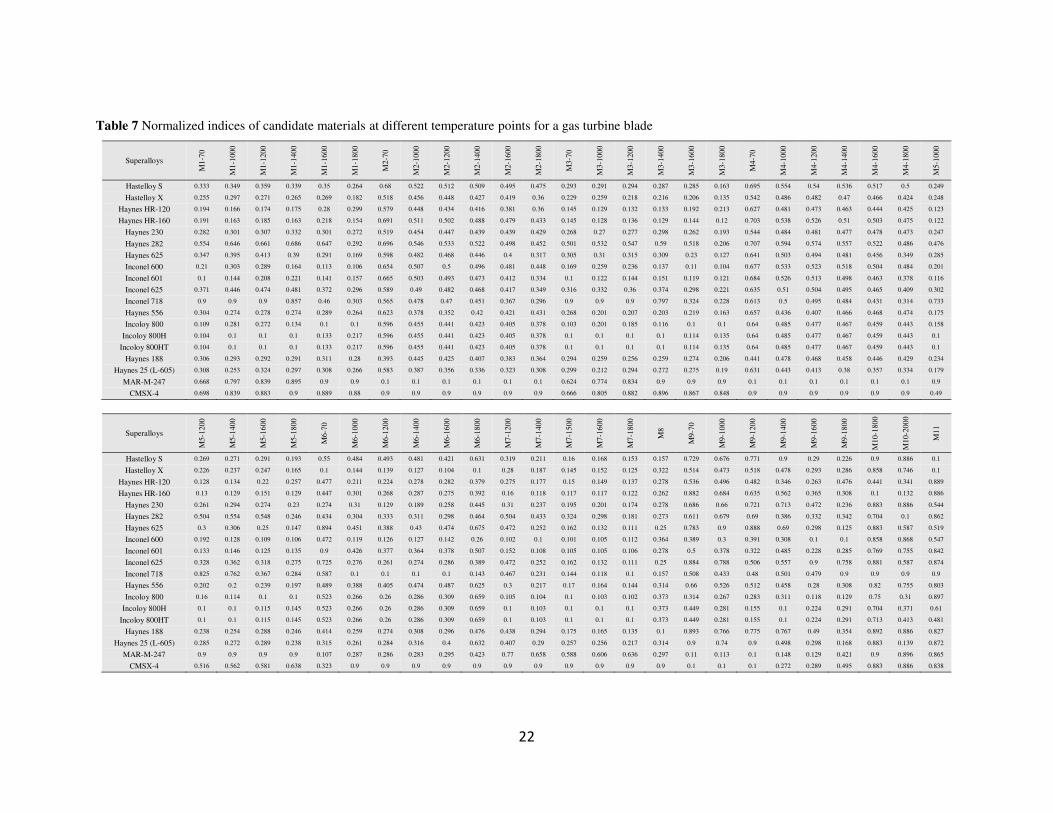
3.2.3 Step 5:
In this step, crisp numbers of Table 6, which gives the values of indices for candidate materials
at different temperatures, are normalized by Eq. (3) and presented in Table 7.
22
Table 7 Normalized indices of candidate materials at different temperature points for a gas turbine blade
Superalloys
M1
-70
M1
-1000
M1
-1200
M1
-1400
M1
-1600
M1
-1800
M2
-70
M2
-1000
M2
-1200
M2
-1400
M2
-1600
M2
-1800
M3
-70
M3
-1000
M3
-1200
M3
-1400
M3
-1600
M3
-1800
M4
-70
M4
-1000
M4
-1200
M4
-1400
M4
-1600
M4
-1800
M5
-1000
Hastelloy S 0.333 0.349 0.359 0.339 0.35 0.264 0.68 0.522 0.512 0.509 0.495 0.475 0.293 0.291 0.294 0.287 0.285 0.163 0.695 0.554 0.54 0.536 0.517 0.5 0.249
Hastelloy X 0.255 0.297 0.271 0.265 0.269 0.182 0.518 0.456 0.448 0.427 0.419 0.36 0.229 0.259 0.218 0.216 0.206 0.135 0.542 0.486 0.482 0.47 0.466 0.424 0.248
Haynes HR-120 0.194 0.166 0.174 0.175 0.28 0.299 0.579 0.448 0.434 0.416 0.381 0.36 0.145 0.129 0.132 0.133 0.192 0.213 0.627 0.481 0.473 0.463 0.444 0.425 0.123
Haynes HR-160 0.191 0.163 0.185 0.163 0.218 0.154 0.691 0.511 0.502 0.488 0.479 0.433 0.145 0.128 0.136 0.129 0.144 0.12 0.703 0.538 0.526 0.51 0.503 0.475 0.122
Haynes 230 0.282 0.301 0.307 0.332 0.301 0.272 0.519 0.454 0.447 0.439 0.439 0.429 0.268 0.27 0.277 0.298 0.262 0.193 0.544 0.484 0.481 0.477 0.478 0.473 0.247
Haynes 282 0.554 0.646 0.661 0.686 0.647 0.292 0.696 0.546 0.533 0.522 0.498 0.452 0.501 0.532 0.547 0.59 0.518 0.206 0.707 0.594 0.574 0.557 0.522 0.486 0.476
Haynes 625 0.347 0.395 0.413 0.39 0.291 0.169 0.598 0.482 0.468 0.446 0.4 0.317 0.305 0.31 0.315 0.309 0.23 0.127 0.641 0.503 0.494 0.481 0.456 0.349 0.285
Inconel 600 0.21 0.303 0.289 0.164 0.113 0.106 0.654 0.507 0.5 0.496 0.481 0.448 0.169 0.259 0.236 0.137 0.11 0.104 0.677 0.533 0.523 0.518 0.504 0.484 0.201
Inconel 601 0.1 0.144 0.208 0.221 0.141 0.157 0.665 0.503 0.493 0.473 0.412 0.334 0.1 0.122 0.144 0.151 0.119 0.121 0.684 0.526 0.513 0.498 0.463 0.378 0.116
Inconel 625 0.371 0.446 0.474 0.481 0.372 0.296 0.589 0.49 0.482 0.468 0.417 0.349 0.316 0.332 0.36 0.374 0.298 0.221 0.635 0.51 0.504 0.495 0.465 0.409 0.302
Inconel 718 0.9 0.9 0.9 0.857 0.46 0.303 0.565 0.478 0.47 0.451 0.367 0.296 0.9 0.9 0.9 0.797 0.324 0.228 0.613 0.5 0.495 0.484 0.431 0.314 0.733
Haynes 556 0.304 0.274 0.278 0.274 0.289 0.264 0.623 0.378 0.352 0.42 0.421 0.431 0.268 0.201 0.207 0.203 0.219 0.163 0.657 0.436 0.407 0.466 0.468 0.474 0.175
Incoloy 800 0.109 0.281 0.272 0.134 0.1 0.1 0.596 0.455 0.441 0.423 0.405 0.378 0.103 0.201 0.185 0.116 0.1 0.1 0.64 0.485 0.477 0.467 0.459 0.443 0.158
Incoloy 800H 0.104 0.1 0.1 0.1 0.133 0.217 0.596 0.455 0.441 0.423 0.405 0.378 0.1 0.1 0.1 0.1 0.114 0.135 0.64 0.485 0.477 0.467 0.459 0.443 0.1
Incoloy 800HT 0.104 0.1 0.1 0.1 0.133 0.217 0.596 0.455 0.441 0.423 0.405 0.378 0.1 0.1 0.1 0.1 0.114 0.135 0.64 0.485 0.477 0.467 0.459 0.443 0.1
Haynes 188 0.306 0.293 0.292 0.291 0.311 0.28 0.393 0.445 0.425 0.407 0.383 0.364 0.294 0.259 0.256 0.259 0.274 0.206 0.441 0.478 0.468 0.458 0.446 0.429 0.234
Haynes 25 (L-605) 0.308 0.253 0.324 0.297 0.308 0.266 0.583 0.387 0.356 0.336 0.323 0.308 0.299 0.212 0.294 0.272 0.275 0.19 0.631 0.443 0.413 0.38 0.357 0.334 0.179
MAR-M-247 0.668 0.797 0.839 0.895 0.9 0.9 0.1 0.1 0.1 0.1 0.1 0.1 0.624 0.774 0.834 0.9 0.9 0.9 0.1 0.1 0.1 0.1 0.1 0.1 0.9
CMSX-4 0.698 0.839 0.883 0.9 0.889 0.88 0.9 0.9 0.9 0.9 0.9 0.9 0.666 0.805 0.882 0.896 0.867 0.848 0.9 0.9 0.9 0.9 0.9 0.9 0.49
Superalloys
M5-1
200
M5-1
400
M5-1
600
M5-1
800
M6
-70
M6-1
000
M6-1
200
M6-1
400
M6-1
600
M6-1
800
M7-1
200
M7-1
400
M7-1
500
M7-1
600
M7-1
800
M8
M9
-70
M9-1
000
M9-1
200
M9-1
400
M9-1
600
M9-1
800
M10-1
800
M10-2
000
M11
Hastelloy S 0.269 0.271 0.291 0.193 0.55 0.484 0.493 0.481 0.421 0.631 0.319 0.211 0.16 0.168 0.153 0.157 0.729 0.676 0.771 0.9 0.29 0.226 0.9 0.886 0.1
Hastelloy X 0.226 0.237 0.247 0.165 0.1 0.144 0.139 0.127 0.104 0.1 0.28 0.187 0.145 0.152 0.125 0.322 0.514 0.473 0.518 0.478 0.293 0.286 0.858 0.746 0.1
Haynes HR-120 0.128 0.134 0.22 0.257 0.477 0.211 0.224 0.278 0.282 0.379 0.275 0.177 0.15 0.149 0.137 0.278 0.536 0.496 0.482 0.346 0.263 0.476 0.441 0.341 0.889
Haynes HR-160 0.13 0.129 0.151 0.129 0.447 0.301 0.268 0.287 0.275 0.392 0.16 0.118 0.117 0.117 0.122 0.262 0.882 0.684 0.635 0.562 0.365 0.308 0.1 0.132 0.886
Haynes 230 0.261 0.294 0.274 0.23 0.274 0.31 0.129 0.189 0.258 0.445 0.31 0.237 0.195 0.201 0.174 0.278 0.686 0.66 0.721 0.713 0.472 0.236 0.883 0.886 0.544
Haynes 282 0.504 0.554 0.548 0.246 0.434 0.304 0.333 0.311 0.298 0.464 0.504 0.433 0.324 0.298 0.181 0.273 0.611 0.679 0.69 0.386 0.332 0.342 0.704 0.1 0.862
Haynes 625 0.3 0.306 0.25 0.147 0.894 0.451 0.388 0.43 0.474 0.675 0.472 0.252 0.162 0.132 0.111 0.25 0.783 0.9 0.888 0.69 0.298 0.125 0.883 0.587 0.519
Inconel 600 0.192 0.128 0.109 0.106 0.472 0.119 0.126 0.127 0.142 0.26 0.102 0.1 0.101 0.105 0.112 0.364 0.389 0.3 0.391 0.308 0.1 0.1 0.858 0.868 0.547
Inconel 601 0.133 0.146 0.125 0.135 0.9 0.426 0.377 0.364 0.378 0.507 0.152 0.108 0.105 0.105 0.106 0.278 0.5 0.378 0.322 0.485 0.228 0.285 0.769 0.755 0.842
Inconel 625 0.328 0.362 0.318 0.275 0.725 0.276 0.261 0.274 0.286 0.389 0.472 0.252 0.162 0.132 0.111 0.25 0.884 0.788 0.506 0.557 0.9 0.758 0.881 0.587 0.874
Inconel 718 0.825 0.762 0.367 0.284 0.587 0.1 0.1 0.1 0.1 0.143 0.467 0.231 0.144 0.118 0.1 0.157 0.508 0.433 0.48 0.501 0.479 0.9 0.9 0.9 0.9
Haynes 556 0.202 0.2 0.239 0.197 0.489 0.388 0.405 0.474 0.487 0.625 0.3 0.217 0.17 0.164 0.144 0.314 0.66 0.526 0.512 0.458 0.28 0.308 0.82 0.755 0.803
Incoloy 800 0.16 0.114 0.1 0.1 0.523 0.266 0.26 0.286 0.309 0.659 0.105 0.104 0.1 0.103 0.102 0.373 0.314 0.267 0.283 0.311 0.118 0.129 0.75 0.31 0.897
Incoloy 800H 0.1 0.1 0.115 0.145 0.523 0.266 0.26 0.286 0.309 0.659 0.1 0.103 0.1 0.1 0.1 0.373 0.449 0.281 0.155 0.1 0.224 0.291 0.704 0.371 0.61
Incoloy 800HT 0.1 0.1 0.115 0.145 0.523 0.266 0.26 0.286 0.309 0.659 0.1 0.103 0.1 0.1 0.1 0.373 0.449 0.281 0.155 0.1 0.224 0.291 0.713 0.413 0.481
Haynes 188 0.238 0.254 0.288 0.246 0.414 0.259 0.274 0.308 0.296 0.476 0.438 0.294 0.175 0.165 0.135 0.1 0.893 0.766 0.775 0.767 0.49 0.354 0.892 0.886 0.827
Haynes 25 (L-605) 0.285 0.272 0.289 0.238 0.315 0.261 0.284 0.316 0.4 0.632 0.407 0.29 0.257 0.256 0.217 0.314 0.9 0.74 0.9 0.498 0.298 0.168 0.883 0.139 0.872
MAR-M-247 0.9 0.9 0.9 0.9 0.107 0.287 0.286 0.283 0.295 0.423 0.77 0.658 0.588 0.606 0.636 0.297 0.11 0.113 0.1 0.148 0.129 0.421 0.9 0.896 0.865
CMSX-4 0.516 0.562 0.581 0.638 0.323 0.9 0.9 0.9 0.9 0.9 0.9 0.9 0.9 0.9 0.9 0.9 0.1 0.1 0.1 0.272 0.289 0.495 0.883 0.886 0.838
23
3.2.4 Step 6:
This step aims to provide the equivalent weighting coefficients for each one of the material
index-temperature point pairs. First, weighting factors for material indices should be
determined. This task can be done using MDL [6], QFD [14], or other weighting methods.
However, since equal weighting coefficients for the material indices are taken into account by
TOPSIS and Z-transformation methods, for a more meaningful comparison of the results with
outputs of the named techniques, equal values are considered for eleven material indices. It
means that the weighting coefficient for each material index is assumed to be 1/11. Second, the
weighting factors for temperature points should be calculated. This step could be quickly done
by the MDL method, see Table 8. Now with having weighting coefficients of material indices
(𝛼𝑚) and also point to point temperature weighting factors (𝛼𝑇), equivalent weighting numbers
can be defined by the following equation: 𝛼𝑒𝑞 = 𝛼𝑚 × 𝛼𝑇 (5)
It can be inferred from Eq. (5) that the changes in the working environment, like temperature
fluctuations, which may cause variation in material indices, dictates the equivalent weighting
coefficients (𝛼𝑒𝑞) to consist of proper weighting factors for all the influential working
parameters. Here, in order to demonstrate the importance of each material index-temperature
point pair, Eq. (5) first enables the decision-maker to consider materials data in a wide range of
working temperatures (𝛼𝑚), and second, value the material indices at more important
temperature points (𝛼𝑇). Note that since the materials data are not available at all temperature
points, the points with available information are employed for some indices. For example, for
the corrosion resistance index (M10), material indices are not presented in a broad range of
working temperatures. As a result, materials data at 1800 and 2000 °F are considered for
evaluation. The equivalent weighting coefficients for each material index-temperature point
are listed in Table 9.

24
Table 8 Weighting coefficients of temperature points for a gas turbine blade
Temp. °F Number of possible decisions Positive decisions Coefficient 𝛼𝑇
1 2 3 4 5 6 7 8 9 10 11 12 13 14 15
70 1 1 1 1 1
5 0.083
1000 3
1 1 1 1
7 0.117
1200
3
3
1 1 1
9 0.150
1400
3
3
3
1 1
11 0.183
1600
3
3
3
3
1 13 0.217
1800
3
3
3
3 3 15 0.250
Table 9 Equivalent weighting factors of the material indices for a gas turbine blade
Material Index Value Material Index Value Material Index Value Material Index Value Material Index Value
M1-70 0.007545 M2-1600 0.019727 M4-1200 0.013636 M6-1000 0.010636 M8 0.090909
M1-1000 0.010636 M2-1800 0.022727 M4-1400 0.016636 M6-1200 0.013636 M9-70 0.007545
M1-1200 0.013636 M3-70 0.007545 M4-1600 0.019727 M6-1400 0.016636 M9-1000 0.010636
M1-1400 0.016636 M3-1000 0.010636 M4-1800 0.022727 M6-1600 0.019727 M9-1200 0.013636
M1-1600 0.019727 M3-1200 0.013636 M5-1000 0.009090 M6-1800 0.022727 M9-1400 0.016636
M1-1800 0.022727 M3-1400 0.016636 M5-1200 0.013636 M7-1200 0.009090 M9-1600 0.019727
M2-70 0.007545 M3-1600 0.019727 M5-1400 0.018181 M7-1400 0.013636 M9-1800 0.022727
M2-1000 0.010636 M3-1800 0.022727 M5-1600 0.022727 M7-1500 0.018181 M10-1800 0.045454
M2-1200 0.013636 M4-70 0.007545 M5-1800 0.027272 M7-1600 0.022727 M10-2000 0.045454
M2-1400 0.016636 M4-1000 0.010636 M6-70 0.007545 M7-1800 0.027272 M11 0.090909
3.2.5 Step 7:
By multiplying the normalized matrixs(𝑅19×50)with the weighting vector(𝑊50×1), the
performance index vector and final ranking of the candidate materials can be extracted. The
number 19 represents the number of candidate materials, and 50 indicates the number of
material index-temperature point pairs. Table 10 presents the final ranking of the proposed
method and the results obtained by the Z-transformation, QFD, and TOPSIS methods. As it is
seen, there is extensive compatibility between the results obtained by different methods, and it
proves the claim made earlier in this research work on the accuracy of the Modified Fuzzy Logic
Method. Also, some minor discrepancies can be seen in the results. According to the TOPSIS
method, candidate materials are ranked based on their distances from ideal and non-ideal
solutions [7], meaning that materials are ranked relative to each other. Data dependency can
adversely affect the results, especially when the designer faces candidate materials with low or
high exceptional properties. These materials extend the range of property values and do not
allow the decision-maker to differentiate the materials with close property values correctly. It is

25
the case for TOPSIS rankings of materials Hastelloy S (rank 18) and Haynes 625 (rank 15).
Surprisingly, although material indices of Haynes 25 (L-605) are so close to Hastelloy S, TOPSIS
allocates the seventh place to this candidate material. MFLM resolved this major flaw by using
its unique normalizing technique. Here, the defined sets of membership functions and their
corresponding equivalent values act as auxiliary tools for accurately assessing the properties of
materials and extracting their performance indices. Additionally, the poor performance of
Haynes 188 corresponding to some material indices like corrosion resistance forced the QFD
method to disregard its other valuable capabilities. On the other hand, MFLM can notice the
requirements and objectives of the application and appreciate all of the favorable
characteristics of different alternatives.
This example illustrates the power of the method in solving complex and hard-to-process
problems. The enormous number of criteria (i.e., 50) makes it extremely time-consuming for
conventional fuzzy logic-based approaches to provide the final ranking. For example, having 50
criteria and a set of 5 fuzzy membership functions leads to 550 IF-THEN rules (before reduction)
in the Conventional Fuzzy Logic method [32], making it inefficient while facing such elaborate
problems. However, the proposed method allows us to confront complicated problems, besides
giving us the undeniable advantages of the fuzzy environment.

26
Table 10 Performance indices and ranking of candidate materials for a gas turbine blade
Materials MFLM TOPSIS [7] Z-transformation [10] QFD method [14] 𝛾 Rank 𝛾 Rank 𝛾 Rank 𝛾 Rank
CMSX-4 0.794 1 0.833 1 2.0786 1 2.038503 1
MAR-M-247 0.546 2 0.792 2 0.4076 2 0.437551 2
Inconel 718 0.498 3 0.630 3 0.2856 4 0.268965 4
Haynes 282 0.473 4 0.582 6 0.290 3 0.401309 3
Inconel 625 0.459 5 0.598 4 0.1763 5 0.135930 5
Haynes 188 0.421 6 0.586 5 -0.066 7 0.14546- 11
Haynes 556 0.416 7 0.563 8 -0.013 6 0.07022- 7
Haynes 230 0.407 8 0.500 12 -0.090 10 0.14345- 10
Haynes 625 0.403 9 0.463 15 -0.072 8 0.09228- 8
Haynes 25 (L-605) 0.401 10 0.571 7 -0.092 11 0.06205- 6
Hastelloy S 0.388 11 0.353 18 -0.080 9 0.12437- 9
Inconel 601 0.377 12 0.547 9 -0.178 12 0.23988- 13
Haynes HR-120 0.355 13 0.526 11 -0.315 15 0.25074- 14
Incoloy 800 0.347 14 0.539 10 -0.307 13 0.28666- 15
Inconel 600 0.344 15 0.463 14 -0.311 14 0.34051- 16
Haynes HR-160 0.334 16 0.473 13 -0.362 16 0.23915- 12
Incoloy 800H 0.320 17 0.438 16 -0.418 17 0.38783- 17
Hastelloy X 0.314 18 0.324 19 -0.473 19 0.45904- 19
Incoloy 800HT 0.311 19 0.382 17 -0.461 18 0.42858- 18
3.3 Thermal barrier coatings (TBCs)
3.3.1 Introduction to TBCs:
Superalloys experience mechanical and chemical degradations at high temperatures. In such
cases, knowledge of surface engineering must be used to protect the parts. Tribology suggests
using proper coatings to assure materials properties remain stable. All coatings applied to
turbine blades should preserve the surface from the destructive effects of high-temperature
corrosion, erosion, and oxidation due to combustion products. High strength under static and
dynamic stresses, chemical inertness, and proper adhesion to the substrate are among other
essential characteristics. Fig. 7 shows the flowchart of selecting an optimum material as a
coating for gas turbine blades.

27
The application of thermal barrier coatings (TBCs) in turbine engines is quite common [44]. In
this type of coatings, a ceramic layer is applied on the surface of the superalloy. Ceramics, due
to their low thermal conductivity, provide thermal insulators that keep the temperature of
sublayers much lower than the operating temperature of the engine. Perforated TBCs with 300 𝜇𝑚 thickness can cause temperature differences of up to hundreds of degrees of Celsius
between the hot gas and the blade superalloy [45]. New TBC generations mostly made up of
YSZ are used for turbine blades, nozzles, and some parts of the combustion chamber.
Study of Failure Mechanisms of
Coatings Study of Thermal Resistance
Properties of Coatings Study of Corrosion Resistance
Properties of Coatings
Study of Gas Parameters,
Temperature & Pressure
Distribution and Stresses &
Strains Applied to the Blade
Material Selection of Coating, Thickness Calculation
Thermo-physical Properties of
Coating Mechanical Properties of
Superalloy Size of Coating & Superalloy
Interaction Area Physical & Mechanical
Properties of Coating
Test of the Selected Coating on Blade
Calculation of Stresses & Strains Applied to Coating and Life Assessment
Performance Analysis of Coated Blade, Optimization of Composition of
Coating if Needed
Fig. 7Flowchart of material selection for coatings of gas turbine blades

28
Unfortunately, YSZ and many other coatings cannot prevent the penetration of oxygen, so the
underlying layer is exposed to oxidation. In addition, the difference between thermal expansion
coefficients of coatings and superalloys can lead to thermal stresses and eventually spallation of
coatings. A layer called bond coating is applied to superalloy prior to the ceramic coating to
reduce these adverse effects.
3.3.2 Materials selection for TBCs
Since the method description is fully clarified in the previous examples, the step-by-step
explanation is skipped here. Thermal stresses caused by the difference in thermal expansion
coefficients of the blade coating and superalloy substrate is calculated by Eq. (6) as follows;
𝜎 = 𝐸𝑐(𝛼𝑇 − 𝛼𝑇𝑐)(𝑇 − 𝑇0)1 − 𝜐 (6)
where 𝐸𝑐 is the elastic modulus of coating, 𝛼𝑇 and 𝛼𝑇𝑐 are thermal expansion coefficients of
superalloy and coating, respectively, 𝜐 is the Poisson’s ratio of coating, T is the operating
temperature of the turbine, and 𝑇0 is the initial temperature. This stress should not exceed the
yield stress of coating (𝜎𝑦). Hence, the first material index is obtained as;
𝑀1 = 𝜎𝑦(1 − 𝜐)𝐸𝑐(𝛼𝑇 − 𝛼𝑇𝑐) (7)
The relatively large thickness of the applied ceramic coating can lead to high stresses due to
centrifugal loads. Therefore, its specific strength, which is defined as 𝑀2 = 𝜎𝑦𝜌 , is of great
importance. Here, 𝜎𝑦 and 𝜌 are the yield stress and density of the coating, respectively. The
first two material indices are among the beneficial criteria. Also, smaller thermal conductivity
and thermal expansion coefficient, higher melting point temperature, and good shock
resistance are of interest. So, materials indices are defined as 𝑀3 = 𝑘, 𝑀4 = 𝛼, 𝑀5 =𝑇𝑚, 𝑀6: 𝑠ℎ𝑜𝑐𝑘 𝑟𝑒𝑠𝑖𝑠𝑡𝑎𝑛𝑐𝑒. Here, 𝑘 is the thermal conductivity, 𝛼 is the thermal expansion

29
coefficient, and 𝑇𝑚 is the melting temperature point. Moreover, as all ceramics exhibit good
oxidation and corrosion resistance, these properties have been neglected. The final candidate
materials and their indices are listed in Table 11.
Table 11 Indices of candidate materials for TBCs
Materials M1 M2 M3 M4 M5 M6
ZrO2 8.76 2.74 1.62 0.7 2973 High
3YSZ 5.353 1.658 1.23 0.58 2719 Very High
8YSZ 7.933 1.898 0.83 0.21 2973 Very High
Mullite 3.152 3.571 1.39 0.14 2123 Medium
Al2O3 35.09 2.71 5.8 0.47 2323 Low
CeO2 11.37 1.37 2.77 0.86 2873 Very High
La2Zr2O7 5.464 1.667 1.56 0.54 2573 High
BaZrO3 4.728 1.818 3.42 1.25 2963 High
TiO2 3.568 2.5 3.3 0.52 2098 Low
LaPO4 8.831 2.016 1.8 0.42 2343 High
60% Mullite–40%
YSZ BC Alloy 4.142 2.66 1.31 0.39 2463 High
Similar to the gas turbine blade example, a set of five fuzzy membership functions is
considered in the domain limited by the Min-Max values of each material index of candidate
materials. Fig. 8 demonstrates membership functions for the thermal stress index (𝑀1).
Fig. 8 Defined fuzzy membership functions for M1 material index
The equivalent values are calculated according to Eqs. (1) and (2), and subsequently, the crisp
data presented in Table 11 are converted into normalized values (see Table 12).

30
Table 12 Normalized indices of candidate materials for TBCs
Materials M1 M2 M3 M4 M5 M6
ZrO2 0.258 0.596 0.757 0.498 0.9 0.7
3YSZ 0.138 0.209 0.853 0.571 0.681 0.9
8YSZ 0.233 0.296 0.9 0.866 0.9 0.9
Mullite 0.1 0.9 0.818 0.9 0.113 0.5
Al2O3 0.9 0.577 0.1 0.677 0.303 0.3
CeO2 0.303 0.1 0.578 0.368 0.816 0.9
La2Zr2O7 0.141 0.215 0.77 0.621 0.521 0.7
BaZrO3 0.125 0.277 0.491 0.1 0.895 0.7
TiO2 0.105 0.506 0.501 0.641 0.1 0.3
LaPO4 0.259 0.321 0.728 0.699 0.314 0.7
60% Mullite–40%
YSZ BC Alloy 0.114 0.552 0.837 0.711 0.45 0.7
Furthermore, material indices are considered equally important, so the weighting coefficient
for each one of them would be 1/6. The final ranking results offered by MFLM, TOPSIS, and Z-
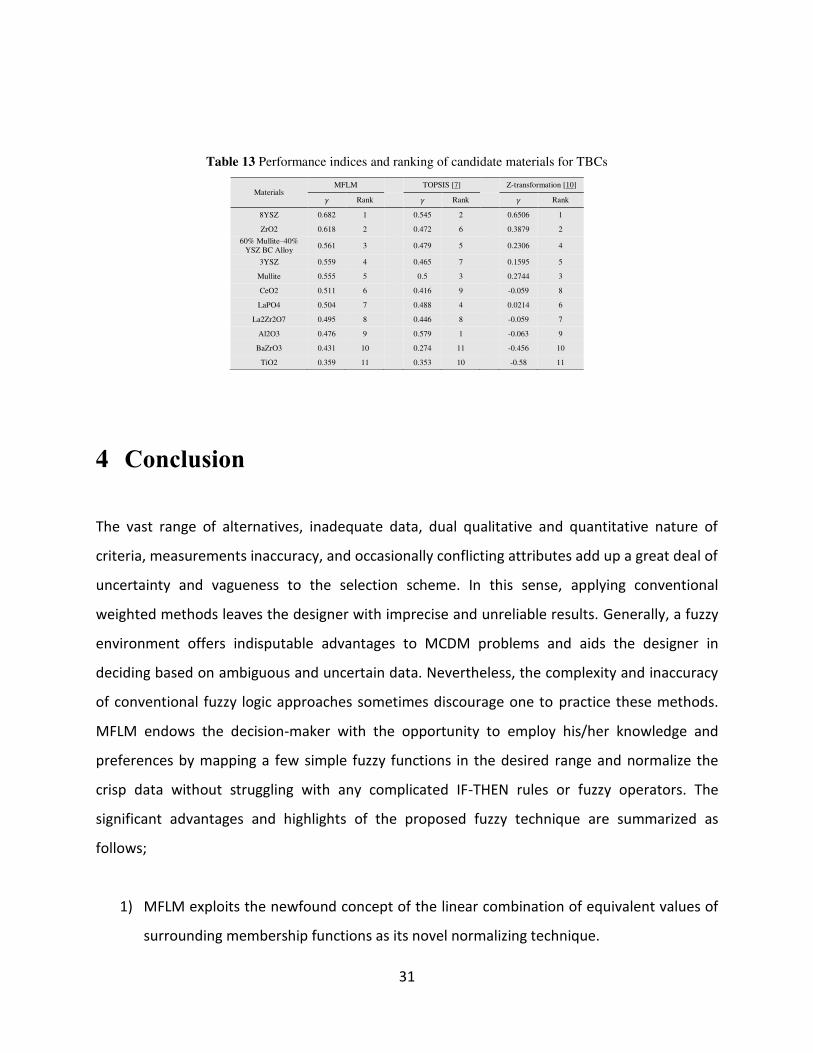
transformation methods are summarized in Table 13. As was mentioned earlier, 8YSZ material
stands in the first place by all ranking methods, except for the TOPSIS method, which allocates
the first rank to Al2O3. The compatibility of thermal expansion coefficients of Al2O3 and
superalloy substrate provides a higher thermal stress index (𝑀1) for this coating. However, it
does not justify the poor performance of Al2O3 in other indices compared to other candidates.
Sacrificing other materials indices just because of one or two extraordinary characteristics is
seen in the TOPSIS ranking. This flaw is prevented in the Modified Fuzzy Logic approach by
mapping a suitable set of fuzzy membership functions in the design interval values of candidate
materials.
Additionally, it can be inferred from Table 13 that the Z-transformation method does not notice
the better shock resistance of 8YSZ and 60% Mullite-40% YSZ BC Alloy over Mullite material;
thus, Mullite earned third place by this ranking method. According to the scaling technique of
the Z-transformation method, criteria with more dispersed values of candidate materials have
less influence on the final ranking. This approach can cause severe problems, especially when
facing qualitatively stated properties. Values attributed to the materials corresponding to these
criteria are so scattered; as a result, the Z-transformation method always underestimates these
attributes against quantitatively stated criteria. In contrast, MFLM uses equivalent values of
membership functions combined with a weighting technique to fairly evaluate the materials.
31
Table 13 Performance indices and ranking of candidate materials for TBCs
4 Conclusion
The vast range of alternatives, inadequate data, dual qualitative and quantitative nature of
criteria, measurements inaccuracy, and occasionally conflicting attributes add up a great deal of
uncertainty and vagueness to the selection scheme. In this sense, applying conventional
weighted methods leaves the designer with imprecise and unreliable results. Generally, a fuzzy
environment offers indisputable advantages to MCDM problems and aids the designer in
deciding based on ambiguous and uncertain data. Nevertheless, the complexity and inaccuracy
of conventional fuzzy logic approaches sometimes discourage one to practice these methods.
MFLM endows the decision-maker with the opportunity to employ his/her knowledge and
preferences by mapping a few simple fuzzy functions in the desired range and normalize the
crisp data without struggling with any complicated IF-THEN rules or fuzzy operators. The
significant advantages and highlights of the proposed fuzzy technique are summarized as
follows;
1) MFLM exploits the newfound concept of the linear combination of equivalent values of
surrounding membership functions as its novel normalizing technique.
Materials MFLM TOPSIS [7] Z-transformation [10] 𝛾 Rank 𝛾 Rank 𝛾 Rank
8YSZ 0.682 1 0.545 2 0.6506 1
ZrO2 0.618 2 0.472 6 0.3879 2
60% Mullite–40%
YSZ BC Alloy 0.561 3
0.479 5
0.2306 4
3YSZ 0.559 4 0.465 7 0.1595 5
Mullite 0.555 5 0.5 3 0.2744 3
CeO2 0.511 6 0.416 9 -0.059 8
LaPO4 0.504 7 0.488 4 0.0214 6
La2Zr2O7 0.495 8 0.446 8 -0.059 7
Al2O3 0.476 9 0.579 1 -0.063 9
BaZrO3 0.431 10 0.274 11 -0.456 10
TiO2 0.359 11 0.353 10 -0.58 11

32
2) It passes the data through the filter of fuzzy membership functions to add the effects of
uncertainties; thus, the produced rankings are more trustworthy than traditional
numerical approaches.
3) MFLM is able to sense the presence of a specified design interval for each criterion and
subsequently undermine the remarkable influences of out-of-box characteristics of
materials on final rankings.
4) It can simultaneously incorporate both quantitative and qualitative criteria.
5) Depending on the application and availability of required knowledge, both materials
properties and indices can be used as criteria.
6) This method does not require any complex IF-THEN rules or fuzzy operators.
7) The ranking results are independent of candidate materials.
8) The method is straightforward and can be programmed with a few lines of code.
9) Although this technique is particularly developed to facilitate the procedure of materials
selection, it can be employed to other MCDM problems as well.
10) Remarkably, MFLM outperforms the existing complicated techniques in terms of
accuracy, efficiency, and reliability.
33
Compliance with Ethical Standards
Funding:
This research did not receive any specific grant from funding agencies in the public, commercial,
or non-for-profit sectors.
Declaration of interests:
The authors declare that they have no known competing financial interests or personal
relationships that could have appeared to influence the work reported in this paper.
Ethical approval:
This article does not contain any studies with human participants or animals performed by any
of the authors.
Informed Consent:
The authors agree to submit the manuscript entiltled “Modified fuzzy logic method for
materials selection in mechanical engineering design” to the journal of Soft Computing.
34
References
[1] M. F. Ashby, “Materials selection in conceptual design,” Mater. Sci. Technol., 1989.
[2] M. F. Ashby and D. Cebon, “Materials selection in mechanical design,” J. Phys. IV Colloq.,
vol. 111, no. C7, p. 3, 1993, [Online]. Available: http://dx.doi.org/10.1051/jp4:1993701.
[3] A. M. Esawi and M. F. Ashby, “Systematic process selection in mechanical design,” Int.
Des. Eng. Tech. Conf. Comput. Inf. Eng. Conf., 1996.
[4] M. F. Ashby, “Multi-Objective Optimization in Material,” Acta Mater., vol. 48, pp. 359–
369, 2000.
[5] M. M. Farag, “Materials selection for engineering design,” Prentice Hall, 1997.
[6] B. Dehghan-Manshadi, H. Mahmudi, A. Abedian, and R. Mahmudi, “A novel method for
materials selection in mechanical design: Combination of non-linear normalization and a
modified digital logic method,” Mater. Des., vol. 28, no. 1, pp. 8–15, 2007, doi:
10.1016/j.matdes.2005.06.023.
[7] A. Shanian and O. Savadogo, “TOPSIS multiple-criteria decision support analysis for
material selection of metallic bipolar plates for polymer electrolyte fuel cell,” J. Power
Sources, vol. 159, no. 2, pp. 1095–1104, 2006, doi: 10.1016/j.jpowsour.2005.12.092.
[8] F. Dweiri and P. M. Al-Oqla, “Material selection using analytical hierarchy process,” Int. J.
Comput. Appl. Technol., vol. 26, no. 4, pp. 182–189, 2006, doi:
10.1504/IJCAT.2006.010763.
[9] P. Chatterjee, V. M. Athawale, and S. Chakraborty, “Selection of materials using
compromise ranking and outranking methods,” Mater. Des., vol. 30, no. 10, pp. 4043–
4053, 2009, doi: 10.1016/j.matdes.2009.05.016.
[10] K. Fayazbakhsh, A. Abedian, B. D. Manshadi, and R. S. Khabbaz, “Introducing a novel
method for materials selection in mechanical design using Z-transformation in statistics

35
for normalization of material properties,” Mater. Des., vol. 30, no. 10, pp. 4396–4404,
2009, doi: 10.1016/j.matdes.2009.04.004.
[11] A. Jahan, M. Y. Ismail, F. Mustapha, and S. M. Sapuan, “Material selection based on
ordinal data,” Mater. Des., vol. 31, no. 7, pp. 3180–3187, 2010, doi:
10.1016/j.matdes.2010.02.024.
[12] K. Maniya and M. G. Bhatt, “A selection of material using a novel type decision-making
method: Preference selection index method,” Mater. Des., vol. 31, no. 4, pp. 1785–1789,
2010, doi: 10.1016/j.matdes.2009.11.020.
[13] R. V. Rao and B. K. Patel, “A subjective and objective integrated multiple attribute
decision making method for material selection,” Mater. Des., vol. 31, no. 10, pp. 4738–
4747, 2010, doi: 10.1016/j.matdes.2010.05.014.
[14] A. Kasaei, A. Abedian, and A. S. Milani, “An application of quality function deployment
method in engineering materials selection,” Mater. Des., vol. 55, pp. 912–920, 2014, doi:
10.1016/j.matdes.2013.10.061.
[15] R. P. Cherian, L. N. Smith, and P. S. Midha, “Neural network approach for selection of
powder metallurgy materials and process parameters,” Artif. Intell. Eng., vol. 14, no. 1,
pp. 39–44, 2000, doi: 10.1016/S0954-1810(99)00026-6.
[16] E. I. Amoiralis, P. S. Georgilakis, and A. T. Gioulekas, “An artificial neural network for the
selection of winding Material in power transformers,” Lect. Notes Comput. Sci. (including
Subser. Lect. Notes Artif. Intell. Lect. Notes Bioinformatics), vol. 3955 LNAI, pp. 465–468,
2006, doi: 10.1007/11752912_46.
[17] C. C. Zhou, G. F. Yin, and X. B. Hu, “Multi-objective optimization of material selection for
sustainable products: Artificial neural networks and genetic algorithm approach,” Mater.
Des., vol. 30, no. 4, pp. 1209–1215, 2009, doi: 10.1016/j.matdes.2008.06.006.
[18] D. Golmohammadi, “Neural network application for fuzzy multi-criteria decision making
problems,” Int. J. Prod. Econ., vol. 131, no. 2, pp. 490–504, 2011, doi:
10.1016/j.ijpe.2011.01.015.
[19] P. J. Antony, P. Manujesh, and N. A. Jnanesh, “Data mining and machine learning
approaches on engineering materials-A review,” 2016 IEEE Int. Conf. Recent Trends

36
Electron. Inf. Commun. Technol. RTEICT 2016 - Proc., pp. 69–73, 2017, doi:
10.1109/RTEICT.2016.7807785.
[20] X. Cui, S. Wang, and S. J. Hu, “A method for optimal design of automotive body assembly
using multi-material construction,” Mater. Des., vol. 29, no. 2, pp. 381–387, 2008, doi:
10.1016/j.matdes.2007.01.024.
[21] X. Cui, H. Zhang, S. Wang, L. Zhang, and J. Ko, “Design of lightweight multi-material
automotive bodies using new material performance indices of thin-walled beams for the
material selection with crashworthiness consideration,” Mater. Des., vol. 32, no. 2, pp.
815–821, 2011, doi: 10.1016/j.matdes.2010.07.018.
[22] N. Sakundarini, Z. Taha, S. H. Abdul-Rashid, and R. A. R. Ghazila, “Optimal multi-material
selection for lightweight design of automotive body assembly incorporating
recyclability,” Mater. Des., vol. 50, pp. 846–857, 2013, doi:
10.1016/j.matdes.2013.03.085.
[23] S. Kleemann, T. Fröhlich, E. Türck, and T. Vietor, “A Methodological Approach Towards
Multi-material Design of Automotive Components,” Procedia CIRP, vol. 60, pp. 68–73,
2017, doi: 10.1016/j.procir.2017.01.010.
[24] K. Anyfantis, P. Stavropoulos, P. Foteinopoulos, and G. Chryssolouris, “An approach for
the design of multi-material mechanical components,” Proc. Inst. Mech. Eng. Part B J.
Eng. Manuf., vol. 233, no. 3, pp. 960–974, 2019, doi: 10.1177/0954405418763995.
[25] J. Zhang, Y. Huang, Y. Wang, and G. Ma, “Multi-objective optimization of concrete
mixture proportions using machine learning and metaheuristic algorithms,” Constr. Build.
Mater., vol. 253, p. 119208, 2020, doi: 10.1016/j.conbuildmat.2020.119208.
[26] A. Sadollah and A. Bahreininejad, “Optimum gradient material for a functionally graded
dental implant using metaheuristic algorithms,” J. Mech. Behav. Biomed. Mater., vol. 4,
no. 7, pp. 1384–1395, 2011, doi: 10.1016/j.jmbbm.2011.05.009.
[27] M. Jalal, A. K. Mukhopadhyay, and M. Goharzay, “Bat algorithm as a metaheuristic
optimization approach in materials and design: optimal design of a new float for different
materials,” Neural Comput. Appl., vol. 31, no. 10, pp. 6151–6161, 2019, doi:
10.1007/s00521-018-3430-4.

37
[28] T. Dokeroglu, E. Sevinc, T. Kucukyilmaz, and A. Cosar, “A survey on new generation
metaheuristic algorithms,” Comput. Ind. Eng., vol. 137, 2019, doi:
10.1016/j.cie.2019.106040.
[29] M. Abdel-Basset, L. Abdel-Fatah, and A. K. Sangaiah, Metaheuristic algorithms: A
comprehensive review. Elsevier Inc., 2018.
[30] L. A. Zadeh, “Fuzzy logic,” Comput. Complex. Theory, Tech. Appl., vol. 9781461418, pp.
1177–1200, 2013, doi: 10.1007/978-1-4614-1800-9_73.
[31] R. V. Rao, “A material selection model using graph theory and matrix approach,” Mater.
Sci. Eng. A, vol. 431, no. 1–2, pp. 248–255, 2006, doi: 10.1016/j.msea.2006.06.006.
[32] R. Sarfaraz Khabbaz, B. Dehghan Manshadi, A. Abedian, and R. Mahmudi, “A simplified
fuzzy logic approach for materials selection in mechanical engineering design,” Mater.
Des., vol. 30, no. 3, pp. 687–697, 2009, doi: 10.1016/j.matdes.2008.05.026.
[33] J. Babu, A. James, J. Philip, and S. Chakraborty, “Application of the grey-based fuzzy logic
approach for materials selection,” Int. J. Mater. Res., vol. 108, no. 9, pp. 702–709, 2017,
doi: 10.3139/146.111538.
[34] M. K. Rathod and H. V. Kanzaria, “A methodological concept for phase change material
selection based on multiple criteria decision analysis with and without fuzzy
environment,” Mater. Des., vol. 32, no. 6, pp. 3578–3585, 2011, doi:
10.1016/j.matdes.2011.02.040.
[35] A. Mayyas, M. A. Omar, and M. T. Hayajneh, “Eco-material selection using fuzzy TOPSIS
method,” Int. J. Sustain. Eng., vol. 9, no. 5, pp. 292–304, 2016, doi:
10.1080/19397038.2016.1153168.
[36] A. S. Reddy, P. R. Kumar, and P. A. Raj, “Entropy-based fuzzy TOPSIS framework for
selection of a sustainable building material,” Int. J. Constr. Manag., vol. 0, no. 0, pp. 1–
12, 2019, doi: 10.1080/15623599.2019.1683695.
[37] M. Gul, E. Celik, A. T. Gumus, and A. F. Guneri, “A fuzzy logic based PROMETHEE method
for material selection problems,” Beni-Suef Univ. J. Basic Appl. Sci., vol. 7, no. 1, pp. 68–
79, 2018, doi: 10.1016/j.bjbas.2017.07.002.
[38] O. Kulak and C. Kahraman, “Fuzzy multi-attribute selection among transportation
38
companies using axiomatic design and analytic hierarchy process,” Inf. Sci. (Ny)., vol. 170,
no. 2–4, pp. 191–210, 2005, doi: 10.1016/j.ins.2004.02.021.
[39] K. Cicek and M. Celik, “Multiple attribute decision-making solution to material selection
problem based on modified fuzzy axiomatic design-model selection interface algorithm,”
Mater. Des., vol. 31, no. 4, pp. 2129–2133, 2010, doi: 10.1016/j.matdes.2009.11.016.
[40] M. Celik, C. Kahraman, S. Cebi, and I. D. Er, “Fuzzy axiomatic design-based performance
evaluation model for docking facilities in shipbuilding industry: The case of Turkish
shipyards,” Expert Syst. Appl., vol. 36, no. 1, pp. 599–615, 2009, doi:
10.1016/j.eswa.2007.09.055.
[41] A. V. Khandekar and S. Chakraborty, “Decision-making for materials selection using fuzzy
axiomatic design principles,” Int. J. Ind. Syst. Eng., vol. 20, no. 1, pp. 117–138, 2015, doi:
10.1504/IJISE.2015.069003.
[42] R. V. Rao, “A decision making methodology for material selection using an improved
compromise ranking method,” Mater. Des., vol. 29, no. 10, pp. 1949–1954, 2008, doi:
10.1016/j.matdes.2008.04.019.
[43] M. Seo and S. Jeong, “Analysis of self-pressurization phenomenon of cryogenic fluid
storage tank with thermal diffusion model,” Cryogenics (Guildf)., vol. 50, no. 9, pp. 549–
555, 2010, doi: 10.1016/j.cryogenics.2010.02.021.
[44] N. P. Padture, M. Gell, and E. H. Jordan, “Thermal barrier coatings for gas-turbine engine
applications,” Science (80-. )., vol. 296, no. 5566, pp. 280–284, 2002, doi:
10.1126/science.1068609.
[45] D. R. Clarke, “Materials Selection Guidelines for Low Thermal Conductivity Thermal
Barrier Coatings Temperature Dependence of Thermal Conductivity Models for Thermal
Conductivity,” Surf. Coatings Technol., vol. 163–164, pp. 67–74, 2003.