modern seismic is illuminating the depths
TRANSCRIPT

Deep Mining 2019 Conference Muldersdrift, 24–25 June 2019 The Southern African Institute of Mining and Metallurgy
363
Modern seismic is illuminating the depths
R. van Buren1, G. Turner2, and G. Hird2
1HiSeis, South Africa 2HiSeis, Australia
Minerals exploration is at a point when many targets are increasingly deeper than before and often blind to the surface. Geochemistry, magnetics and many other geophysical methods are valuable and remain key tools in regional targeting. However, since they rapidly lose resolution with depth, they are still essentially 2D exploration methods. Reflection seismic provides at least an order of magnitude with greater resolution in depth than other remote sensing techniques we use to map the third dimension – the primary subsurface imaging method in the oil and gas (O&G) sector. While 3D surveys have dominated since the 1990s, seismic in hard-rock environments is now being widely accepted as a revolutionary tool, unlocking potential for both regional and detailed mine-scale projects.
INTRODUCTION Similar to more conventional and familiar aeromagnetic data, seismic can provide crustal/regional/craton-scale, camp-scale and mine-scale information, to depths even greater than those accessible through modern and other foreseeable exploration methods. It is well-known that reflection seismic technology, if applied correctly, can map lithological boundaries along with other geological structures. However, we are just beginning to learn the important role alteration has on the seismic reflection response as, like all geophysical techniques, reflection seismic relies on differences in petrophysical properties to image geology. The value of a mature structural model of in- and near-mine geology cannot be overstated when designing excavations, both surficial as well as underground. We present examples of the application of the seismic reflection method within hard-rock mineralized systems including gold and volcanogenic massive sulphide, and share learnings around the modern hard-rock seismic value proposition. Seismic methods have been used in sub-surface exploration and imaging for decades, however this use has been almost exclusively in the O&G sector for multiple reasons including:
in O&G, drilling, which is the other main tool for geological investigation, is expensive relative to drilling in mining because of the depth and because these holes essentially form the infrastructure for extraction;
drilling cannot, cost-effectively, provide accurate information on the key trap geometries;
the more complex geology in many mineralized systems was a technical challenge for seismic; and
lack of data on the key hard-rock properties which control the seismic response.
doi:10.36487/ACG_rep/1952_27_van_Buren

364
The cost of seismic has been a perceived barrier to entry in the mining industry due to the relatively lower cost of shallow drilling. However, with future resources to be found at ever increasing depths (See Figure 1), many potentially blind to surface, where drilling costs escalate non-linearly, along with the considerably lower costs of seismic equipment due to mass manufacture, seismic is becoming more economically viable as a tool. The ability to provide continuous high-resolution coverage makes it an effective and complementary tool to drilling for subsurface investigation. Apart from the different cost relationship in O&G, there is a mature, well-understood relationship between seismic parameters – velocity, and reservoir properties (porosity). In most mineralized hard-rock environments, the geology is significantly more complex due to a variety of reasons:
alteration of the rock;
structural complexity; and
metamorphism. However, if the seismic method is applied carefully, significant value has been derived, breaking many long-standing, false assumptions. The introduction and uptake of seismic in the hard-rock mining industry will likely derive similar improvements in project performance to those achieved in O&G, detailed by Aylor (1999), wherein the author presents results of an eight-year study of the effect of 3D seismic on O&G business performance – see Table I. During the period of the study, the sector saw an improvement in well success from 13 % to 47 % when applying 3D vs. the previously applied 2D seismic. Overall, in 1990, only 5 % of the wells were drilled into areas where 3D seismic had been applied – by 1997, this figure rose to 97%. Essentially, due to the significant successes, the sector mandated the application of 3D seismic prior to any well development.
Table I. The Impact of 3D Seismic on O&G business performance after Aylor (1999)
Success rate summary circa 1990 1997 Percent
Overall success rate 2D vs. 3D 13 : 47
Gas well success rate 2D vs. 3D 24 : 54
Oil well success rate 2D vs. 3D 3 : 37
Wells covered by 3D seismic 1990 vs. 1997 5 : 97
Annual drilled success rate 1990 vs. 1997 10 : 47
GEOPHYSICAL REMOTE SENSING Physical limitations affecting resolution in general While geophysical methods provide information on the sub-surface and may be applied at a variety of resolutions, physical limitations prevent the sub-surface images (or models) derived from these data from being constructed at arbitrarily high resolutions in the absence of additional constraints. This effect is manifested and easily observed in a number of ways from commonly available potential field data, for example:
when inspecting 2D (plan) data sets where laterally coincident anomalies due to sources at different depths are superimposed (overlap); or
when inspecting inversion results (most especially when recovered within a sub-surface space which has been discretised into cells / voxels – an arbitrarily small space with respect to the model size), the resolution of the recovered physical property model decreasing with increasing depth in what is often a linear relationship.
While delving into the theory of general geophysical methods is outside of the scope of this paper, further detail may be referenced from a recent and encompassing work by Dentith and Mudge (2014), Geophysics for the Mineral Exploration Geoscientist.

365
Figure 1. Depth of cover for mineral discoveries in Australia: 1850-2010. Bubble size refers to Major (>1 moz Au, >100 kt Ni, >1 mt Cu-eq.), Giant (>5 mt Cu-eq.) and Supergiant (>25 mt Cu-eq.) discoveries. Excludes
bulk minerals such as coal, bauxite and iron ore. After Schodde (2011) Physical limitations affecting Seismic resolution Physical limitations apply to all geophysical methods including potential field, electrical and electromagnetic (both natural and controlled source). The resulting resolution achievable through the application of seismic is vastly higher as the depth of investigation increases. The principal reasons are related to the wavelength of the reflected response recorded at the receivers being relatively constant with depth / travel-time as well as the ease of separability of reflections from different depths, in time. Attenuation of high frequencies is more rapid than that of lower frequencies due to the low pass filter effect of the solid earth, most significant in soft-rock and weathered zones. At depths of interest for mining and exploration of minerals systems (including their controlling structures), modern equipment allows good signal-to-noise ratios to be achieved in a range centred around 30 Hz. In hard-rock environments, velocities of acoustic waves can range over the interval <2000 - >6000 m/s. At these velocities, the centre recoverable frequency of 30 Hz translates into wavelengths from 67 m - 200 m respectively. The amplitude of the seismic responses of bed-like features reach maximums at ¼ of the wavelength (17 m - 50 m respectively for the range discussed). Below this thickness, the amplitude decreases due to destructive interference between the top and bottom contacts’ responses, see Figure 2. Depending on the physical property contrasts, individual layers can be detectable down to a few metres, which at depth is usually vastly superior to that achievable through other remotely sensed geophysical methods. As with all geophysical methods, seismics relies on contrasts in petrophysical properties. Density (𝜌) and seismic velocity (𝑉), in particular, control what is referred to as the acoustic impedance (𝐴𝐼) of the rock mass (𝐴𝐼 = 𝜌 ∗ 𝑉). Contrasts in bulk AI (across a suitable distance related to the wavelength) generate seismic reflections, the proportion of the signal reflected being related to the magnitude of the contrast.

366
Figure 2. (a) A three-layer wedge model. (b) Zero-offset synthetic seismogram displayed in normal polarity. (c) Amplitude of the synthetic extracted along the top of layer 2.Hamlyn ( 2014)
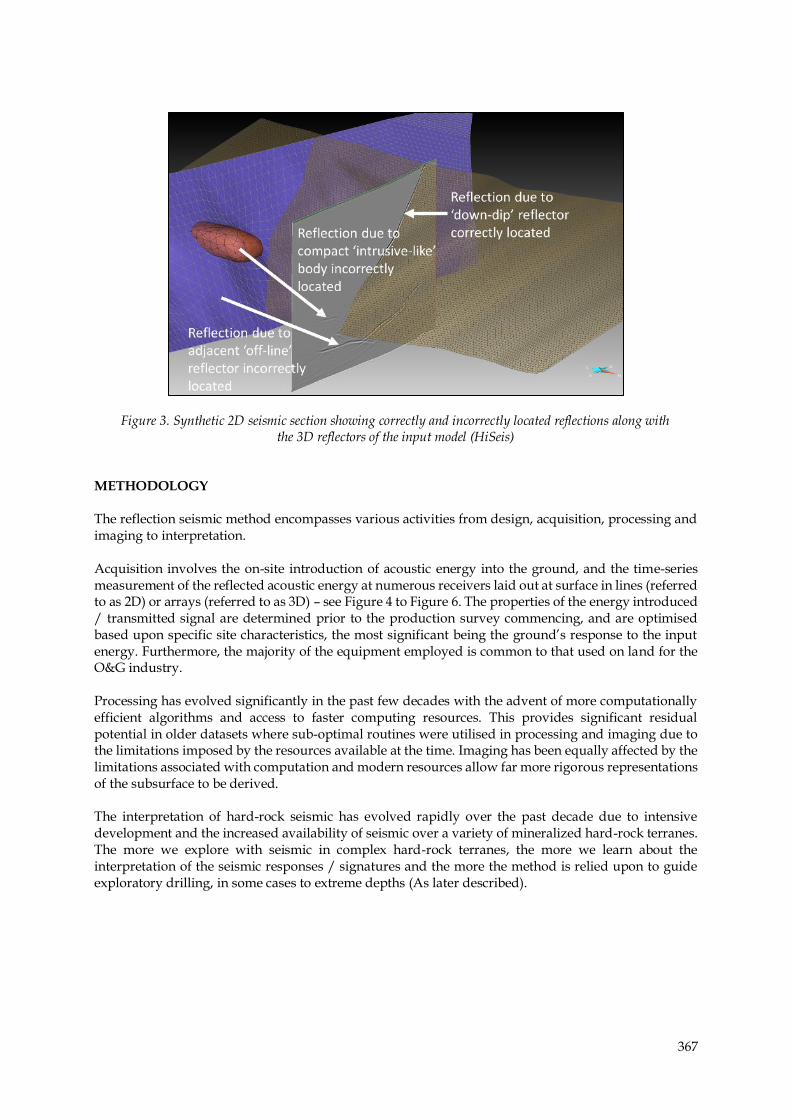
Of course, even if there is a suitable AI contrast, if the attitude (dip) of the contact is steep enough, the reflected energy may not return to the surface at all (within the survey’s physical, necessarily limited extents), in order to be measured. This concept has long limited the uptake of the method in terranes with complex, and steeply dipping geometries. However, in the past decade it has been shown that whilst theoretical, planar reflections may not be detected from these geometries, real geology is seldom ideal and many steeply dipping features including contacts, faults and shears have been successfully imaged due to their effect on the seismic response. This has been corroborated through targeted drilling campaigns from suitably-designed, modern seismic surveys, as is later described. The main difference between 2D and 3D surveys is their ability to resolve the reflected energy back to the point within the subsurface from which it was reflected. Whilst 2D acquisition takes significantly less time, equipment, labour and cost, it does lack the ability to correctly reposition these reflections in the across-line direction. Energy reflected from features adjacent to the survey line, common in areas with 3D geologic features, is projected, along with the reflections from beneath the survey line, onto a single image, usually shown on a vertical section. This effect is commonly referred to as side-swipe. Where side-swipe is significant, it results in complex patterns of constructive and destructive interference, often leading to low confidence and/or incorrect interpretations. The use of 2D seismic imaging alone (not accompanied by 3D), for drill targeting, has resulted in significantly lower success rates (See Table I) and has contributed to the lack of uptake of seismics in many hard-rock environments which are often 3D and structurally complex. An example of the manifestation of side-swipe is shown in Figure 3.
367
Figure 3. Synthetic 2D seismic section showing correctly and incorrectly located reflections along with the 3D reflectors of the input model (HiSeis)
METHODOLOGY The reflection seismic method encompasses various activities from design, acquisition, processing and imaging to interpretation. Acquisition involves the on-site introduction of acoustic energy into the ground, and the time-series measurement of the reflected acoustic energy at numerous receivers laid out at surface in lines (referred to as 2D) or arrays (referred to as 3D) – see Figure 4 to Figure 6. The properties of the energy introduced / transmitted signal are determined prior to the production survey commencing, and are optimised based upon specific site characteristics, the most significant being the ground’s response to the input energy. Furthermore, the majority of the equipment employed is common to that used on land for the O&G industry. Processing has evolved significantly in the past few decades with the advent of more computationally efficient algorithms and access to faster computing resources. This provides significant residual potential in older datasets where sub-optimal routines were utilised in processing and imaging due to the limitations imposed by the resources available at the time. Imaging has been equally affected by the limitations associated with computation and modern resources allow far more rigorous representations of the subsurface to be derived. The interpretation of hard-rock seismic has evolved rapidly over the past decade due to intensive development and the increased availability of seismic over a variety of mineralized hard-rock terranes. The more we explore with seismic in complex hard-rock terranes, the more we learn about the interpretation of the seismic responses / signatures and the more the method is relied upon to guide exploratory drilling, in some cases to extreme depths (As later described).

368
Figure 4. Typical layout of recording vehicle, receiver spread and transmitter vibroseis for a 3D survey (HiSeis)
Figure 5. ~30-ton vibroseis transmitter truck on site at an operating mine (HiSeis)
Figure 6. Typical cabled geophone receiver connected to the array (HiSeis)
Much of the success of our application of the modern hard-rock seismic method is due to the rigorous approach taken to de-risking its application to any particular site and geology. Comprehensive detailed studies are conducted prior to mobilizing any of the heavy equipment required for survey, in order to assess the suitability and likely efficacy of the method to the particular geology. This involves petrophysical property studies, forward modelling to determine optimal survey designs and, where required, in-situ investigations by various down-hole methods. Whilst providing detailed descriptions of the application of the seismic method, including the various aspects of acquisition and processing, is too extensive for incorporation in this paper, further detail may be referenced from a recent and encompassing work by Dentith and Mudge (2014), Geophysics for the Mineral Exploration Geoscientist. EXAMPLES OF THE APPLICATION OF SEISMIC WITHIN HARD-ROCK TERRANES Orogenic gold A significant benefit of seismic reflection imaging is the ability to detect structures which may be difficult to detect via sub-vertical drilling and provide a continuous image of these structures. In many gold deposits, high grade zones occur in dip or strike flexures of host structures (See Figure 7). Seismic surveys regularly map these structures, which can be difficult to detect by drilling particularly at larger depths. Two 2D surveys at Tropicana in December 2012 and July 2013 demonstrated the ability of seismic surveys to image the structures controlling mineralization. In addition to the geological information derived, significant contributions are made to the geotechnical knowledge and model of a site, aiding mine planning and development.

369
Figure 8 shows the interpreted seismic sections from these two surveys in perspective view along with
the defined, mineralized geobodies. As a result of the success of the 2D seismic surveys, AngloGold
Ashanti and the Independence Group decided to proceed with a 3D seismic survey to image the 3D
geometry of these structures down dip from the existing ore reserves. The 3D survey covered an area
of approximately 10 km2 (See
Figure ) and was completed by July 2014.
Figure 7. Plan of the Tropicana mine showing the outline of the 3D seismic survey recently acquired to image 3D geometry of these structures down dip from the existing ore reserves. After Gibbs (2014)
Figure 8. Two 2D seismic sections from Tropicana and their relation to mineralization (shown in yellow).
After Doyle (2014)
Seismic to re-invigorate a mature field The Tennant Creek Mineral Field (TCMF), in the Northern Territory of Australia, hosts a number of high-grade gold and copper deposits. The orebodies are hosted in magnetite-haematite chlorite-quartz bodies of hydrothermal origin locally known as ironstones. The ironstones themselves form within fault zones. Magnetics and gravity have proven to be effective tools for exploring for these deposits at shallow depth, however the size of the bodies is such that they would not be well-defined below a few hundred metres depth Turner et al (2016). An exploration programme in the TCMF included the completion of two 4 km seismic lines close to the Gecko mine and a 60 km N-S seismic line centred on Tennant Creek, together with borehole full waveform sonic and vertical seismic profile data. The borehole measurements confirm that the ironstone bodies and associated alteration that host the mineralization provide a strong AI contrast within the Warramunga sediments that otherwise show relatively little acoustic impedance variation. The 4 km seismic lines have generated two targets, both at approximately 1 km depth (See Figure 9). Shallow imaging was hampered by strong surface wave noise but it is the targets that are not detectable by gravity and magnetics that motivated the use of seismic at Gecko and Chariot.
370
Figure 9. Seismic reflection image showing one of the targets identifiable by distinct, strong reflector at approximately 1 km depth, Turner et al (2016)
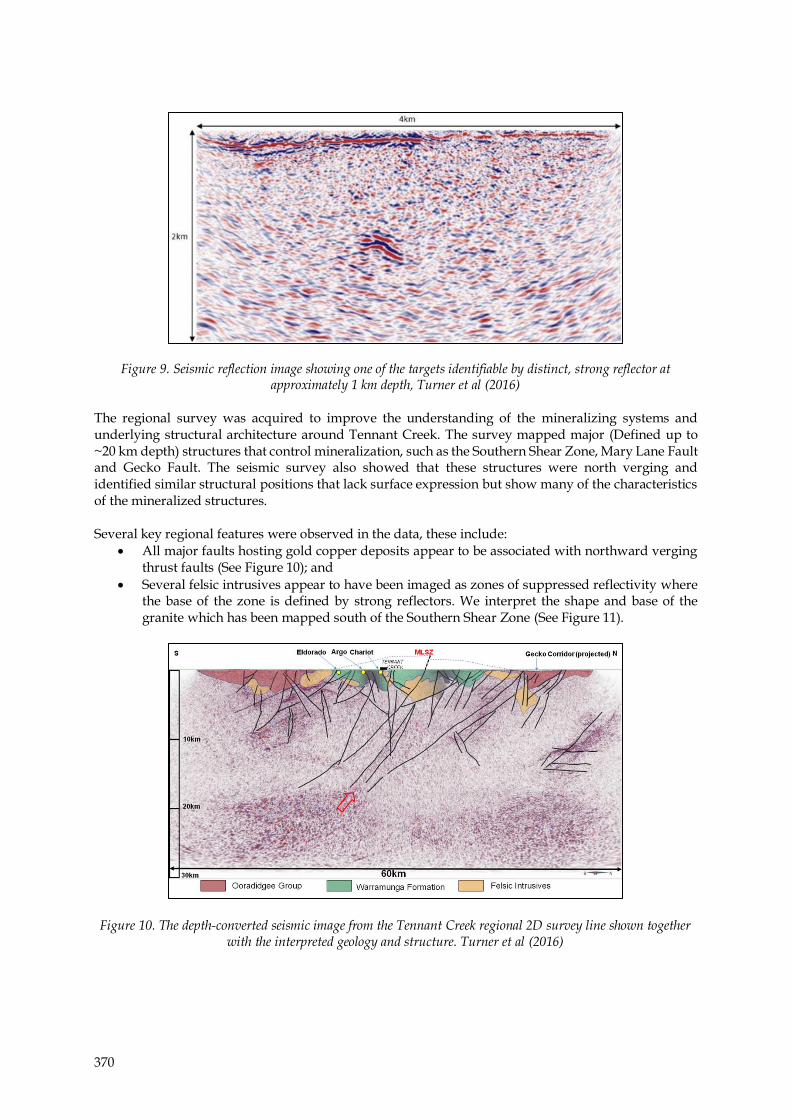
The regional survey was acquired to improve the understanding of the mineralizing systems and underlying structural architecture around Tennant Creek. The survey mapped major (Defined up to ~20 km depth) structures that control mineralization, such as the Southern Shear Zone, Mary Lane Fault and Gecko Fault. The seismic survey also showed that these structures were north verging and identified similar structural positions that lack surface expression but show many of the characteristics of the mineralized structures. Several key regional features were observed in the data, these include:
All major faults hosting gold copper deposits appear to be associated with northward verging thrust faults (See Figure 10); and
Several felsic intrusives appear to have been imaged as zones of suppressed reflectivity where the base of the zone is defined by strong reflectors. We interpret the shape and base of the granite which has been mapped south of the Southern Shear Zone (See Figure 11).
Figure 10. The depth-converted seismic image from the Tennant Creek regional 2D survey line shown together with the interpreted geology and structure. Turner et al (2016)

371
Figure 11. Zoomed-in portion of the depth-converted seismic image from the Tennant Creek regional 2D survey line shown together with the surface geology and interpretation showing the depth extent of a granite intrusion
next to the Southern Shear Zone. Turner et al (2016) The direct detection of new targets along with an improved geological and structural model from surface to depth is re-invigorating brownfields exploration within this mature field and, through the life-cycle, will contribute to improved mine design. Direct detection of mineralization It is uncommon for the seismic method to directly detect mineralization, which generally represent a low percentage of the rock-mass, therefore not significantly affecting the bulk properties. However, in certain cases where massive mineralization exists, this is possible. One example, where volcanic-sedimentary massive sulphides (VSMS) ore was detected at depth was the Neves-Corvo mineralization in Portugal. The Neves-Corvo deposits are located in the Iberian Pyrite Belt, and are mined underground, currently by Lundin Mining. The mineral deposits typically occur as lenses of polymetallic (copper, zinc, tin, lead) massive sulphides. Seven lenses have been defined comprising Neves, Corvo, Graça, Zambujal, Lombador, Semblana and Monte Branco mineralised zones. Exploration surrounding the mine has focused on the search for additional blind massive sulphide deposits and included a 3D seismic survey extending over Lombador and Semblana. Excellent imaging of the VSMS bodies was achieved to depths in excess of 1 km as can be seen in Figure 12 and Figure 13. Apart from detection and high-resolution imaging of the VMS, significant structural information is derivable from the seismic images including faults seen to offset the Lombador body. This example shows the clarity possible from 3D seismic, where the reflected energy is correctly located at the point of origin.

372
Figure 12. Seismic plan image extracted at 894 m depth showing Lombador and Semblana anomalies. Faulting of the Lombador deposit is clearly imaged. After Lundin Mining
Figure 13. NW view of seismic section through the Semblana deposit showing the high amplitude anomaly due to the VSMS as well as domains with various dips. After Lundin Mining
Mine scale geological architecture and targeting Jundee is an Archean orogenic lode-gold deposit located in the Northern Goldfields region of Western Australia owned and operated by Northern Star. The total resource mineralization plus recovered gold exceeds 10Moz. Typical of many orogenic gold deposits in the region, Jundee is made up of multiple zones of mineralization with multiple styles, orientations and within a variety of host lithologies. It is however clear that particular generations of structures play a key role, Turner et al (2018). In Nov 2016, a 3D seismic survey covering 15 km2 was acquired over the southern end of the gold system. The survey provided data to allow a detailed interpretation of the 3D geology to a depth of approximately 2 km with additional anomalous reflectivity deeper still. From petrophysical studies, it is clear that the dacite porphyry has a lower AI than the average dolerites and basalts. However, the basalt/dolerite either side of certain intervals of the dacites also has lower AI. Inspection of the core shows that these low AI zones are strongly altered, indicative of the passage of

373
significant volumes of fluids. This evidence of the passage of fluids may be an indicator to mineralization. This type of observation of the effect of alteration on reflection amplitude, together with accrued knowledge of the mineral system and geometrical relationships provided by the seismic can be used to rank and prioritise targets. In mid-2017, a hole targeting shallow mineralization (See Figure 14) was extended to test a high amplitude seismic reflector which appeared to cross-cut the overlying stratigraphy and was adjacent to one of the key structures. This hole intersected multiple significant gold intercepts within a 200 m interval. Subsequent drilling has identified that this mineralization (now named Zodiac) extends over a strike length of 1.2 km and has the largest footprint of any of the known ore zones at Jundee. The hole was eventually extended to a length of 3.2 km, a new Australian record, to test the remaining seismic targets beneath Zodiac. Northern Star’s Chief Geological Officer reported that each of the five seismic targets were intersected within 10 m of the predicted location. The Zodiac mineralization is different from any previously discovered at Jundee. The acquisition of follow-up rock property information is still underway but it is clear that the seismic mapped the structural position and it seems likely that alteration associated with the gold played a role in the strength of the observed reflectivity.
Figure 14. Seismic section from the 3D cube showing drill hole path, Zodiac and additional reflector targets along with plan view of same. Northern Star, August 2018
CONCLUSION The examples presented in this paper demonstrate roles for modern reflection seismic in the minerals industry, both for detailed exploration in known mineralized domains and to help resolve the geological architecture of a region. The ability of the modern reflection seismic method to image at very high resolution over a great range of depths encourages the generation of new targets in mature terranes and mining projects alike. The nature of major controlling structures can be better understood to aid the identification of new prospective zones, and structures compromising the stability of the rock mass delineated thereby improving safety and development in mining.

374
ACKNOWLEDGEMENTS
The authors would like to thank AngloGold Ashanti, Independence Group, Lundin Mining and
Northern Star for their assistance and permission to present these results, along with the rest of the
HiSeis team involved in the work culminating in these results. They would also like to thank the
Southern African Institute of Mining and Metallurgy (SAIMM) for the opportunity to present these
results.
REFERENCES
Aylor, W.K. Jr. (1999). Measuring the impact of 3d seismic on business performance. Journal of Petroleum
Technology, 51(6): 52-56.
Dentith, M. and Mudge, S. T. (2014). Geophysics for the mineral exploration geoscientist. Cambridge:
Cambridge University Press, 2014. 516p.
Doyle, M. (2014). Tropicana – An integrated approach to understanding granulite hosted gold, WA Department of Mines and Petroleum Albany. Fraser Orogen seismic and MT Workshop.
Gibbs, D. (2014). AngloGold Ashanti/Independence Group July 2014 Tropicana Site Visit Presentation.
Hamlyn, W. (2014). Thin beds, tuning, and AVO. The Leading Edge, 33(12), 1394, 1396.
Lundin Mining. Lundin Mining Presentation.
Schodde, R. C. (2011). Recent trends in Australian exploration. AMEC 2011 National Mining Congress.
Turner, G., Kinkela, J., Hird, G., Zulic, S., Osborne, G., Bills, R., Cuison, A., Cook, J. and Smith, R. (2016). Examples of the use of seismic reflection to re-invigorate a mature field: Tennant Creek. Proceedings of the 25th Geophysical Conference and Exhibition, ASEG-PESA-AIG 2016. Australian
Society of Exploration Geophysicists. Adelaide.
Turner, G., Kinkela, J., Hird, G., Pym, F., Smit, F., Verco, M. and Smith, R. (2018). Seismic exploration for orogenic gold in Western Australia: Identifying mid crustal controls through to drill targeting with 3D seismic. Proceedings of the 88th Annual Meeting, SEG18. Society of Exploration
Geophysicists, Anaheim.
Reece van Buren
Marketing Director
Africa with HiSeis
Reece van Buren: a geophysicist with international project, technical and managerial consulting
experience across minerals exploration, mining, O&G and civil sectors. Currently Marketing Director -
Africa with HiSeis, a specialist hard-rock seismic services company. The current President of the South
African Geophysical Association with previous employs including: Business Development Manager
with AAM Group, Chief Geophysicist within the EAME region for Fugro/CGG Multi-Physics, Senior
Specialist Geophysicist with De Beers’ mines and exploration. He holds a BSc (Hons) and a MSc, both
in geophysics from the University of the Witwatersrand.