modern pollen deposition and its use in interpreting the occupation history of the island hailuoto,...
TRANSCRIPT

Veget Hist Archaeobot (1992) 1:75-86 Vegetation History
and
lrchaeobotany © Springer-Verlag 1992
Modern pollen deposition and its use in interpreting history of the island Hailuoto, Finland S h e i l a H i c k s
Department of Geology, University of Oulu, Linnanmaa, SF-90570 Oulu, Finland
Received December 17, 1990 / Accepted March 11, 1991
the occupation
A b s t r a c t . The early vegetation history of the island Hailuoto, Finland, was investigated by means of pollen analysis. Pollen diagrams from three shallow peat profiles close to the postu- lated A.D. 1150 shoreline are interpreted with reference to modern pollen rain values, features indicative of occupation, routeways and cultivation being delimited. The differing set- tlement histories of the western and eastern parts of the present farmed area are distinguished and explained in terms of the changing coastline and availability of cultivable land. The historical evidence for changes in forest and farming condi- tions since the 16th century is also compared with the pollen evidence for the same period. Emphasis is placed on metho- dology and the development of investigation techniques ap- plicable in sparsely settled boreal forest situations.
K e y w o r d s : Pollen deposition - Human impact - Occu- pation history - Boreal region
I n t r o d u c t i o n
The island of Hailuoto, situated in the northern part of the Gulf of Bothnia (Fig. 1), at present covers an area of 200 km 2. When it first appeared, some 1900 years ago, it consisted of a relatively narrow sandy ridge orientated in a WSW-ENE direction. Being situated close to the area of maximum land uplift (9 mm year "l, K~i/iri~iinen 1953) it has changed in shape and increased in size considerably during the period of its existence. The present vegetation cover is closely related to soil type with pine forest on the sandy areas in the west and north and successional birch woodland on the more silty substrates. Spruce is scarce, occurring sporadically in the oldest forests in the centre of the island or as a climax tree in the wetter areas. The flora, as a whole, is species poor, lacking
several species which are found on the adjacent mainland (Kaakinen and Saari 1977).
At the time of the first written records, A.D. 1548 (Julku 1988) there were three separate islands but these had already joined together by 1866, as can be seen from a land ownership map of that time. The main occupation of the population, right up until 1800, was fishing and sealing; it was only during the 19th century that animal husbandry and grain cultivation assumed importance. The plough, for example, was first taken into use in the early 1800s.
E3 ,.,,od ,° Ao,,. , o , k m
Fig. 1. Map showing the outline of the island at the present time and in A.D. 1150. The former configuration of the island is based on the 7.5 m contour and a rate of land uplift of 9 mm year-1. The sites of the pollen d!agrams are indicated by dots and the inset shows the location of the island within Fennoscandia
The aim of the present investigation is to determine where the earliest settlement was located, at what stage permanent occupation of the island began and how the areas of settlement and cultivated land have expanded. Two existing pollen diag- rams from Kaisto (Reynaud and Hjelmroos 1976) and Kiimi- suo (Rrnk~i 1983) indicate possible human presence from the 12th and 14th centuries, respectively.

76
Materials and methods
Three shallow peat profiles were taken from close to the postulated A.D. 1150 shoreline (7.5 m contour) as far as possible in situations which, on the basis of coastal morpho- logy and soil type, would have been the most desirable for fishermen to occupy (Fig. 1). It seems unlikely that settlement could date from much before this time since the island in the 10th and early l l th century must have consisted solely of sand, much of which was being moved by the wind into mobile dune formations (Alestalo 1979).
Because of the shallowness of the available sediments, samples were taken at every 1 cm or, in some cases, at every 0.5 cm. Lycopodium tablets (Stockmarr 1971) were added to each sample to enable the calculation of pollen concentration and a standard laboratory preparation of boiling in 10% NaOH followed by acetolysis and, where necessary, cold HF was employed. Pollen was counted to a sum of between 500 and 1300 (excluding spores and aquatics).
Because it was expected that, in such a boreal forest environment, the pollen evidence for the presence of people who relied almost entirely on fishing would be slight, various tests with respect to present day pollen representation were made to ascertain what type of pollen evidence could be considered as indicative.
On the basis of field observations and a thorough literature search those plant species commonly occurring in four habi- tats closely related to human activity were delimited. These were: (A) settlement, which includes houses, barns, byres and the farmyard generally; (B) routeways and tracks, which covers all communication routes from roads to forest paths and also includes the ditches at the field edges; (C) fields, those cultivated both for grain and hay; (D) shore meadows which are now under natural conditions but which in the past have been carefully managed and cut for hay.
For each group of plants the relevant distinguishable pollen types are listed (Table 1). Wherever pollen identification is only possible to the level of the family, and sometimes even genus, the value of that pollen type as an indicator is, obvious- ly, diminished, particularly if the family or genus in question contains a range of species which have no relationship to human activity. Similarly any pollen type of an individual species which commonly occurs in more than one of the four habitats cannot be used alone to indicate one habitat rather than the other. For this reason the pollen types presented in Table 1 are thought of as being representative of each type of habitat only when several taxa from each group occur together, the only exception to this being the cereals. It is, of course, true that present-day farming methods differ consider- ably from those employed in the past but the strong emphasis on organic farming on the island ensures that the weed flora is far more prominent than in areas where artificial fertilizers and weed killers are commonly used. Although an overlap of species between different habitats is recognized, for the pur- pose of interpreting the present pollen diagrams each pollen type has been assigned primarily to only one habitat. Due to the poverty of species in the flora the errors thus introduced
are far smaller than they would be for a species rich area in the temperate forest zone.
Table 1. Pollen types grouped according to their indicator value with respect to various land-use categories and habitats
POLLEN TYPE Plants categorized on basis of field observations and written records
Plantago major/media Urtica Chenopodiaceae Compositae Taraxacum type Humulus/Cannabis Compositae Achillea type Compositae Solidago type Compositae Cirsium type Caryophyllaceae Epilobium Rumex acetosa/acetosella Ranunculus Rosaceae undiff. Trifolium type Vicia cracca type Campanula Rhinanthus type Polygonum bistorta type 4rtemisia Brassicaceae ~ecale Uordeum Elymus repens Polygonum aviculare ~pergula arvensis £abiatae Viola arvensis type Apiaceae Potentilla Filipendula Lysimachia Pedicularis Parnassia palustris Galium Valeriana Lathyrus palustris Poaceae Cyperaceae Equisetum
[] • [] [] [] []
[] [] [] []
[] [] [] [] [] []
o [] []
[] [] o
[] o [] [] [] []
o [] [] []
[] []
0 0
A
[] B ©
C
D
A, Settlement; B, routeways and tracks; C, fields; D, shore meadows; [] plants species considered indicative, sometimes abundant; [] frequently present; (3 present but not significant
The potentials and pitfalls of this type of approach have been amply demonstrated by Behre (1981). For Hailuoto, different categories are used from those distinguished by him as significant in northern Germany and the basis for the species grouping is present-day observations rather than the pattern of occurrence of the pollen types in pollen diagrams.
Having identified the type of pollen evidence which may be expected, it is necessary to assess the level of representation
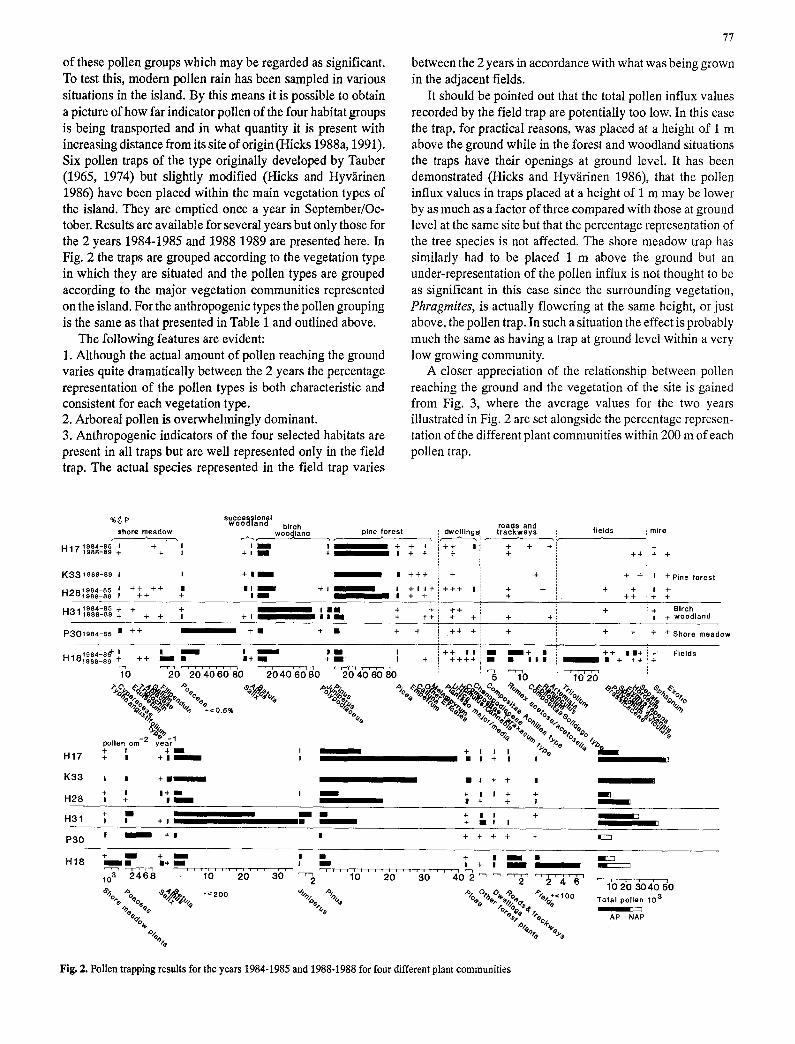
of these pollen groups which may be regarded as significant. To test this, modern pollen rain has been sampled in various situations in the island. By this means it is possible to obtain a picture of how far indicator pollen of the four habitat groups is being transported and in what quantity it is present with increasing distance from its site of origin (Hicks 1988a, 1991). Six pollen traps of the type originally developed by Tauber (1965, 1974) but slightly modified (Hicks and Hyv~irinen 1986) have been placed within the main vegetation types of the island. They are emptied once a year in September/Oc- tober. Results are available for several years but only those for the 2 years 1984-1985 and 1988 1989 are presented here. In Fig. 2 the traps are grouped according to the vegetation type in which they are situated and the pollen types are grouped according to the major vegetation communities represented on the island. For the anthropogenic types the pollen grouping is the same as that presented in Table 1 and outlined above.
The following features are evident: 1. Although the actual amount of pollen reaching the ground varies quite dramatically between the 2 years the percentage representation of the pollen types is both characteristic and consistent for each vegetation type. 2. Arboreal pollen is overwhelmingly dominant. 3. Anthropogenic indicators of the four selected habitats are present in all traps but are well represented only in the field trap. The actual species represented in the field trap varies
77
between the 2 years in accordance with what was being grown in the adjacent fields.
It should be pointed out that the total pollen influx values recorded by the field trap are potentially too low. In this case the trap, for practical reasons, was placed at a height of 1 m above the ground while in the forest and woodland situations the traps have their openings at ground level. It has been demonstrated (Hicks and Hyvfirinen 1986), that the pollen influx values in traps placed at a height of i m may be lower by as much as a factor of three compared with those at ground level at the same site but that the percentage representation of the tree species is not affected. The shore meadow trap has similarly had to be placed 1 m above the ground but an under-representation of the pollen influx is not thought to be as significant in this case since the surrounding vegetation, Phragmites, is actually flowering at the same height, or just above, the pollen trap. In such a situation the effect is probably much the same as having a trap at ground level within a very low growing community.
A closer appreciation of the relationship between pollen reaching the ground and the vegetation of the site is gained from Fig. 3, where the average values for the two years illustrated in Fig. 2 are set alongside the percentage represen- tation of the different plant communities within 200 m of each pollen trap.
% ~ p succe ion I w o o ~ a n ~ birch
shore meadow woodland pine forest
1984-85 I 4- I I i / I H 1 7 +
198~-~9 + + ~ 4- + I ~me IIIIII
K 3 3 1988-89 I I 4 - l l I l
1984-85 i 4 - + 4 - ÷ I I I I 4- I ~ I L I ~
n ~ o 1 9 8 8 - 9 9 I + ÷ + I i !
H 3 119~4-99 1989-~9 ++ + ÷ + +
roads and s: t r a c k w a y s : f ields
+ I + + I ' , + 4- 4 - ! 4- + + i -F
4 - + + + ;: + i
4 -1 i + + 4 - + J ! + 4- i i
+ + i + =
I I I + + 4- + 1 I l l + + + 4-
P 3 0 1 9 8 4 - 8 5 I 4 - + ~ • + • +
1984_85 + i l I / I I I I H 1 8 1 9 8 9 _ 8 9 -f + + I • q- i + mm I
To 2 % '2'O'4b'6'O'gO " ' 2 '0 '4b '6 '0 '80 ' ' 2 0 ' 4 ' 0 ' 6 0 ' 8 0
, + i i + + [ + !
++ + i + i I
I mire
, , + + 4 - i + +
4- 4- i I 4- P ine forest
÷+. ,++ + Birch I + woodland
+ + + Shore m e a d o w
-% ~ 6 ~ "~ e + 0 . 5 % Oeqe
pollen cm - 2 y ~ l "t- I "4- i I l
H 1 7 + a + H i I I
K 3 3 i • + H i
H 2 8 ~ +1 I + ~ "
+ + I l l I 1 4 - • i + + I r a ÷ + + + + i | • I I l i I • + + +
5 10 10 2 0
+" Fields +
~; eo£~pe %,/,~,p=£~ Oo e~ 00%%% ~,. e,.5,e.ap.,,e,, ,.9. e~
"~$ %5"%~Ye.%~. %. %. %ei.y..~,
~', e z o e
+ , , , % e % ~ , ~ . . .
• | + I ! I
i I + + I
i I + I I + 4- l I + + ; i
i + I I + i • i 4- • I f II
iii H31 I ," + , ,
P 3 0 l / + i a + + + + +
H 1 8 . . ,__,. i + I I • + l I •
• i + i I i
foa 2468 10 20 30 ~-~ 10 20 30 4 0 2 . . . . i ' " ~ ' ~ , ' ~ '
%%%% %,-too % %%
Fig. 2. Pollen trapping results for the years 1984-1985 and 1988-1988 for four different plant communities
BEZ3
t I , i 1 0 2 0 3 0 4 0 5 0
Total pollen 1 0 3
AP N A P

78
H17
Pine forest K33
H28
Areal distribution Pollen % Pollen of vegetation Average of influx IJl~ I'ji within 200m 2 years s6a°l~ @ ® o @ ~ 2950~300 ~ grainSyear - l c m -2
Birchw°°dlHa2d @ ~ ~
Field H18 ~ ) @ ~
Open Pine water forest
Shore s ~ s S i r c h meadows woodland
Field etflemenf Tracks
Fig. 3. Comparison between percentage representation of different vegetation types within a 200m radius of the pollen traps with pollen percentage and pollen influx values recorded in the same traps. The pollen values are the averages of the two years illustrated in Fig. 3
The following points should be noted: 1. For each of the pine forest sites between 20% and 30% of the pollen reaching the ground is coming from further away than 200 m. The majority of this pollen is Betula, i.e. the other dominant forest tree. The actual amount of this non-local pollen is related to the openness of the forest, the highest Betula values being recorded at trap K33, which is situated in an area which was clear felled some years ago and in which the regenerating pines are still immature and the general aspect is quite open. The birch woodland site exhibits a comparable feature with non-local pollen forming just over 20% of the total and being dominated by the other forest tree, Pinus. 2. In the shore meadow trap, in contrast, the amount of pollen of both the forest trees is very low in both influx and percent- age terms even though forest forms virtually 50% of the vegetation immediately around the trap. The spectrum is dominated by shore meadow species, particularly Poaceae. It is evident that not only is the local Phragmites contributing to the pollen rain but, more importantly, the dense reed swamp is filtering out the majority of the other local and regional pollen and preventing it from reaching the trap. This is so even though the trap is placed at 1 m above the ground.
3. The representation of forest species in the field trap is some 35% which is a little higher than would be expected. The openness of the field situation is allowing the dispersal of pollen over a greater distance. The actual influx values are probably too low because of the positioning of the trap as mentioned above. The anthropogenic species groups corre- spond to the local situation except in the case of shore meadow species. Here this group is dominated by Filipendula and Salix, both of which also occur along the ditches separating the fields.
From this it is possible to conclude that high percentages (50%) of a pollen type or group of related pollen types indicates local presence within 200 m, but that one must also take into account the openness of the vegetation which allows better dispersal, or the reverse situation, the effective filtering of dense local vegetation.
To see if there is possibly any relationship between distance and pollen influx for the anthropogenic indicator groups Fig. 4 was constructed in which the average trap results are plotted in relation to distance from the nearest dwellings, road and fields, respectively, and the nature of the intervening vegeta- tion is indicated. The material is too small to allow any statistical treatment but a visual impression is achieved. It is obvious that there is no direct correlation between pollen influx and distance but there is some suggestion that influx values of more than 200 cm 2 year 1 are found only within 200 m of the activity being represented and values of 3000-4000 cm "2 year "1 only if the activity is actually at the site. As mentioned previously, the presence of Phragmites (or com- parable dense herb vegetation) between the activity and the site of pollen deposition leads to low influx values, while open vegetation allows higher influx values.
H31 H28 -1400 -1200 -1000
H17 K3 ill 8 0 0 distmanee P3O ,, 600
40O H18 I, - 200
d elh g 0 100 grains cm-2 200 year f
H17 K38 800 H31 600 diS~man ce
-- -- 200 --- road 0 fields
1OO grail2_ s 200 ~:2
2500
Int e~enlng vegetatien
Pine forest Open pine forest Birch woodland
Fields Shore meadows Open water
o,oo U
H28 1-2400 2200 -2000 -1800 -1600 -1400 distance
rn -1200 P30 -1000
800 600 40O 20O
Herbs 0 I characteristic 100 of each activity
2 0 0 g r ~ s Poaceae aoo ~,~;~ 400 500 600 700 800 900
1000
1100 ~6oo 1200
Fig. 4. Pollen influx values for the three anthropogenic categories: dwellings, roads and fields, as recorded in the pollen traps, related to the distance of each trap from the relevant activity and the nature of the intervening vegetation

Results
The three pollen diagrams, Kittil/i (Fig. 5), Sipola (Fig. 7) and Isola (Fig. 8) are interpreted using the four anthropogenie indicator groups described for the island and the pollen per- centage and influx data obtained from the modern pollen rain studies.
Kittilii
The diagram (Fig. 5) comes from a peat deposit located just beyond the north western margin of the present cultivated area (Fig. 6). The 29 cm of organic sediment, which has accumu- lated above sand, consists of 5-6 cm of Phragmites peat overlain by a horizon rich in wood. Above this is a fibrous sedge peat with frequent wood remains which, however, become less abundant towards the surface. The topmost 7 cm of sedge peat contains only occasional pieces of wood but mosses (including Sphagnum) are common. The pollen diag- ram shows a clear succession from a typical shore meadow through Salix and Alnus carr to a birch woodland. In turnAhms and then Betula values exceed 50% of total pollen, indicating local presence as concluded on the basis of the trap results. Towards the top of the diagram, however, the percentages of Betula pollen fall as first those of Alnus and then Pinus rise. At the same time as Pinus pollen becomes prominent the sediment type changes and Cyperaceae pollen suddenly becomes important. It would seem that the hydrological con- ditions at the site changed so that the birch woodland was invaded by alder which, in turn, disappeared to be replaced by a moss-sedge community with Menyanthes (pollen and seeds were both recorded). As a result of this opening up of the vegetation Pinta pollen coming from the pine forests in the centre of the island was able to assume greater dominance in the pollen rain. Pinta values, though distinctly higher than earlier, remain below the 50% level.
A few indicator pollen types are present in the basal spectra, namely Chenopodiaceae and Urtica from the settlement group and Hordeum from the field group. These continue to be present and are later joined by species indicative of routeways. Throughout the whole of the period represented by these basal pollen spectra (24 29 cm) a dense shore meadow vegetation undoubtedly existed at the site, so one can assume a substan- tial filtering effect. In consequence these minimal values of anthropogenic indicators can be regarded as demonstrating a human presence, certainly not within the reed swamp but not far away either.
Anthropogenic pollen representation at this level of intens- ity is maintained to the sample at 16 cm, that is, throughout the successional reed swamp-willow-alder-birch phase. This is then followed by a phase in which anthropogenic indicator pollen are distinctly sparse only to increase slightly again during the more recent locally wet period (Stages 4 and 5).
The settlement and crop growing activities in the vicinity of the Kittil/i site certainly do not increase in intensity from their first initiation through to the present day but seem rather to decrease and then partially recover.
79
_= ~!
I; o
+ + - [ ; . . . . . . . . . ~ - - - ~ - + + + + Exotic AP
-- J - J - + I I P ~ Ho rdeum ~- J - _ ~ -F -F E l ymus repens
Brasslcaceae + + ..... u.._~.÷ . . . . . . . . . . . ~ % .... S t , o h y = ~ , ,
I Artemtsla -p f i - Ra f l unou lus
, -F + Papillionaceae -~- Rumex acetosa/acetosefla
Rosaceae und l f f -~- -f- + H- Rh ln~n thu~ type
f i - -~- + Cacyophyflaceae
i ~ ' " ~ P l an tago ma jo r /med ia
. . . . . . . . . . . -~c -~- . . . . . . . . . . ::L. :-~ .Compos l t ae Achillee type
- - - ~ - - ~- + o Urtlca
+ , J r+ Chenopodlaceae -p I . . . . . . . . . . Humu us /Cannab
r . . . . . . . . . . . . . . . . . . . . . . ~ ' . . . . . . . . . . . . . Trlentalls ÷ -t - + 1 - - ÷ . . . . . . . . . . ~- -~- E r i ce l es und l f f
-- + J r Empet rum + + -~- ~ m _ ~ Jr ~ L~ Ly~opod ium anno tmum
ml r~
,I ,i i ; i io;o%,
i,i,,,llll,i.! ...... .............
ii ', I N n . , , - . . n .....
, i : ° m u i I I • o Poaoeae
-}- + I + -P+ m ~ Filipendula
O~ PP° tre~t~il~ . . . . . . . . . .
P edicul~ris La thyrus palustr is
~ ' ~ a iu uJ ~ Ap ia~eae
Triglochln ~. ~ + _L ~ Jr- _ f : ', I-- Equ ise ium
! o o = [ _ • ii ~ -- II o HippurisCyperaceae
Typha angust i fol igm type
+
° ° ~ - ~ i o . ~ ~ ~
o
Fig. 5. Pollen diagram for Kittil~. Values expressed as percentages of total pollen

80
Fig. 6. Comparison between the island and the extent of the cultivated area in the years 1981 and 1766. The sites of the pollen diagrams are indicated
Sipola
This diagram comes from a shallow peat accumulation, only 23 cm in thickness, in the eastern part of the settled and cultivated area (Fig. 6). The sediment, which has accumulated on sand, is primarily a sedge peat with an admixture of mosses except for the uppermost 5 cm in which mosses dominate. Wood remains are present from 11 cm upwards, becoming more common in the uppermost moss peat. That the sedge peat contains a certain proportion of sand accounts for the shape of the loss-on-ignition curve. The uppermost moss peat has a lower level of humification and also a distinctly lower pollen concentration which suggests that it accumulated at a faster rate than the underlying sedge peat.
The pollen diagram starts with a truncated and somewhat compressed succession, the shore meadow (Poaceae, Equise- turn, Triglochin andApiaceae) and alder carr (Alnus and Salix) being represented only in the basal sand along with indications of open water (Potamogeton). This is typical of the sandy, as distinct from silty, shores on the island at the present day. There is also the possibility of a hiatus between the sand and the overlying sedge peat. For most of the diagram the two tree species Betula and Pinus dominate the pollen spectra with Pinus being the marginally more important with values con- sistently around 40% of total pollen. Pinus was obviously closer to the Sipola site throughout the time covered by the diagram than is was to the Kittilli site. At a depth of 5 cm Pinus values suddenly rise to exceed 50% of total pollen, to be followed by a similar sudden rise in Betula in the topmost sample. This coincides with the change in stratigraphy men- tioned above. As at Kittilii, there is the suggestion of a change in hydrological conditions at this point. However, here, Cyperaceae pollen representation declines rather than in- creases, as also does Sphagnum representation, presenting a ~triking contrast with the high values during the period of sedge peat accumulation. The changes are interpreted as a shift towards drier conditions and the establishment of pine forest around the site and finally the colonization of this damp hollow by Betula with an undergrowth of Polytrichum, dwarf
tu o i+.
z
o*
E o
< . . d
o ¢ D
=
gg
== o.
c
+I .g
.:.m+=
u l I I
+
+ - -
0=
u
Jlldago type /aoetosel la
iff+
ae hllle= type r~xacum type
/ m e d i a ae his
Alntls Sallx
Coryloid (Myrica)
~ . E O o j ,¢ t o o~ o eq , ¢ co 0~ o o l ,¢
o 0 _~
o O
o o
Poaoeae Viota Oxyda type
Potenfllla Parnassia palustrls LyslmachLa vulgarls Ga l l um
+ - - Apiaceae ~++ ~ Lo ~ r,g~ooh~. Equlsetum
-~ + [. to Typha angusfifolium type
+ ~ P0tamogeton
,=
~ °
~ ' , ~ - - , <
÷ +
Fig. 7. Pollen diagram for Sipola. Values expressed as percentages of total pollen

81
shrubs andMyrica as seen at the present day. This is, therefore, a closing rather than an opening up of the forest.
Pollen types of the settlement group are consistently pres- ent in the basal horizons and again in the upper horizons (6-2 cm) but, with the exception of Humulus/Cannabis type are absent from the intervening spectra. In contrast the designated field indicators are most conspicuous in this in-between phase, only Secale being recorded from the basal sediments. Of the indicators of roads and trackways, Rumex acetosa type is the only one to be continuously and consistently present, the others being somewhat more frequent in the lower half of the diagram. The distinctly poor representation of all groups in the two topmost samples is in keeping with the interpretation that woodland covered the site at this point and would have formed an effective pollen filter. Throughout, the quantity of anthropogenic indicator pollen recorded is very low but, nevertheless, seems, in total, to be more consistently and continuously present than at Kittil/i. The evidence is inter- preted in terms of early settlement nearby and then continuous cultivation at no great distance throughout the time span covered by the deposit, with settlement expanding somewhere in this eastern part in more recent times.
Isola
The peat deposit of this diagram (Fig. 8) is just less than 10 cm in thickness. The Isola site is located only a short distance from the Sipola one (Fig. 6) in the eastern part of the settlement and both its situation and stratigraphy are, in many respects, like that of Sipola. Strongly humified sedge peat with a very high proportion of sand (note the loss-on-ignition curve) has accumulated above the sandy substrate. This sand content, however, decreases noticeably in the upper layers and at the very surface there is a distinct change in sedimen t type to virtually unhumified moss and leaf litter. Because of the very compressed nature of the deposit samples were taken at 0.5 cm intervals. However, it proved impossible to obtain reliable samples from the loose uppermost material and so values are missing for that part of the diagram. It seems most likely that this material represents a change in hydrological conditions to a final drying out of the damp depression and its colonization by forest, as at Sipola. The decreasing Cyperaceae and in- creasing Pinus values in the uppermost spectrum from the sedge peat are similar and add support to this hypothesis. Today the site is covered by Betula and Pinus with a dense ground vegetation of Carex.
Pollen was extremely scarce in the underlying sand and the assemblage in the basal peat layers represents the end of the characteristic succession. The similarity with the situation at Sipola is, however, so strong that it is obvious that peat accumulation followed the same pattern as it did there. In terms of forest development Betula and Pinus pollen are more equally represented at Isola than at Sipola and both Poaceae pollen and Sphagnum spores are present at higher percentages, while the Cyperaceae pollen percentages are similar. This suggests that the local woodland in the vicinity of Isola was
of the damper successional birch type while in the area around Sipola pine forest was the more important.
The abundance, point of appearance and continuousness of occurrence of the anthropogenic indicator pollen types also parallels that at Sipola. All groups are represented in the basal sediments indicating that both settlement and cultivation oc-
_~E
°I ;I =>,
-o o
P~
~-o
e o ~ -uo
o' = .=
0~
<[
00
t I I tO ~f" ¢0 +
t~ to ~ o)¢,/ m m
II - I - m
q-
. + - -b
÷; - -t-
-t- - +
+ -
+ - H - m
II
!! i ; -b q - - -
+
m d
+ -t-- -p
- q - ~
II
~ C , ~ ¢'J CO ,¢ '-~ (0 I'-- cO O) '0 ~ ¢q , ,,; ,,;', ,, .
° fi o
Exotic AP
~" Sphagum
Menyathes
Secale Hordeum Brassicaceae
Artemisia Labiatae Ranunculus Compositae Cirsium type Rumex acetosa/acetosella Caryophyltaceae Compositae Achillea type
Compositae Taraxacum type Urtica Ptantago major/media Chenopodiaceae Humulus/Cannabis
Melampyrum Other Ericales Calluna Empetrum Lycopodium annotinum Picea
g
Pinus Juniperus Polypodiaceae
E; Betula
I<~ Alnus
[-~O Salix
. . . . . . Rosaceae(undiff,) FIlipendula
[-tO P o t e n t i l l a
Lysimachia Galium Apiaceae Trigloehin Equisetum O o
I O~°J Cyp . . . . . . . v +
Typha angustifolium
-g~ 'E o_ ~t) ~ ._
N N D
F i g . 8. Pollen diagram for Isola. Values expressed as percentages of total pollen

82
m a.~.l
20
10
0
m a.s.I,
3O
20
10
0
Hyyp~nm~ki
AD 1150 1420 1700
AD 1150 1420 1700
. . . . . s e a l e v e l at d i f ferent t i m e s
va,~u= new land 1152 -1420
rnnm= n e w land 1 4 2 0 - 1 7 0 0
mx~a= new land 1700 -p resen t
I ' - I 500 1000
m
Fig. 9. Cross sections in a NW - SE direction through the sampling sites of Sipola and Kittil~i showing the extent of new land which became available betv een A.D. 1150 and the present day
curred, not at the site, but somewhere relatively close. The presence of all three groups in the lowermost sample, rather than just settlement indicators, (NB: the pollen sum for this sample at Isola is far smaller than the basal one at Sipola) suggests that peat accumulation here started later than at Sipola. The two sites are so close to each other, only some 200 m apart, that it must be the same settlement which is being recorded in each.
The pollen evidence from these three sites indicates that settlement, with a limited amount of cultivation, occurred in both areas as soon as land became available. However, after this initial occupation the development of the western and eastern areas differs with cultivation continuing consistently in the east but diminishing and perhaps being discontinued in the west, to be resumed only in most recent times. The local woodland/forest development differs at all three sites particu- larly in respect of the proximity of pine forest. Additionally the western site (Kittil~i) shows an opening up of the forest in recent times while the eastern sites (Sipola and Isola) show a closing in of the forest to cover the sampling sites. This feature may itself be one reason for the reappearance of anthro- pogenic indicators in the pollen diagram at Kittil/i and their disappearance in the most recent horizon at Sipola.
The differing histories of the western and eastern margins of settlement can best be understood in terms of their location relative to the coast. Since fishing has always been important, a coastal location has always been desirable. The cross sec- tions illustrated in Fig. 9 show clearly how Kittil~i was left marooned and endistanced from the sea at a relatively early stage while, due to the more steeply sloping sea floor in the east, Sipola has maintained a coastal situation. Indeed a map from 1766 shows occupied farmsteads in the Sipola-Isola area but for Kittil~i there is a shadowy outline of a group of buildings and the text "ancient and abandoned". The topo-
graphy also accounts for the differences in forest history, the steeply sloping sand dunes of the east supporting pine forest while the low-lying, only very slightly undulating land of the west has mires with bordering areas of birch and alder.
Discuss ion and conc lus ions
The development of settlement can be followed, in relative terms, in the way oulined above but it is essential to tie it in to an absolute time scale. Because of the shallowness of the peat sections in .question it has not been practicable to obtain
1 4 more than one C date per section. It is, therefore, necessary I4 to combine these single C dates with calculations of the rate
of land uplift and supplement them with recognizable "marker events" taken from the historical records.
On the basis of their present height above sea level (le- velled 1988 but with reference to spot heights mapped in 1978, Maanmittaushallitus 1981) and the known rate of land uplift (9 mm year "I) the emergence of the bare mineral soil at the three sites is dated as follows:
Kittil~ Sipola Isola
Height Depth of Time of Date of a.s.l, a sediment sediment basal
accumulation sediment
8.37 m 29 cm 900 years A.D. 1080 6.97 m 23 cm 750 years A.D. 1230 6.78 m 9 cm 740 years A.D. 1240
(a the heights given in Hicks (1988a) were read by interpo- lation from the 1:20 000 map, those given here have since been obtained by levelling in the field)
Due to the uncertainties inherent in this method of calcu- lation the dates are given to the nearest decade but even this

suggests a higher precision than is justified by the method of estimation. The pollen evidence suggests that peat accumula- tion at Kittila began almost immediately after emergence but there is the possibility of a hiatus at Sipola and, with even higher probability at Isola.
Two 14C dates are available:
Kittil/i 19-20 cm Hel-2375 870-+90 B.R d 13C -28.2 Sipola 20-21 cm Hel-2347 440_+100B.R d 13C-28.7
After calibration using the curve of Stuiver (1982) the following dates are obtained:
Kittil/i A.D. 1180 (1040-1260) Sipola A.D. 1440 (1415-1490)
The time range into which the Kittil~i date falls is consider- able. The date at the older end of the range is not possible as this is older than the date for the land emergence. If a date of AD 1180 is considered this would mean the accumulation of 9 cms of peat in 100 years. The stratigraphy, herbaceous peat followed by wood peat, suggests that the rate of accumulation has not been constant. Tentative calculations based on the pollen influx values for a Phragmites community (pollen trap P30) and a knowledge of the normal life span of such a community (Vartiainen 1980) predict a sedimentation rate of 1 cm in ca. 20 years for the reedswamp section of the diagram, that is the part of the deposit between 27 and 29 cm (Hicks, in press). If this holds good for the whole of the herbaceous peat then it alone would cover 140 years. The wood peat has the highest pollen concentration values and the pollen spectrum is dominated byAlnus. Two interpretations are possible, either this represents a long span of time and, therefore, a slow accumulation rate or this is a short-lived, highly local event with a high pollen producer growing and dying actualiy at the site. The latter seems the more plausible but even this presup- poses enough time for the trees to reach maturity. It is, there- fore, concluded that a date, close to the younger end of the range, i.e. to A.D. 1260, is the most likely.
The situation at Sipola is quite different. Here the time range between the emergence of the mineral soil at A.D. 1230 and the calibrated 14C date of AD 1440, some 200 years or more, is represented by only 2 cm of sediment. This reinforces the suggestion made above that peat accumulation did not begin immediately but that there is a hiatus in the stratigraphy. Since the Isola profile has not been dated it is impossible to say how long the proposed hiatus lasted. The similarity in situation between the Sipola and Isola sites and the general pattern of the anthropogenic indicators at the latter suggests that sedimentation began shortly after it commenced at Sipola and, indeed, the diagram is interpreted as such even though the pollen concentration values do not support this view.
The conclusion is that in the Kittila area settlement (per- manent or seasonal?) began at around A.D. 1080 as land became available and that it continued with about the same degree of intensity to A.D. 1260 at least. A diagram from
83
Kaisto, just over i km to the west (Figs. 1, 6) and at a slightly higher elevation also confirms settlement with cultivation from the 11th - 12th century in this western area (Reynaud and Hjelmroos 1976). In the Sipola-Isola area land was available from around A.D. 1230 onwards but, due to the fact that sediment did not begin to accumulate immediately, it is not possible to say whether settlement also started at that time or later, though it was certainly established by A.D. 1400. Local tradition has it that the first part of the island to be occupied was Marjaniemi, the extreme, western tip. The reconstruction of the island for A.D. 1150 illustrated in Fig. 1 shows a very suitable sheltered bay at this point and it may well have been a fishing centre but the extremely dry sandy soil would make any cultivation difficult.
One possibility for dating those parts of the diagrams which are too recent to be dated by 14C is to locate within them pollen changes which can be directly related to historical events and, by this method, establish marker horizons. The historical development of the island in terms of events which can be expected to produce vegetation changes are summarized in Table 2, where five developmental stages are delimited (see Julku and Satokangas 1988 for more complete details of the history). A graphic presentation of what this is likely to mean in pollen terms is presented in Fig. 10. Here a general pollen diagram is simulated for the period A.D. 1500 until the present on the basis of known events and what is known of pollen production and distribution. For example, the overfelling of pine at the end of the 18th century should produce a lowering of Pinus pollen values and, at the same time, the very openness of the forest should allow the maximum distribution of anthro- pogenic indicators. However, at precisely this time the popu- lation of the island is only just recovering form the effects of wars, famines and the Little Ice Age and farming is still at a primitive level so, in practice there would have been few indicators to be distributed. However, at the time of maximal agricultural development in the late 19th - early 20th century, the forests have recovered and the pollen dispersal possi- bilities are once more reduced. For this reason, there is really no time during the historical period at which anthropogenic indicators can be expected to be present at values any higher than they are at the present but a diminished presence of indicators might be expected for the early 18th century. The patterns of anthropogenic pollen in the three diagrams are by no means at variance with this prediction.
Events which affect the forest or woodland composition can be expected to give a stronger pollen signal and such is the case. The change to wetter conditions and the increase in Cyperaceae in the upper part of the Kittil~i diagram is inter- preted in terms of pressure on this area as a source of winter fodder and is correlated with stage 4, while the increase in Pinus and the ensuing change to drier conditions in the upper part of the Sipola diagram is correlated with the end of stage 4 and stage 5 (Table 2, Fig. 10).
On the basis of this type of composite picture the pollen diagrams have been divided into five stages corresponding to those outlined in Table 2. In each case the section of the diagram with the maximum representation of anthropogenic

84
Table 2. Summary of changes in conditions on the island of Hailuoto during the time of written records. For sources see Julku and Satokangas (1988)
MAIN HISTORICAL EVENTS
Date Popu la t ion Means of W e a t h e r condi t ions Use of na tu r a l A.D. change s l ivel ihood Type ot" ha rves t vegetat ion
I
1950
1900
1850
1800
1750
1700
1650
1600
1550
1500
1450
Fall tn present population of 9(}0
Maximum population of 2324 in 1933
Recovery and steady growth in population
Fall in population due to famine, wars and plagues
Gradual hut slight increase in population
Settlement well established but population small
Cattle rearing with grain and hay grown in fields, end of sheep keeping
Arable farming and animal husbandry as important as fishing
Plough introduced in 1810. Barley must important crop, then rye. l.arge numbers of sheep kept
Fishing dominant, farming rather primitive
Complete cessation af farming
Fishing and sealing
Fishing and sealing but also some farming and aninml husbandry
l[arvests remain good
Harvests much improved
Some years of nmrginally better weather
Continued had weather and harvest t'filure
Wet, coht and windy weather. Some t'arms covered by blown sand. Bad harvests
llarvest generally good
Ditching of mires to impruve flu'est. Shore meadows no longer cut so hitch increases
Shore meadows crucial to the economy and their use regulated. Alder encouraged. Felling strnngly restricted so pine forests gradually recover
Overuse of forests leading to shortage of buihling timher
Forest fell ing
More inlensive use of forests for fuel
Forests scarcely affected
Stage
_ _ .

85
s t a g e
r e l a t i v e a m o u n t o f f o r e s t
field a r e a
i s l a n d s i z e
d a t e
expected p o l l e n r e p r e s e n t a t i o n
1 2 3 4 5
lilllllllllllllllllllllll[lllllllill Illllllllllllillill }
1560 • . : :~ ' . ' . . : : ' : . ' . ' . ' . ' , v:. ,:.'- "-'.'-".'-
1 6 0 0 1 7 0 0 1 8 0 0 ! 1 9 0 0 : ..... .....- .....~.......:.... L...,..:..... ........ .. . . . . . . . . . . . . . . -.-.--:. . . . . . . . . . . . . • . . . . . . . . . . . . . . . ...... : ........... A l n u s
Botu,a
• : : } : . : . : . : . ' . ' . ; . ' . . , . , ' d , ~ - . . ~, : i
P i n u s
Fields T r a c k s S e t t l e m e n t
AP dominan t AP dominan t b u t t h e % o f p i n e p o l l e n % of p i n e p o l l e n i n c r e a s e s p i n e p o l l e n dominan t . proportion of pine decregses and towards the end of the % of alder pollen pollen decreases consequently that stage. In % terms birch decreases and that of towards the end of of birch increases decreases and alder birch increases the stage increases.
pollen of groups A pollen of groups A, polleo on groups A pollen of groups A, B and pollen of groups A, end C appears in B and C present in and B appears at the C increases. These groups Band C no longer small quantities if varying quantities same ~ values as in are most evident at the increases and that settlement and in proportion to stage 2. (In absolute beginning of the stage of group D decreases. cultivation have the distance from terms they decrease when the tree pollen is Grass polles increases. been close to the the settlement to but because of the at its minimum and dispersal sampling site the sampling site open nature of the opportunities are greatest.
forest they have a Pollen of group D is far greater chance abundan t if the sampling of being dispersed) site is close to s meadow. polle, of group C decresses' at the beginning of the stage
Fig. 10. Pictorial representation of the relative changes in fort~st and field area during the time of written records together with a simulated pollen diagram constructed on the basis of the known history and pollen production and dispersal characteristics. The changing size of the island is also illustrated
indicators falls in the period before the beginning of written records, that is the 13th and 14th centuries. A diagram from Kiimisuo (R6nk~i 1983), an extensive mire in the centre of the island (Figs. 1, 6) shows the appearance of anthropogenic indicators at a level which, on the basis of the rate of sediment accumulation, has been dated to the mid 14th century. In such a situation, it is to be expected that pollen indicators are reflecting the regional situation rather than the local and that the density of settlement on the island in general must have crossed a certain threshold (e.g. Hicks 1985, 1988b). By this time the coastline in the central part of the island offered two large well sheltered bays (Fig. 11) and the new land which had arisen since the 12th century was silty and more suitable for cultivation than the old sandy core of the island. Excavations in the ruins of the wooden church of A.D. 1620 (Paavola 1988) revealed that a chapel, on the same site, had been in active use
in the 1430s at the latest, thus confirming the presence on the island of a considerable population by that time. The location of this chapel was at the end of a sand spit marking the entrance to the village harbour. A reconstruction of the view from the Kittil~i area towards the early chapel is given in Fig. 11. Obviously, for people engaged in fishing, the situation at that time was ideal but, by the 16th century, the area was already becoming isolated from the main centre of activity.
It is evident that, by using a number of different lines of approach as illustrated above, it is possible to distinguish local differences in settlement and cultivation history for a boreal forest area with a highly restricted flora. In this respect, modem day analogues in terms of pollen representation are particularly useful. Further refinements could certainly be made by making greater use of pollen influx data.

86
the preparation of the illustrations, and Michael O'Connell provided construc- tive comments on the final text. To all of them I offer my thanks. Part of the work was financed by a Research Fellowship from the Finnish Academy.
AD 8so
[ ~ 1150
13oo
1420
17oo
Fig. 11. Configuration of the shorelines for the central part of the island at different points in time on the basis of the present contour lines and the known rate of land uplift, the A.D. 1300 shoreline being interpolated with the aid of spot heights. The solid line shows the direction of the reconstructed view illustrated below, with the NW end of the line indicating the Kittil~i site. The reconstruction is as of the 14th century and looks across the bay to the sandy peninsula on which the first chapel was built
Acknowledgements I would like to thank the late Yrj6 Liimatainen who, in bringing to my attention the 1766 map of Hailuoto, presented the prospect of relating pollen influx to field size and distribution for a defined island situation. From this arose the possibility of joining the "Hailuoto in the Middle Ages" research group directed by Ky6sti Julku. I am grateful to the other group members, particularly Reija Satokangas who provided much of the historical information and Kirsti Paavola who willingly discussed the archaeology, without whose enthusiasm and support the results presented here could not have been achieved. I would also like to thank the numerous friends and colleagues who took part in the field work. Vesa-Pekka Hyv~idnen assisted with the laboratory work, Kristiina Karjalainen has helped considerably with
References
Alestalo J (1979) Land uplift and the development of the littoral and aeolian morphology on Hailuoto, Finland. In: Vasari Y, Saarnisto M, Sepp/illi M (eds) Palaeohydrology of the temperate zone. Acta Univ Ouluensis Ser A Sci Return 82:109 120
Behre K-E (1981) The interpretation of anthropogenic indicators in pollen diagrams. Pollen Spores 23:225-245
Hicks S (1985) Problems and possibilities in correlating historical/archaeo- logical and pollen-analytical evidence in a northern boreal environment: an example from Kuusamo, Finland. Fenn Archaeol 2:51-84
Hicks S (1988a) Palynological evidence for the occupation of Hailuoto (in Finnish). In: Julku K, Satokangas R (eds) Hailuodonkeskiaika. Studia Historica Septentrionalia 15, Rovaniernl, pp 33-88 (English summary)
Hicks S (1988b) The representation of different farming practices in pollen diagrams from northern Finland. In: Birks I,HH, Birks HJB, Kaland PE, Moe D (eds) The cultural landscape, past, present and future. Cambridge University Press, Cambridge, pp 189-207
Hicks S (1991) Pollen evidence for the activities of man in peripheral areas. Karjalan Tutkimuslaitoksen Julkaisusarja. (in press)
Hicks S, Hyv~rinen V-P (1986) Sampling modern pollen deposition by means of "Tauber traps": some considerations. Pollen Spores 28:219-242
Julku. K (1988) Hailuoto in the Middle Ages (in Finnish). In: Julku K Satokangas R (eds) Hailuodon keskiaika. Studla Historica Septentrionalia 15, Rovaniemi, pp 179-196 (English summary)
Julku K, Satokangas R (1988) Hailuoto in the Middle Ages (in Finnish 'Hailuodon keskiaika'). Studia Historica Septentrioalia 15, Rovaniemi (English Summaries)
Kaakinen E, Saari V (1977) More information about the vegetation of Hailuoto (in Finnish 'Lislitietoja Hailuodon kasvistoon'). Mem Soc Fauna Flora Fenn 53:87-94
K~iari~iinen E (1953) On the recent uplift of the earth's crust in Finland. Fennia 77:1-106
Maanmittaushallitus (1981) Basic map 1:20 000, 2442 12 Hailuoto. Maan- mittaushallitnksen karttapaino, Helsinki
Paavola K (1988) Domus pro templo - early stages of the Hailuoto church (in Finnish) In: Julku K, Satokangas R (eds) Hailuodon keskiaika. Studia Historica Septentrionalia 15, Rovaniemi, pp 9-34 (English summary)
Reynaud C, Hjelmroos M (1976) Vegetational history and evidence of settle- ment on I,iailuoto, Finland, established by means of pollen analysis and radiocarbon dating. Aquilo Ser Bot 14:46-60
R6nk~i A (1983) The palaeoecology of Kiimisou, Hailuoto (in Finnish 'Hai- luodon Kiimisuon paleoekologiasta'). Thesis, Department of Botany, University of Oulu
Stockmarr J (1971) Tablets with spores used in absolute pollen analysis. Pollen Spores 13:615-621
Stuiver M (1982) A high-precision calibration of the AD radiocarbon time scale. Radiocarbon 24:1-26
Tauber H (1965) Differential pollen dispersion and the interpretation of pollen diagrams. Dan Geol Unders IIR 89
Tauber H (1974) A static non-overload pollen collector. New Phytol 73: 359-369
Vartiainen T (1980) Succession of island vegetation in the land uplift area of the northernmost Gulf of Bothnia, Finland. Acta Bot Fenn 115:1-105