models for mitigating supply chain...
TRANSCRIPT
Models for Mitigating Supply Chain Disruptions
Lawrence V. Snyder
Department of Industrial & Systems EngineeringCenter for Value Chain Research
Lehigh UniversityBethlehem, PA
Enterprise-Wide Optimization (EWO) SeminarSeptember 20, 2007
Snyder (Lehigh University) Supply Chain Disruptions EWO Seminar 1 / 69

Motivation Disruptions in Multi-Stage Systems
Supply Chain Disruptions
All supply chains are subject to disruptions
Common sources
Natural disasters, weatherStrikesTerrorism, warProduct defectsEquipment breakdownsTransit/customs delaysSupplier bankruptcyetc.
Only recently have academics and practitioners studied supplydisruptions in earnest
Why the recent interest?
Snyder (Lehigh University) Supply Chain Disruptions EWO Seminar 2 / 69

Motivation Disruptions in Multi-Stage Systems
Supply Chain Disruptions Are as Old as Supply Chains
East India Company
Snyder (Lehigh University) Supply Chain Disruptions EWO Seminar 3 / 69

Motivation Disruptions in Multi-Stage Systems
Supply Chain Disruptions Are as Old as Supply Chains
Wells Fargo
Snyder (Lehigh University) Supply Chain Disruptions EWO Seminar 4 / 69

Motivation Disruptions in Multi-Stage Systems
Why the Recent Interest? (cont’d)
1 Recent high-profile disruptions
September 11 (2001)West-coast port lockout (2002)Flu vaccine shortage (2004)Hurricanes Katrina and Rita (2005)Bird-flu pandemic (???)
2 Focus on lean supply chain management
aka just-in-time (JIT), etc.Systems contain very little slackVery efficient—as long as there is little uncertaintyVery fragile—easily disruptedThere is value to having slack in a system
Snyder (Lehigh University) Supply Chain Disruptions EWO Seminar 5 / 69
Motivation Disruptions in Multi-Stage Systems
Why the Recent Interest? (cont’d)
3 Increasingly global supply chains
A single supply chain may span the globeFirms are less vertically integrated
“Manufacturing” firms may actually manufacture very littleInstead, they assemble components that are made by suppliersThomas Friedman, The World is Flat
Firms depend critically on parts from unstable regions
Unstable politically, economically, militarily, climatologically, seismically,...Barry Lynn, End of the Line
Snyder (Lehigh University) Supply Chain Disruptions EWO Seminar 6 / 69
Motivation Disruptions in Multi-Stage Systems
Cascading Disruptions
A supply chain is the system of locations and activities that moveproducts from where they are produced to where they are consumed
Supply chains consist of many locations (stages)
Stages are grouped into tiers (echelons)
Disruptions are never purely local
They cascade through the system
Upstream disruptions cause downstream stockouts
Snyder (Lehigh University) Supply Chain Disruptions EWO Seminar 7 / 69

Motivation Disruptions in Multi-Stage Systems
Cascading Disruptions: GM Example
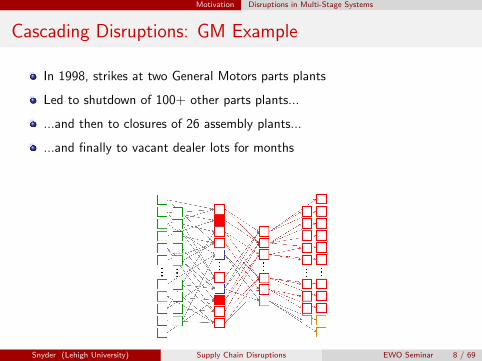
In 1998, strikes at two General Motors parts plants
Led to shutdown of 100+ other parts plants...
...and then to closures of 26 assembly plants...
...and finally to vacant dealer lots for months
500K cars, 37% ↓ sales, 33% ↓ market share, $809M qrtly loss
Snyder (Lehigh University) Supply Chain Disruptions EWO Seminar 8 / 69

Motivation Disruptions in Multi-Stage Systems
Cascading Disruptions: GM Example
In 1998, strikes at two General Motors parts plants
Led to shutdown of 100+ other parts plants...
...and then to closures of 26 assembly plants...
...and finally to vacant dealer lots for months
500K cars, 37% ↓ sales, 33% ↓ market share, $809M qrtly loss
Snyder (Lehigh University) Supply Chain Disruptions EWO Seminar 8 / 69

Motivation Disruptions in Multi-Stage Systems
A Scarier Example
A terrorist attack on New York Harbor in winter would halt shipmentsof heating fuel
New England and upstate New York would run out of heating fuelwithin 10 days
(according to national security analysis)
Even a temporary halt would have significant cascading effects
Source: Finnegan (2006)
Snyder (Lehigh University) Supply Chain Disruptions EWO Seminar 9 / 69
Motivation Disruptions in Multi-Stage Systems
Most Research is on Single-Stage Systems
Despite the importance of studying disruptions in a multi-stagecontext, most research focuses on a single stage
e.g., how should a firm plan for disruptions to its suppliers or itself?Examines purely local effects
(There are a few exceptions)
I will focus primarily on disruptions in multi-stage systems
Snyder (Lehigh University) Supply Chain Disruptions EWO Seminar 10 / 69

Motivation Disruptions in Multi-Stage Systems
Roadmap
Motivation
Literature overview
Methodology and assumptions
Supply vs. demand uncertainty
Reverse bullwhip effect
Conclusions and future research directions
Snyder (Lehigh University) Supply Chain Disruptions EWO Seminar 11 / 69

Literature Overview
Literature Overview
Snyder (Lehigh University) Supply Chain Disruptions EWO Seminar 12 / 69

Literature Overview Inventory Models
Classical Inventory Models with Supply Uncertainty
Classical models + disruptions:
ZIO: Parlar and Berkin (1991), Berk and Arreola-Risa (1994), Snyder(2006)Non-ZIO: Parlar and Perry (1995, 1996)Stochastic demand: Gupta (1996), Parlar (1997), Mohebbi (2003,2004)
Classical models + yield uncertainty
Gerchak et al. (1998), Bassok and Akella (1991), Yano and Lee (1995),Wang and Gerchak (1996)
All are single-stage models
Most must be solved numerically
Even if non-disruption models can be solved analytically
General insight:
Hold more inventory
Snyder (Lehigh University) Supply Chain Disruptions EWO Seminar 13 / 69

Literature Overview Strategic Questions
Strategic Questions
More recently, papers addressing strategic questions
What strategy is optimal?
How does this change as disruption characteristics or otherparameters change?
For example:
Optimal strategy: Tomlin (2006)Advanced warning: Tomlin and Snyder (2006)Supplier flexibility: Tomlin and Wang (2004)Effect of border closures: Lewis, Erera, and White (2005)Error from “bundling” disruptions and yield uncertainty: Chopra etal. (2006), Schmitt and Snyder (2006)
Snyder (Lehigh University) Supply Chain Disruptions EWO Seminar 14 / 69

Literature Overview Multi-Echelon Models
Multi-Echelon Models
Kim et al. (2005)
Yield uncertainty in 3-echelon SC, risk-averse objective
Hopp and Yin (2006)
Optimal placement and size of inventory and capacity buffers inassembly networkMore severe upstream disruptions =⇒ buffers further upstream
Today’s talk:Supply vs. demand uncertainty:
Snyder and Shen (2006)Schmitt, Snyder, and Shen (2007)
Reverse bullwhip effect:
Rong, Snyder, and Shen (2007a,b)
Snyder (Lehigh University) Supply Chain Disruptions EWO Seminar 15 / 69
Literature Overview A Key Result
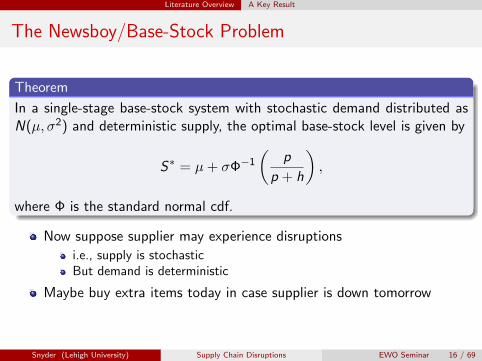
The Newsboy/Base-Stock Problem
Theorem
In a single-stage base-stock system with stochastic demand distributed asN(µ, σ2) and deterministic supply, the optimal base-stock level is given by
S∗ = µ + σΦ−1
(p
p + h
),
where Φ is the standard normal cdf.
Now suppose supplier may experience disruptions
i.e., supply is stochasticBut demand is deterministic
Maybe buy extra items today in case supplier is down tomorrow
Snyder (Lehigh University) Supply Chain Disruptions EWO Seminar 16 / 69
Literature Overview A Key Result
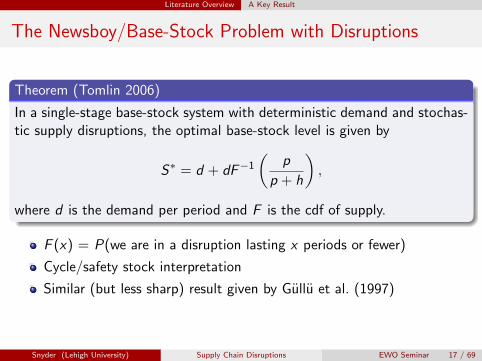
The Newsboy/Base-Stock Problem with Disruptions
Theorem (Tomlin 2006)
In a single-stage base-stock system with deterministic demand and stochas-tic supply disruptions, the optimal base-stock level is given by
S∗ = d + dF−1
(p
p + h
),
where d is the demand per period and F is the cdf of supply.
F (x) = P(we are in a disruption lasting x periods or fewer)
Cycle/safety stock interpretation
Similar (but less sharp) result given by Gullu et al. (1997)
Snyder (Lehigh University) Supply Chain Disruptions EWO Seminar 17 / 69

Literature Overview A Key Result
Are DU and SU the same?
This theorem suggests a symmetry between demand uncertainty (DU)and supply uncertainty (SU)
Maybe they are two sides of the same coin?
Under both DU and SU, the main issue is the same:
Not enough supply to meet demandMay be irrelevant whether mismatch came from DU or SU
Moreover, mitigation strategies are similar for DU and SU
Inventory, excess capacity, supplier redundancy, etc.
The good news:
We know a lot about supply chains under DU
The bad news:
The “conventional wisdom” from DU is often wrong under SU!
Snyder (Lehigh University) Supply Chain Disruptions EWO Seminar 18 / 69
Methodology and Assumptions
Methodology and Assumptions
Snyder (Lehigh University) Supply Chain Disruptions EWO Seminar 19 / 69

Methodology and Assumptions Methodology
Methodology
Some of our results are proved analyticallyKey theoretical results:
Tomlin (2006): optimal base-stock level in single-stage system withdisruptionsOthers that I’ll present later
Others we demonstrate using simulation
BaseStockSim softwareRough optimization of base-stock levels
Snyder (Lehigh University) Supply Chain Disruptions EWO Seminar 20 / 69

Methodology and Assumptions Methodology
BaseStockSim
Snyder (Lehigh University) Supply Chain Disruptions EWO Seminar 21 / 69

Methodology and Assumptions Assumptions
Supply Chain Assumptions
Multi-echelon SC
Each stage has processing function and output buffer:
2 1
May represent physical location, processing activity, or SKU
Excess demands are backordered
Costs h, p
Deterministic processing (lead) time T
Snyder (Lehigh University) Supply Chain Disruptions EWO Seminar 22 / 69

Methodology and Assumptions Assumptions
Demand and Supply Processes
Under DU, demands are N(µ, σ2)
Under SU, disruption process follows 2-state Markov process
Disruption probability αRecovery probability βSimplest case:
Capacity = ∞ when UPCapacity = 0 when DOWN(But can make it more general)
UP DOWN
α1 − α
β 1 − β
Snyder (Lehigh University) Supply Chain Disruptions EWO Seminar 23 / 69

Supply vs. Demand Uncertainty
Supply vs. Demand Uncertainty
Snyder (Lehigh University) Supply Chain Disruptions EWO Seminar 24 / 69

Supply vs. Demand Uncertainty Roadmap
SU vs. DU: Roadmap
1 Order frequency2 Centralization vs. decentralization
The risk-diversification effectDU and SUImplication for facility location
3 Supplier redundancy
4 The cost of reliability
Snyder (Lehigh University) Supply Chain Disruptions EWO Seminar 25 / 69
Supply vs. Demand Uncertainty Order Frequency
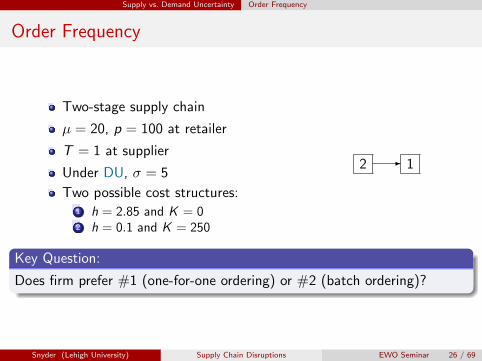
Order Frequency
Two-stage supply chain
µ = 20, p = 100 at retailer
T = 1 at supplier
Under DU, σ = 5
Two possible cost structures:1 h = 2.85 and K = 02 h = 0.1 and K = 250
2 1-
Key Question:
Does firm prefer #1 (one-for-one ordering) or #2 (batch ordering)?
Snyder (Lehigh University) Supply Chain Disruptions EWO Seminar 26 / 69

Supply vs. Demand Uncertainty Order Frequency
Order Frequency: DU
Option 1: h = 2.85, K = 0
Base-stock policy is optimal, with
S∗ = µ + σΦ−1
(p
p + h
)≈ 30
E[cost] ≈ 32.8
Option 2: h = 0.1, K = 250
(s,S) policy is optimal with
s∗ ≈ 31, S∗ ≈ 349
E[cost] ≈ 32.8
So the firm is indifferent between the two options under DU
Snyder (Lehigh University) Supply Chain Disruptions EWO Seminar 27 / 69
Supply vs. Demand Uncertainty Order Frequency
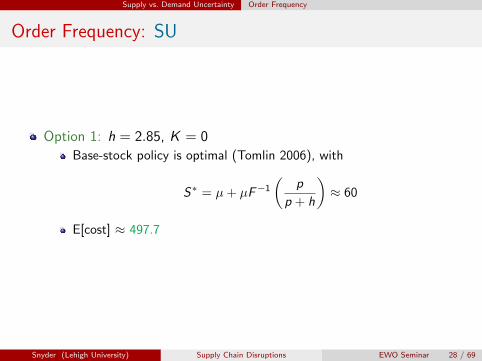
Order Frequency: SU
Option 1: h = 2.85, K = 0
Base-stock policy is optimal (Tomlin 2006), with
S∗ = µ + µF−1
(p
p + h
)≈ 60
E[cost] ≈ 497.7
Snyder (Lehigh University) Supply Chain Disruptions EWO Seminar 28 / 69

Supply vs. Demand Uncertainty Order Frequency
Order Frequency: SU
Optimal policy not known:
Deterministic demandStochastic disruptions(Possibly) non-zero fixed cost
Conjecture
Under deterministic demand and stochastic disruptions, an (s,S) policy isoptimal.
Proof will rely on establishing K -convexity of objective function
Lemma (Schmitt, Snyder, and Shen 2007)
s∗ and S∗ are integer multiples of µ.
Snyder (Lehigh University) Supply Chain Disruptions EWO Seminar 29 / 69

Supply vs. Demand Uncertainty Order Frequency
Order Frequency: SU
Option 2: h = 0.1, K = 250
s∗ ≈ 40, S∗ ≈ 340, E[cost] ≈ 391.1(Recall: under base-stock policy, E[cost] ≈ 497.7)
So the batch ordering policy is preferred
Why?
If an order is disrupted, the impact is the same under either policyBut the likelihood of a disruption affecting an order is smaller underbatch policy
Snyder (Lehigh University) Supply Chain Disruptions EWO Seminar 30 / 69
Supply vs. Demand Uncertainty Order Frequency
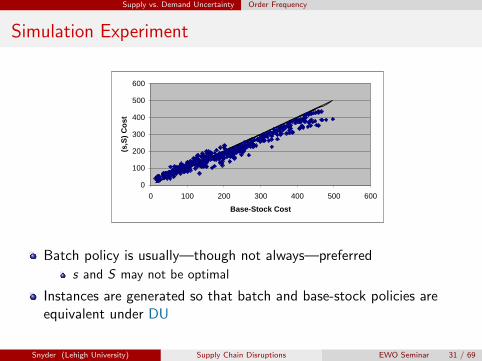
Simulation Experiment
0
100
200
300
400
500
600
0 100 200 300 400 500 600
Base-Stock Cost
(s,S
) Cos
t
Batch policy is usually—though not always—preferred
s and S may not be optimal
Instances are generated so that batch and base-stock policies areequivalent under DU
Snyder (Lehigh University) Supply Chain Disruptions EWO Seminar 31 / 69

Supply vs. Demand Uncertainty Centralization vs. Decentralization
Centralization vs. Decentralization
One warehouse, multi-retailer (OWMR)system
Cost of holding inventory is equal at thetwo echelons
Lead times are negligible
4
1
2
3
-����
@@@R
Key Question:
Should we hold inventory at the warehouse or at the retailers?
(Equivalently: Should we centralize many stocking points into one?)
Snyder (Lehigh University) Supply Chain Disruptions EWO Seminar 32 / 69

Supply vs. Demand Uncertainty Centralization vs. Decentralization
OWMR under DU
Let CD , CC be cost under decentralized and centralized systems, resp.
Theorem (Eppen 1979)
Under DU,
E [CD ] ∝ N
E [CC ] ∝√
N
Therefore, centralization is optimal
The risk-pooling effect
Snyder (Lehigh University) Supply Chain Disruptions EWO Seminar 33 / 69

Supply vs. Demand Uncertainty Centralization vs. Decentralization
OWMR under SU
Under SU:
Disruptions affect inventory sitesIn decentralized system, a disruption affects one retailerIn centralized system, a disruption affects the whole supply chain
Theorem (Schmitt, Snyder, and Shen 2007)
Under SU,
(a) E [CD ] = E [CC ]
(b) V [CD ] ∝ NV [CC ] ∝ N2
Therefore decentralization is preferable
We call this the risk-diversification effect
Snyder (Lehigh University) Supply Chain Disruptions EWO Seminar 34 / 69

Supply vs. Demand Uncertainty Centralization vs. Decentralization
OWMR under DU and SU
What if both DU and SU are present?
Numerical results suggest risk-diversification usually trumpsrisk-pooling
Even if disruptions are relatively rareEven if demand uncertainty is relatively highEven if decision maker is relatively risk averse
Single-stage problem with DU and SU is significantly harder
Snyder (Lehigh University) Supply Chain Disruptions EWO Seminar 35 / 69
Supply vs. Demand Uncertainty Centralization vs. Decentralization
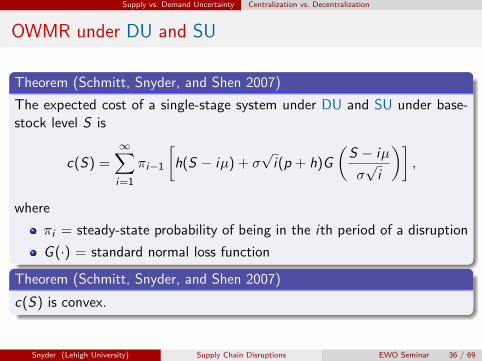
OWMR under DU and SU
Theorem (Schmitt, Snyder, and Shen 2007)
The expected cost of a single-stage system under DU and SU under base-stock level S is
c(S) =∞∑i=1
πi−1
[h(S − iµ) + σ
√i(p + h)G
(S − iµ
σ√
i
)],
where
πi = steady-state probability of being in the ith period of a disruption
G (·) = standard normal loss function
Theorem (Schmitt, Snyder, and Shen 2007)
c(S) is convex.
Snyder (Lehigh University) Supply Chain Disruptions EWO Seminar 36 / 69
Supply vs. Demand Uncertainty Centralization vs. Decentralization
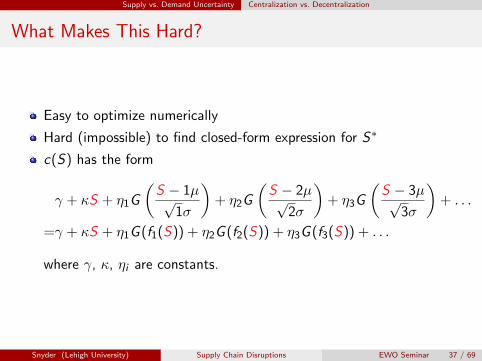
What Makes This Hard?
Easy to optimize numerically
Hard (impossible) to find closed-form expression for S∗
c(S) has the form
γ + κS + η1G
(S − 1µ√
1σ
)+ η2G
(S − 2µ√
2σ
)+ η3G
(S − 3µ√
3σ
)+ . . .
=γ + κS + η1G (f1(S)) + η2G (f2(S)) + η3G (f3(S)) + . . .
where γ, κ, ηi are constants.
Snyder (Lehigh University) Supply Chain Disruptions EWO Seminar 37 / 69
Supply vs. Demand Uncertainty Centralization vs. Decentralization
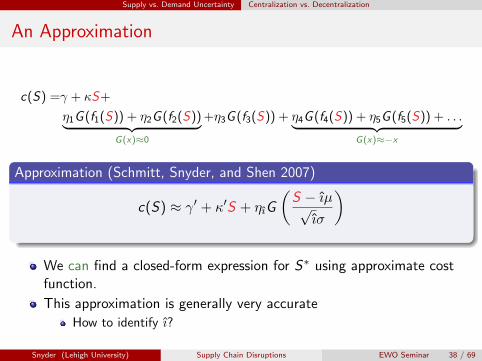
An Approximation
c(S) =γ + κS+
η1G (f1(S)) + η2G (f2(S))︸ ︷︷ ︸G(x)≈0
+η3G (f3(S)) + η4G (f4(S)) + η5G (f5(S)) + . . .︸ ︷︷ ︸G(x)≈−x
Approximation (Schmitt, Snyder, and Shen 2007)
c(S) ≈ γ′ + κ′S + ηıG
(S − ıµ√
ıσ
)
We can find a closed-form expression for S∗ using approximate costfunction.
This approximation is generally very accurate
How to identify ı?
Snyder (Lehigh University) Supply Chain Disruptions EWO Seminar 38 / 69
Supply vs. Demand Uncertainty Implication for Facility Location
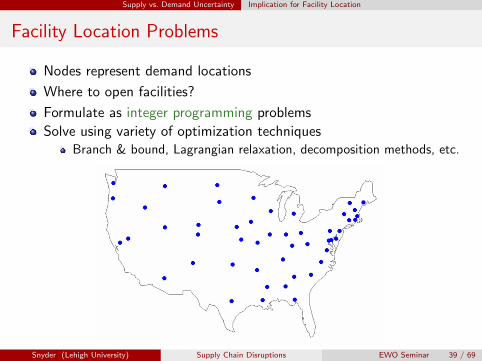
Facility Location Problems
Nodes represent demand locations
Where to open facilities?
Formulate as integer programming problems
Solve using variety of optimization techniquesBranch & bound, Lagrangian relaxation, decomposition methods, etc.
Snyder (Lehigh University) Supply Chain Disruptions EWO Seminar 39 / 69

Supply vs. Demand Uncertainty Implication for Facility Location
Facility Location Problems
Nodes represent demand locations
Where to open facilities?
Formulate as integer programming problems
Solve using variety of optimization techniquesBranch & bound, Lagrangian relaxation, decomposition methods, etc.
Snyder (Lehigh University) Supply Chain Disruptions EWO Seminar 39 / 69
Supply vs. Demand Uncertainty Implication for Facility Location
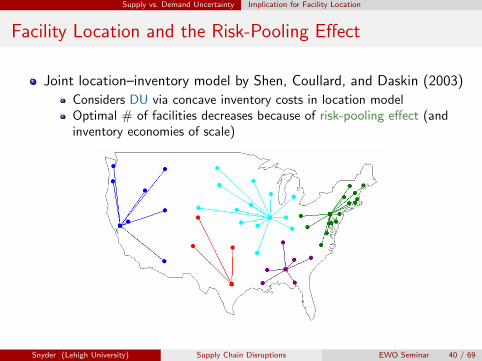
Facility Location and the Risk-Pooling Effect
Joint location–inventory model by Shen, Coullard, and Daskin (2003)
Considers DU via concave inventory costs in location modelOptimal # of facilities decreases because of risk-pooling effect (andinventory economies of scale)
Snyder (Lehigh University) Supply Chain Disruptions EWO Seminar 40 / 69
Supply vs. Demand Uncertainty Implication for Facility Location
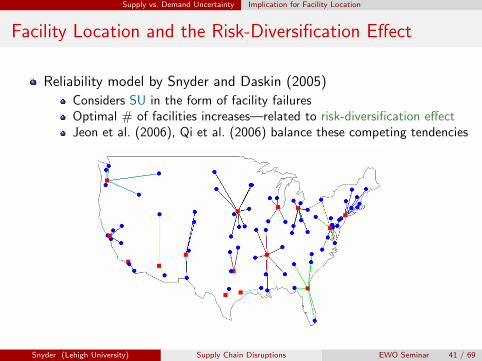
Facility Location and the Risk-Diversification Effect
Reliability model by Snyder and Daskin (2005)
Considers SU in the form of facility failuresOptimal # of facilities increases—related to risk-diversification effectJeon et al. (2006), Qi et al. (2006) balance these competing tendencies
Snyder (Lehigh University) Supply Chain Disruptions EWO Seminar 41 / 69
Supply vs. Demand Uncertainty Supplier Redundancy
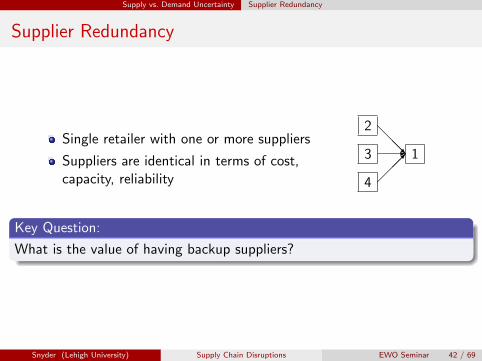
Supplier Redundancy
Single retailer with one or more suppliers
Suppliers are identical in terms of cost,capacity, reliability
2
3
4
1
@@@R-
����
Key Question:
What is the value of having backup suppliers?
Snyder (Lehigh University) Supply Chain Disruptions EWO Seminar 42 / 69

Supply vs. Demand Uncertainty Supplier Redundancy
Supplier Redundancy under DU
Under DU, second supplier provides value if capacities are tight
e.g., if capacity = µ + σBut value decreases quickly as capacity increasesThird, etc. suppliers provide little value
Snyder (Lehigh University) Supply Chain Disruptions EWO Seminar 43 / 69
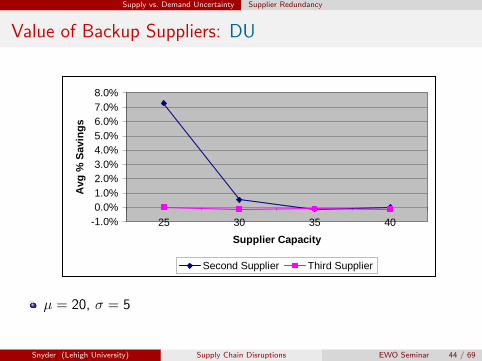
Supply vs. Demand Uncertainty Supplier Redundancy
Value of Backup Suppliers: DU
-1.0%0.0%1.0%2.0%3.0%4.0%5.0%6.0%7.0%8.0%
25 30 35 40
Supplier Capacity
Avg
% S
avin
gs
Second Supplier Third Supplier
µ = 20, σ = 5
Snyder (Lehigh University) Supply Chain Disruptions EWO Seminar 44 / 69
Supply vs. Demand Uncertainty Supplier Redundancy
Supplier Redundancy under SU
Under SU, second supplier provides great benefit
Fills in when primary supplier is disruptedAlso helps ramp back up after disruptionEven third+ supplier provides some benefit
Snyder (Lehigh University) Supply Chain Disruptions EWO Seminar 45 / 69

Supply vs. Demand Uncertainty Supplier Redundancy
Value of Backup Suppliers: SU
0%
20%
40%
60%
80%
100%
120%
25 30 35 40
Supplier Capacity
Avg
% S
avin
gs
fro
m S
eco
nd
Su
pp
lier
(0.001, 0.1)
(0.01, 0.3)
(0.05, 0.5)
(0.1, 0.7)
(0.2, 0.9)
Overall
Snyder (Lehigh University) Supply Chain Disruptions EWO Seminar 46 / 69

Supply vs. Demand Uncertainty Cost of Reliability
The Cost of Reliability
Firms are accustomed to planning for DU
Often reluctant to plan for SU if it requires large investment
Key Question:
How much DU cost must be sacrificed to achieve a given level of reliability?
The short answer: Not much
Snyder (Lehigh University) Supply Chain Disruptions EWO Seminar 47 / 69
Supply vs. Demand Uncertainty Cost of Reliability
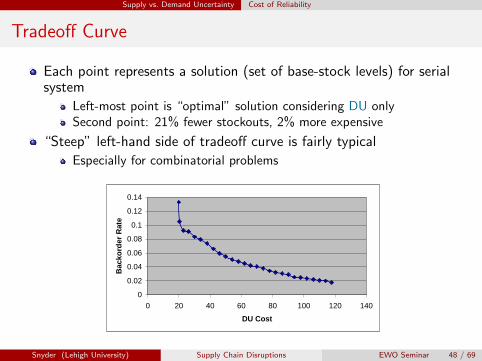
Tradeoff Curve
Each point represents a solution (set of base-stock levels) for serialsystem
Left-most point is “optimal” solution considering DU onlySecond point: 21% fewer stockouts, 2% more expensive
“Steep” left-hand side of tradeoff curve is fairly typical
Especially for combinatorial problems
0
0.02
0.04
0.06
0.08
0.1
0.12
0.14
0 20 40 60 80 100 120 140
DU Cost
Bac
kord
er R
ate
Snyder (Lehigh University) Supply Chain Disruptions EWO Seminar 48 / 69
The Reverse Bullwhip Effect
The Reverse Bullwhip Effect
Snyder (Lehigh University) Supply Chain Disruptions EWO Seminar 49 / 69
The Reverse Bullwhip Effect Motivation
Motivation: Hurricane Katrina
Hurricanes Katrina and Rita crippled U.S. oil drilling and refiningcapacity
As a result, demand for gasoline became very volatile
The classical bullwhip effect (BWE):
Demand volatility increases as we move upstreamSterman (1989), Lee, Padmanabhan, and Whang (1997a,b)
We conjecture that the reverse bullwhip effect (RBWE) occurredafter Katrina and Rita:
Demand volatility increases as we move downstream
Snyder (Lehigh University) Supply Chain Disruptions EWO Seminar 50 / 69

The Reverse Bullwhip Effect Motivation
Empirical Evidence
Recent empirical study
Only 50% of industries exhibited BWEOnly 18% after data are deseasonalizedCachon, et al. (2006)
Behavioral studies using beer gameMany find a significant portion of players not exhibiting BWECroson et al. (2003, 2004, 2006), Kaminski and Simchi-Levi (2000),Wu and Katok (2005)
Snyder (Lehigh University) Supply Chain Disruptions EWO Seminar 51 / 69

The Reverse Bullwhip Effect Motivation
String-Vibration Analogy
With no amplification
With a demand shock
With a fixed point upstream
With a supply shock
Snyder (Lehigh University) Supply Chain Disruptions EWO Seminar 52 / 69

The Reverse Bullwhip Effect Beer Game Experiment
Beer Game Experiment
Like classical beer game, but
No demand uncertaintySupply disruptions
0
5
10
15
20
25
30
35
Retailer Wholesaler Distributor Manufacturer
Dem
and
SD
(Heavy blue curve is aggregate.)
Snyder (Lehigh University) Supply Chain Disruptions EWO Seminar 53 / 69
The Reverse Bullwhip Effect Capacity/Price/Demand Model
Capacity/Price/Demand Model
Model describes relationship between random capacity and resultingprice and demand
Use it to demonstrate that capacity shocks create RBWE
2 stages, supplier and buyer
Supplier’s capacity follows process {ct}∞t=1
Capacity changes produce price changes
Buyer anticipates future price changes and sets demand accordingly
Linear, downward-sloping demand curve
We assume capacity is always tight
i.e., supplier’s production quantity always equals capacity
Snyder (Lehigh University) Supply Chain Disruptions EWO Seminar 54 / 69

The Reverse Bullwhip Effect Capacity/Price/Demand Model
Notation
c = supplier’s production capacity = production quantity
p = equilibrium price
Q = quantity demanded by buyer
All state variables are indexed by t (time)
Snyder (Lehigh University) Supply Chain Disruptions EWO Seminar 55 / 69

The Reverse Bullwhip Effect Capacity/Price/Demand Model
Capacity Process
For now, we assume a deterministic process for ct
t
ct
Many of our results can also be proven for iid random ct
We intend to extend to more general capacity processes
Snyder (Lehigh University) Supply Chain Disruptions EWO Seminar 56 / 69

The Reverse Bullwhip Effect Capacity/Price/Demand Model
Capacity =⇒ Price
For each capacity ct we determine market-clearing price pt
Q
P
ct
pt
bt-1
m
pt = mct + bt−1
Snyder (Lehigh University) Supply Chain Disruptions EWO Seminar 57 / 69

The Reverse Bullwhip Effect Capacity/Price/Demand Model
Price =⇒ Demand Curve Shift
Buyer observes price pt and change in price from last periodAdjusts demand curve based on change in price
Assumes price trend will continueReplaces pt with pt − r(pt − pt−1)r ∈ [0, 1) is a “reaction factor”
Q
P
pt–1
bt–1
ct
pt
pt =1
1− r[mct + bt−1 − rpt−1]
Snyder (Lehigh University) Supply Chain Disruptions EWO Seminar 58 / 69

The Reverse Bullwhip Effect Capacity/Price/Demand Model
Demand Curve =⇒ Order Quantity
Q
P
pt–1
bt–1
ct
pt
New curve (and current price) =⇒ demand:
Qt =(1− r)pt + rpt−1 − b
m
Snyder (Lehigh University) Supply Chain Disruptions EWO Seminar 59 / 69

The Reverse Bullwhip Effect Capacity/Price/Demand Model
Demand Curve =⇒ Order Quantity
Q
P
pt–1
bt–1
ct
pt
Qt
New curve (and current price) =⇒ demand:
Qt =(1− r)pt + rpt−1 − b
m
Snyder (Lehigh University) Supply Chain Disruptions EWO Seminar 59 / 69
The Reverse Bullwhip Effect Capacity/Price/Demand Model
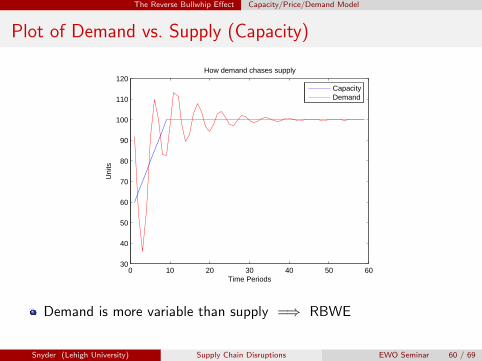
Plot of Demand vs. Supply (Capacity)
0 10 20 30 40 50 6030
40
50
60
70
80
90
100
110
120
Time Periods
Uni
ts
How demand chases supply
CapacityDemand
Demand is more variable than supply =⇒ RBWE
Snyder (Lehigh University) Supply Chain Disruptions EWO Seminar 60 / 69

The Reverse Bullwhip Effect Capacity/Price/Demand Model
Approximation of Demand Variance
pt is polynomial function of r
(Recall: r = shift in demand curve)
Let pt = first-order approximation of pt with respect to r
And Qt the resulting demand
Then we calculate the variance of Qt
Key Question: Is
V (Qt) > V (ct) [RBWE] orV (Qt) < V (ct) [BWE]?
Snyder (Lehigh University) Supply Chain Disruptions EWO Seminar 61 / 69
The Reverse Bullwhip Effect Capacity/Price/Demand Model
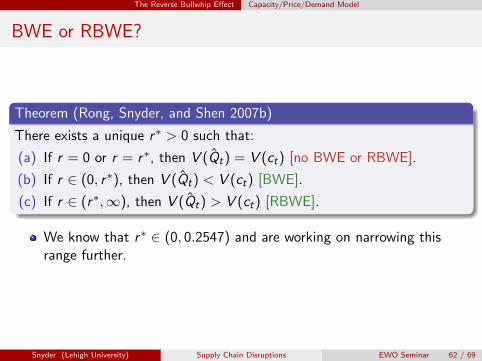
BWE or RBWE?
Theorem (Rong, Snyder, and Shen 2007b)
There exists a unique r∗ > 0 such that:
(a) If r = 0 or r = r∗, then V (Qt) = V (ct) [no BWE or RBWE].
(b) If r ∈ (0, r∗), then V (Qt) < V (ct) [BWE].
(c) If r ∈ (r∗,∞), then V (Qt) > V (ct) [RBWE].
We know that r∗ ∈ (0, 0.2547) and are working on narrowing thisrange further.
Snyder (Lehigh University) Supply Chain Disruptions EWO Seminar 62 / 69
The Reverse Bullwhip Effect Capacity/Price/Demand Model
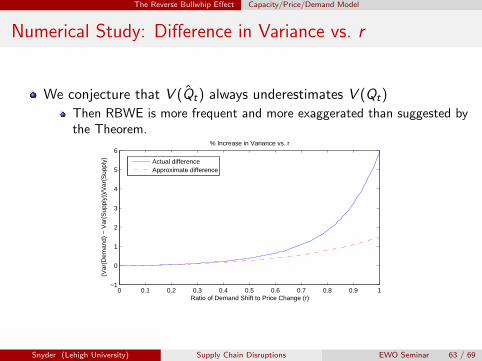
Numerical Study: Difference in Variance vs. r
We conjecture that V (Qt) always underestimates V (Qt)
Then RBWE is more frequent and more exaggerated than suggested bythe Theorem.
0 0.1 0.2 0.3 0.4 0.5 0.6 0.7 0.8 0.9 1−1
0
1
2
3
4
5
6
Ratio of Demand Shift to Price Change (r)
(Var
(Dem
and)
− V
ar(S
uppl
y))/
Var
(Sup
ply)
% Increase in Variance vs. r
Actual differenceApproximate difference
Snyder (Lehigh University) Supply Chain Disruptions EWO Seminar 63 / 69
The Reverse Bullwhip Effect Capacity/Price/Demand Model
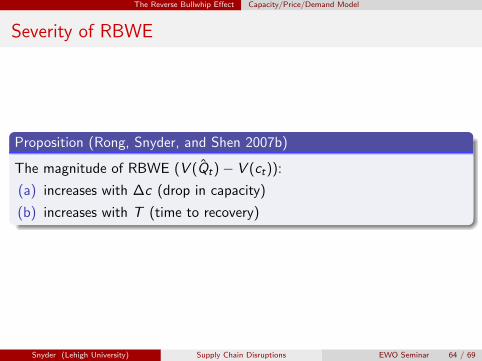
Severity of RBWE
Proposition (Rong, Snyder, and Shen 2007b)
The magnitude of RBWE (V (Qt)− V (ct)):
(a) increases with ∆c (drop in capacity)
(b) increases with T (time to recovery)
Snyder (Lehigh University) Supply Chain Disruptions EWO Seminar 64 / 69

Conclusions
Conclusions
Snyder (Lehigh University) Supply Chain Disruptions EWO Seminar 65 / 69

Conclusions
Conclusions
Planning for disruptions is critical
“Mirror image” between supply and demand uncertainty
Risk pooling vs. risk diversificationBWE vs. RBWEetc.
Research uses a variety of OR tools
Optimization (LP, IP, SP)Stochastic processesSimulationInventory theoryBehavioral studies
Snyder (Lehigh University) Supply Chain Disruptions EWO Seminar 66 / 69

Conclusions
My Research Wish List
Optimal inventory policies and settings for multi-echelon systems withdisruptions
Strategies for modeling and mitigating cascading of disruptions
Including RBWE and other phenomena
Methods for identify bottlenecks/vulnerability points
Mitigation strategies
Methods for identifying buffer pointsStrategies for counteracting RBWE
Good models (or approximations) that include both DU and SU
Robust models: Insensitive to errors in disruption parameters
Application to other complex systems
Snyder (Lehigh University) Supply Chain Disruptions EWO Seminar 67 / 69

Conclusions
Notes and Acknowledgments
Collaborators: Z.–J. Max Shen (Berkeley), Ying Rong (LU), AmandaSchmitt (LU), Zumbul Bulut (LU), Hyong-Mo Jeon (LU), Jae-BumKim (LU), Lian Qi (U Missouri-Rolla), Mark Daskin (Northwestern)
Supported by National Science Foundation grants #DMI-0522725,DMI-0726822
Working papers available atwww.lehigh.edu/∼lvs2/research.htmlBaseStockSim software available atwww.lehigh.edu/∼lvs2/software.html
Snyder (Lehigh University) Supply Chain Disruptions EWO Seminar 68 / 69
Conclusions
Questions?
Snyder (Lehigh University) Supply Chain Disruptions EWO Seminar 69 / 69