models and simulation techniques for discovering diabetes ... · 1 models and simulation techniques...
TRANSCRIPT

1
Models and simulation techniques for discovering diabetes influence factors
MOSAIC overview

2
Consortium presentation
EU-funded European ICT project carried out within the 7th Framework Program
3
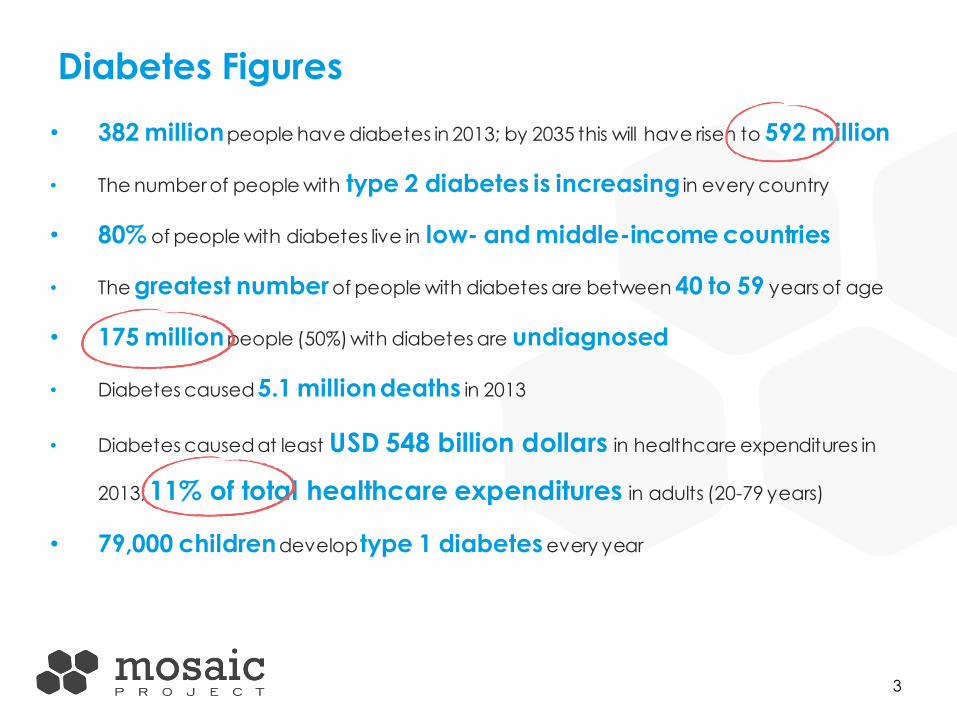
Diabetes Figures
• 382 million people have diabetes in 2013; by 2035 this will have risen to 592 million
• The number of people with type 2 diabetes is increasing in every country
• 80% of people with diabetes live in low- and middle-income countries
• The greatest number of people with diabetes are between 40 to 59 years of age
• 175 million people (50%) with diabetes are undiagnosed
• Diabetes caused 5.1 million deaths in 2013
• Diabetes caused at least USD 548 billion dollars in healthcare expenditures in
2013; 11% of total healthcare expenditures in adults (20-79 years)
• 79,000 children develop type 1 diabetes every year

6
T2DM Diabetes Pathway
Healthy…
At Risk Onset Diagnose Treatment and
follow up Complications
and
hospitalizations
Continuous
deteroration
MOSAIC (Detection) Intervention
MOSAIC (Characterization of the patients and the disease evolution) Intervention
Sometimes
diagnose
comes here

7
1. Early diagnosis of T2DM and prediabetic states
2. Improve characterization of the aforementioned patients
3. Evaluate the risk of
• Developing T2DM and prediabetes
• Developing associated complications
Integrating these into the MOSAIC management tool: • Stratification of the population at risk
• Personalized treatments and definition of the care
pathways
• Enhanced professional decision support systems.
Objectives

8
Probabilistic models
Population studies (VIVA, Botnia PPP, Botnia BPS) retrosprective data
• Identification of variables of interest and fusion of the three
datasets
• Bootstrapped Bayesian Networks analysis to find relations between known and potential T2DM risk factors
Continuous Glucose Monitoring Dataset (Opt2mize, METABO)
• Identify optimum indices of glucose variability
Temporal data mining model
• From the longitudinal hospital records
• To improve monitoring of diabetic patients and predict its complications
Databases
9
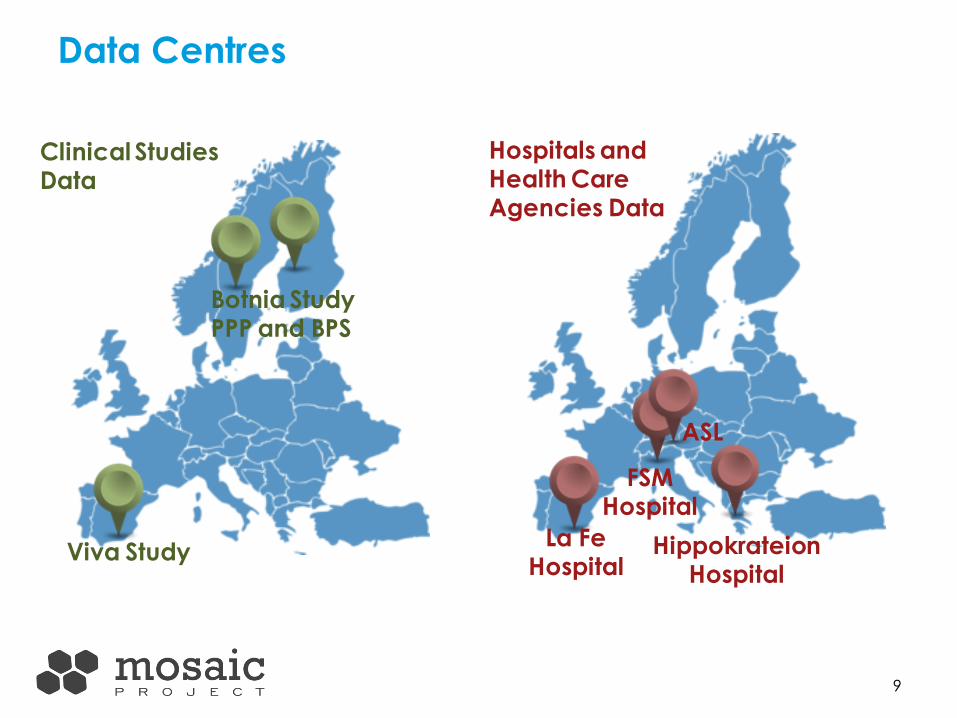
Data Centres
Botnia Study PPP and BPS
Viva Study
FSM Hospital
Hippokrateion Hospital
La Fe Hospital
Clinical Studies Data
Hospitals and Health Care Agencies Data
ASL

10
Data integration architecture
Data warehouse
Common Data Model – i2b2 MOSAIC
system
Data warehouse
Data warehouse

11
Architecture Schema
ASL/FSM Data Warehouse
Re
qu
est
ma
na
ge
r
UC1.1
Data Storage Module
Mosaic Application Server – Model Host
Hospital
Adapter
Hippokraetion Data
Warehouse
La Fe Data Warehouse
Population Datasets
PALIA UC1.2
UC1.3
UC2
UC3
Interface/Dashboard/Plugin
ORCHESTRATOR
Security Track System Administration
Periodic
Update
Bayesian
Network
Data Mining
Module
Support Vector Machine
Temporal Abstractions
(JTSA)
T2DM
EMR
DB
Query Engine DB
Cache
Health Care Process
Modelling
Process Mining
Module

12
Cox Regression Model
It reveals the risk of a patient or a
population of developing Type 2
diabetes in the next 2-12 years.
Predictive models developed
Bayesian Network
It reveals if an individual patient is
diabetic and is currently
undiagnosed.
Logistics and Naïve Bayes regressions
• Retinopathy, neuropathy and kidney disease in the next 3, 5 and 7 years from the first visit in the hospital.
• Temporary data mining to find relevant patterns for the prevention of complications.

13
MOSAIC results:
TOOLS

14
TOOL 2 - PREVENTION AND ANALYSIS OF COMPLICATIONS IN TYPE 2 DIABETIC PATIENTS
TOOL 3 – DECISSION SUPPORT SYSTEM IN
FOLLOW-UP VISITS
TOOL 5 - MOSAIC PATIENT TOOL
TOOL 4 – DIAGNOSIS OF TYPE 2 DIABETES
TOOL 1 - PREVENTION AND RISK DETECTION OF TYPE 2 DIABETES MELLITUS

15
1st STEP
User: Prevention / Health Care Coordination / Ministry of Health
• In a given geographic area (eg, Madrid), users can select
by hospital and see the population they have. They can also
apply filters to select the type of population to analyze.
• After this, the system provides percentages of the population
assigned to selected hospitals at risk of developing TD2M
(Cox regression model).
• The tool, as currently conceived, is enable to send a report
to healthcare managers, informing the population at risk
belongs to their hospitals.
TOOL 1 - PREVENTION AND RISK DETECTION OF TYPE 2 DIABETES MELLITUS

16
Users: Prevention/Health Care Coordinators/Insurers/Private hospitals
TOOL 1 - PREVENTION AND RISK DETECTION OF TYPE 2 DIABETES MELLITUS

17
TOOL 1 - PREVENTION AND RISK DETECTION OF TYPE 2 DIABETES MELLITUS
• Selected population for risk assessment of T2DM

18
TOOL 1 - PREVENTION AND RISK DETECTION OF TYPE 2 DIABETES MELLITUS
• Possibility of filtering

19
TOOL 1 - PREVENTION AND RISK DETECTION OF TYPE 2 DIABETES MELLITUS
• Results obtained: Probability of developing T2DM in the future.

20
User: Hospital Endocrinology/General practotioners
• The head access to the system and finds a list of patients. They can select a patient and see their clinical and demographical variables, etc. which has been self-filling.
• At this point, the second predictive model (Bayesian Network) is applied.
• This predictive model will indicate the current risk of each patient to be already diabetic, based on the automatic estimation performed on the results that would give us an oral glucose tolerance and HDL-C (cholesterol high density lipoprotein ).
TOOL 1 - PREVENTION AND RISK DETECTION OF TYPE 2 DIABETES MELLITUS

21
System impact
• This process allows to identify patients at risk from a general population to the individual and focus the diagnostic tests for T2DM detection to those patients that indeed are in high risk of developing the disease, increasing the success rates in tests like Oral Glucose Tolerance Test.
• A better detection and diagnosis of T2DM in early stages will enable to start activities of secundary prevention and healthy lifestyle before the patient starts to develop the associated complications of this chronic disease. (Micro and macro vascular complications).
TOOL 1 - PREVENTION AND RISK DETECTION OF TYPE 2 DIABETES MELLITUS

22
• MOSAIC use large databases available on long-term monitoring of diabetic patients with the goal of providing health services with innovative methods and tools to monitor the evolution of patients, facilitating the control and management of the disease .
• Any center collecting information from patients about lifestyle, physical parameters, clinical values, hospitalizations, etc. take advantage from a tool such as MOSAIC, which exploits the integration of different sources of information, to provide several useful features from a clinical, strategic and organizational perspective, of each healthcare organization based on the needs of their patients.
TOOL 2 - PREVENTION AND ANALYSIS OF COMPLICATIONS IN TYPE 2 DIABETIC PATIENTS

23
MOSAIC users will open the tool and they will find information about their diabetic patients clasiffied by: • Gender • Age at diagnosis • Body Mass Index (BMI) • Cardiovascular risk(last visit) • Complications
TOOL 2 - PREVENTION AND ANALYSIS OF COMPLICATIONS IN TYPE 2 DIABETIC PATIENTS

24
Once the users have select in the first screen the group on which they want to have more information, they will access to the 2nd screen where they will find information from the patients group selected regarding:
• Complications: History of the complications suffered by the patients group selected, as well as the order in which they have appeared, temporarily placing taking into account the days of disease progression.
TOOL 2 - PREVENTION AND ANALYSIS OF COMPLICATIONS IN TYPE 2 DIABETIC PATIENTS

25
• The medication received for their patients during their illness
TOOL 2 - PREVENTION AND ANALYSIS OF COMPLICATIONS IN TYPE 2 DIABETIC PATIENTS

26
• Users: General Practitioners or diabetologists – Professional coordinator of the disease.
• With this tool the users will be able to insert the patient ID and the system provides clinical information about the patient in a friendly and intuitive way, organized by:
• Clinical data
• Traffic lights
• Therapies
TOOL 3 – DECISICION SUPPORT SYSTEM IN FOLLOW-UP VISITIS

27
• Clinical data: provides information about the chronological evolution of the patient regarding HbA1c, weight, etc. in a graphical way
TOOL 3 – DECISICION SUPPORT SYSTEM IN FOLLOW-UP VISITIS

28
Traffic lights: using traffic lights graphs the users can see the evolution of their patients from the previous follow-up visit so far, taking into account key parameters for an adequate control of diabetes, as well as the risk of develop certain complications.
Therefore, the tool identifies patients at risk, enabling HC providers to recommend some kind of intervention, either lifestyle changes, medication or a consultation with the specialist.
TOOL 3 – DECISICION SUPPORT SYSTEM IN FOLLOW-UP VISITIS

29
• Therapies: in those systems where information about purchasing drugs prescribed by physicians is collected, the tool is enable to track the treatment adherence of their patients.
TOOL 3 – DECISICION SUPPORT SYSTEM IN FOLLOW-UP VISITIS

30
• This tool allows to identify undiagnosed T2DM patients at individual level
• The process is very simple, and would require:
1. Enter the ID number of the patient.
2. Check that clinical, demographic and lifestyle data are correct and if not correct them
3. Activate the system.
• System Response: the most likely value resulting from a Oral Glucose Tolerance Test (OGTT) in this patient in particular based on a predictive model (Bayesian Network) which takes into account all the other clinical variables of the patient.
• One of the most powerful features of the system is that estimates those variables (clinical, demographic and lifestyle) not available. (While it is true that the more variables available the system have, the more accurate diagnostic response will be given)
TOOL 4 – DIAGNOSIS OF TYPE 2 DIABETES
31
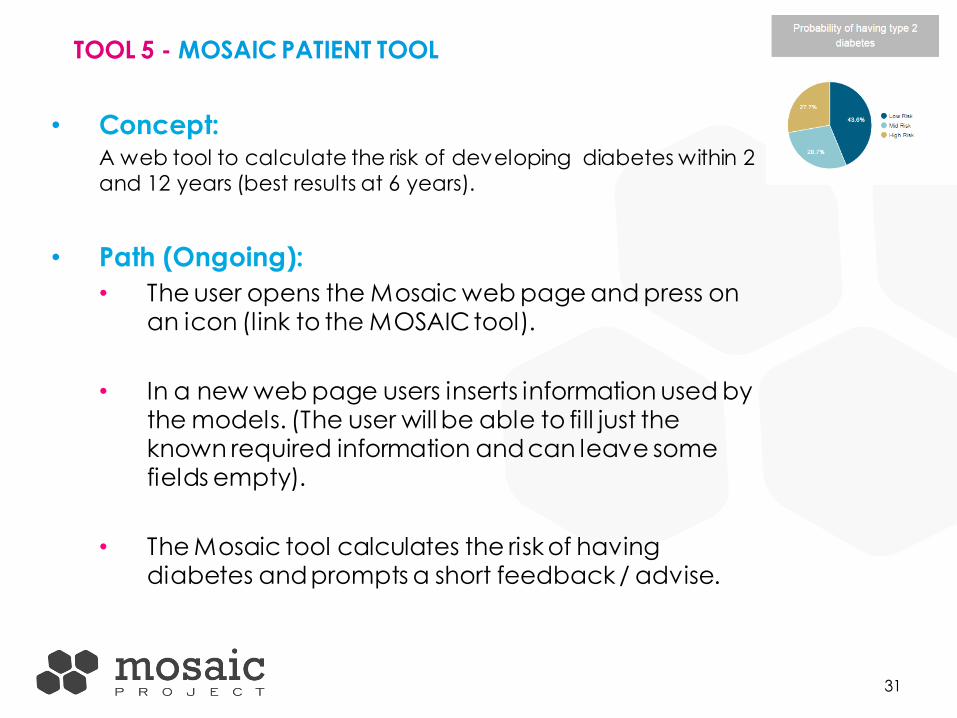
• Concept: A web tool to calculate the risk of developing diabetes within 2
and 12 years (best results at 6 years).
• Path (Ongoing):
• The user opens the Mosaic web page and press on an icon (link to the MOSAIC tool).
• In a new web page users inserts information used by the models. (The user will be able to fill just the known required information and can leave some fields empty).
• The Mosaic tool calculates the risk of having diabetes and prompts a short feedback / advise.
TOOL 5 - MOSAIC PATIENT TOOL

32
Continuous concept validation during the life of the project
• Interviews, focus groups + workshops with clinicians
Scientific value + impact
• Assessment of the MOSAIC models
• Evaluation of the methods in two hospitals:
o La Fe in Spain
o FSM in Italy
• MOSAIC Prospective Study based in CGM data to feed and
improve the models
Currently under validation

33
Follow us!
www.mosaicproject.eu
@mosaicprojecteu
www.facebook.com/mosaicprojecteu
www.youtube.com/watch?v=i6Qv931i4jI