models and lessons for the multivariate …...1 models and lessons for the multivariate assessment...
TRANSCRIPT

1
Models and Lessons for the Multivariate Assessment
of Business Bribery Risk
Robert Clark, Virna Di Palma
TRACE International
February 2018
As laws prohibiting transnational bribery become more vigorously enforced, the incentive grows for
multinational businesses to police the behaviour of their employees, agents, and intermediaries
throughout the world. To allocate compliance resources optimally, businesses need reliable
information about the corruption risks associated with their specific industries, business models, and
markets.
This paper examines the assessment of country-specific bribery risk. It presupposes that a general
rating of perceived corruption levels will be suboptimal for purposes of corporate compliance, as such
ratings typically include appraisals of petty corruption directed toward the citizenry and other factors
of limited direct concern to foreign businesses. Instead, an effective model of business bribery risk
will need to give particular focus to business-specific variables, such as the nature and extent of a
company’s dealings with government agencies and officials, along with other societal and regulatory
elements that are likely to affect the frequency and intensity of bribery demands upon businesses.

2
In 2014, TRACE International collaborated with the RAND Corporation to develop a freely-available
multivariate bribery-risk assessment tool, currently known as the TRACE Bribery Risk Matrix. The
model underwent a thorough review and update in 2017, including significant changes in the selection
of input variables. In this paper, we will discuss the theoretical rationale underlying the model’s
methodology and choice of inputs, with comparative attention to similar multi-dimensional country
assessments such as the World Bank’s Worldwide Governance Indicators. We will then explore the
model’s diagnostic strengths and limits, focusing on the challenges of verification and falsification
given the difficulty of directly measuring bribery activity. We will confront some of these challenges
with a critical statistical analysis of the model’s inputs and results, yielding both concrete proposals
for the model’s refinement and suggestions for further empirical analysis of the country-level factors
contributing to bribery risk.

3
The opinions expressed and arguments employed herein are solely those of the authors and do not
necessarily reflect the official views of the OECD or of its member countries.
This document and any map included herein are without prejudice to the status of or sovereignty over
any territory, to the delimitation of international frontiers and boundaries and to the name of any
territory, city or area.
This paper was submitted as part of a competitive call for papers on integrity, anti-corruption and
inclusive growth in the context of the 2018 OECD Global Anti-Corruption & Integrity Forum.

4
1 Introduction
Measuring corruption is neither a new idea nor a solved problem. Among the difficulties are the
issue’s conceptual breadth, the need to translate its abstract character into real-world terms, and—of
course—the typically clandestine nature of its object. The scale and location of the phenomenon are
ambiguous: “corruption” stands opposite an ideal of good governance and societal functioning, but
also hints at an individual moral rot. Its effects may be easier to grasp: wealth is drained, needs go
unmet, trust is lost.
The demand for tools with which to measure corruption has been driven by international
development programs, for which corruption represents both a source of harm to be mitigated and an
impediment to the provision of assistance. Given the global scale of these programs, attempts at
measurement have generally taken the form of country-by-country comparison. See
Transparency International (2012), at 8. Two of the most prominent country-level ratings are the
Corruption Perceptions Index (Transparency International (2017)) (“CPI”) and the Worldwide
Governance Indicators (The World Bank (2017)) (“WGI”), both originally published in the mid-to-
late 1990s.
The international business community also has an interest in gauging the corruption levels of
prospective markets—not only to protect against being defrauded, but also because of the cost of
being found complicit: stratospheric penalties imposed by anti-bribery regulators, debarment from
potentially lucrative contracts, and a diminished reputation with the public and among peers.
Under most laws prohibiting transnational bribery of public officials—including the U.S. Foreign
Corrupt Practices Act and the UK Bribery Act 2010—companies can be held responsible for corrupt
actions taken by their employees and agents. The amount of responsibility the company bears can
depend on the extent to which it has implemented an effective anti-bribery compliance program,
generally understood to include undertaking reasonable, risk-based due diligence in connection with
contemplated business transactions. See, e.g., U.S. Department of Justice and U.S. Securities and
Exchange Commission (2012). The level of risk may be determined based on a number of factors,
including the industry, the nature of the project, and the specific country or region involved.
Because of the non-negligible expense of performing due diligence—particularly for
multinationals with hundreds or even thousands of agents and intermediaries worldwide—companies
must prioritise and focus their compliance resources on those individuals and transactions that carry
the greatest risk. In order to demonstrate to the authorities the reasonableness of their due diligence
efforts, companies need to allocate those resources based on documented, objective, and relevant
criteria.
What kind of measurement is appropriate for this kind of use? Can “corruption” be deemed the
equivalent of bribery risk? If not, how might the measurements differ, and would those differences
materially affect the conclusions with respect to any given country? Looking beyond immediate
results, can the metric selection itself have any significant consequences for those it affects—whether
5
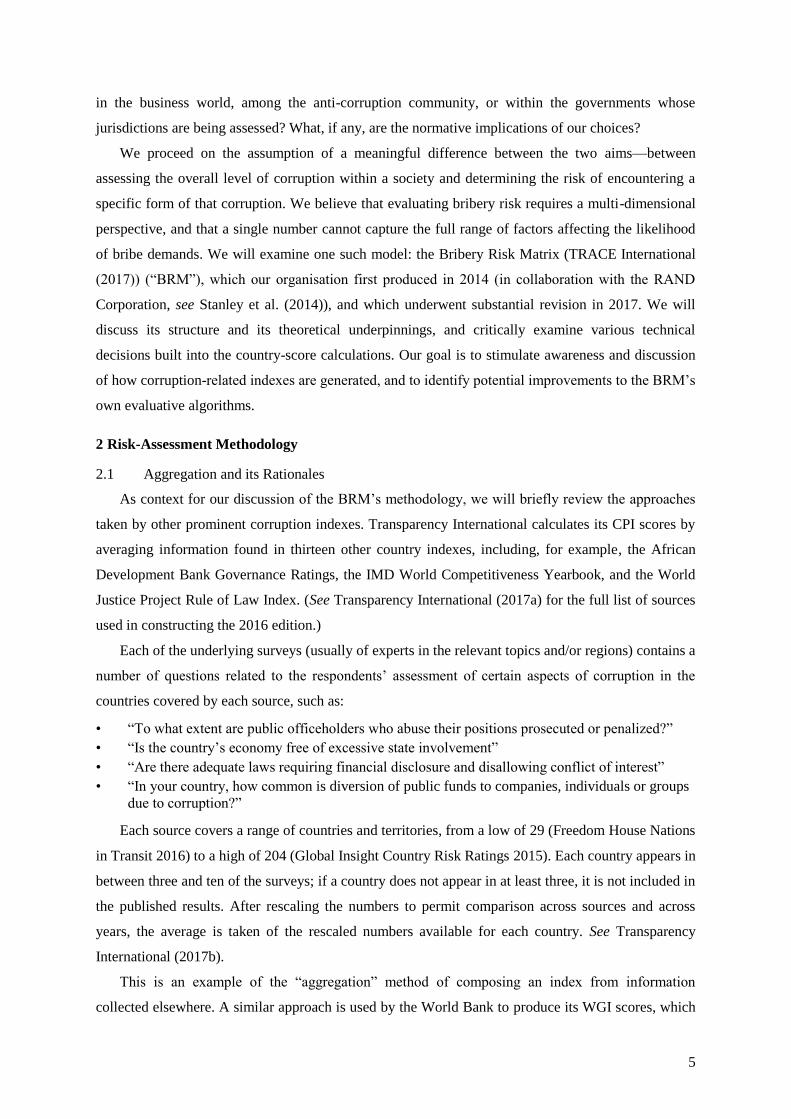
in the business world, among the anti-corruption community, or within the governments whose
jurisdictions are being assessed? What, if any, are the normative implications of our choices?
We proceed on the assumption of a meaningful difference between the two aims—between
assessing the overall level of corruption within a society and determining the risk of encountering a
specific form of that corruption. We believe that evaluating bribery risk requires a multi-dimensional
perspective, and that a single number cannot capture the full range of factors affecting the likelihood
of bribe demands. We will examine one such model: the Bribery Risk Matrix (TRACE International
(2017)) (“BRM”), which our organisation first produced in 2014 (in collaboration with the RAND
Corporation, see Stanley et al. (2014)), and which underwent substantial revision in 2017. We will
discuss its structure and its theoretical underpinnings, and critically examine various technical
decisions built into the country-score calculations. Our goal is to stimulate awareness and discussion
of how corruption-related indexes are generated, and to identify potential improvements to the BRM’s
own evaluative algorithms.
2 Risk-Assessment Methodology
2.1 Aggregation and its Rationales
As context for our discussion of the BRM’s methodology, we will briefly review the approaches
taken by other prominent corruption indexes. Transparency International calculates its CPI scores by
averaging information found in thirteen other country indexes, including, for example, the African
Development Bank Governance Ratings, the IMD World Competitiveness Yearbook, and the World
Justice Project Rule of Law Index. (See Transparency International (2017a) for the full list of sources
used in constructing the 2016 edition.)
Each of the underlying surveys (usually of experts in the relevant topics and/or regions) contains a
number of questions related to the respondents’ assessment of certain aspects of corruption in the
countries covered by each source, such as:
• “To what extent are public officeholders who abuse their positions prosecuted or penalized?”
• “Is the country’s economy free of excessive state involvement”
• “Are there adequate laws requiring financial disclosure and disallowing conflict of interest”
• “In your country, how common is diversion of public funds to companies, individuals or groups
due to corruption?”
Each source covers a range of countries and territories, from a low of 29 (Freedom House Nations
in Transit 2016) to a high of 204 (Global Insight Country Risk Ratings 2015). Each country appears in
between three and ten of the surveys; if a country does not appear in at least three, it is not included in
the published results. After rescaling the numbers to permit comparison across sources and across
years, the average is taken of the rescaled numbers available for each country. See Transparency
International (2017b).
This is an example of the “aggregation” method of composing an index from information
collected elsewhere. A similar approach is used by the World Bank to produce its WGI scores, which

6
are based on more than 100 data points obtained from more than 30 sources. Those data points are
divided among six areas of governance, including Regulatory Quality, Government Effectiveness,
and—our most relevant point of comparison—Control of Corruption, which uses 43 data points from
six “representative” sources (those having comparatively broad country coverage) and fourteen “non-
representative” sources.
The calculation of the WGI scores from these data points is somewhat more involved than simple
averaging; detailed discussions can be found at Kaufmann et al. (1999), Kaufmann et al. (2005), and
Kaufmann et al. (2010). The authors describe their approach as based on an “unobserved
components” model, premised on the idea that each country has certain qualities of governance that
cannot be directly observed, but whose effects can be seen to a greater or lesser degree in the
surveyed phenomena. The calculations are designed to arrive at a principled estimate of those
underlying governance factors.
It is notable that, despite the differences in their methods of calculation, the TI/CPI and the WGI’s
“Control of Corruption” indicator (“WGI/CC”) yield nearly identical results, as seen in Figure 1. For
the 2016 editions of the indexes, the correlation exceeds 99%. See Figure 2. This degree of correlation
has led some to conclude that “it is not possible, even at the 1% interval, to reject the hypothesis that
these indicators are measuring the same thing.” Hamilton and Hammer (2018), at 24.
Figure 1: Comparison of TI/CPI and WGI/CC

7
Figure 2: Cross-Index Correlations
2.2 Calculating Risk
The BRM aims to measure something slightly different: business bribery risk. In the WGI’s
model, “control of corruption” is postulated as an inherent—though not immutable—characteristic of
governance. It is conceptualised as the (partial) cause of observed phenomena, from which its strength
can be inferred. This has implications for how the source data are chosen: one looks for areas where
the underlying characteristic can be expected to manifest itself.
Risk, in contrast, is not an inherent quality. It is not the cause of observable effects. Its meaning is
more operational than essential: it is the likelihood that something will happen. The elements from
which one calculates risk are not thought of as manifestations of anything; they are simply factors
contributing to that likelihood. The challenge is to determine what those elements are and to
accurately model their relation to the specified risk.
A model’s accuracy, of course, can be improved with empirical feedback, but that requires data
on how frequently and under what conditions the risk eventuates: the kind of information an actuary
at an insurance company might use. Unfortunately, such information is in short supply with respect to
bribery—which is one reason we typically see corruption assessments described as based on
perception rather than “hard” data.
Despite the challenge of empirical verification, the demands of anti-bribery compliance upon the
business community require some kind of quantification. Without a basis for assessing the bribery
risk in their various markets, companies would be hard-pressed to satisfy the authorities’ expectation
that their due diligence will be proportionate to the evident risk, or to implement their anti-corruption
programs both effectively and efficiently.

8
The requirement that anti-bribery precautions be “risk-based” has echoes in the history of tort law
regarding the conditions under which a failure to implement safeguards may be deemed negligent. In
deciding whether a barge owner could claim full damages for accidental harm a vessel suffered while
left unattended, Judge Learned Hand (writing for the U.S. Court of Appeals for the Second Circuit)
reasoned that because the extensive harm could have been prevented at a relatively small cost—
leaving a man on board—the owner bore some of the responsibility for the loss. See Hand (1947). The
owner’s liability was considered “a function of three variables: (1) The probability that [the barge]
will break away; (2) the gravity of the resulting injury, if she does; (3) the burden of adequate
precautions.” This is known as the “Hand Formula” for determining when a given precaution may be
non-negligently foregone: the burden of prevention (B) must be greater than the probability of
resulting loss (P) times the extent of that loss (L)—or, more concisely, B > PL.
The practical limits of such a formula are obvious, as Judge Hand himself recognised. See
Keating (2015). Calculating the probabilities of any given hazard and of the potential resulting harms
is difficult enough, let alone all possible hazards that could arise within one’s zone of responsibility.
But the formula nevertheless has a valid purpose: like other ultimately nebulous legal standards
(finding guilt “beyond a reasonable doubt”; deeming a plaintiff’s allegations “more likely than not”),
it serves to orient the fact-finder’s attention to the basic nature of the obligation. It helps us think
about what precautions are warranted and what kinds might be wasteful.
The regulatory expectation that anti-bribery precautions be “risk-based” reflects a similar
recognition: that preventative resources are not unlimited, and they should be directed toward
minimising the overall harm. It also entails a similar vagueness. Given the immeasurable quality of
the harm resulting from bribery, there is no way to determine in advance what might constitute an
“acceptable” probability of its occurrence. Once again, we find ourselves outside the realm of
actuarial calculation.
If we want to measure bribery risk, then, we need a different understanding of what is demanded.
In coupling the adequacy of compliance to the assessment of risk, the authorities are insisting that we
think about what contributes to that risk—including factors that may go beyond a general consensus
about the overall level of corruption. In the following discussion of the model underlying the Bribery
Risk Matrix, we hope to advance such thinking by making explicit our own assumptions about those
contributory elements.
3 The BRM Model
3.1 Structure
In the BRM model, business bribery risk is understood as arising from four primary areas—
referred to as “domains”—each of which is composed of either two or three contributing
“subdomains” (see Table 1):
9
• The first domain (“Opportunity”) focuses on a company’s (or its agents’) direct contact with
foreign public officials, where the risk increases with the frequency of interaction (how many
occasions there are for a bribe solicitation), the expectations surrounding bribery (how common
it is and how thoroughly normalised), and the leverage an official might have at his disposal
(how costly it could be made for the company to refuse a bribe demand).
• The second domain (“Deterrence”) addresses the intensity of the government’s efforts to
discourage bribery by enacting the necessary laws and enforcing those laws effectively.
• The third domain (“Transparency”) examines how the government indirectly facilitates the
detection of bribery by opening its processes and its books to inspection and maintaining them
reliably.
• The fourth domain (“Oversight”) looks outside the government to consider whether the press
and civil society are free enough and strong enough to provide a check on public corruption.
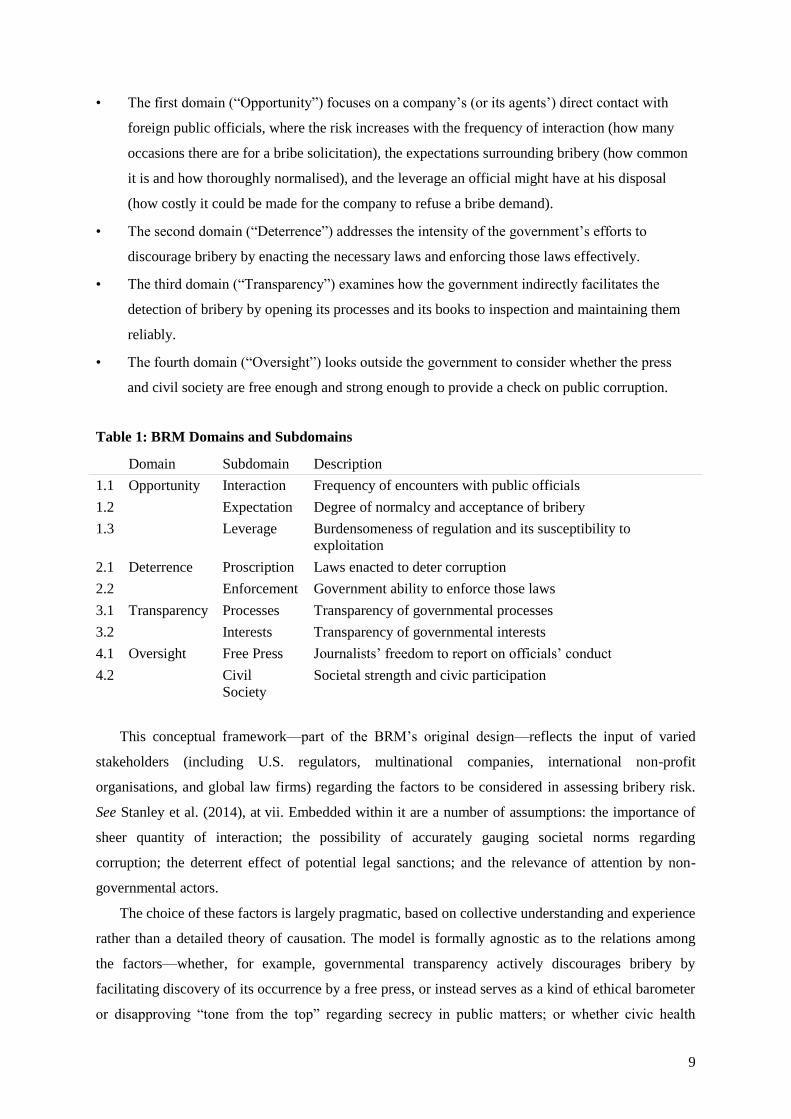
Table 1: BRM Domains and Subdomains
Domain Subdomain Description
1.1 Opportunity Interaction Frequency of encounters with public officials
1.2 Expectation Degree of normalcy and acceptance of bribery
1.3 Leverage Burdensomeness of regulation and its susceptibility to
exploitation
2.1 Deterrence Proscription Laws enacted to deter corruption
2.2 Enforcement Government ability to enforce those laws
3.1 Transparency Processes Transparency of governmental processes
3.2 Interests Transparency of governmental interests
4.1 Oversight Free Press Journalists’ freedom to report on officials’ conduct
4.2 Civil
Society
Societal strength and civic participation
This conceptual framework—part of the BRM’s original design—reflects the input of varied
stakeholders (including U.S. regulators, multinational companies, international non-profit
organisations, and global law firms) regarding the factors to be considered in assessing bribery risk.
See Stanley et al. (2014), at vii. Embedded within it are a number of assumptions: the importance of
sheer quantity of interaction; the possibility of accurately gauging societal norms regarding
corruption; the deterrent effect of potential legal sanctions; and the relevance of attention by non-
governmental actors.
The choice of these factors is largely pragmatic, based on collective understanding and experience
rather than a detailed theory of causation. The model is formally agnostic as to the relations among
the factors—whether, for example, governmental transparency actively discourages bribery by
facilitating discovery of its occurrence by a free press, or instead serves as a kind of ethical barometer
or disapproving “tone from the top” regarding secrecy in public matters; or whether civic health

10
implies an ability to resist corruption, or instead is simply the societal result of maintaining corruption
at a low level.
However, the choice of factors does carry a normative implication. Not only in the sense that the
choice is necessarily informed by the collective outlook of the consulting stakeholders, but because of
the signal it sends to governments that have an interest in improving their countries’ reputation for
clean business practices. Just as the prospect of lower health insurance premiums can function as an
incentive to stop smoking—or to forego other behaviours the insurance companies consider risk
factors—a need for foreign investment can motivate a country’s leaders to seek improved
performance on corruption-related indexes. All the more reason for those who produce such indexes
to consider the long-term effects of the policies they may indirectly be subsidising, and to remain
open to adjusting their models where appropriate.
3.2 Sources
Given a model (always provisional) of contributory risk factors, the next task is to identify
available datasets containing relevant information for each domain and make an appropriate selection
of variables. The goal is to arrive at a set of reasonable proxies for each specified risk-contributor,
drawing upon reliable sources with broad global coverage. For the sake of robustness, each
subdomain will ideally be populated with data from multiple sources.
The data underlying the 2017 edition of the BRM come from 13 global surveys and datasets. The
number of separate data points contributing to each subdomain is reflected in Figure 3.

11
Figure 3: Data Sources for the Bribery Risk Matrix
Many of these sources are themselves indexes that provide top-level ratings for each covered
jurisdiction. A composite index based on such sources will typically not rely on those top-level
scores, but instead will examine the underlying set of inputs and select those that have the closest
bearing on the matter at hand. For example, the BRM’s first subdomain (government interaction) is
derived from ten individual variables found in four of the above sources, as set forth in Table 2.

12
Table 2: Data Sources for Domain 1.1 (Opportunity: Interaction)
Dataset Variable Code
Institutional Profiles
Database
Public ownership in large firms firm_own
Doing Business Procedures to start a business bus_proc
Doing Business Procedures to obtain a construction permit con_proc
Doing Business Procedures to get electricity pow_proc
Doing Business Procedures to register property prp_proc
Doing Business Documents to export goods exp_docs
Doing Business Documents to import goods imp_docs
Enterprise Surveys Senior management time spent dealing with the requirements
of government regulation (%)
req_time
Enterprise Surveys If there were visits, average number of visits or required
meetings with tax officials
tax_mtgs
ILOSTAT Share of government employment gov_empl
As it stands, the selection of variables for each subdomain is more art than science. We have
aimed to collect a representative range of data that indicate the degree of government interaction.
While the amount of interaction required for any specific project will of course vary, the aim is for
these data points to collectively provide a reasonable estimate of the overall administrative conditions
within each country.
One question that arises is whether we should expect these variables to show significant
correlation with one another. On the one hand, a high degree of correlation could help assure us that
the variables are capturing a consistent and identifiable quality of “interaction” with the government.
On the other hand, a low degree of correlation could help confirm that our selections are not
unnecessarily duplicative of one another and that each variable is making a significant independent
contribution to the overall assessment.
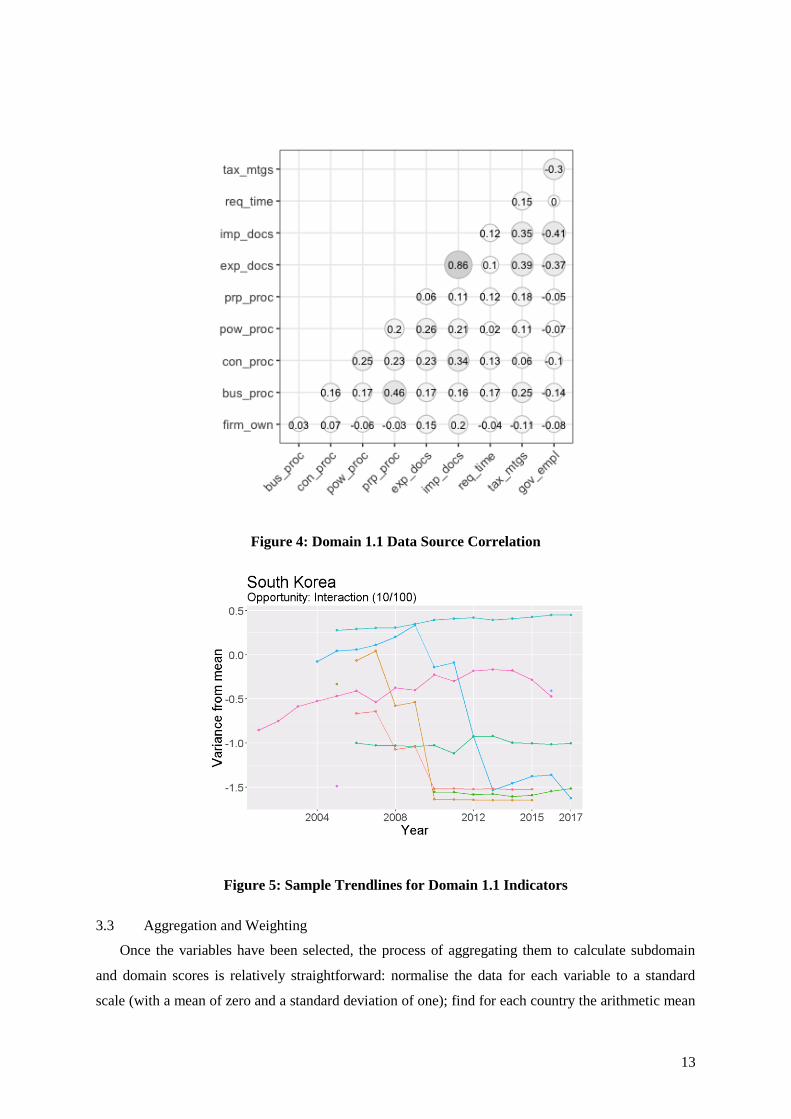
In fact, only two out of the ten Domain 1.1 variables appear highly correlated—the number of
documents to import goods and the number of documents to export goods, with a correlation of 86%.
(See Figure 4.) A few other pairs show correlations within the range of 30–50%, but for the most part
the variables are relatively disjoint. Our tentative view is that, given the often heterogeneous character
of bureaucratic regimes, this outcome is neither unexpected nor unreasonable.
Where historical data are available for the chosen indicators, a review of that history can convey a
sense of how the risk factor has developed over time. See, for example, the charting of South Korea’s
Domain 1.1 inputs against each year’s worldwide mean scores in Figure 5, showing a significant
reduction in import/export requirements in 2010, and a dramatic streamlining of business-registration
procedures between 2009 and 2013. This sort of chart can give a kind of narrative form to the risk
domain as currently constructed, and can be useful as a kind of “reality check” for one’s choice of
inputs.
13
Figure 4: Domain 1.1 Data Source Correlation
Figure 5: Sample Trendlines for Domain 1.1 Indicators
3.3 Aggregation and Weighting
Once the variables have been selected, the process of aggregating them to calculate subdomain
and domain scores is relatively straightforward: normalise the data for each variable to a standard
scale (with a mean of zero and a standard deviation of one); find for each country the arithmetic mean
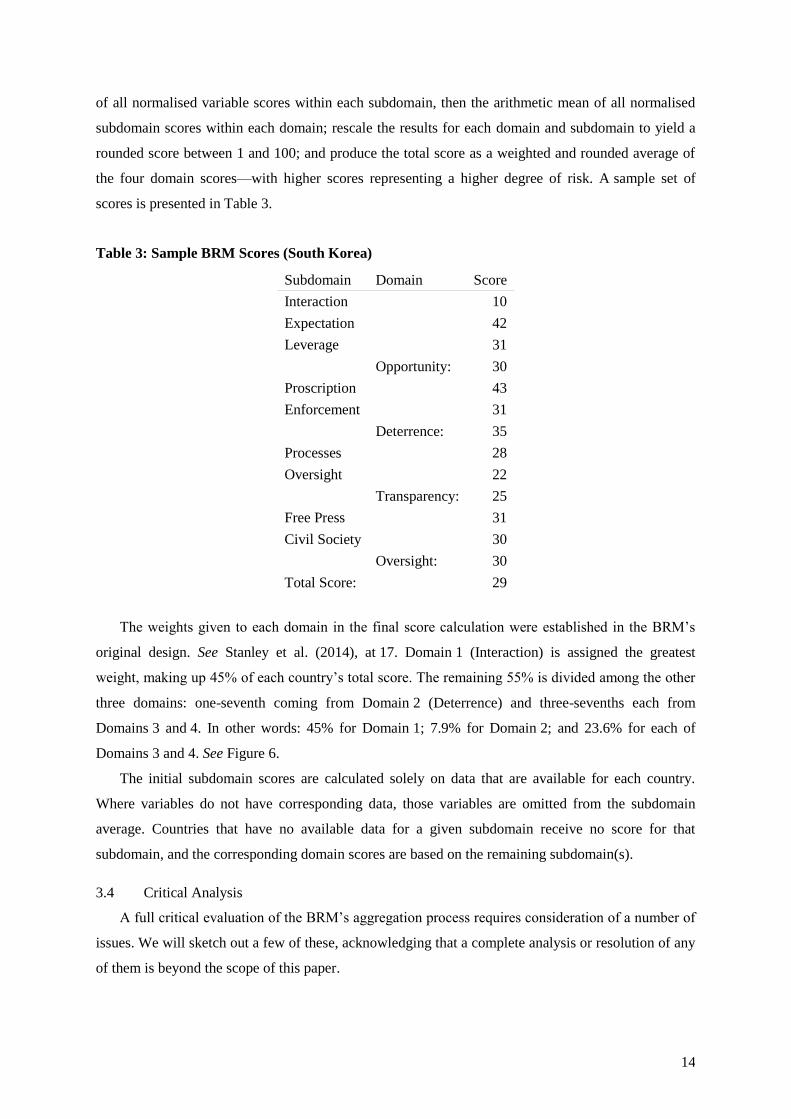
14
of all normalised variable scores within each subdomain, then the arithmetic mean of all normalised
subdomain scores within each domain; rescale the results for each domain and subdomain to yield a
rounded score between 1 and 100; and produce the total score as a weighted and rounded average of
the four domain scores—with higher scores representing a higher degree of risk. A sample set of
scores is presented in Table 3.
Table 3: Sample BRM Scores (South Korea)
Subdomain Domain Score
Interaction 10
Expectation 42
Leverage 31
Opportunity: 30
Proscription 43
Enforcement 31
Deterrence: 35
Processes 28
Oversight 22
Transparency: 25
Free Press 31
Civil Society 30
Oversight: 30
Total Score: 29
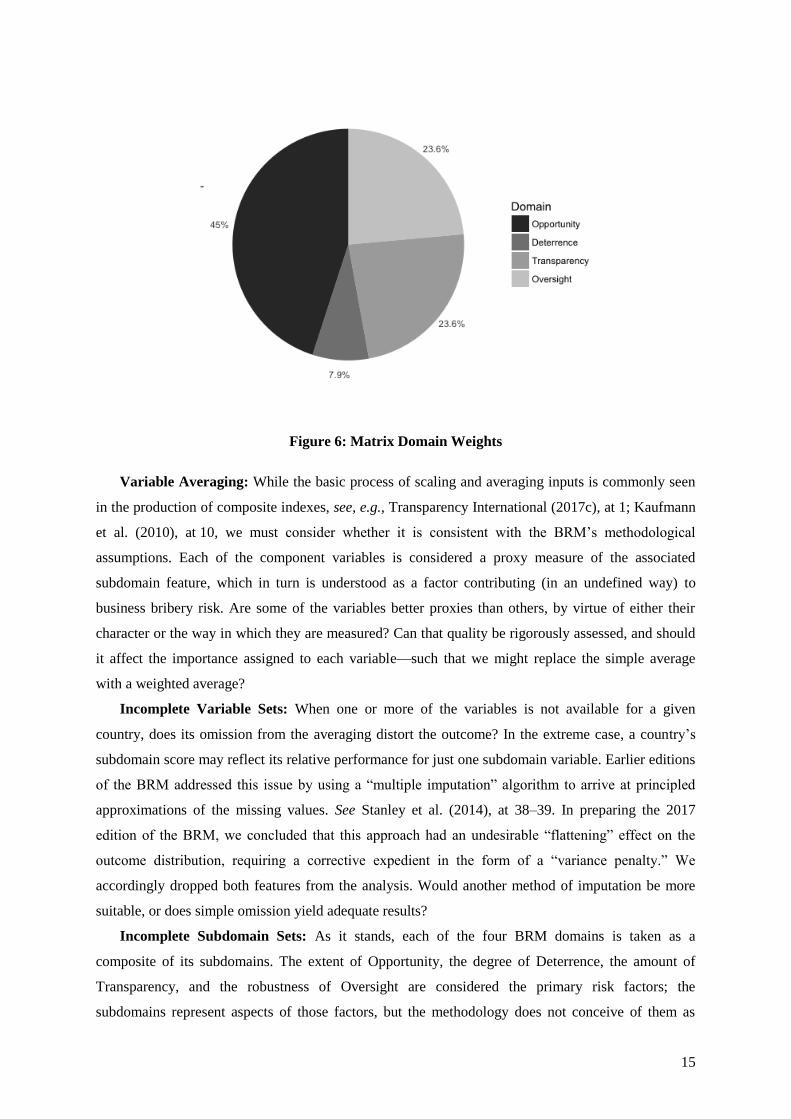
The weights given to each domain in the final score calculation were established in the BRM’s
original design. See Stanley et al. (2014), at 17. Domain 1 (Interaction) is assigned the greatest
weight, making up 45% of each country’s total score. The remaining 55% is divided among the other
three domains: one-seventh coming from Domain 2 (Deterrence) and three-sevenths each from
Domains 3 and 4. In other words: 45% for Domain 1; 7.9% for Domain 2; and 23.6% for each of
Domains 3 and 4. See Figure 6.
The initial subdomain scores are calculated solely on data that are available for each country.
Where variables do not have corresponding data, those variables are omitted from the subdomain
average. Countries that have no available data for a given subdomain receive no score for that
subdomain, and the corresponding domain scores are based on the remaining subdomain(s).
3.4 Critical Analysis
A full critical evaluation of the BRM’s aggregation process requires consideration of a number of
issues. We will sketch out a few of these, acknowledging that a complete analysis or resolution of any
of them is beyond the scope of this paper.
15
Figure 6: Matrix Domain Weights
Variable Averaging: While the basic process of scaling and averaging inputs is commonly seen
in the production of composite indexes, see, e.g., Transparency International (2017c), at 1; Kaufmann
et al. (2010), at 10, we must consider whether it is consistent with the BRM’s methodological
assumptions. Each of the component variables is considered a proxy measure of the associated
subdomain feature, which in turn is understood as a factor contributing (in an undefined way) to
business bribery risk. Are some of the variables better proxies than others, by virtue of either their
character or the way in which they are measured? Can that quality be rigorously assessed, and should
it affect the importance assigned to each variable—such that we might replace the simple average
with a weighted average?
Incomplete Variable Sets: When one or more of the variables is not available for a given
country, does its omission from the averaging distort the outcome? In the extreme case, a country’s
subdomain score may reflect its relative performance for just one subdomain variable. Earlier editions
of the BRM addressed this issue by using a “multiple imputation” algorithm to arrive at principled
approximations of the missing values. See Stanley et al. (2014), at 38–39. In preparing the 2017
edition of the BRM, we concluded that this approach had an undesirable “flattening” effect on the
outcome distribution, requiring a corrective expedient in the form of a “variance penalty.” We
accordingly dropped both features from the analysis. Would another method of imputation be more
suitable, or does simple omission yield adequate results?
Incomplete Subdomain Sets: As it stands, each of the four BRM domains is taken as a
composite of its subdomains. The extent of Opportunity, the degree of Deterrence, the amount of
Transparency, and the robustness of Oversight are considered the primary risk factors; the
subdomains represent aspects of those factors, but the methodology does not conceive of them as

16
independent contributors to overall risk. This may have distorting effects where one of the
subdomains has significantly worse data coverage than the other(s) within the associated domain, as
the relative weight of each of its extant variables will be magnified in the domain-score calculation.
Further distortion may appear when one of the subdomains has no available data at all, and the
domain score ends up reflecting only a subset of the aspects that are deemed relevant.
Incomplete Domain Sets: Another methodological issue arises with countries for which the
available data does not span all four domains—a group representing about one-eighth of the countries
included in the BRM. Using the current method of calculation, there is no way to produce a complete
set of domain scores for such countries. Because the top-level country scores are weighted averages of
the four domain scores, one has to decide in such instances whether to simply omit a top-level score,
to base the top-level score only on the available domain scores, or to employ some other method. For
the 2017 BRM, we chose to create a temporary set of “phantom” domain scores from which a final
top-level score could be derived. We accomplished this by measuring the Euclidean distance of the
country’s extant domain scores from the corresponding scores for each complete country, then taking
the average of each missing domain score over those countries, weighted by a combination of the
calculated distance and the data coverage for each comparison country. While this method appears to
have been more successful than the earlier “multiple imputation” approach (yielding a wider, more
plausible spread of final scores for low-data countries), its premises and implications warrant closer
examination.
Domain Weighting: Finally, the weight accorded to each of the four domains in the final
calculation is based largely on pragmatic consideration of the relative importance of the associated
risk factors. See Stanley et al. (2014), at 17. Properly calibrating a formula’s input weights is a
painstaking task in the best of circumstances—when you have a reliable and robust source of
feedback against which to recursively test your initial estimates. It is an open question whether such a
corrective source is even possible in the area of anti-corruption studies, as is the question of how we
might evaluate the current weighting in the absence of such feedback. In the short term, we may be
limited to tentative modification based on judicious examination of the outcomes.
4 Results
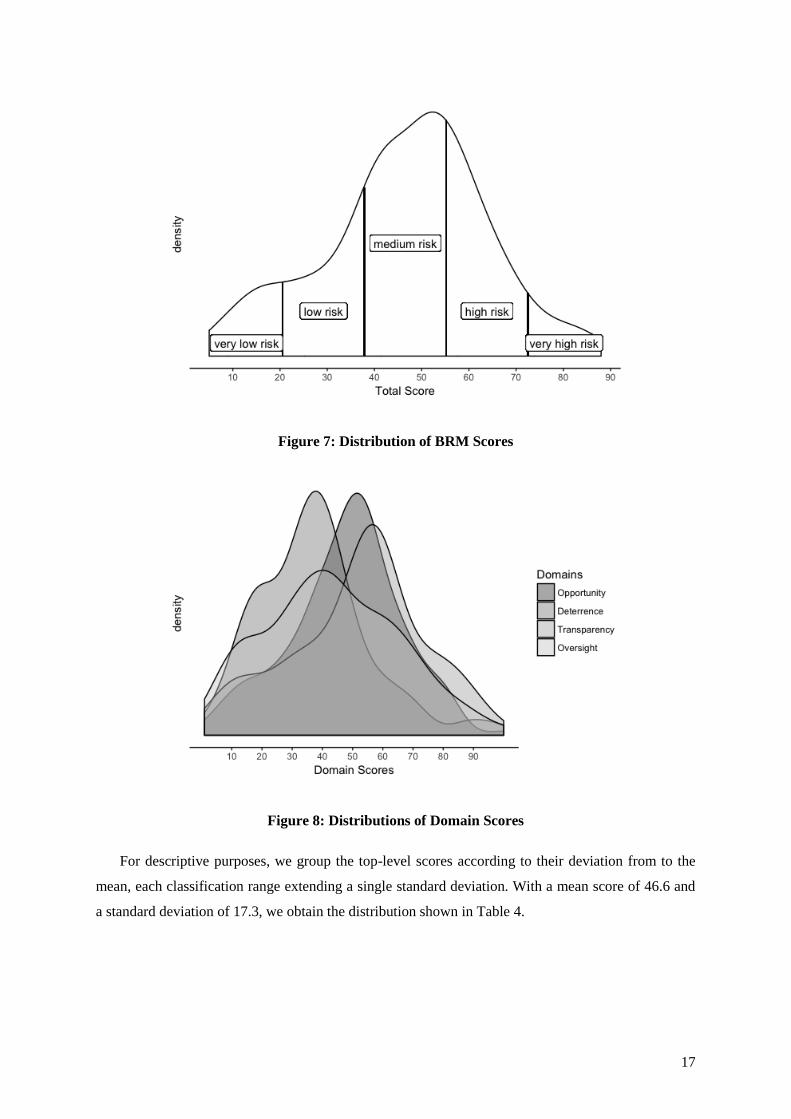
The top-level scores in the BRM are in a roughly normal distribution, skewed slightly to the left
with a brief plateau at the low- to very-low range. See Figure 7. This plateauing does not appear to be
based on the difference in composition among the four contributing domains (see Figure 8) as each of
them shows a similar “bump” at approximately the same range.
17
Figure 7: Distribution of BRM Scores
Figure 8: Distributions of Domain Scores
For descriptive purposes, we group the top-level scores according to their deviation from to the
mean, each classification range extending a single standard deviation. With a mean score of 46.6 and
a standard deviation of 17.3, we obtain the distribution shown in Table 4.

18
Table 4: Risk-Level Distribution
Level Range Count
Very Low 1–20 19
Low 21–37 32
Medium 38–54 87
High 55–71 50
Very High 72–100 12
4.1 Comparisons
Given that the BRM aims to measure something related to but different than the TI/CPI and the
WGI/CC, it is not surprising to find that it correlates with them to a lower degree than they correlate
with one another: roughly 91% compared to 99%, as seen in Table 5. The corresponding scatterplots
(Figures 9 and 10) include identification of the countries for which the difference in score (converted
to a common scale) exceeds one standard deviation.
Table 5: Correlations among BRM, TI/CPI, and WGI/CC
BRM CPI WGI
BRM 1.000 -0.919 -0.913
CPI -0.919 1.000 0.991
WGI -0.913 0.991 1.000
Figure 9: Comparison of BRM and TI/CPI

19
Figure 10: Comparison of BRM and WGI/CC
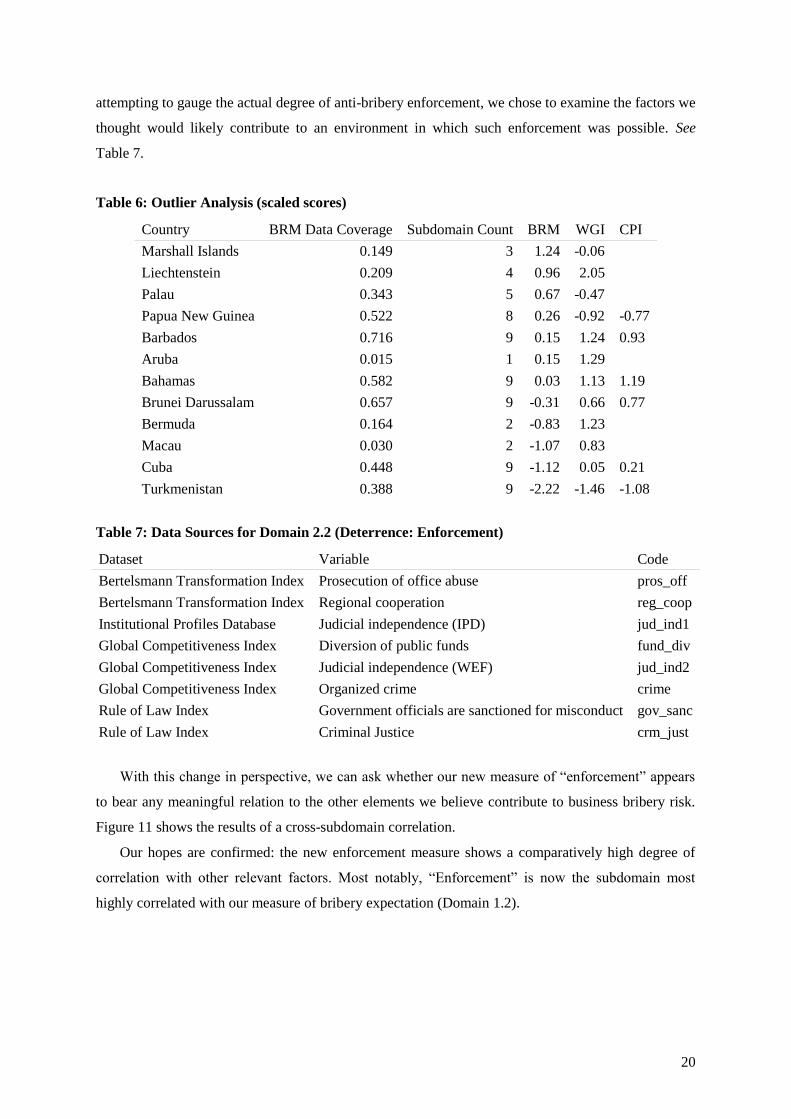
The marked “outliers” can serve as an informal test case regarding the effect of limited data on
the BRM’s score calculation. A quick review of Table 6 shows that, although some of the outlying
countries have minimal data available—and therefore are highly susceptible to the algorithmic
problems discussed above—others appear relatively robust, with directly calculable scores for most or
all of the nine subdomains and data coverage exceeding 50% (that is, their scores are based on more
than half of the 67 total variables used in producing the BRM).
5 Refining the Methodology
The BRM is intended for use by the business community in performing bribery risk assessment.
This carries certain imperatives with it. On the one hand, the calculations should provide as accurate a
picture as possible of the risk conditions faced when doing business internationally. On the other
hand, for the sake of continuity and ongoing legitimacy, any changes to the methodology need to be
adequately justified and properly documented.
Here, we will limit ourselves to exploring one possible modification to the BRM methodology. In
the BRM model, Domain 2 (“Deterrence”) is given minimal weight in the final calculation
(approximately 7.9%). The original rationale was “the lack of reliable data concerning the
enforcement of anti-bribery laws.” See Stanley et al. (2014), at 17. For the 2017 edition, however, we
made a small but meaningful adjustment to the inputs for Domain 2.2 (“Enforcement”). Rather than
20
attempting to gauge the actual degree of anti-bribery enforcement, we chose to examine the factors we
thought would likely contribute to an environment in which such enforcement was possible. See
Table 7.
Table 6: Outlier Analysis (scaled scores)
Country BRM Data Coverage Subdomain Count BRM WGI CPI
Marshall Islands 0.149 3 1.24 -0.06
Liechtenstein 0.209 4 0.96 2.05
Palau 0.343 5 0.67 -0.47
Papua New Guinea 0.522 8 0.26 -0.92 -0.77
Barbados 0.716 9 0.15 1.24 0.93
Aruba 0.015 1 0.15 1.29
Bahamas 0.582 9 0.03 1.13 1.19
Brunei Darussalam 0.657 9 -0.31 0.66 0.77
Bermuda 0.164 2 -0.83 1.23
Macau 0.030 2 -1.07 0.83
Cuba 0.448 9 -1.12 0.05 0.21
Turkmenistan 0.388 9 -2.22 -1.46 -1.08
Table 7: Data Sources for Domain 2.2 (Deterrence: Enforcement)
Dataset Variable Code
Bertelsmann Transformation Index Prosecution of office abuse pros_off
Bertelsmann Transformation Index Regional cooperation reg_coop
Institutional Profiles Database Judicial independence (IPD) jud_ind1
Global Competitiveness Index Diversion of public funds fund_div
Global Competitiveness Index Judicial independence (WEF) jud_ind2
Global Competitiveness Index Organized crime crime
Rule of Law Index Government officials are sanctioned for misconduct gov_sanc
Rule of Law Index Criminal Justice crm_just
With this change in perspective, we can ask whether our new measure of “enforcement” appears
to bear any meaningful relation to the other elements we believe contribute to business bribery risk.
Figure 11 shows the results of a cross-subdomain correlation.
Our hopes are confirmed: the new enforcement measure shows a comparatively high degree of
correlation with other relevant factors. Most notably, “Enforcement” is now the subdomain most
highly correlated with our measure of bribery expectation (Domain 1.2).

21
Figure 11: Subdomain Correlation
But something else stands out as well: our measure of anti-bribery legislation (Domain 2.1,
“Proscription”) shows almost no correlation with any of the other subdomains. In fact, it shows a
slight negative correlation with the expectation of bribery. We can reinforce this conclusion with a
simple clustering dendogram (Figure 12).
Figure 12: Subdomain Clustering

22
Proscription is clearly the odd man out. There is nothing very counterintuitive about this: anti-
bribery laws are easier to pass than to enforce, and doing so can be an inexpensive way for national
leaders to present themselves as tough on corruption—or even a pretext for political repression.
We therefore propose the following simple modification to the BRM’s methodology: eliminate
the “Proscription” subdomain altogether and increase the weight given to the “Enforcement”
subdomain. Determining the proper degree of reweighting would, of course, require further study and
analysis. But we hope to have provided in this paper an indication of some of the tools and issues that
might be relevant to such an analysis.

23
References
Hamilton, A. and Hammer, C. (2018) Can we measure the power of the grabbing hand? A
comparative analysis of different indicators of corruption, Policy research working paper, The World
Bank Development Research Group.
Hand, L. (1947) United States v. Carroll Towing Co., 159 F.2d 169 (2d Cir.).
Kaufmann, D., Kraay, A. and Mastruzzi, M. (2005) Governance matters IV: Governance indicators
for 1996–2004, The World Bank.
Kaufmann, D., Kraay, A. and Mastruzzi, M. (2010) The worldwide governance indicators:
Methodology and analytical issues, Policy research working paper, The World Bank Development
Research Group.
Kaufmann, D., Kraay, A. and Zoido-Lobatón, P. (1999) Aggregating governance indicators, Policy
research working paper, The World Bank Development Research Group.
Keating, G. C. (2015) ‘Must the Hand Formula not be named?’, University of Pennsylvania Law
Review, vol. 163, pp. 367–375.
Stanley, K. D., Loredo, E. N., Burger, N., Miles, J. N. V. and Saloga, C. W. (2014) Business bribery
risk assessment, RAND Corporation.
The World Bank (2017) ‘Worldwide governance indicators’, available at
http://info.worldbank.org/governance/wgi/.
TRACE International (2017) ‘The TRACE bribery risk matrix’, available at
https://www.traceinternational.org/trace-matrix.
Transparency International (2017a) ‘Corruption perceptions index 2016: Full source description’,
Transparency International.
Transparency International (2017b) ‘Corruption perceptions index 2016: Technical methodology
note’, Transparency International.
Transparency International (2017c) ‘Corruption perceptions index 2016: Technical methodology
note’, Transparency International.
Transparency International (2012) GATEway: Mapping the corruption assessment landscape,
Transparency International.
Transparency International (2017) ‘Corruption perceptions index’, available at
https://www.transparency.org/research/cpi/overview.
U.S. Department of Justice and U.S. Securities and Exchange Commission (2012) ‘A resource guide
to the U.S. Foreign Corrupt Practices Act’, available at https://www.justice.gov/criminal-fraud/fcpa-
guidance.