modelling the spatio-temporal development of building … · modelling the spatio-temporal...
TRANSCRIPT

Dr. Peter Moser: modelling land prices
Modelling the Spatio-temporalDevelopment of Building LandPrices in the Canton of Zurich:
A Mixed-Effects Approach.

Dr. Peter Moser
Starting Point
• For a variety of reasons (scientific, personal, legal, fiscal etc.) lots ofpeople are interested in actual but also historical „mean prices" paidfor residential building land plots in the municipalities of the Canton ofZurich.
• There is lots of data available: Since 1974 there exists in the Cantonof Zurich a more or less complete data base of all real estatetransactions notified with the authorities, among which there are noless than
• ~ 58 000 Transactions concerning undeveloped land plots forresidential building (unbebautes Wohnbauland)
• There are, however a few problems….
Dr. Peter Moser
1974 1975 1976 1977 1978 1979 1980 1981
1982 1983 1984 1985 1986 1987 1988 1989
1990 1991 1992 1993 1994 1995 1996 1997
1998 1999 2000 2001 2002 2003 2004 2005
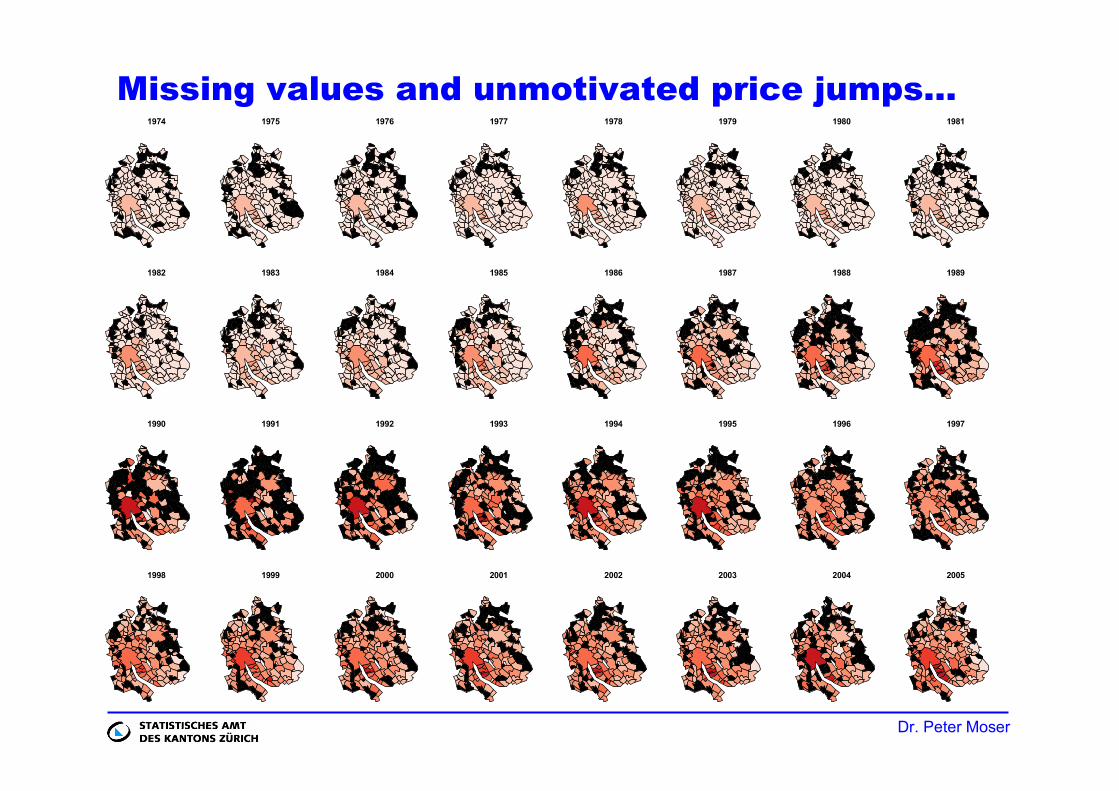
Missing values and unmotivated price jumps…

Dr. Peter Moser
….implied in the spatio-temporal sparsity of thedata• For no less than 18% of the 5472 potential
combinations of (171) municipalities Xyears (32; 1974–2005) no transactionstook place at all.
• For a further 20% of these grid pointsmean prices can‘t be published forreasons of data protection (number oftransactions <3)
For a total of 38% of the grid-points nomean price can be published.
• And the n of Transactions is small formuch of the other grid-points, so meansare of limited value (Small-area Problem!)
High temporal variability of communalprices from year to year (dependent onthe actual mix of micro conditions,perhaps also on particular supply-demand constellations) 0 5 10 15 20 25 30
0.0
0.2
0.4
0.6
0.8
1.0
Number of Transactions per municpality x year
Pro
po
rtio
n<
=x
n:5440 m:0

Dr. Peter Moser
What do we want?
• Estimation of mean prices for all missing year x municipalitygridpoints in a methodically transparent and consistent framework
• Smoothing of the temporal development of mean prices; we want toextract the „signal“ and eliminate the „noise“ created by particularmixes of micro conditions of traded land plots, especially if thenumber of transactions is small.
• Optimal use of all available information about transactions.
• At an acceptable Cost: No back-collection of historical data aboutthe micro-locations of traded land plots – eg. exposition ,distance toinfrastructure like schools, train-stations etc. –: This is out of thequestion.
• Which means: we have to do with covariates relating to themunicipal level or above: a detailed hedonic model of building land-prices, including data on micro-conditions is not feasible - at least forthe more distant past.

Dr. Peter Moser
Some indicators of the market in land plots1974-2005 I
• Number of transactions ...
• ... volume traded (in qm)....
• .... Transaction volume (in SFr).....
• ... Median surface area of landplots traded
1 97 5 1 98 0 1 98 5 1 99 0 1 9 95 2 0 00 2 0 05
1000
3000
5000
Nu
mb
er
of
tran
sacti
on
s
1 97 5 1 98 0 1 98 5 1 99 0 1 9 95 2 0 00 2 0 05
0.5
1.0
1.5
2.0
2.5
are
avo
lum
e(M
io.q
m)
1 97 5 1 98 0 1 98 5 1 99 0 1 9 95 2 0 00 2 0 05
200
400
600
80
0
mo
ne
tary
vo
lum
e(M
io.S
Fr)
1 97 5 1 98 0 1 98 5 1 99 0 1 9 95 2 0 00 2 0 05
200
400
600
80
0
Med
ian
are
ao
fp
lots
(qm
)

Dr. Peter Moser
Price development 1974-2005 II
• ...the cantonal median price persqare metre of land(unweighted)
• and the geometric mean, whichis a quite robust measure forthe central tendency in the caseof left-skewed data, which canbe „normalized“ by taking thelog.
• Caveat: We don‘t want toexplain this generaldevelopment of prices. It isendogenous to our model. Weare only interested in thedivergent developments in themunicipalites of the canton!
1975 1980 1985 1990 1995 2000 2005
20
03
00
40
05
00
60
07
00
Me
dia
np
ric
ep
er
sq
are
me
tre
(SF
r/q
m)

Dr. Peter Moser
ktlogpricejahr
log
(frq
m)
5
6
7
5.0 5.5 6.0
Adliswil Aeugst, Affoltern
5.0 5.5 6.0
BachenbülachBachs, Stadel, Weiach
5.0 5.5 6.0
BassersdorfBauma, Sternenberg
Benken, Dachsen, RheinauElgg, Hagenbuch Embrach Erlenbach Fällanden
5
6
7
Fehraltorf
5
6
7
Feuerthalen Herrliberg HinwilHirzel, Hütten, SchönenbergRorbas Rümlang
Rüti SchwerzenbachSeegräben, Wetzikon Uitikon Uster
5
6
7
Wädenswil
5
6
7
Wald
5.0 5.5 6.0
Wallisellen Winterthur
5.0 5.5 6.0
Zollikon Zumikon
5.0 5.5 6.0
Zürich
Land Prices develop differently in themunicipalities of the Canton
• log(frqm)=β0+β1log(ktpricejahr)
• β0 (Intercepts): differ betweenthe municipalities
general price levels ascompared to the cantonal meandiffer (High on the „Gold-Coast“, low in peripherealregions)
• β1 (Slopes) differ too:
municipal prices „react“differently to the generaldevelopment, elasticities vary(log~log=Δ%~Δ%)
• ~ the relationship is more orless linear

Dr. Peter Moser
Fixed effects Modelling municipality-wise
• A somewhat more schematicview of the group-wiseParameters and theirconfidence intervals
• May be a solution: acollection of fixed effectsmodels for all municipalitesand variables!
• Or we could wrap this up intoa single model with complexinteractions
ste
fbe
z
Adliswil
Aeugst, Affoltern
Bachenbülach
Bachs, Stadel, Weiach
Bassersdorf
Bauma, Sternenberg
Benken, Dachsen, Rheinau
Elgg, Hagenbuch
Embrach
Erlenbach
Fällanden
Fehraltorf
Feuerthalen
Herrliberg
Hinwil
Hirzel, Hütten, Schönenberg
Rorbas
Rümlang
Rüti
Schwerzenbach
Seegräben, Wetzikon
Uitikon
Uster
Wädenswil
Wald
Wallisellen
Winterthur
Zollikon
Zumikon
Zürich
5.0 5.5 6.0 6.5
|
|
|
|
|
|
|
|
|
|
|
|
|
|
|
|
|
|
|
|
|
|
|
|
|
|
|
|
|
|
|
|
|
|
|
|
|
|
|
|
|
|
|
|
|
|
|
|
|
|
|
|
|
|
|
|
|
|
|
|
|
|
|
|
|
|
|
|
|
|
|
|
|
|
|
|
|
|
|
|
|
|
|
|
|
|
|
|
|
|
(Intercept)
0.6 0.8 1.0 1.2
|
|
|
|
|
|
|
|
|
|
|
|
|
|
|
|
|
|
|
|
|
|
|
|
|
|
|
|
|
|
|
|
|
|
|
|
|
|
|
|
|
|
|
|
|
|
|
|
|
|
|
|
|
|
|
|
|
|
|
|
|
|
|
|
|
|
|
|
|
|
|
|
|
|
|
|
|
|
|
|
|
|
|
|
|
|
|
|
|
|
ktlogpricejahr2
log(frqm)= β0 + β1(frqmzh)

Dr. Peter Moser
The problem with fixed effects – and a solution
• A fixed-effects-model with interactions becomes complex very rapidlyespecially if the basic model incorporates many variables ( e. g.municipal tax rates etc.) parameters tend to proliferate.
• Municipality-specific parameter estimates are often based on a verysmall number of cases (transactions) and are therefore unreliable:this is especially true for the Slopes, the β1
Solution: Mixed-effects model
• Basic principle: we estimate overall fixed-effect-parameters for theindependent variables. They represent something like mean effectsof a variable.
• The variability of the parameters between the municipalities ismodelled by a distribution – often a normal distribution with thecorresponding fixed effect as a mean and a standard deviationdependent on the variability of the municipality-specific estimates ofthe parameter in question.

Dr. Peter Moser
A simple mixed-effects model• Fixed effects:
• log(frqm)=β0+β1log(frqmzh)+β2steuerfuss
log transaction prices per square metre depend on a cantonal priceindex (exogenous!) and the municipal tax rate.
• Random effects:
• The intercept as well as the slopes of the explanatory variableslog(ktpricejahr) and steuerfuss (tax rate) are allowed to varybetween municipalites; we assume the parameter distribution to benormal.
Transaction prices in the municipalites are allowed to have differentlevels and may also differ in their elasticity towards the general trendin land prices and changes in the municipal tax rates.
• A model specified this way explains about 71% of the variability oflog(frqm) (pseudo-R2; correlation2 between actual transaction pricesand model values). The lion‘s share of the explanatory power of themodel is, unsurprisingly, due to the explanatory power of thecantonal building land price index over time.
Dr. Peter Moser
Implications and advantages of this modellingstrategy
• The normal distribution of the random effects parameters implies thatmunicipal parameter values far from the (fixed effect) mean (in the tailsof the distribution), are rather improbable.
• The random-effects parameters of the explanatory variables (and theintercept) of a particular municipality are (ceteris paribus) relativelyclose to the mean:
If price information (the number of transactions) is sparse.
If the variability of this within-municipality price information is high.
• In difference to fixed-effects model with interactions, the estimates ofthe municipal parameters of the explanatory variables depend not onlyon the information from within this particular spatial unit.
• Municipality-specific parameter values are more or less stronglyinfluenced by the „general situation“, if information within the unit issparse or ambigous. This principle of "borrowing strength" stabilisesestimates and implies a smoothing of the estimates for mean values.

Dr. Peter Moser
1974 1975 1976 1977 1978 1979 1980 1981
1982 1983 1984 1985 1986 1987 1988 1989
1990 1991 1992 1993 1994 1995 1996 1997
1998 1999 2000 2001 2002 2003 2004 2005
The smoothing effect of the model I

Dr. Peter Moser
Smoothing of the communal mean price trajectories
Ro h e M itte lw er te
Tim e
Bo
de
np
reis
inF
r/q
m
1975 1980 1985 1990 1995 2000 2005
05
00
10
00
15
00
M o d e llw e rte
Tim e
Bo
de
np
reis
inF
r/q
m
1 975 1980 1985 1990 1995 2000 2005
05
00
10
00
15
00
•A different view of the temporal aspect:
"raw" mean prices modelled mean prices

Dr. Peter Moser
raw (unmodelled) municpal prices (SFr/ square metre)
mo
de
lva
lue
sm
unic
ipalpri
ce
s(S
Fr/
sq
uare
metr
e)
0
500
1000
1500
0 500 1000 1500 2000
(0,5](1973,1987]
(5,20](1973,1987]
0 500 1000 1500 2000
(20,Inf](1973,1987]
(0,5](1987,1991]
(5,20](1987,1991]
0
500
1000
1500(20,Inf]
(1987,1991]0
500
1000
1500(0,5]
(1991,2005]
0 500 1000 1500 2000
(5,20](1991,2005]
(20,Inf](1991,2005]
The logic of the smoothing
• A small number of trans-actions per year andmunicipality and a largeamount of variabilty:
• Implies a shifting of modelestimates of the meanland price in a munici-pality towards the can-tonal mean (the fixedeffect): In these cases:
• If the raw mean is „toohigh“ model estimates arelower.
• And vice versa
That‘s what "borrowingstrength„ means

Dr. Peter Moser
Some examples ….
• Model estimates
• (Geometric) meanvalues
• Actual transactions
1975 1985 1995 2005
0500
1000
1500
Hombrechtikon
Bodenpre
isin
Fr/
qm
1975 1985 1995 2005
0500
1000
1500
Urdorf
Bodenpre
isin
Fr/
qm
1975 1985 1995 2005
0500
1000
1500
Wald (ZH)
Bodenpre
isin
Fr/
qm
1975 1985 1995 2005
0500
1000
1500
Uitikon
Bodenpre
isin
Fr/
qm

Dr. Peter Moser
….
1975 1980 1985 1990 1995 2000 2005
0500
1000
1500
Stäfa
Bodenpre
isin
Fr/
qm
1975 1980 1985 1990 1995 2000 2005
0500
1000
1500
Meilen
Bodenpre
isin
Fr/
qm
1975 1980 1985 1990 1995 2000 2005
0500
1000
1500
Rüschlikon
Bodenpre
isin
Fr/
qm
1975 1980 1985 1990 1995 2000 2005
0500
1000
1500
Hüttikon
Bodenpre
isin
Fr/
qm
1975 1980 1985 1990 1995 2000
0500
1000
1500
Adlikon
Bodenpre
isin
Fr/
qm
1975 1980 1985 1990 1995 2000 2005
0500
1000
1500
Knonau
Bodenpre
isin
Fr/
qm

Dr. Peter Moser
And some more …
1975 1980 1985 1990 1995
0500
1000
1500
Schleinikon
Bodenpre
isin
Fr/
qm
1975 1980 1985 1990 1995 2000 2005
0500
1000
1500
Truttikon
Bodenpre
isin
Fr/
qm
1975 1980 1985 1990 1995 2000 2005
0500
1000
1500
Hedingen
Bodenpre
isin
Fr/
qm
1975 1980 1985 1990 1995 2000 2005
0500
1000
1500
Elgg
Bodenpre
isin
Fr/
qm
1975 1980 1985 1990 1995 2000 2005
0500
1000
1500
Winterthur
Bodenpre
isin
Fr/
qm
1975 1980 1985 1990 1995 2000 2005
0500
1000
1500
Wallisellen
Bodenpre
isin
Fr/
qm

Dr. Peter Moser
Summary - Perspectives
• Mixed-Effects modelling als a flexible but nevertheless parametricstrategy for this problem, which is at its core a small area estimationproblem
• Estimates are based on a single model, formally implementing somekind of "common sense" – which is what statistics is - or should be -all about in the first place.
• The model actually has an explanatory value, and could be used foranalytical purposes.
• The future:
mixed-effects quantile regression: a L1-norm-strategy would allowus to model medians and quantiles directly, without having totransform the dependent variable – which is always difficult toexplain to lay people.
Endogenization of the general trend in land prices would allow for amuch more powerful model.

Dr. Peter Moser
Thanks for your attention
For further information, do not hesitate to contact me:
Dr. Peter Moser
Forschungsleiter
Statistisches Amt des Kantons Zürich
Bleicherweg 5
8090 Zürich