modelling the impact of the weather on road casualty
TRANSCRIPT
Reported Road Casualties Great Britain: 2014 Annual Report
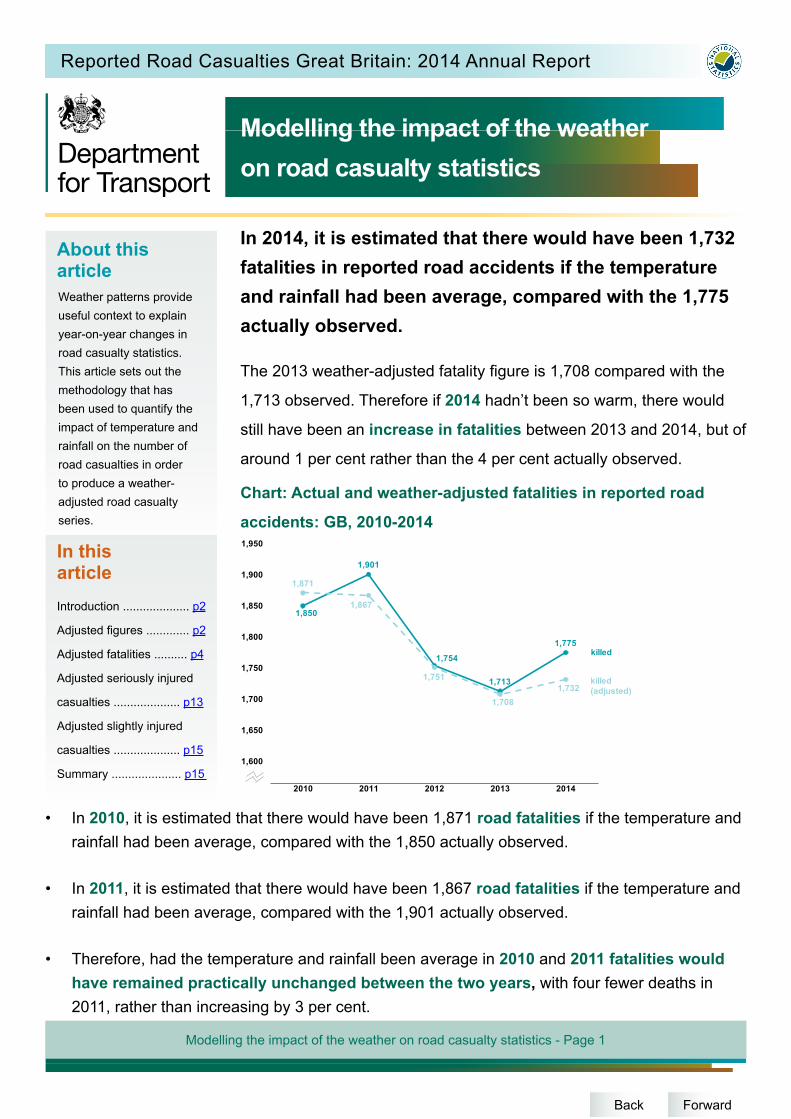
Chart: Actual and weather-adjusted fatalities in reported road
accidents: GB, 2010-2014
1,850
1,901
1,754
1,713
1,775
1,871
1,867
1,751
1,7081,732
1,600
1,650
1,700
1,750
1,800
1,850
1,900
1,950
2010 2011 2012 2013 2014
killed
killed (adjusted)
Modelling the impact of the weather on road casualty statistics - Page 1
In this articleIntroduction .................... p2
Adjusted figures ............. p2
Adjusted fatalities .......... p4
Adjusted seriously injured
casualties .................... p13
Adjusted slightly injured
casualties .................... p15
Summary ..................... p15
About this articleWeather patterns provide useful context to explain year-on-year changes in road casualty statistics. This article sets out the methodology that has been used to quantify the impact of temperature and rainfall on the number of road casualties in order to produce a weather-adjusted road casualty series.
In 2014, it is estimated that there would have been 1,732 fatalities in reported road accidents if the temperature and rainfall had been average, compared with the 1,775 actually observed.
The 2013 weather-adjusted fatality figure is 1,708 compared with the
1,713 observed. Therefore if 2014 hadn’t been so warm, there would
still have been an increase in fatalities between 2013 and 2014, but of
around 1 per cent rather than the 4 per cent actually observed.
• In 2010, it is estimated that there would have been 1,871 road fatalities if the temperature and rainfall had been average, compared with the 1,850 actually observed.
• In 2011, it is estimated that there would have been 1,867 road fatalities if the temperature and rainfall had been average, compared with the 1,901 actually observed.
• Therefore, had the temperature and rainfall been average in 2010 and 2011 fatalities would have remained practically unchanged between the two years, with four fewer deaths in 2011, rather than increasing by 3 per cent.
Modelling the impact of the weather on road casualty statistics
Back Forward
Modelling the impact of the weather on road casualty statistics - Page 2
Introduction
Weather patterns have been used to help explain year-on-year and quarterly changes in road
casualty numbers in recent publications (see here). A chapter in Reported Road Casualties Great
Britain: 2013 Annual Report summarised the literature available on weather impacts on road
accidents and casualties as well as discussing the main weather trends seen since 2010 and their
likely impact on road casualties (see here). This article sets out the methodology that has been
used to quantify the impact of temperature and rainfall on the number of road casualties in
order to produce a weather-adjusted road casualty series.
The work in this article is based on modelling work carried out by the ONS Time Series Analysis
Branch. More detailed results from the original research can be found on page 74 of the cross
government modelling guide on the effect of weather on official statistics.
We have also introduced a new time series table alongside the article. The table (RAS30080)
provides our best estimate of what the casualty numbers could have been for each year from 1991
had the average temperature and rainfall each month during the year been close to the long term
average. These figures are just estimates of what could have happened rather than predictions of
what would have happened as there is a considerable amount of uncertainty associated with using
such a model. The purpose of the estimates is as a tool for understanding and explaining patterns.
They are not intended as a replacement for the police reported road casualty figures provided in the
other tables.
Monthly UK rainfall and mean temperature data from the Met Office was used to estimate the
relationship between temperature and rainfall and the number of reported road traffic casualties
in each month. In particular, the number of casualties was broken down by severity (fatal,
seriously injured and slightly injured casualties) and road user group: pedestrians, pedal cyclists,
motorcyclists and car occupants. These groups cover 94 per cent of all casualties.
The models used monthly casualty data for the whole of Great Britain from January 1991 to
December 2014, and the monthly deviations in each month over January 1991 to December 2014
from the long term average temperature and rainfall. Twelve separate time series models, one for
each combination of severity and road user group were produced. The estimated temperature and
rainfall effects from each model were used to adjust the road casualty time series over 1991 to
2014. A more thorough explanation of the models used can be found in the technical document.
Assessing the impact of temperature and rainfall on all road user casualties
ForwardBackHome
Weather-adjusted road casualty figure
Modelling the impact of the weather on road casualty statistics - Page 3
The estimated temperature and rainfall effects from the time series modelling have been used to
produce temperature and rainfall adjusted road casualty figures for the time period 1991 to
2014. These casualty figures represent the number of road casualties we would have expected that
year had the temperature and rainfall in each month of the year been at the long term average.
All statistical models are ways of generalising something that is happening in the real world. In this
case, we are attempting to model how casualty numbers are affected by variations in temperature
and rainfall. This is an imprecise science that collapses detailed local differences in weather
across the UK into a single figure. This model, like all statistical models, has a level of uncertainty
associated with it. In particular, the analysis used here models how relatively common and regular
weather variations influences casualty numbers. It is less good, therefore, at dealing with extreme
events or highly unseasonable events. In addition, statistically significant effects have not been
found in all months for each road user type and severity. Therefore unusual conditions in some
months will not result in any adjustment to the casualty figures. Owing to the uncertainty in the
model, these figures should be taken only as our best estimate of what might have happened had
the weather during the years been closer to the long term average. There is no way to verify that
these outcomes would have happened given different conditions.
The direction of the estimated temperature and rainfall effects for each road user type (pedestrians,
pedal cyclists, motorcyclists and car occupants) are summarised in the tables below for each
severity. The actual values of the estimated effects are available in the technical document. For
example, a positive relationship was found between temperature and killed pedal cyclists in
January, March and December. Therefore, above average temperatures in these months lead to
more killed pedal cyclists than would be expected if the temperature was at the long term average.
The pedal cyclist fatality figures are therefore adjusted downwards to account for this positive
effect. Below average temperatures in January, March and December lead to less pedal cyclist
fatalities than expected and the figures are adjusted upwards to account for this e.g. December
2010 was particularly cold which is estimated to have led to 2 fewer killed pedal cyclists than would
be expected. The December 2010 pedal cyclist fatality figure is therefore adjusted upwards by 2 to
account for this effect.
Modelling the impact of the weather on road casualty statistics - Page 4
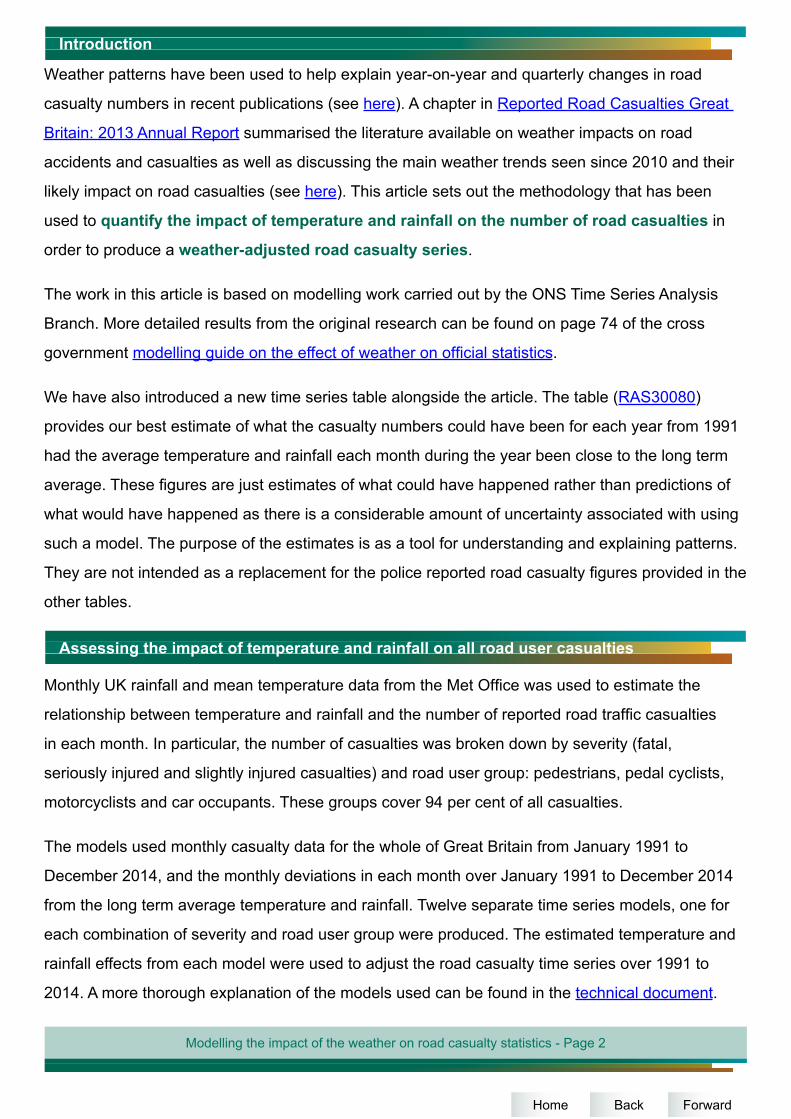
Table 1: Direction of the estimated temperature and rainfall effects on road casualties by
severity and road user type
Month Weather Month Weather Month Weather
n n n n n n n nn n n n n n n n n nn n n n n n n
n n n n n n n n n
n n n nn n n n n n n n
n n n n n n n
n n n n n n n
n n n n n n n nn n n n n n n n n
n n n n n n n n n nn n n n n n
n n n n n n n n nn n n n n n n n
n n n n n n n n n nn n n n n n n
n n n n n n n n nn n n n n n n n
n n n n n n n n n n
n n n n n n n n n n
n n n n n n n n n n
n n n n n n n n
n n n n n n n n n n n n n
n - not statistically significant Above average temperature or rainfall leads to more casualties. When the temperature or rainfall is above the long term average in these months the casualty numbers are adjusted downwards, and upwards when the temperature or rainfall is below the long term average. Above average temperature or rainfall leads to fewer casualties. When the temperature or rainfall is above the long term average in thesemonths the casualty numbers are adjusted upwards, and downwards when the temperature or rainfall is below the long term average.
Jan
Feb
Mar
Apr
May
Dec
Fatalities Seriously injured
Jan
Feb
Mar
Apr
May
Jun
Jul
Jun
Jul
Aug
Sep
Oct
Nov
Slightly injured
Jan
Feb
Mar
Apr
Aug
Sep
Oct
Nov
Dec
Nov
Dec
May
Jun
Jul
Aug
Sep
Oct
Applying the fatality adjustments (as shown in the technical document) to all years over 1991 to
2014 and all road user groups gives the following weather-adjusted fatalities series:
Chart 1: Actual and weather-adjusted fatalities in reported road accidents: GB, 1991-2014
Tables• Reported weather-adjusted road casualties by road user type, Great Britain, annual from 1991: RAS30080.
0
500
1,000
1,500
2,000
2,500
3,000
3,500
4,000
4,500
5,000
1991
1992
1993
1994
1995
1996
1997
1998
1999
2000
2001
2002
2003
2004
2005
2006
2007
2008
2009
2010
2011
2012
2013
2014
killed
killed (adjusted)
1,775
1,732
2014:
Modelling the impact of the weather on road casualty statistics - Page 5
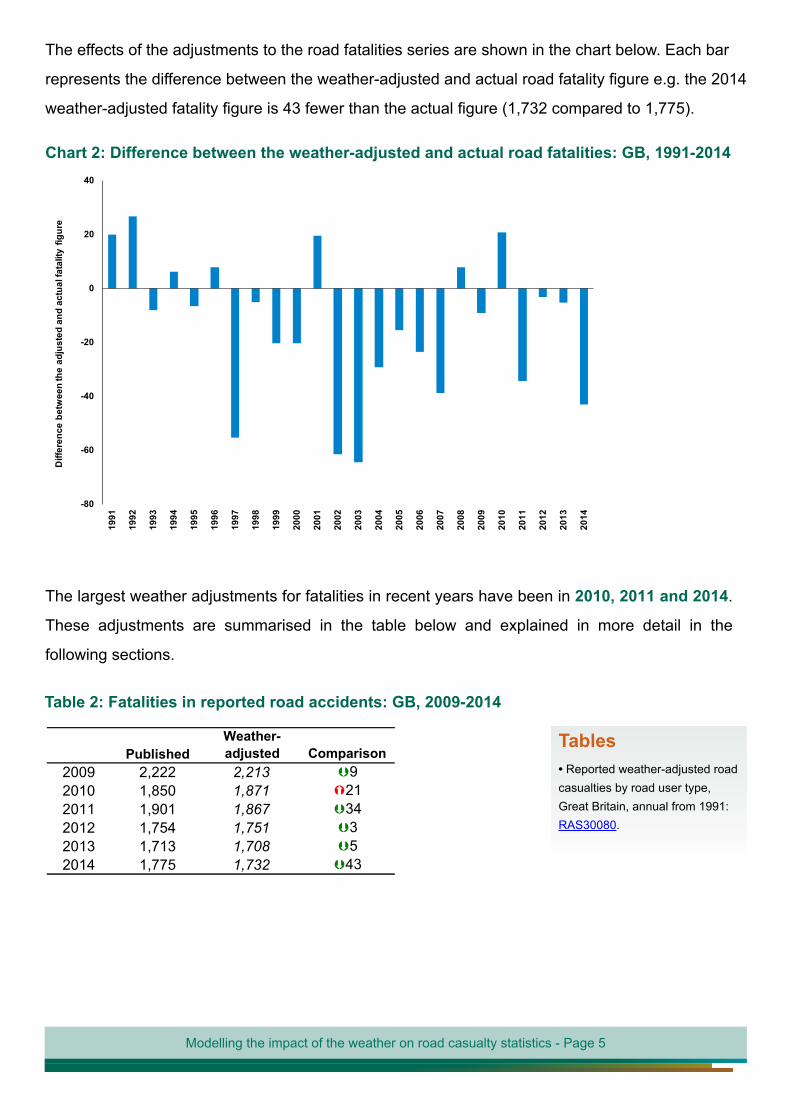
The effects of the adjustments to the road fatalities series are shown in the chart below. Each bar
represents the difference between the weather-adjusted and actual road fatality figure e.g. the 2014
weather-adjusted fatality figure is 43 fewer than the actual figure (1,732 compared to 1,775).
Chart 2: Difference between the weather-adjusted and actual road fatalities: GB, 1991-2014
-80
-60
-40
-20
0
20
40
1991
1992
1993
1994
1995
1996
1997
1998
1999
2000
2001
2002
2003
2004
2005
2006
2007
2008
2009
2010
2011
2012
2013
2014
Diff
eren
ce b
etw
een
the
adju
sted
and
act
ual f
atal
ity fi
gure
The largest weather adjustments for fatalities in recent years have been in 2010, 2011 and 2014.
These adjustments are summarised in the table below and explained in more detail in the
following sections.
Table 2: Fatalities in reported road accidents: GB, 2009-2014
PublishedWeather-adjusted Comparison
2009 2,222 2,213 92010 1,850 1,871 212011 1,901 1,867 342012 1,754 1,751 32013 1,713 1,708 52014 1,775 1,732 43
Tables• Reported weather-adjusted roadcasualties by road user type, Great Britain, annual from 1991: RAS30080.
Adjusted fatalities 2010(21)
Modelling the impact of the weather on road casualty statistics - Page 6
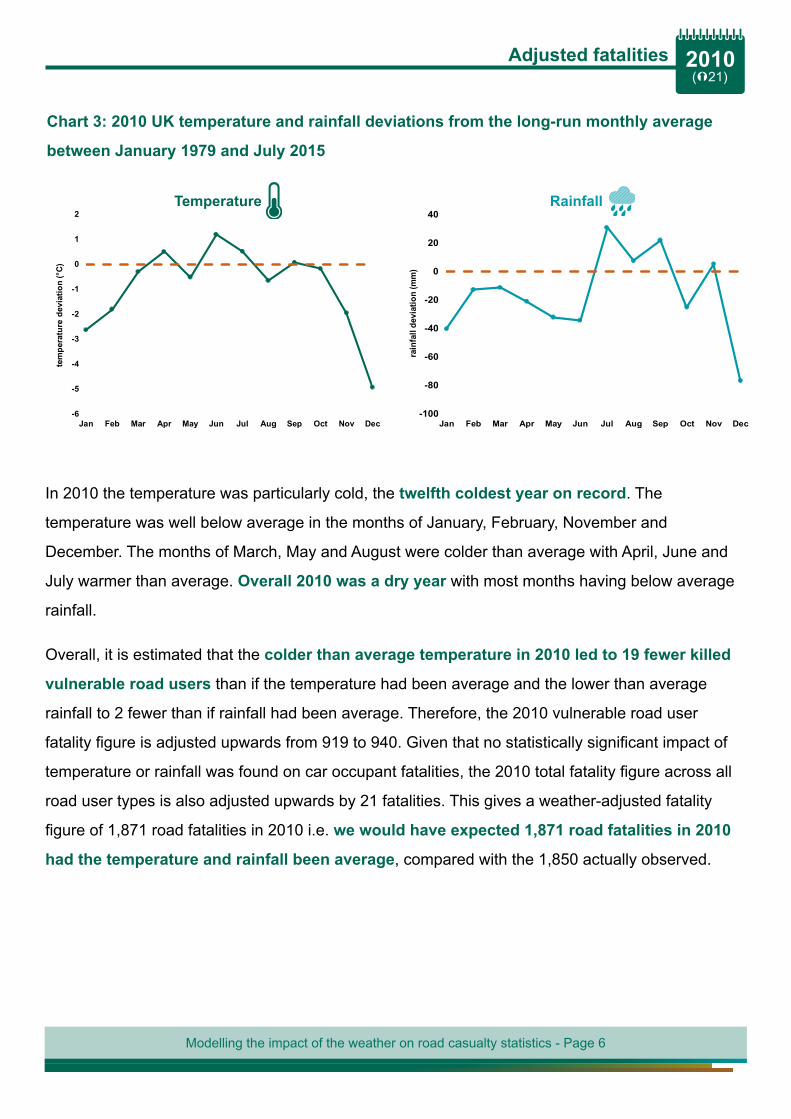
Chart 3: 2010 UK temperature and rainfall deviations from the long-run monthly average
between January 1979 and July 2015
-6
-5
-4
-3
-2
-1
0
1
2
Jan Feb Mar Apr May Jun Jul Aug Sep Oct Nov Dec
tem
pera
ture
dev
iatio
n (°
C)
-100
-80
-60
-40
-20
0
20
40
Jan Feb Mar Apr May Jun Jul Aug Sep Oct Nov Decra
infa
ll de
viat
ion
(mm
)
Temperature Rainfall
In 2010 the temperature was particularly cold, the twelfth coldest year on record. The
temperature was well below average in the months of January, February, November and
December. The months of March, May and August were colder than average with April, June and
July warmer than average. Overall 2010 was a dry year with most months having below average
rainfall.
Overall, it is estimated that the colder than average temperature in 2010 led to 19 fewer killed
vulnerable road users than if the temperature had been average and the lower than average
rainfall to 2 fewer than if rainfall had been average. Therefore, the 2010 vulnerable road user
fatality figure is adjusted upwards from 919 to 940. Given that no statistically significant impact of
temperature or rainfall was found on car occupant fatalities, the 2010 total fatality figure across all
road user types is also adjusted upwards by 21 fatalities. This gives a weather-adjusted fatality
figure of 1,871 road fatalities in 2010 i.e. we would have expected 1,871 road fatalities in 2010
had the temperature and rainfall been average, compared with the 1,850 actually observed.
Modelling the impact of the weather on road casualty statistics - Page 7
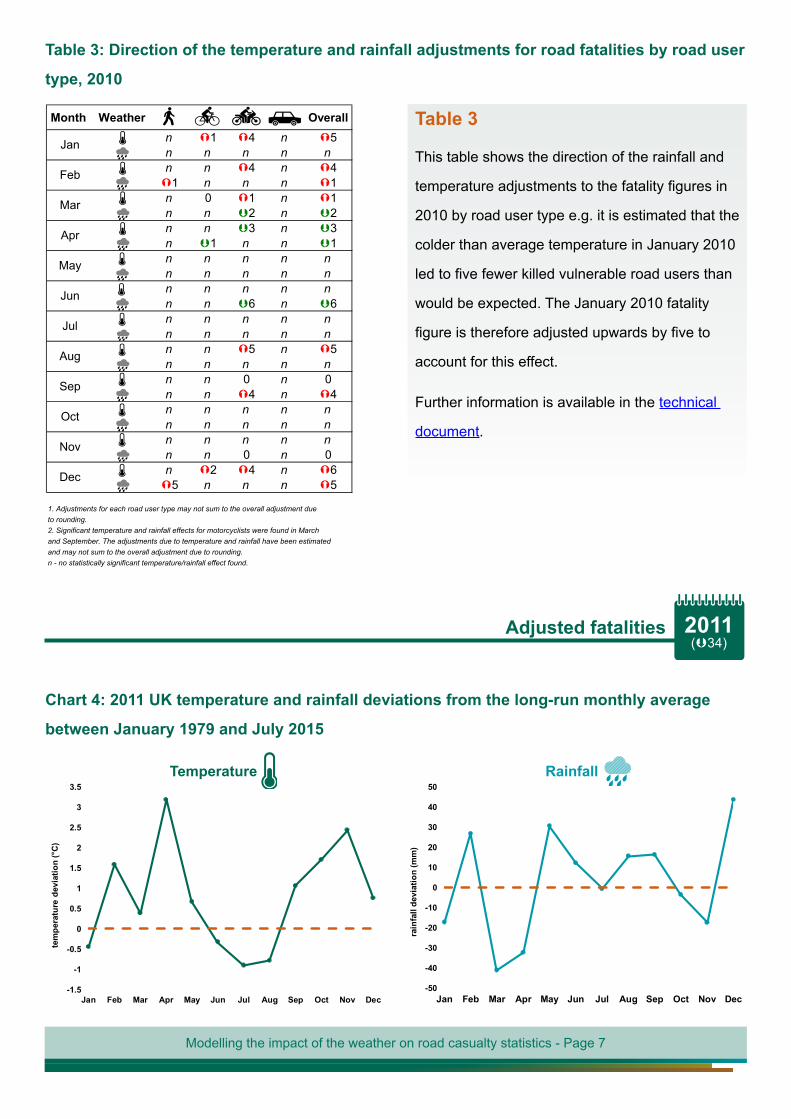
Table 3: Direction of the temperature and rainfall adjustments for road fatalities by road user
type, 2010
Month Weather Overalln 1 4 n 5n n n n nn n 4 n 41 n n n 1n 0 1 n 1n n 2 n 2n n 3 n 3n 1 n n 1n n n n nn n n n nn n n n nn n 6 n 6n n n n nn n n n nn n 5 n 5n n n n nn n 0 n 0n n 4 n 4n n n n nn n n n nn n n n nn n 0 n 0n 2 4 n 65 n n n 5
1. Adjustments for each road user type may not sum to the overall adjustment due to rounding. 2. Significant temperature and rainfall effects for motorcyclists were found in Marchand September. The adjustments due to temperature and rainfall have been estimatedand may not sum to the overall adjustment due to rounding. n - no statistically significant temperature/rainfall effect found.
Dec
Jun
Jul
Aug
Sep
Oct
Nov
Jan
Feb
Mar
Apr
May
Table 3
This table shows the direction of the rainfall and
temperature adjustments to the fatality figures in
2010 by road user type e.g. it is estimated that the
colder than average temperature in January 2010
led to five fewer killed vulnerable road users than
would be expected. The January 2010 fatality
figure is therefore adjusted upwards by five to
account for this effect.
Further information is available in the technical
document.
Adjusted fatalities 2011(34)
Chart 4: 2011 UK temperature and rainfall deviations from the long-run monthly average
between January 1979 and July 2015
-1.5
-1
-0.5
0
0.5
1
1.5
2
2.5
3
3.5
Jan Feb Mar Apr May Jun Jul Aug Sep Oct Nov Dec
tem
pera
ture
dev
iatio
n (°
C)
-50
-40
-30
-20
-10
0
10
20
30
40
50
Jan Feb Mar Apr May Jun Jul Aug Sep Oct Nov Dec
rain
fall
devi
atio
n (m
m)
Temperature Rainfall
Modelling the impact of the weather on road casualty statistics - Page 8
2011 was a warm year with most months having temperatures above average with April 2011
the warmest April on record. Overall, it is estimated that the warmer temperature in 2011 led
to 21 more vulnerable road user fatalities than would have been expected if the temperature
had been average. Overall 2011 rainfall was close to average. However, there were months
where rainfall differed significantly from the averag . Largely due to the dry March, April and
November it is estimated that there were 13 more vulnerable road user fatalities in 2011 than would
be expected if rainfall had been average.
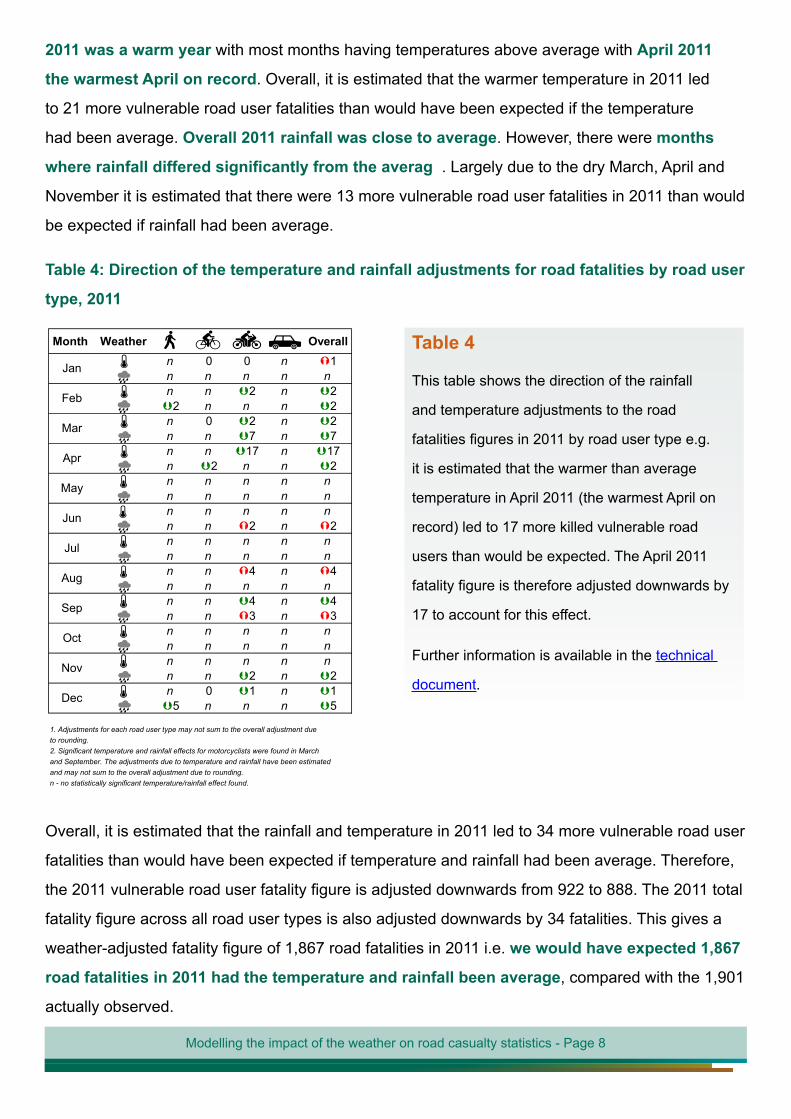
Table 4: Direction of the temperature and rainfall adjustments for road fatalities by road user
type, 2011
Month Weather Overalln 0 0 n 1n n n n nn n 2 n 22 n n n 2n 0 2 n 2n n 7 n 7n n 17 n 17n 2 n n 2n n n n nn n n n nn n n n nn n 2 n 2n n n n nn n n n nn n 4 n 4n n n n nn n 4 n 4n n 3 n 3n n n n nn n n n nn n n n nn n 2 n 2n 0 1 n 15 n n n 5
1. Adjustments for each road user type may not sum to the overall adjustment due to rounding. 2. Significant temperature and rainfall effects for motorcyclists were found in Marchand September. The adjustments due to temperature and rainfall have been estimatedand may not sum to the overall adjustment due to rounding. n - no statistically significant temperature/rainfall effect found.
Aug
Sep
Oct
Nov
Dec
Jan
Feb
Mar
Apr
May
Jun
Jul
Table 4
This table shows the direction of the rainfall
and temperature adjustments to the road
fatalities figures in 2011 by road user type e.g.
it is estimated that the warmer than average
temperature in April 2011 (the warmest April on
record) led to 17 more killed vulnerable road
users than would be expected. The April 2011
fatality figure is therefore adjusted downwards by
17 to account for this effect.
Further information is available in the technical
document.
Overall, it is estimated that the rainfall and temperature in 2011 led to 34 more vulnerable road user
fatalities than would have been expected if temperature and rainfall had been average. Therefore,
the 2011 vulnerable road user fatality figure is adjusted downwards from 922 to 888. The 2011 total
fatality figure across all road user types is also adjusted downwards by 34 fatalities. This gives a
weather-adjusted fatality figure of 1,867 road fatalities in 2011 i.e. we would have expected 1,867
road fatalities in 2011 had the temperature and rainfall been average, compared with the 1,901
actually observed.
Modelling the impact of the weather on road casualty statistics - Page 9
The weather-adjusted fatality figure for 2010 is 1,871 and 1,867 for 2011. The 2010 and 2011
figures were particularly affected by the weather (2010 by the cold weather and 2011 by the
warm weather) and adjusting for the weather shows that had the temperature and rainfall been
average in 2010 and 2011 fatalities would have been unchanged between the two years (4
fewer in 2011).
Adjusted fatalities 2012(3)
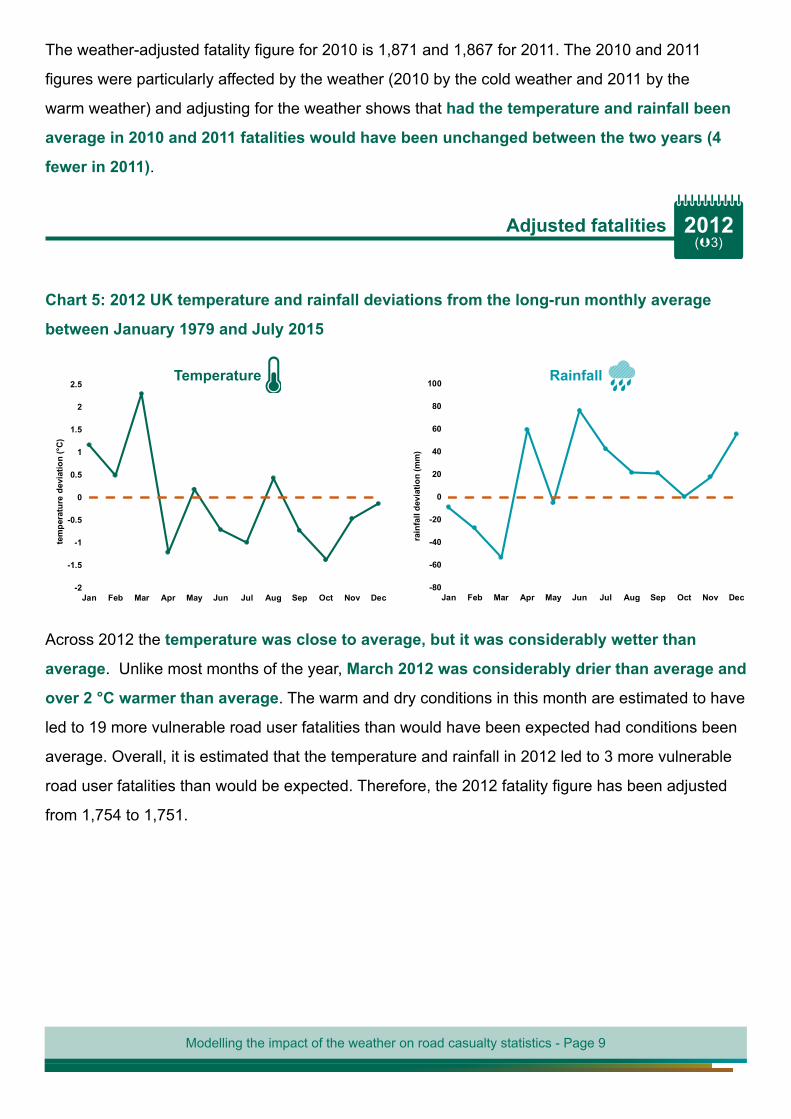
Chart 5: 2012 UK temperature and rainfall deviations from the long-run monthly average
between January 1979 and July 2015
-2
-1.5
-1
-0.5
0
0.5
1
1.5
2
2.5
Jan Feb Mar Apr May Jun Jul Aug Sep Oct Nov Dec
tem
pera
ture
dev
iatio
n (°
C)
-80
-60
-40
-20
0
20
40
60
80
100
Jan Feb Mar Apr May Jun Jul Aug Sep Oct Nov Dec
rain
fall
devi
atio
n (m
m)
Temperature Rainfall
Across 2012 the temperature was close to average, but it was considerably wetter than
average. Unlike most months of the year, March 2012 was considerably drier than average and
over 2 °C warmer than average. The warm and dry conditions in this month are estimated to have
led to 19 more vulnerable road user fatalities than would have been expected had conditions been
average. Overall, it is estimated that the temperature and rainfall in 2012 led to 3 more vulnerable
road user fatalities than would be expected. Therefore, the 2012 fatality figure has been adjusted
from 1,754 to 1,751.
Modelling the impact of the weather on road casualty statistics - Page 10
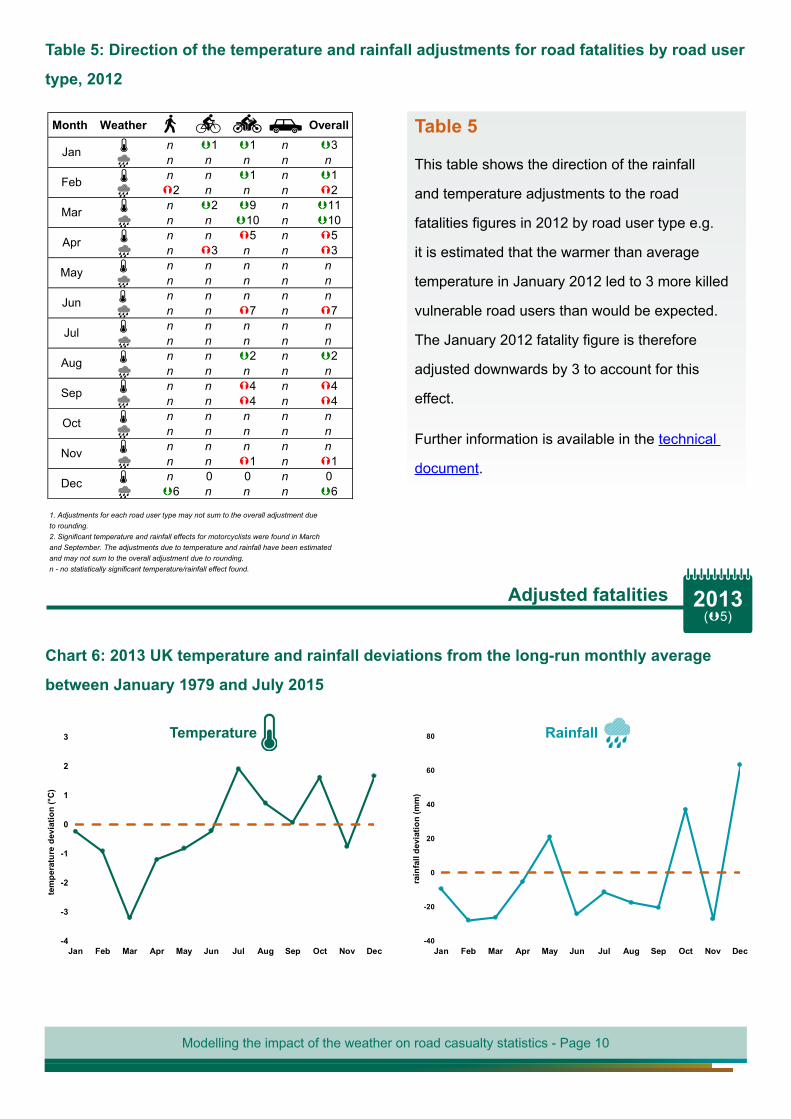
Table 5: Direction of the temperature and rainfall adjustments for road fatalities by road user
type, 2012
Month Weather Overalln 1 1 n 3n n n n nn n 1 n 12 n n n 2n 2 9 n 11n n 10 n 10n n 5 n 5n 3 n n 3n n n n nn n n n nn n n n nn n 7 n 7n n n n nn n n n nn n 2 n 2n n n n nn n 4 n 4n n 4 n 4n n n n nn n n n nn n n n nn n 1 n 1n 0 0 n 06 n n n 6
1. Adjustments for each road user type may not sum to the overall adjustment due to rounding. 2. Significant temperature and rainfall effects for motorcyclists were found in Marchand September. The adjustments due to temperature and rainfall have been estimatedand may not sum to the overall adjustment due to rounding. n - no statistically significant temperature/rainfall effect found.
Jan
Feb
Mar
Apr
May
Jun
Jul
Aug
Sep
Oct
Nov
Dec
Table 5
This table shows the direction of the rainfall
and temperature adjustments to the road
fatalities figures in 2012 by road user type e.g.
it is estimated that the warmer than average
temperature in January 2012 led to 3 more killed
vulnerable road users than would be expected.
The January 2012 fatality figure is therefore
adjusted downwards by 3 to account for this
effect.
Further information is available in the technical
document.
Adjusted fatalities 2013(5)
Chart 6: 2013 UK temperature and rainfall deviations from the long-run monthly average
between January 1979 and July 2015
-4
-3
-2
-1
0
1
2
3
Jan Feb Mar Apr May Jun Jul Aug Sep Oct Nov Dec
tem
pera
ture
dev
iatio
n (°
C)
-40
-20
0
20
40
60
80
Jan Feb Mar Apr May Jun Jul Aug Sep Oct Nov Dec
rain
fall
devi
atio
n (m
m)
Temperature Rainfall
Modelling the impact of the weather on road casualty statistics - Page 11
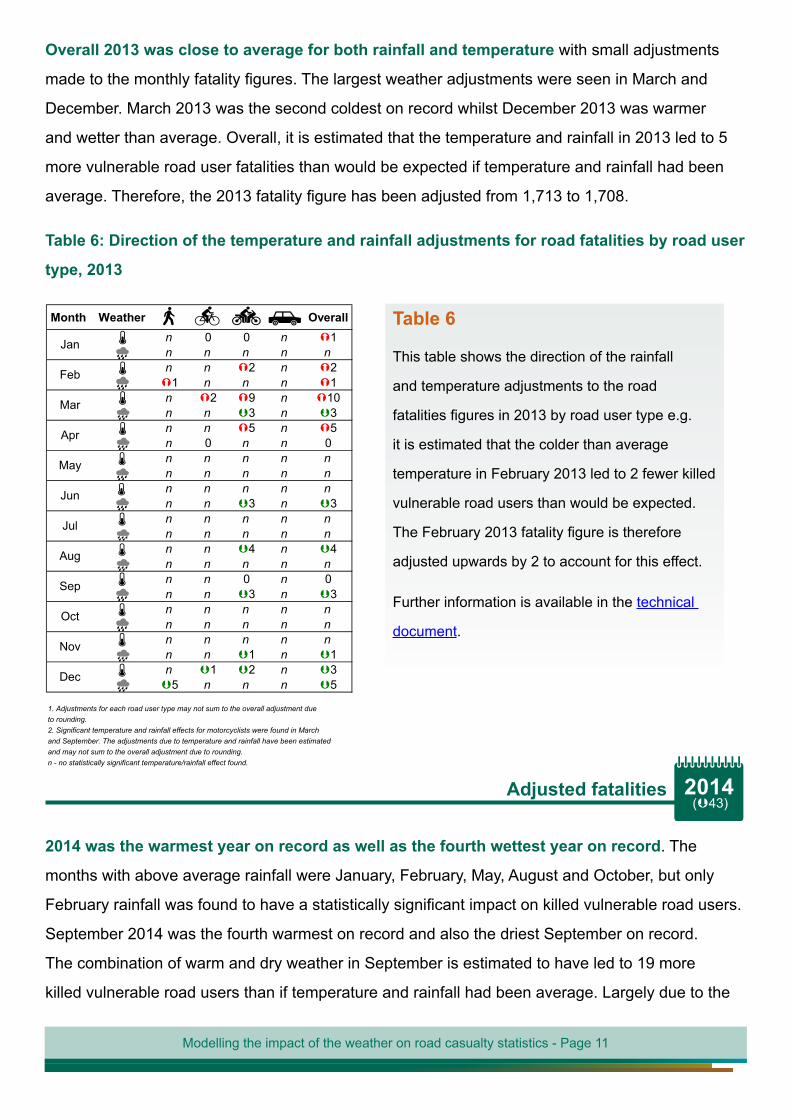
Overall 2013 was close to average for both rainfall and temperature with small adjustments
made to the monthly fatality figures. The largest weather adjustments were seen in March and
December. March 2013 was the second coldest on record whilst December 2013 was warmer
and wetter than average. Overall, it is estimated that the temperature and rainfall in 2013 led to 5
more vulnerable road user fatalities than would be expected if temperature and rainfall had been
average. Therefore, the 2013 fatality figure has been adjusted from 1,713 to 1,708.
Table 6: Direction of the temperature and rainfall adjustments for road fatalities by road user
type, 2013
Month Weather Overalln 0 0 n 1n n n n nn n 2 n 21 n n n 1n 2 9 n 10n n 3 n 3n n 5 n 5n 0 n n 0n n n n nn n n n nn n n n nn n 3 n 3n n n n nn n n n nn n 4 n 4n n n n nn n 0 n 0n n 3 n 3n n n n nn n n n nn n n n nn n 1 n 1n 1 2 n 35 n n n 5
1. Adjustments for each road user type may not sum to the overall adjustment due to rounding. 2. Significant temperature and rainfall effects for motorcyclists were found in Marchand September. The adjustments due to temperature and rainfall have been estimatedand may not sum to the overall adjustment due to rounding. n - no statistically significant temperature/rainfall effect found.
Jan
Feb
Mar
Apr
May
Jun
Jul
Aug
Sep
Oct
Nov
Dec
Table 6
This table shows the direction of the rainfall
and temperature adjustments to the road
fatalities figures in 2013 by road user type e.g.
it is estimated that the colder than average
temperature in February 2013 led to 2 fewer killed
vulnerable road users than would be expected.
The February 2013 fatality figure is therefore
adjusted upwards by 2 to account for this effect.
Further information is available in the technical
document.
Adjusted fatalities 2014(43)
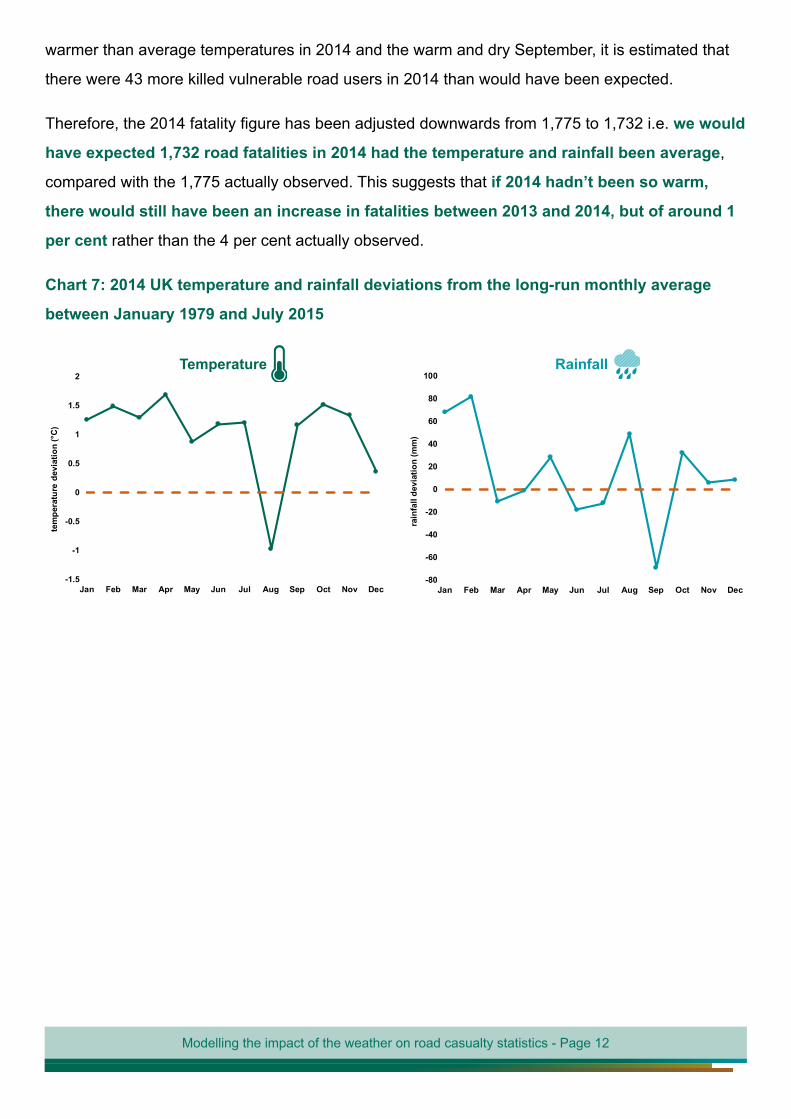
2014 was the warmest year on record as well as the fourth wettest year on record. The
months with above average rainfall were January, February, May, August and October, but only
February rainfall was found to have a statistically significant impact on killed vulnerable road users.
September 2014 was the fourth warmest on record and also the driest September on record.
The combination of warm and dry weather in September is estimated to have led to 19 more
killed vulnerable road users than if temperature and rainfall had been average. Largely due to the
Modelling the impact of the weather on road casualty statistics - Page 12
warmer than average temperatures in 2014 and the warm and dry September, it is estimated that
there were 43 more killed vulnerable road users in 2014 than would have been expected.
Therefore, the 2014 fatality figure has been adjusted downwards from 1,775 to 1,732 i.e. we would
have expected 1,732 road fatalities in 2014 had the temperature and rainfall been average,
compared with the 1,775 actually observed. This suggests that if 2014 hadn’t been so warm,
there would still have been an increase in fatalities between 2013 and 2014, but of around 1
per cent rather than the 4 per cent actually observed.
Chart 7: 2014 UK temperature and rainfall deviations from the long-run monthly average
between January 1979 and July 2015
-1.5
-1
-0.5
0
0.5
1
1.5
2
Jan Feb Mar Apr May Jun Jul Aug Sep Oct Nov Dec
tem
pera
ture
dev
iatio
n (°
C)
-80
-60
-40
-20
0
20
40
60
80
100
Jan Feb Mar Apr May Jun Jul Aug Sep Oct Nov Dec
rain
fall
devi
atio
n (m
m)
Temperature Rainfall
Modelling the impact of the weather on road casualty statistics - Page 13
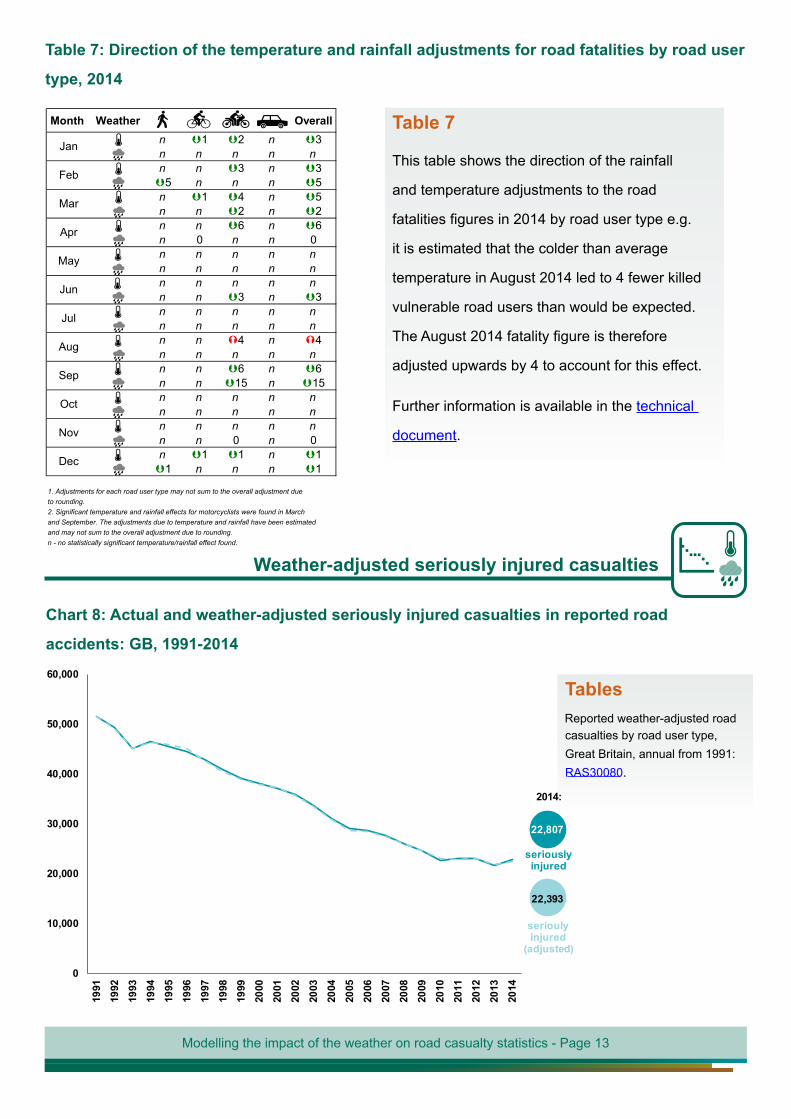
Table 7: Direction of the temperature and rainfall adjustments for road fatalities by road user
type, 2014
Month Weather Overalln 1 2 n 3n n n n nn n 3 n 35 n n n 5n 1 4 n 5n n 2 n 2n n 6 n 6n 0 n n 0n n n n nn n n n nn n n n nn n 3 n 3n n n n nn n n n nn n 4 n 4n n n n nn n 6 n 6n n 15 n 15n n n n nn n n n nn n n n nn n 0 n 0n 1 1 n 11 n n n 1
1. Adjustments for each road user type may not sum to the overall adjustment due to rounding. 2. Significant temperature and rainfall effects for motorcyclists were found in Marchand September. The adjustments due to temperature and rainfall have been estimatedand may not sum to the overall adjustment due to rounding. n - no statistically significant temperature/rainfall effect found.
Jan
Feb
Mar
Apr
Oct
Nov
Dec
May
Jun
Jul
Aug
Sep
Table 7
This table shows the direction of the rainfall
and temperature adjustments to the road
fatalities figures in 2014 by road user type e.g.
it is estimated that the colder than average
temperature in August 2014 led to 4 fewer killed
vulnerable road users than would be expected.
The August 2014 fatality figure is therefore
adjusted upwards by 4 to account for this effect.
Further information is available in the technical
document.
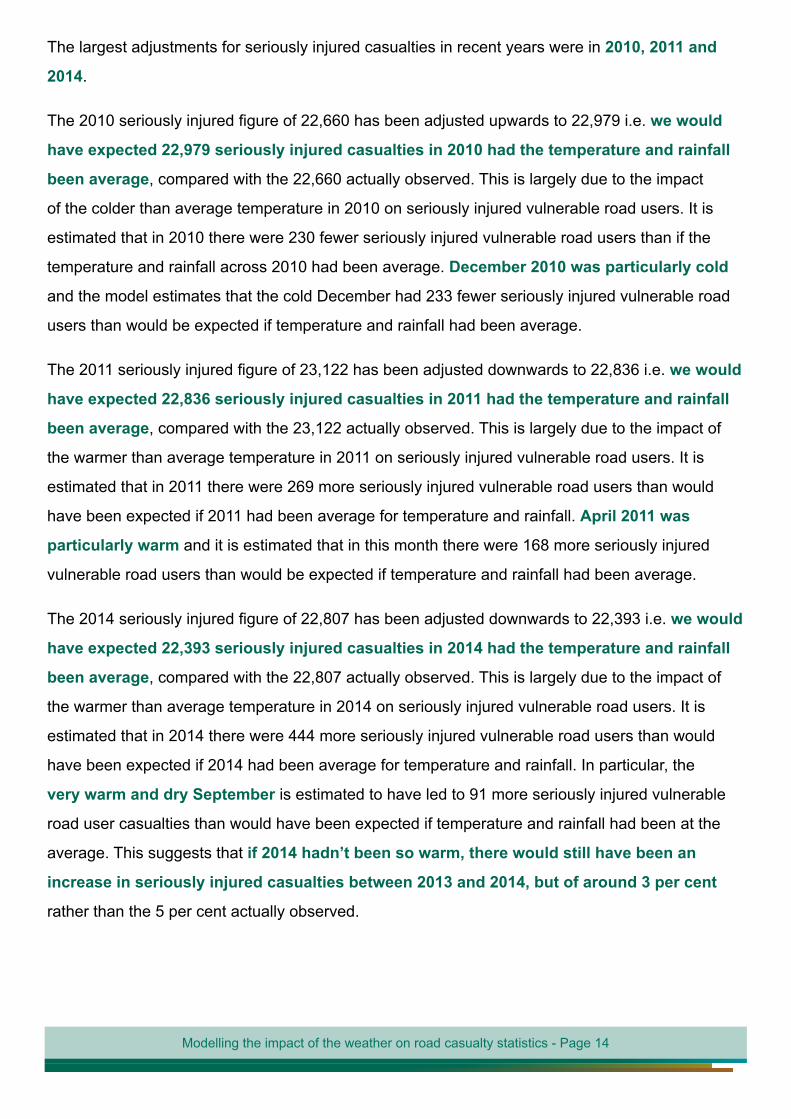
Weather-adjusted seriously injured casualties
Chart 8: Actual and weather-adjusted seriously injured casualties in reported road
accidents: GB, 1991-2014
0
10,000
20,000
30,000
40,000
50,000
60,000
1991
1992
1993
1994
1995
1996
1997
1998
1999
2000
2001
2002
2003
2004
2005
2006
2007
2008
2009
2010
2011
2012
2013
2014
seriouslyinjured
serioulyinjured
(adjusted)
22,807
22,393
TablesReported weather-adjusted roadcasualties by road user type, Great Britain, annual from 1991: RAS30080.
2014:
Modelling the impact of the weather on road casualty statistics - Page 14
The largest adjustments for seriously injured casualties in recent years were in 2010, 2011 and
2014.
The 2010 seriously injured figure of 22,660 has been adjusted upwards to 22,979 i.e. we would
have expected 22,979 seriously injured casualties in 2010 had the temperature and rainfall
been average, compared with the 22,660 actually observed. This is largely due to the impact
of the colder than average temperature in 2010 on seriously injured vulnerable road users. It is
estimated that in 2010 there were 230 fewer seriously injured vulnerable road users than if the
temperature and rainfall across 2010 had been average. December 2010 was particularly cold
and the model estimates that the cold December had 233 fewer seriously injured vulnerable road
users than would be expected if temperature and rainfall had been average.
The 2011 seriously injured figure of 23,122 has been adjusted downwards to 22,836 i.e. we would
have expected 22,836 seriously injured casualties in 2011 had the temperature and rainfall
been average, compared with the 23,122 actually observed. This is largely due to the impact of
the warmer than average temperature in 2011 on seriously injured vulnerable road users. It is
estimated that in 2011 there were 269 more seriously injured vulnerable road users than would
have been expected if 2011 had been average for temperature and rainfall. April 2011 was
particularly warm and it is estimated that in this month there were 168 more seriously injured
vulnerable road users than would be expected if temperature and rainfall had been average.
The 2014 seriously injured figure of 22,807 has been adjusted downwards to 22,393 i.e. we would
have expected 22,393 seriously injured casualties in 2014 had the temperature and rainfall
been average, compared with the 22,807 actually observed. This is largely due to the impact of
the warmer than average temperature in 2014 on seriously injured vulnerable road users. It is
estimated that in 2014 there were 444 more seriously injured vulnerable road users than would
have been expected if 2014 had been average for temperature and rainfall. In particular, the
very warm and dry September is estimated to have led to 91 more seriously injured vulnerable
road user casualties than would have been expected if temperature and rainfall had been at the
average. This suggests that if 2014 hadn’t been so warm, there would still have been an
increase in seriously injured casualties between 2013 and 2014, but of around 3 per cent
rather than the 5 per cent actually observed.
Weather-adjusted slightly injured casualties
Modelling the impact of the weather on road casualty statistics - Page 15
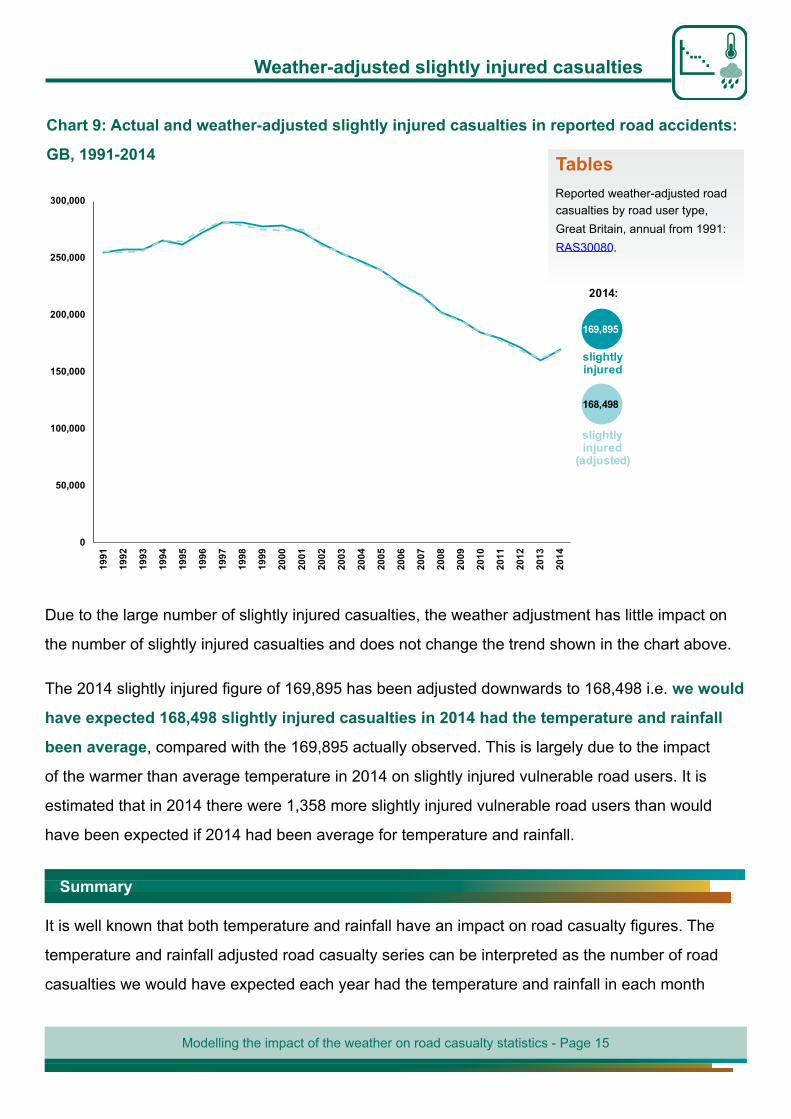
Chart 9: Actual and weather-adjusted slightly injured casualties in reported road accidents:
GB, 1991-2014
0
50,000
100,000
150,000
200,000
250,000
300,000
1991
1992
1993
1994
1995
1996
1997
1998
1999
2000
2001
2002
2003
2004
2005
2006
2007
2008
2009
2010
2011
2012
2013
2014
slightlyinjured
slightlyinjured
(adjusted)
169,895
168,498
2014:
Due to the large number of slightly injured casualties, the weather adjustment has little impact on
the number of slightly injured casualties and does not change the trend shown in the chart above.
The 2014 slightly injured figure of 169,895 has been adjusted downwards to 168,498 i.e. we would
have expected 168,498 slightly injured casualties in 2014 had the temperature and rainfall
been average, compared with the 169,895 actually observed. This is largely due to the impact
of the warmer than average temperature in 2014 on slightly injured vulnerable road users. It is
estimated that in 2014 there were 1,358 more slightly injured vulnerable road users than would
have been expected if 2014 had been average for temperature and rainfall.
It is well known that both temperature and rainfall have an impact on road casualty figures. The
temperature and rainfall adjusted road casualty series can be interpreted as the number of road
casualties we would have expected each year had the temperature and rainfall in each month
Summary
TablesReported weather-adjusted roadcasualties by road user type, Great Britain, annual from 1991: RAS30080.
Modelling the impact of the weather on road casualty statistics - Page 16
of each year been at the long term average. The production of a weather-adjusted road casualty
series enables changes between years that are the result of temperature or rainfall effects to be
removed from the series. In the adjusted series the changes between years are therefore not due
to changes in the temperature or rainfall.
The importance of the weather adjustment is shown by the change in road fatalities between 2010
and 2011. There was an increase of 3 per cent in road fatalities between 2010 and 2011. However,
2010 was largely affected by the colder than average temperature which suppressed vulnerable
road user fatalities and 2011 by the warmer than average temperature which increased vulnerable
road user fatalities. It is estimated that had the temperature and rainfall been at the long term
average in these years then road fatalities would have been unchanged between 2010 and 2011
with four fewer deaths in 2011. Therefore, all of the increase in road deaths that occurred between
2010 and 2011 can be attributed to differences in the temperature and rainfall between 2010 and
2011. In addition, the latest annual road casualty publication reported an increase in road fatalities
of 4 per cent between 2013 and 2014. However, 2014 was affected by the warmer than average
temperature (it was the warmest year on record) which increased
vulnerable road user fatalities. It is estimated that had temperature
and rainfall been at the long term average in 2013 and 2014 there
would have been an increase in road fatalities of 1 per cent rather
than the 4 per cent actually observed.
FeedbackWe welcome feedback on the usefulness of the weather-adjusted road casualty series via email to [email protected].