modelling the dynamics of crystal meth (‘tik’) abuse in ... · crystal meth, known as ‘tik’...
TRANSCRIPT
Bull Math BiolDOI 10.1007/s11538-012-9790-5
O R I G I NA L A RT I C L E
Modelling the Dynamics of Crystal Meth (‘Tik’) Abusein the Presence of Drug-Supply Chains in South Africa
Farai Nyabadza · John B.H. Njagarah ·Robert J. Smith?
Received: 20 March 2012 / Accepted: 25 October 2012© Society for Mathematical Biology 2012
Abstract Substance abuse remains a global problem, with immense health and socialconsequences. Crystal meth, known as ‘tik’ in South Africa, is a growing problem,and its supply chains have equally grown due to increased numbers of ‘tik’ users,especially in the Western Cape province of South Africa. We consider a model for‘tik’ use that tracks drug-supply chains, and accounts for rehabilitation and amelio-ration for the addicted. We analyse the model and show that it has a unique drug-freeequilibrium. We prove that the drug-free equilibrium is globally stable when the re-production number is less than one. We also consider both slow and fast dynamics,and show that there is a unique drug-persistent equilibrium when the reproductionnumber exceeds one. The model is fitted to data on ‘tik’ users in rehabilitation inthe Western Cape province. A sensitivity analysis reveals that the parameters withthe most control over the epidemic are the quitting rate of light-drug users and theperson-to-person contact rate between susceptible individuals and ‘tik’ users. Thissuggests that programs aimed at light-drug users that encourage them to quit willbe significantly more effective than targeting hard-drug users, either in quitting or inrehabilitation. Similarly, the person-to-person contact rate may be reduced by socialprograms that raise awareness of the dangers of ‘tik’ use and discourage light usersfrom recruiting others.
Keywords Crystal meth · Reproductive number · Drug-supply chains · ‘Tik’ · Latinhypercube sampling · Partial rank correlation coefficients
F. Nyabadza (�) · J.B.H. NjagarahDepartment of Mathematics, University of Stellenbosch, P. Bag X1, Matieland 7602, South Africae-mail: [email protected]
R.J. Smith?Department of Mathematics and Faculty of Medicine, The University of Ottawa, Ottawa, ON, Canadae-mail: [email protected]

F. Nyabadza et al.
1 Introduction
Methamphetamine, commonly known by the street name ‘tik’ in South Africa or ascrystal meth in other countries, is a highly addictive stimulant whose production andabuse has increased dramatically, with similar trends having been observed in theUnited States during the past decade. Since its advent in 1893, in Japan, the abuseof ‘tik’ remains a major global health and social problem (Lineberry and Bostwick2006). Its popularity stems from energy-promoting and performance-enhancing prop-erties. It also gives users appetite suppression; it is this property that drug-supplychains have taken advantage of in luring young women, who would not be typicaldrug users, into taking ‘tik’ as a weight-loss remedy. In South Africa, ‘tik’ is sold indrinking straws, with prices being charged per straw. The bitter white powder can alsobe placed in the glass enclosure of an incandescent light bulb, heated with a lighterand the fumes inhaled (Kapp 2008).
Generally, research into drug abuse and its impact on the general populationpresents an insurmountable task. In South Africa, many questions remain unansweredas to how much drug abuse is occurring and the implications of drug use, especiallyon disease burden, health-care demands, and risky sexual behaviour. We also ask:What policies should be put in place to curtail drug abuse and how can they be eval-uated? There is a need to understand the problem, measure drug use trends, designappropriate intervention measures, and evaluate the success of these interventions(Rossi 2004). It is at this stage that mathematical models become useful. Mathe-matical models can help in designing interventions and evaluating their success, andpredicting drug use trends (Mulone and Straughan 2009).
Because ‘tik’ is made available through drug-supply chains, additional preventivemeasures can be used. These include scare tactics (as with a policy of zero tolerance,backed up by stern parental, school, and legal penalties for use), educational cam-paigns (through media campaigns or prevention curricula in the schools), trainingin refusal skills and promotion of safe non-substance-using activities (Drug Library1994), coupled with effective policing and a functioning judicial system. In SouthAfrica, in a study on the nature and extent of heroin use in Cape Town, 33 out of 250heroin users interviewed (13 %) had been arrested at least once and seven of themhad been arrested for drug possession. Two were charged and none of them werefound guilty of the alleged offence (Plüddemann et al. 2004). The sequence most of-ten reported is that alcohol and cigarette use comes first, followed by marijuana useand then by the use of other illicit substances. Some variations in this sequence havebeen found for individuals of different sexes, racial and ethnic groups, and cultures(Drug Library 1994).
Many researchers have alluded to drug use spreading like an infectious disease(Burattini et al. 1998; De Alarcon 1969; Hunt and Chambers 1976; Mackintosh andStewart 1979; Mulone and Straughan 2009; Nyabadza and Hove-Musekwa 2010;White and Comiskey 2007). Their focus has mainly been modelling heroin epi-demics. The dynamics of smoking (whose mode of transmission is closely relatedto that of drug use) have also been modelled recently (Sharomi and Gumel 2008). Inthese models, the rate of generation of new drug users depends on contacts betweennon-drug users and drug users. In this paper, in addition to the bilinear interaction that

Modelling the Dynamics of Crystal Meth (‘Tik’) Abuse
generates new cases, we also take into consideration the role played by drug-supplychains and person-to-person initiation in fueling the ‘tik’ epidemic. We extend thecompartmental model presented in Nyabadza and Hove-Musekwa (2010) that pro-vides a structure in which individuals in each compartment can be tracked in time asrelationships between compartments described in mathematical terms evolve.
Here, our research questions are twofold. First, we ask: can we use data on indi-viduals seeking treatment to estimate the incidence of ‘tik’ abuse in a community?Second, by quantifying policing levels on drug-supply chains, can we predict sub-sequent changes in incidence of ‘tik’ abuse? The former can easily be tackled byusing standard epidemiological survey techniques, such as household surveys or bydirect enumeration through case findings. The major challenge is that such data areusually incomplete, due to drug abuse being stigmatized, with trafficking and pos-session of drugs being criminal offences in many countries (Rossi 2004), includingSouth Africa. It is therefore necessary to look at alternative methods that allow theprediction of the number of drug users in communities without necessarily having togo through surveys and case findings, which are usually dangerous due to gang vio-lence. This presents a huge challenge. The difficult part in trying to include the levelsof policing is that they cannot easily be measured and are hard to verify. The annualcrime statistics do not contain police conquest of drug-supply chains, but rather howdrug-related crimes are changing. For example, the South African police statisticsshowed that drug-related crimes increased from 621 to just over 3,000 between 2001–2002 and 2005–2006 in Mitchell’s Plain, a township in Cape Town (Kapp 2008). Thework presented in this paper, to the best of our knowledge, is the first attempt tomodel the levels of policing and their potential impact on drug-use control.
The main objectives of this paper are as follows. First, to develop a mathemati-cal model that takes into account rehabilitation, amelioration, and policing of drug-supply chains. Second, to fit the model to observed data on individuals under rehabil-itation and determine the corresponding incidence of ‘tik’ use using the parametersthat produce the best fit to the data. Lastly, we also endeavour to quantify the levels ofpolicing and determine the impact of increased or decreased policing on the dynam-ics of ‘tik’ use. The assumption is that drug users fuel the growth of supply chainsand new drug initiations arise through two pathways: exposure to drug-supply chains(run by drug lords) and through person-to-person contact.
This paper is organised as follows. In Sect. 2, a dynamic model is formulated anda brief discussion of the model properties is given. The model is analysed in Sect. 3.In Sect. 4, we re-scale parameters to consider two time-scales for a comprehensiveanalysis of the model. The simulation results, estimation of parameters and determi-nation of their sensitivity are presented in Sect. 5. Section 6 contains a discussion andconcluding remarks.
2 The Model
We consider a dynamic model of ‘tik’ abuse that ignores detailed social and eco-nomic characteristics (for example, living conditions, literacy levels, and householdincome) and simultaneous abuse of substances. We conceptualize the drug epidemic

F. Nyabadza et al.
based on the characterization of individuals’ risk, by dividing the population intodistinct classes with respect to their drug-use patterns. We thus introduce here a com-partmental model that is innovative in three regards. First, it incorporates the densityof drugs in the supply chains represented by a compartment D. Second, it includesa recovery process that is ameliorative. Third, it includes aspects of policing that areimportant in controlling the supply of drugs on the market. Prevention of substanceabuse and addiction is best done by cutting out any initial use. This can be done bymaking sure that abusable substances are out of the communities.
The population density N at time t is divided into five exclusive classes: thoseat risk of using ‘tik’, the susceptibles, S(t); light-drug users, Ul(t); hard-drug users,Uh(t); users under rehabilitation, Ur(t); and quitters, Q(t). Thus,
N(t) = S(t) + Ul(t) + Uh(t) + Ur(t) + Q(t).
We assume a constant size population with a recruitment and non-drug-related deathrate t given by μ. The recruitment of susceptibles is proportional to the populationand is given by μN(t). Initiation occurs through two processes: contact with drugusers (i.e. person-to-person contact) and through the influence of drug-supply chains(i.e. supply-chain-to-person contact). We let βu and βs be the effective contact ratesfor person-to-person and supply-chain-to-person contact, respectively. The forces ofinfection associated with the person-to-person and supply-chain-to-person contact,denoted respectively by λu and λs , are given by
λu = βu
(Ul + ηUh
N
)and λs = βsD
N. (1)
The modification parameter η (0 < η < 1) accounts for the decreased initiation po-tential of hard-drug users. The assumption here is that hard-drug users have a lowerpotential of generating new drug users than light-drug users do. This is because hard-drug users manifest ill effects of substance abuse as they may have been using drugsfor a long time and may be older and socially distant from potential recruits. Drugusers thus generate secondary drug users in two ways: first, through direct contactwith those susceptible, and secondly by propping up drug-supply chains, which makedrugs available to susceptible individuals, resulting in initiation. The remaining rateparameters are k, the escalation rate from light drug use to hard drug use; σ , the up-take rate into rehabilitation programs; and θ1 and θ2, respectively, the rates at whichlight-drug users and those under rehabilitation quit ‘tik’ use. We assume that indi-viduals who quit, should they relapse, will either go straight into Uh, due to theirprevious exposure to drugs, or into Ul at rates r2 and r3, respectively. Once one quits,one cannot go back to rehabilitation (Ur ) unless one has started using drugs again. Wealso assume that individuals in the compartment Uh have a quitting rate that is neg-ligible and the only way they quit is via rehabilitation. The other parameters are r1,the relapse rates of rehabilitants; ρ, the amelioration rate as hard-drug users return tolight drug use; and α1 and α2, the person-drug-supply contact rates for the light- andhard-drug users, respectively.
Modelling the Dynamics of Crystal Meth (‘Tik’) Abuse
Table 1 Primary ‘tik’ abuse for the period 1997a to 2010a (%). Source: Plüddemann et al. (2010)
Year 97a 97b 98a 98b 99a 99b 00a 00b 01a 01b 02a 02b 03b
% ‘tik’ use 0.0 0.1 0.0 0.1 0.1 0.1 0.2 0.1 0.1 0.3 0.3 0.8 2.3
Year 04a 04b 05a 05b 06a 06b 07a 07b 08a 08b 09a 09b 10a
% ‘tik’ use 10.7 19.3 26.1 34.7 37.2 42.3 40.7 36.1 35.8 35.1 40.6 35.5 33.6
We thus assume that the growth of the density of drugs in supply chains is directlyproportional to the number of drug users present at any time t . We argue here that,as the number of drug users increase, the demand for drugs from the supply chainsincreases. This is borne out by the rapid increase in availability of ‘tik’ in a shortspace of time, as seen in Table 1.
Furthermore, we shall assume that α2 = φα1, where φ > 1, due to the greaterdemand for drugs by heavy ‘tik’ users. The removal rate of drug-supply chains canbe modelled by a function f (D). This function can take several forms, dependingon the assumptions. We suggest a function in which policing is proportional to thenumber of drug-supply chains. We thus have
f (D) = νD.
Since demand increases with supply and supply increases with demand, the resultis potentially a feedback loop. The function f (D) provides a damping on this loop.We can define 1
νas the duration that drugs spend in circulation in the supply chain.
It is important to assume that D is large enough to be modelled deterministically.The compartment D represents the density of drugs in the supply chain with units ofkilograms per square kilometre. The population density N(t) has units of individualsper square kilometre. The description above translates into the five-state model de-picted by Fig. 1. The division between the left- and right-hand sides of Fig. 1 separateinitiation and ‘tik’ use patterns with the latter having data available.
The dynamical system representing the schematic diagram is given by
S = μN − (λu + λs)S − μS,
Ul = (λu + λs)S + ρUh + r3Q − (μ + k + θ1)Ul,
Uh = kUl + r1Ur + r2Q − (μ + σ + ρ)Uh,
Ur = σUh − (μ + r1 + θ2)Ur,
Q = θ1Ul + θ2Ur − (μ + r2 + r3)Q,
D = α1(Ul + φUh) − νD,
(2)
where λu and λs are as defined in (1).

F. Nyabadza et al.
Fig. 1 A compartmental representation of the epidemic of ‘tik’ use
It is helpful to re-scale system (2) so that we have dimensionless variables. We let
s = S
N, v = Ul
N, w = Uh
N, x = Ur
N, y = Q
N, z = α1
νND.
We thus have the following re-scaled system
s = μ − βu(v + ηw)s − βszs − μs,
v = βu(v + ηw)s + βszs + ρw + r3y − (μ + k + θ1)v,
w = kv + r1x + r2y − (μ + σ + ρ)w,
x = σw − (μ + r1 + θ2)x,
y = θ1v + θ2x − (μ + r2 + r3)y,
z = ν(v + φw − z),
(3)
where βs = βsα1/ν. The transmission parameter βs contains the supply-chain-to-person transmission, βs , and the person-to-supply-chain contact rate, α1. It is thusimportant to note that βs represents the entire person-supply-chain-person transmis-sion cycle.
The feasible region of system (3) is given by the following set:
G = {s, v,w,x, y, z ≥ 0 : s + v + w + x + y = 1}. (4)
Modelling the Dynamics of Crystal Meth (‘Tik’) Abuse
3 Analysis
3.1 Long-Term Behaviour
It is always imperative to establish the long-term behaviour of solutions to any givendynamical system. For any ε > 0, we define
Gz∗ = {(s, v,w,x, y, z) ∈ G : z∗ ≤ 1 + φ + ε
}. (5)
We now prove that, for all t > 0, the solutions of system (3) exist and lie in Gz∗ .
Lemma 1 Let G and Gz∗ be as defined in (4) and (5), respectively. If X(t) denotesthe solution set to system (3) with initial conditions X(0) ∈ G , then X(t) ∈ G for allt > 0. Furthermore, there exists a Tε > 0 such that, for all t > Tε , X(t) ∈ GZ∗ .
Proof To prove that solutions starting in G remain in G , we let n = s +v+w+x +y.Differentiating n, we have
n = s + v + w + x + y = μ(1 − n),
with n = 1 as the steady state. Note that n(t) = 1 − (1 − n0)e−μt for n0 a constant.
It can be easily shown that n(0) = 1, so that s(t) + v(t) + w(t) + x(t) + y(t) = 1.Consider system (3) when at least one of the phase variables is zero. If Xi ∈ X = 0then Xi ≥ 0 by a direct computation of the variables in system (3). So the trajectoriesof system (3) do not leave through ∂G , the boundary of G for t ≥ 0.
Considering the last equation of system (3), the largest value v + φw can be is1 + φ, since v ≤ 1 and w ≤ 1. Thus, for z < 0, we need z > 1 + φ. Hence, z isdecreasing whenever z > 1 + φ, so that z is bounded. Therefore, solutions to system(3) with initial conditions in G exist for all t > 0.
To prove that X(t) is contained in Gz∗ , it is important to note that z < 0 for z =1 + φ + ε. This means that the solutions starting from z0 > 1 + φ + ε enter Gz∗ .Whenever z < 1 + φ + ε,
z < ν[1 + φ − (1 + φ + ε)
] = −νε,
so that z < −νε. With z0 > 1 + φ + ε, we have z(t) < z0 − νεt as long as z remainsgreater than 1 + φ + ε. We now define
Tε = z0 − (1 + φ + ε)
νε.
If the solution is outside Gz∗ at Tε , then z(Tε) < z0 − εηTε = 1 + φ + ε. This is acontradiction, so the solution must enter Gz∗ before Tε . �
3.2 The Reproduction Number
System (3) has a drug-free equilibrium given by
E0 = (1,0,0,0,0,0).

F. Nyabadza et al.
The reproduction number, R0, is determined by the method of the next-generationmatrix (van den Driessche and Watmough 2002). A reproduction number obtainedthis way determines the local stability of the drug-free equilibrium point for R0 < 1and instability for R0 > 1 (Heffernan et al. 2005). Using the approach in van denDriessche and Watmough (2002), and adopting the matrix notations, the matricesfor new infection terms and the transfer terms at the drug-free equilibrium are givenby
F =
⎛⎜⎜⎜⎜⎜⎜⎜⎝
βu ηβu 0 0 βs
0 0 0 0 0
0 0 0 0 0
0 0 0 0 0
0 0 0 0 0
⎞⎟⎟⎟⎟⎟⎟⎟⎠
and V =
⎛⎜⎜⎜⎜⎜⎜⎝
Q1 −ρ 0 −r3 0
−k Q2 −r1 −r2 0
0 −σ Q3 0 0
−θ1 0 −θ2 Q4 0
−ν −φν 0 0 ν
⎞⎟⎟⎟⎟⎟⎟⎠
,
where Q1 = μ + k + θ1, Q2 = μ + σ + ρ, Q3 = μ + r1 + θ2 and Q4 = μ +r2 + r3.
The reproduction number is given by the spectral radius (the dominant eigenvalue)of the matrix FV −1, denoted by (FV −1). Thus,
(FV −1) = R0 = R1 + R2 + R3, (6)
where
R1 =(
βu
Q1
)(1 − (Φ1 + Φ3)
1 − (Φ1 + Φ2 + Φ3 + Φ4)
),
R2 =(
ηβu
Q2
)(k
Q1+ r2θ1
Q1Q4
)Π,
R3 ={(
φβs
Q2
)(k
Q1+ r2θ1
Q1Q4
)+
(βs
Q1
)[1 − (Φ1 + Φ3)
]}Π,
with
Π = 1
1 − (Φ1 + Φ2 + Φ3 + Φ4 + Φ5(1 − Φ1) + Φ6),
Φ1 = σr1
Q2Q3, Φ2 = kρ
Q1Q2, Φ3 = σr2θ2
Q2Q3Q4,
Φ4 = ρr2θ1
Q1Q2Q4, Φ5 = r3θ1
Q1Q4, Φ6 = kσr3θ2
Q1Q2Q3Q4.
Note that 0 < Φj < 1 for all j and Π,R1,R2,R3 > 0.R0 is a sum of three terms representing the contribution of the light-drug users,
hard-drug users, and the drug-supply chains to the generation of new initiates. Wehave carefully written the expression of the reproduction number so that the contri-bution of the supply chains to initiation can be determined. The reproduction number
Modelling the Dynamics of Crystal Meth (‘Tik’) Abuse
is defined as the secondary number of initiates produced by one single initiated in-dividual introduced into a wholly susceptible population. This definition is directlytranslated from epidemic models (Diekmann et al. 1990). In the context of this paper,R0 determines whether ‘tik’ use will persist or die out in the population.
Following van den Driessche and Watmough (2002, Theorem 2), we have thefollowing result.
Theorem 1 The drug-free equilibrium of system (3) is locally asymptotically stablewhenever R0 < 1 and unstable otherwise.
3.3 Global Stability of the Drug-Free Equilibrium
In this subsection, we prove the global stability of the drug-free equilibrium E0 whenR0 < 1.
Theorem 2 The drug-free equilibrium E0 of system (3) is globally asymptoticallystable if R0 < 1 and unstable otherwise. The drug-free equilibrium E0 is the onlyequilibrium when R0 ≤ 1.
Proof Let
L = Av + Bw + Cx + Dy + Ez
be the Lyapunov function for some non-negative values of A, B , C, D, and E. Thetime derivative of L is given by
L = Av + Bw + Cx + Dy + Ez
= A[βu(v + ηw)s + βszs + ρw + r3y − Q1v
] + B[kv + r1x + r2y − Q2w]+ C[σw − Q3x] + D[θ1v + θ2x − Q4y] + E
[ν(v + φw − z)
]
= (Aβus + Bk + Dθ1 + Eν − AQ1)v + (Aηβus + Aρ + Cσ + Eνφ − BQ2)w
+ (Br1 + Dθ2 − CQ3)x + (Ar3y + Br2 − DQ4)y + (Aβss − Eν)z
≤ (Aβu + Bk + Dθ1 + Eν − AQ1)v + (Aηβu + Aρ + Cσ + Eνφ − BQ2)w
+ (Br1 + Dθ2 − CQ3)x + (Ar3y + Br2 − DQ4)y + (Aβs − Eν)z.
We now evaluate the coefficients of the suitable Lyapunov function such that thecoefficients of w, x, y, and z are equal to zero. We thus obtain
A = Q2Q3Q4[1 − (Φ1 + Φ3)
]> 0,
B = Q3Q4(ηβu + φβs + ρ) + ρr3θ2,
C = (ηβu + φβs + ρ)(r1Q4 + r2θ2) + r3θ2Q2,

F. Nyabadza et al.
D = Q3r2(ηβu + φβs + ρ) + r3Q2Q3(1 − Φ1) > 0,
E = Q2Q3Q4βs
[1 − (Φ1 + Φ3)
]/ν > 0.
Using these coefficients, the time derivative of the Lyapunov function can be ex-pressed as
L ≤[Q1[1 − (Φ1 + Φ2 + Φ3 + Φ4 + Φ5(1 − Φ1) + Φ6)]
βs[1 − (Φ1 + Φ3)]](R0 − 1)v.
Note that the quantity in square brackets is always positive.Clearly, L ≤ 0 when R0 ≤ 1, with equality if R0 = 1. Furthermore, L = 0 if
and only if w = x = y = z = 0. Therefore, the largest compact invariant set in{(s, v,w,x, y, z) ∈ G : L = 0}, when R0 ≤ 1, is the singleton E0. Therefore, E0 is theonly steady state when R0 ≤ 1. LaSalle’s invariance principle (LaSalle 1976) thenimplies that E0 is globally stable in G if R0 < 1. Using Lemma 5 in Magel and Ruan(2008), we observe that the Jacobian matrix evaluated at E0 has a positive eigenvaluewhenever R0 > 1. The drug-free equilibrium is therefore unstable if R0 > 1. Thiscompletes the proof. �
This result has useful implications regarding the spread of the ‘tik’ epidemic. Ir-respective of the initial state of the epidemic, as long as R0 < 1 the epidemic willclear from the population. Thus, interventions that target the reduction of R0 will bemost desirable. As the reproduction number passes through R0 = 1, there is a changein stability. In fact, there is a transcritical bifurcation at R0 = 1 and hence R0 is athreshold. See Li et al. (2011) for more discussion.
Further analysis of the model is made by considering the slow and fast dynamicsgiven in the next section.
4 Slow and Fast Dynamics
We assume that the parameters α1, α2, and ν are much smaller than the other pa-rameters. This is because the number of supply chains is very small compared to thepopulation they serve. We therefore rescale them such that
α1 = εα1, α2 = εα2, and ν = εν, (7)
where ε is a small positive parameter.We use the geometric singular perturbation theory for differential equations
(Fenichel 1979) to analyse the system. We therefore consider two timescales: the fastand slow dynamics. We consider the original time t as the fast timescale variable andthe scaled time τ = εt as the slow timescale, and then denote “ · ” = d
dtand “′” = d
dτ.
In our analysis, we use the re-scaled system (3), describing the drug-using populationand the drug-supply chains, and transform it to a system with re-scaled parameterswith respect to the slow and fast variables. The resulting system of equations for the

Modelling the Dynamics of Crystal Meth (‘Tik’) Abuse
fast dynamics are
s = μ − βu(v + ηw)s − βszs − μs,
v = βu(v + ηw)s + βszs + ρw + r3y − (μ + k + θ1)v,
w = kv + r1x + r2y − (μ + σ + ρ)w,
x = σw − (μ + r1 + θ2)x,
y = θ1v + θ2x − (μ + r2 + r3)y,
z = εν(v + φw − z),
(8)
and for the slow dynamics are
εs′ = μ − βu(v + ηw)s − βszs − μs,
εv′ = βu(v + ηw)s + βszs + ρw + r3y − (μ + k + θ1)v,
εw′ = kv + r1x + r2y − (μ + σ + ρ)w,
εx′ = σw − (μ + r1 + θ2)x,
εy′ = θ1v + θ2x − (μ + r2 + r3)y,
z′ = ν(v + φw − z).
(9)
Our interest is to investigate the dynamics of ‘tik’ use in the human population. Wethus focus on the fast dynamics subsystem. To obtain some useful insights into thefast dynamics, we set ε = 0 in Eq. (8) and analyse the fast dynamics subsystem atequilibrium. During the fast dynamics, the change of supply chains over time is thustaken to be constant. The resulting system describes the dynamics of substance abusefor a given drug-supply chain. The equilibrium of the resulting system is given in thenext subsection.
4.1 Existence of the Drug-Persistent Equilibrium for Fast Dynamics
To compute equilibria, we set ε = 0 and the left-hand side of system (8) to zero. Fromthe fourth equation of (8),
x∗ = σ
Q3w∗.
The fifth equation of (8) gives
y∗ = θ1
Q4v∗ + θ2σ
Q3Q4v∗.

F. Nyabadza et al.
The third equation of (8) results in
w∗ = ξv∗, where ξ = kQ4 + r2θ1
Q2Q4[1 − (Φ1 + Φ3)] > 0.
Expressing all the other variables in terms of v∗ gives, after some algebraic manipu-lations,
x∗ = σ
Q3ξv∗, y∗ =
(θ1
Q4+ θ2σ
Q3Q4ξ
)v∗ and z∗ = (1 + φξ)v∗.
From the second equation of (8), we have either v∗ = 0 or
s∗ = Q1
[1 − (Φ1 + Φ2 + Φ3 + Φ4 + Φ5(1 − Φ1) + Φ6)
[1 − (Φ1 + Φ3)][βu(1 + ηξ) + βs(1 + φξ)]]
= 1
R0> 0.
The case v∗=0 gives the drug-free equilibrium, treated earlier.Given the expression for s∗, from the first equation we can solve for v∗ so that
v∗ = μ
[βu(1 + ηξ) + βs(1 + φξ)] (R0 − 1).
Therefore, we obtain a unique drug-persistent equilibrium given by E1 = (s∗, v∗,w∗, x∗, y∗, z∗). We thus have the following theorem on the existence of the drug-persistent equilibrium.
Theorem 3 If R0 > 1, the system (8) with fast dynamics has a unique drug-persistentequilibrium given by E1.
The Center Manifold Theorem (CMT) can be used to prove local stability of theunique drug-persistent equilibrium. Using the fact that w∗ = ξv∗, the last equation ofsystem (9) becomes
dz
dτ= νv∗(1 + φξ) − νz. (10)
The solution of z is given by
z = v∗(1 + φξ) + Ce−νt , (11)
where C is a constant.If the initial drug-supply chain is denoted by z0 at t = 0, then
z = v∗(1 + φξ) + (z0 − v∗(1 + φξ)
)e−νt . (12)
The drug-supply chains are bounded between the initial supply and the equilibriumstate dependent on the endemic equilibrium. This result indicates that the result-ing manifold is bounded and is therefore locally invariant. The exponential term inEq. (12) indicates that the supply chains approach the steady state at a faster ratewith high-level policing compared to relatively low levels of policing. The reduction

Modelling the Dynamics of Crystal Meth (‘Tik’) Abuse
in supply chains reduces the probability that a susceptible individual will be initi-ated into drug use through supply-chain-to-person contact. This is further confirmedthrough numerical simulations via the analysis of the reproduction number as a func-tion of policing. This result has implications in the fight against ‘tik’ abuse. Increasedlevels of policing yield positive effects, as they reduce the growth of the epidemic.
4.2 Global Stability of the Drug-Persistent Equilibrium
Theorem 4 The drug-persistent equilibrium E1 is globally asymptotically stablewhenever R0 is greater than unity.
Proof We propose a suitable Lyapunov function V such that
V =(
s − s∗ − s∗ lns
s∗
)+ A
(v − v∗ − v∗ ln
v
v∗
)+ B
(w − w∗ − w∗ ln
w
w∗
)
+ C(
x − x∗ − x∗ lnx
x∗
)+ D
(y − y∗ − y∗ ln
y
y∗
)+ E
(z − z∗ − z∗ ln
z
z∗
).
The constants A, B, C , D, and E are all positive. We note that, using the constructedLyapunov function, the first partial derivatives with respect to any of state variablesgiven by
∂V∂s
=(
1 − s∗
s
),
∂V∂v
= A(
1 − v∗
v
),
∂V∂w
= B(
1 − w∗
w
),
∂V∂x
= C(
1 − x∗
x
),
∂V∂y
= D(
1 − y∗
y
),
∂V∂z
= E(
1 − z∗
z
),
are zero at the corresponding drug-persistent equilibrium point values. The secondpartial derivatives of V with respect to any of the state variables are given by
∂2 V∂s2
= s∗
s2,
∂2 V∂v2
= A v∗
v2,
∂2 V∂w2
= B w∗
w2,
∂2 V∂x2
= C x∗
x2,
∂2 V∂y2
= D y∗
y2,
∂2 V∂z2
= Ez∗
z2.
The second partial derivatives are all positive, suggesting that the drug-persistentequilibrium states are the minimum points of each of the state variables. The timederivative of the Lyapunov function is given by
V =(
1 − s∗
s
)s + A
(1 − v∗
v
)v + B
(1 − w∗
w
)w + C
(1 − x∗
x
)x
+ D(
1 − y∗
y
)y + E
(1 − z∗
z
)z,
= (μ − βu(v + ηw)s − βszs − μs
)(1 − s∗
s
)

F. Nyabadza et al.
+ A(βu(v + ηw)s + βszs + ρw + r3y − Q1v
)(1 − v∗
v
)
+ B(kv + r1x + r2y − Q2w)
(1 − w∗
w
)+ C(σw − Q3x)
(1 − x∗
x
)
+ D(θ1v + θ2x − Q4y)
(1 − y∗
y
)+ Eξν(v + φw − z)
(1 − z∗
z
).
We now use the system of Eq. (8) at the drug-persistent equilibrium to obtain
μ = βu
(v∗ + ηw∗)s + βsz
∗s∗ + μs∗,
Q1 = βu(v∗ + ηw∗)s + βsz
∗s∗ + ρw∗ + r3y∗
v∗ ,
Q2 = kv∗ + r1x∗ + r2y
∗
w∗ ,
Q3 = σw∗
x∗ ,
Q4 = θ1v∗ + θ2x
∗
y∗ ,
1 = v∗ + φw∗
z∗ .
(13)
We now substitute the terms in system (13) into the derivative of the Lyapunov func-tion to obtain
V =(
1 − s∗
s
)[μs∗
(1 − s
s∗
)+ βuv
∗s∗(
1 − sv
s∗v∗
)+ βuηw∗s∗
(1 − ws
w∗s∗
)
+ βsz∗s∗
(1 − zs
z∗s∗
)]+ A
(1 − v∗
v
)[−βus
∗v∗(
v
v∗ − sv
s∗v∗
)
− r3y∗(
v
v∗ − y
y∗
)− βuηw∗s∗
(v
v∗ − sw
s∗w∗
)− βsz
∗s∗(
v
v∗ − zs
z∗s∗
)
− ρw∗(
v
v∗ − w
w∗
)]+ B
(1 − w∗
w
)[−kv∗
(w
w∗ − v
v∗
)− r1x
∗(
w
w∗ − x
x∗
)
− r2y∗(
w
w∗ − y
y∗
)]+ C
(1 − x∗
x
)[−σw∗
(x
x∗ − w
w∗
)]
+ D(
1 − y∗
y
)[−θ1v
∗(
y
y∗ − v
v∗
)− θ2x
∗(
y
y∗ − x
x∗
)]
+ Eξν
(1 − z∗
z
)[−v∗
(z
z∗ − v
v∗
)− φw∗
(z
z∗ − w
w∗
)].

Modelling the Dynamics of Crystal Meth (‘Tik’) Abuse
Let
s
s∗ = H,v
v∗ = I,w
w∗ = J,x
x∗ = K,y
y∗ = L,z
z∗ = M.
The derivative of V with A = 1 reduces to
V = −μs∗ (1 − H)2
H+ Q(H, I, J,K,L,M),
where
Q = βus∗v∗
(2 − 1
H− H
)+ βuηw∗s∗
(2 − 1
H− JH
I
)
+ βsz∗s∗
(2 − 1
H− MH
I
)+ ρw∗
(1 − J
I
)+ r3y
∗(
1 − L
I
)
+ Bkv∗(
1 − I
J
)+ Br1x
∗(
1 − J
J
)+ Br2y
∗(
1 − L
J
)
+ Cσw∗(
1 − J
K
)+ Dθ1v
∗(
1 − I
L
)+ Dθ2x
∗(
1 − K
L
)
+ Eξνv∗(
1 − I
M
)+ Eξνφw∗
(1 − J
M
).
It is important to note that Q is obtained after setting the coefficients of I, J,K,L,and M to zero so that
B = (θ1v∗ + θ2x
∗)(βuηs∗ + φβss∗ + ρ)w∗
v∗[k(θ1v∗ + θ2x∗) + r2θ1y∗ + r3θ1y∗] ,
C =[ {r1x
∗(θ1v∗ + θ2x
∗) + r2θ2x∗y∗}B + r3θ2x
∗y∗
σw∗(θ1v∗ + θ2x∗)
],
D = (r2 + r3)y∗
θ1v∗ + θ2x∗ B,
E = βss∗
ξν.
(14)
Also note that the expressions (2− 1H
−H), (2− 1H
− JHI
) and (2− 1H
− MHI
) are lessthan or equal to zero by the arithmetic-mean/geometric-mean inequality, with equal-ity if and only if H = 1 and J = M = I . After some tedious algebraic manipulationsof replacing the constants B, C, D, and E with the relations (14), similar conclusionscan be drawn from the remaining expression of Q. This implies that Q ≤ 0 withequality only if H = 1 and I = J = K = L = M .
Therefore, V ≤ 0 with equality if and only if s = s∗. LaSalle’s extension (LaSalle1976) implies that the omega limit set of each solution lies in an invariant set con-

F. Nyabadza et al.
tained in
G ={(s, v,w,x, y, z) : s = s∗, v
v∗ = w
w∗ = x
x∗ = y
y∗ = z
z∗
}.
Since s must remain constant at s∗, s is zero. This implies that vv∗ = w
w∗ = xx∗ = y
y∗ =zz∗ = 1. Thus, the only invariant set contained in G is the singleton E1. This showsthat each solution that intersects R
6+ tends to the endemic equilibrium E1. �
Global stability of the drug-persistent equilibrium has serious implications as re-gards the dynamics of ‘tik’ use. If the population is constant and R0 > 1, ‘tik’ usewill always persist, irrespective of the initial conditions. It is thus important to reducethe reproduction number to below unity in order to control the ‘tik’ epidemic.
5 Numerical Simulations
5.1 Parameter Estimation
In this section, we estimate the model parameters used in our numerical simulations.The unprecedented increase in the use of ‘tik’ and other drugs in the Western Capeprovince of South Africa is associated with devastating social problems, includingcrime and violence, accidents and injury, and risky sexual behaviour (Morojele et al.2009). Based on data from SACENDU (Plüddemann et al. 2010), there has been ageneral decrease in the prevalence of ‘tik’ abuse from 42.3 % in the second half of theyear 2006 to 33.6 % in the first half of 2010. A similar trend (from 60.2–33.3 %) hasbeen observed for individuals younger than 20 years who report methamphetamine asthe primary substance of abuse at specialised treatment centres. Currently, there areup to 67 rehabilitation centres and 19 drug-counselling centres in the Western Cape.
Although there are many rehabilitation centres, not all of them may be partici-pating in SACENDU’s program of monitoring the trends of alcohol and drug abusein the Western Cape. For example, between January and June 2010, ‘tik’ abuse byindividuals who reported to specialist treatment centres participating in the programreduced from 36 % to 33 %. This data was collected from the 23 specialist centresthat participated in the monitoring program during that time. In our view, it is likelythat the reported figures could be underestimates of the actual problem. Althoughinformation on drugs reported as primary and secondary abused drugs (includingmethamphetamine) has been available, the actual amount of drug use attributed tolight users or heavy users is not clearly known. This makes the task of ascertainingexact parameter values related to escalation of drug users challenging. In our mod-elling framework, we attribute the approximate time of 40 years (Burattini et al. 1998)that an individual may spend in the susceptible compartment, which is equivalent tothe estimated mortality rate of 0.025 per year for sub-Saharan Africa. Plüddemannet al. (2004) established that the treatment demand trends for ‘tik’ as a primary orsecondary drug of abuse in the Western Cape rose from less than 1 % in 2002 to morethan 42 % in 2006.
Modelling the Dynamics of Crystal Meth (‘Tik’) Abuse
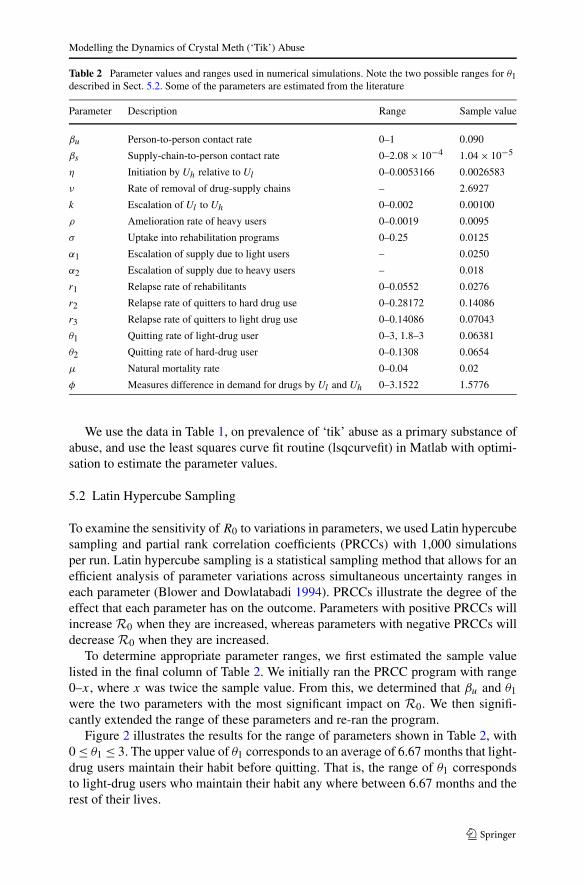
Table 2 Parameter values and ranges used in numerical simulations. Note the two possible ranges for θ1described in Sect. 5.2. Some of the parameters are estimated from the literature
Parameter Description Range Sample value
βu Person-to-person contact rate 0–1 0.090
βs Supply-chain-to-person contact rate 0–2.08 × 10⁻⁴ 1.04 × 10⁻⁵
η Initiation by Uh relative to Ul 0–0.0053166 0.0026583
ν Rate of removal of drug-supply chains – 2.6927
k Escalation of Ul to Uh 0–0.002 0.00100
ρ Amelioration rate of heavy users 0–0.0019 0.0095
σ Uptake into rehabilitation programs 0–0.25 0.0125
α1 Escalation of supply due to light users – 0.0250
α2 Escalation of supply due to heavy users – 0.018
r1 Relapse rate of rehabilitants 0–0.0552 0.0276
r2 Relapse rate of quitters to hard drug use 0–0.28172 0.14086
r3 Relapse rate of quitters to light drug use 0–0.14086 0.07043
θ1 Quitting rate of light-drug user 0–3, 1.8–3 0.06381
θ2 Quitting rate of hard-drug user 0–0.1308 0.0654
μ Natural mortality rate 0–0.04 0.02
φ Measures difference in demand for drugs by Ul and Uh 0–3.1522 1.5776
We use the data in Table 1, on prevalence of ‘tik’ abuse as a primary substance ofabuse, and use the least squares curve fit routine (lsqcurvefit) in Matlab with optimi-sation to estimate the parameter values.
5.2 Latin Hypercube Sampling
To examine the sensitivity of R0 to variations in parameters, we used Latin hypercubesampling and partial rank correlation coefficients (PRCCs) with 1,000 simulationsper run. Latin hypercube sampling is a statistical sampling method that allows for anefficient analysis of parameter variations across simultaneous uncertainty ranges ineach parameter (Blower and Dowlatabadi 1994). PRCCs illustrate the degree of theeffect that each parameter has on the outcome. Parameters with positive PRCCs willincrease R0 when they are increased, whereas parameters with negative PRCCs willdecrease R0 when they are increased.
To determine appropriate parameter ranges, we first estimated the sample valuelisted in the final column of Table 2. We initially ran the PRCC program with range0–x, where x was twice the sample value. From this, we determined that βu and θ1were the two parameters with the most significant impact on R0. We then signifi-cantly extended the range of these parameters and re-ran the program.
Figure 2 illustrates the results for the range of parameters shown in Table 2, with0 ≤ θ1 ≤ 3. The upper value of θ1 corresponds to an average of 6.67 months that light-drug users maintain their habit before quitting. That is, the range of θ1 correspondsto light-drug users who maintain their habit any where between 6.67 months and therest of their lives.

F. Nyabadza et al.
Fig. 2 Partial Rank CorrelationCoefficients (PRCCs) for thefull range of parameters fromTable 2. The parameter with thegreatest potential to make theepidemic worse when it isincreased is βu, while θ1 is theparameter with the greatestpotential to make the epidemicbetter when it is maximised
Fig. 3 Monte Carlo simulations for the two parameters with the greatest PRCC magnitude, using thevalues shown in Table 2 and with 0 ≤ θ1 ≤ 3. 1,000 simulations per run were used
Figure 3 illustrates the variations in R0 against βU and θ1. All parameters arevaried according to the ranges in Table 2, with 0 ≤ θ1 ≤ 3. Also illustrated is theboxplot. Although the mean value of R0 is less than 1, there are many simulations forwhich it is not, suggesting the epidemic will not always be controlled.
Modelling the Dynamics of Crystal Meth (‘Tik’) Abuse
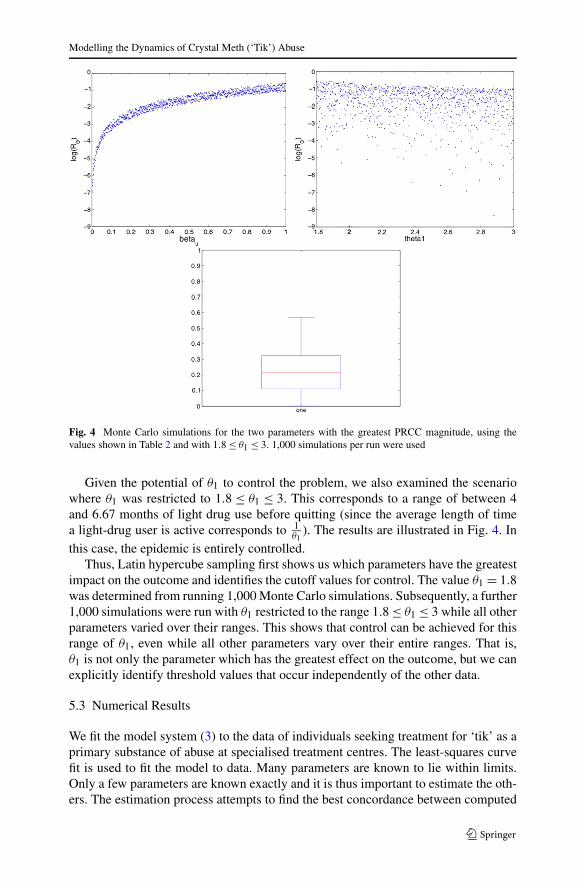
Fig. 4 Monte Carlo simulations for the two parameters with the greatest PRCC magnitude, using thevalues shown in Table 2 and with 1.8 ≤ θ1 ≤ 3. 1,000 simulations per run were used
Given the potential of θ1 to control the problem, we also examined the scenariowhere θ1 was restricted to 1.8 ≤ θ1 ≤ 3. This corresponds to a range of between 4and 6.67 months of light drug use before quitting (since the average length of timea light-drug user is active corresponds to 1
θ1). The results are illustrated in Fig. 4. In
this case, the epidemic is entirely controlled.Thus, Latin hypercube sampling first shows us which parameters have the greatest
impact on the outcome and identifies the cutoff values for control. The value θ1 = 1.8was determined from running 1,000 Monte Carlo simulations. Subsequently, a further1,000 simulations were run with θ1 restricted to the range 1.8 ≤ θ1 ≤ 3 while all otherparameters varied over their ranges. This shows that control can be achieved for thisrange of θ1, even while all other parameters vary over their entire ranges. That is,θ1 is not only the parameter which has the greatest effect on the outcome, but we canexplicitly identify threshold values that occur independently of the other data.
5.3 Numerical Results
We fit the model system (3) to the data of individuals seeking treatment for ‘tik’ as aprimary substance of abuse at specialised treatment centres. The least-squares curvefit is used to fit the model to data. Many parameters are known to lie within limits.Only a few parameters are known exactly and it is thus important to estimate the oth-ers. The estimation process attempts to find the best concordance between computed

F. Nyabadza et al.
Fig. 5 Model system (3) fittedto data for individuals seekingtreatment for ‘tik’ as a primarysubstance of abuse. The bluecircles indicate the actual dataand the solid line indicates themodel fit to the data (Colorfigure online)
Fig. 6 Estimated incidence of‘tik’ abuse as a primarysubstance of abuse in theWestern Cape Province
and observed data. It can be carried out by trial and error or by the use of softwareprograms designed to find parameters that give the best fit. Here, the fitting processinvolves the use of the least squares-curve fitting method. A Matlab code is usedwhere unknown parameter values are given a lower and upper bound from which theset of parameter values that produce the best fit are obtained. Figure 5 shows that thenumber of drug users in treatment reached the peak between the second half (July–December) of 2006 and the first half (January–June) of 2009. Figure 5 demonstratesa good fit to the data from Table 1. Our estimated incidence, evaluated using the ini-tiation function (λu + λs)s, is observed to have reached the peak between 2005 and2007. See Fig. 6. The question of whether the incidence peaked in reality still remainsunanswered, as no studies have been done to date to determine the incidence of ‘tik’abuse in the Western Cape province of South Africa. Our results are indicative of ashort-term, fast-growing ‘tik’ epidemic in which there is a significant increase in thenumber of users in a short period of time, followed by a significant slow down inthe generation of new cases. This, however, does not translate into a similar pattern

Modelling the Dynamics of Crystal Meth (‘Tik’) Abuse
Fig. 7 Contour plot for R0 as afunction of; (a) βs and α1, and(b) r1 and r2
with regards to the prevalence, since recovery from substance abuse is a difficult andexpensive process. Thus, the number of drug users will remain significantly high overa long period of time.
We use the contour plots in Figs. 7 and 8 to ascertain the relationship betweensome selected pairs of parameters and R0. In Fig. 7(a), both βs and α1 increase thereproduction number. We observe that an amicable relationship exists between thetwo parameters: escalation of supply chains resulting from an increased number oflight and heavy ‘tik’ users increases the likelihood of supply-chain-to-person inter-action, which consequently results in initiation of more susceptible individuals into‘tik’ use.
In Fig. 7(b), we observe a bigger increase in R0 with respect to an increase inr2 relative to r1. We argue here that the low contribution of r1 to R0 relative to r2
is due to the fact that r1 simply results in cycling of ‘tik’ users between ‘tik’ using

F. Nyabadza et al.
Fig. 8 Contour plot for R0 as afunction of θ1 and θ2 (a) inpresence of relapse for quitters(i.e. r2, r3 �= 0) and (b) inabsence of relapse for quitters(i.e. r2 = r3 = 0)
compartments Uh and Ur . The main outcome of this observation is that control effortsshould aim at preventing quitters from getting re-initiated into drug use.
We also analysed the effect of the two quitting routes in the presence and absenceof re-initiation of quitters. Figure 8(a) shows that, irrespective of the presence of re-initiation for quitters into ‘tik’ use, increasing θ1 will reduce the prevalence of ‘tik’use as opposed to the increase in θ2. This observation is also in agreement with thePRCCs of θ1 and θ2. On the other hand, absence of relapse for quitters (r2 = r3 = 0)
results in a reduction of R0; see Fig. 8(b). However, a similar trend as in the casewith relapse of quitters is observed. The reduction in R0 indicates a reduction inthe likelihood of susceptible individuals being initiated due to the reduction in thenumber of initiators, which is attributed to permanent quitting.

Modelling the Dynamics of Crystal Meth (‘Tik’) Abuse
Fig. 9 The reproductionnumber as a function of policingfor the following parametervalues μ = 0.02; βu = 0.1;η = 0.8; ρ = 0.2; k = 0.3;θ1 = 0.9; θ2 = 0.4; r1 = 0.01;r2 = 0.07; r3 = 0.04; σ = 0.8;α1 = 0.6; φ = 1.4; βs = 0.1
R0 exponentially decreases with the rate of policing (Fig. 9). Therefore, increas-ing the level of policing reduces the likelihood that a susceptible individual will beinitiated into drug use through contact with supply chains. The reduction in the like-lihood of initiation is due to the fact that policing increases the scarcity of abusabledrugs through seizure of such drugs and incarceration of drug dealers, prevents ag-gressive marketing of illicit drugs, and legally penalizes identifiable (physiologicallypredisposed) drug users. It is important to note that, although increased policing mayreduce incidence and consequently prevalence of ‘tik’ abuse, it does not lead to itsextinction. This is partly explained by our reproduction number, which accounts formore than one route of initiation into ‘tik’ use. For this chosen set of parameter val-ues (Fig. 9 caption), we can determine the critical rate of removal νc , obtained whenR0 = 1. This is the rate of removal of drug-supply chains that leads to containmentof the epidemic if other factors remain constant. In addition, the levelling off of R0 athigh values of ν depicts a state when increasing policing does not significantly reducethe possibility of new initiations into drug use.
6 Discussion
In this paper, we used a ‘tik’-abuse model that considers drug-supply chains in addi-tion to person-to-person contact in a drug-use cycle to obtain qualitative results. Wealso fitted the model to data on rehabilitants with the objective of using the model pa-rameters that give the best fit to obtain the incidence curve. Sensitivity of parameterswas also considered. Latin hypercube sampling and partial rank correlation coeffi-cients demonstrate that the two parameters with the greatest impact on the outcomeare βu, the person-to-person contact rate, and θ1, the rate at which light-drug usersquit. This suggests that control of ‘tik’ pivots around social intervention programs.Programs aimed at light-drug users that encourage them to quit will be significantlymore effective than targeting hard-drug users, either in quitting or in rehabilitation.Similarly, the person-to-person contact rate (which is more dependent on light users)

F. Nyabadza et al.
may be reduced by social programs that raise awareness of the dangers of ‘tik’ useand discourage light users from recruiting others. It follows that efforts to manage the‘tik’ epidemic will be significantly dependent on social programs. It is thus critical toassess the population-level impact of ‘tik’ use and to devote resources to education,awareness and quitting programs that are especially targeted to occasional users.
Acknowledgements F. Nyabadza and J.B.H. Njagarah acknowledge, with thanks, the support of theUniversity of Stellenbosch. J.B.H. Njagarah appreciates with gratitude the support from the African Insti-tute for Mathematical Sciences (AIMS) South Africa. R.J. Smith? is supported by an NSERC DiscoveryGrant, an Early Researcher Award and funding from MITACS. For citation purposes, please note that thequestion mark in “Smith?” is part of his name.
References
Blower, S. M., & Dowlatabadi, H. (1994). Sensitivity and uncertainty analysis of complex models ofdisease transmission: an HIV model, as an example. Int. Stat. Rev., 2, 229–243.
Burattini, M. N., Massad, E., & Coutinho, F. A. B. (1998). A mathematical model of the impact of crack-cocaine use on the prevalence of HIV/AIDS among drug users. Math. Comput. Model., 28, 21–29.
Diekmann, O., Heesterbeek, J. A. P., & Metz, J. A. J. (1990). On the definition and computation of thebasic reproduction ratio R0 in models of infectious diseases in heterogeneous populations. J. Math.Biol., 28, 503–522.
De Alarcon, R. (1969). The spread of a heroin abuse in a community. Bull. Narc., 21, 17–22.Drug Library (1994). Substance use and transitions to abuse and addiction. Available from http://www.
druglibrary.org/schaffer/library/studies/ota/ch5.htm.Fenichel, N. (1979). Geometric singular perturbation theory for ordinary differential equations. Journal of
Differential Equations, 31, 53–98.Heffernan, J. M., Smith, R. J., & Wahl, L. M. (2005). Perspectives on the basic reproductive ratio. J. R.
Soc. Interface, 2, 281–293.Hunt, L. G., & Chambers, C. D. (1976). The heroin epidemics. New York: Spectrum Publications 1976.Kapp, C. (2008). Crystal meth boom adds to South Africa’s health challenges. Lancet, 371, 193–194.LaSalle, J. P. (1976). CBMS-NSF regional conference series in applied mathematics: Vol. 25. The stability
of dynamical systems. Philadelphia: SIAM.Li, J., Blakeley, D., & Smith? R. J. (2011). The Failure of R0. Comput. Math. Methods Med., 2011,
527610.Lineberry, T. W., & Bostwick, J. M. (2006). Methamphetamine abuse: a perfect storm of complications.
Mayo Clin. Proc., 81, 77–84.Mackintosh, D. R., & Stewart, G. T. (1979). A mathematical model of a heroin epidemic: implications for
control policies. J. Epidemiol. Community Health, 33, 299–304.Magel, P. & Ruan, S. (Eds.) (2008). Structured population models in biology and epidemiology. Berlin:
Springer.Morojele, N. K., Parry, C. D. H., & Brook, J. S. (2009). Substance abuse and the young: taking action.
MRC-South Africa research briefMulone, G., & Straughan, B. (2009). A note on heroin epidemics. Math. Biosci., 218, 138–141.Nyabadza, F., & Hove-Musekwa, S. D. (2010). From heroin epidemics to methamphetamine epidemics:
modelling substance abuse in a South African province. Math. Biosci., 225, 132–140.Plüddemann, A., Dada, S., Parry, C., Bhana, A., Bachoo, S., Perreira, T., Nel, E., Mcweba, T., Gerber, W.,
& Freytag, K. (2010). Monitoring alcohol and drug abuse trends in South Africa (July 1996–June2010). SACENDU research brief, 13(2).
Plüddemann, A., Parry, C., Flisher, A. J., & Jordaan, E. (2004). The nature and extent of heroin use inCape Town: Part 2—a community survey. Available from http://www.mrc.ac.za.
Rossi, C. (2004). Operational models for the epidemics of problematic drug use: the mover-stayer approachto heterogeneity. Socio-Econ. Plan. Sci., 38, 73–90.

Modelling the Dynamics of Crystal Meth (‘Tik’) Abuse
Sharomi, O., & Gumel, A. B. (2008). Curtailing smoking dynamics: a mathematical modelling approach.Appl. Math. Comput., 195, 475–499.
van den Driessche, P., & Watmough, J. (2002). Reproduction numbers and sub-threshold endemic equilib-rium for compartmental models of disease transmission. Math. Biosci., 180, 29–48.
White, E., & Comiskey, C. (2007). Heroin epidemics, treatment and ODE modelling. Math. Biosci., 208,312–324.