modelling ship detectability depending on terrasar-x ... · modelling ship detectability depending...
TRANSCRIPT

Vol.:(0123456789)1 3
CEAS Space Journal https://doi.org/10.1007/s12567-018-0222-8
ORIGINAL PAPER
Modelling ship detectability depending on TerraSAR-X-derived metocean parameters
Björn Tings1 · Carlos Bentes2 · Domenico Velotto1 · Sergey Voinov3
Received: 29 March 2017 / Revised: 16 October 2018 / Accepted: 22 October 2018 © The Author(s) 2018
AbstractDifferent metocean conditions have an impact on the detectability of ship signatures on Synthetic Aperture Radar (SAR) images. During the EMSec Project algorithms for retrieval of wind and sea state fields from TerraSAR-X data have been developed in conjunction with a near real-time-capable constant false alarm rate ship detection processor. This paper presents a new model connecting these three information extraction systems into a ship detectability model by setting the probability of detection in dependency to the four parameters: Wind speed, significant wave height, incidence angle and ship length. The model is based on a binary L2-regularized logistic regression classifier trained on a large dataset of X-band SAR ship samples, which are identified using Automatic Identification System messages co-located automatically in space and time and further checked manually to avoid possible mismatches. Results are compared to the state-of-the-art simulation-based ship detectability model available in literature. For the first time it has been possible to evaluate not only qualitatively but also quantitatively the effects of acquisition geometry and metocean conditions for the different image resolution classes obtainable with the high-flexible SAR sensor on-board the TerraSAR-X satellite.
Keywords Ship detection · Probability of detection · Machine learning · Synthetic Aperture Radar
1 Introduction
With a crescent interest in global maritime situation aware-ness, new earth observation methods and sensors have been developed to overcome the actual limitations of radio communication and coastal monitoring systems. Synthetic Aperture Radar (SAR) is a well-suited sensor for oceano-graphic observations and ship surveillance activities due to its capability of all day and weather operations, with suitable coverage and image resolutions [1–3].
New satellite systems like Sentinel-1 and TerraSAR-X are pushing the limits of SAR resolution and coverage capabilities, making possible the use of SAR images in complex scenarios and applications [4]. In the framework
of the Echzeitdienste für die Maritime Sicherheit-Security (EMSec) project new processors are developed, which exploit images essentially acquired by the TerraSAR-X satel-lite to generate value-added products for maritime safety and security under near real-time (NRT) requirements [5]. These processors include new information extraction methods for oil [6] and ship recognition [7–12] as well as wind field [13] and sea state retrieval [14, 15].
The TerraSAR-X satellite is equipped with a X-band radar that allows a wide set of operational modes: From the high-resolution SpotLight (SL) mode to a wide coverage area with the ScanSAR Wide (SCW) mode. Different Ter-raSAR-X image modes and their characteristics are briefly summarized in Table 1. A detailed description of the Ter-raSAR-X Multimode SAR Processor (TMSP) with the image products and processing level characteristics available, can be found in [16, 17].
In Fig. 1 are highlighted the effects of image resolution and ship size by showing the same identical ship (one for each ship size class as introduced in Table 2) observed with different TerraSAR-X image resolution classes. Therefore, understanding the impact of different SAR imaging modes and acquisition settings on the respective information
* Björn Tings [email protected]
1 Maritime Safety and Security Lab, DLR, Henrich-Focke-Straße 4, 28199 Bremen, Germany
2 Technische Universität München, Arcisstraße 21, 80333 Munich, Germany
3 Maritime Safety and Security Lab, DLR, Kalkhorstweg 53, 17235 Neustrelitz, Germany

B. Tings et al.
1 3
extraction methods is fundamental to estimate their perfor-mance and correctly plan future acquisitions. This paper presents a new ship detectability model to support the ship recognition processor. The new model is an empirical model trained on a large ground truth dataset, in which messages from the Automatic Identification System (AIS) have been intersected with SAR acquisitions. Probability of detection of ships is modelled in dependency to the parameters ship size, incidence angle, and the metocean parameters wind speed and significant wave height. In the view of a fully data-driven approach, the metocean parameters are directly estimated using the SAR data making use of empirical func-tions tuned for TerraSAR-X. The new wind field and sea state retrieval methods developed during EMSec project are named XMOD2 and XWAVE [13, 14]. Hence, the analysis conducted in this paper takes the full benefit of the different processors developed during the EMSec project, demonstrat-ing the possible advantages of the outcomes of such project. In this way, ship detectability performances are provided for each class of image resolution, i.e. high, medium and low, in terms of probability of detection maps derived from
the trained model. State-of-the-art ship detectability mod-els are based on theoretical assumptions of the ship radar response and surrounding background distribution. For the purposes of this study, the ship detectability model proposed by Vachon et al. [31] for RADARSAT-1 and -2 has been taken as reference and adapted to TerraSAR-X using the dataset described in the next section.
This work is structured as follows: Sect. 2 describes the dataset this paper is based on. Section 3 presents the devel-opment process of the data-driven detectability model and Sect. 4 contains the results. The development of the simula-tion-based detectability model and a visualisation of results is presented in the Sects. 5 and 6, respectively. A confronta-tion of both models is discussed in Sect. 7. Finally, Sect. 8 brings the conclusions and final remarks.
2 TerraSAR‑X data pre‑processing
The underlying TerraSAR-X dataset includes 1095 high-res-olution (Stripmap and Spotlight, 686 with HH, 105 with VV and 304 with HH/VV polarisation), 104 medium-resolution
Table 1 Basic characteristics about TerraSAR-X Multilook Ground range Detected (MGD) Radiometrically Enhanced (RE) imaging modes and defined resolution classes
Image mode Standard size Rg × Az (km)
Inc. angle range (°)
Spatial resolution (m) (class)
SpotLight 10 × 10 20–55 0.9–8.5 (high)StripMap 30 × 50 20–45 7.0–11.8 (high)ScanSAR 100 × 150 20–45 18.5–19.2 (medium)ScanSAR Wide 270 × 200 15–50 40 (low)
Fig. 1 Exemplary of detected ships (small, medium and large from left to right as introduced in Table 2) using the differ-ent resolution classes (high, medium and low from top to bottom) defined for TerraSAR-X
Table 2 Ship size classes definition according to the AIS reported length
AIS Automatic Identification System
Descriptive term Ship length (m)
Small 1 < l ≤ 25Medium 25 < l ≤ 150Large 150 < l ≤ 400

Modelling ship detectability depending on TerraSAR-X-derived metocean parameters
1 3
(ScanSAR, 100 with HH and 4 with VV polarisation) and 24 low-resolution (ScanSAR Wide, 9 with HH and 15 with VV polarisation) images, which were acquired between 2013 and 2017 in North Sea, Baltic Sea and Mediterranean Sea. The selected processing level of the SAR data is Level-1b Multilook Ground range Detected (MGD) Radiometrically Enhanced (RE), which maximises the radiometric resolution at expense of the spatial resolution. The three datasets have been augmented by space and time co-located AIS data. The majority of AIS messages were recorded by coastal receiv-ers, with few samples provided by satellite AIS in Open Ocean and/or not in the field of view of coastal receivers. After a first automatic SAR-AIS fusion processing, which i.a. includes filtering of azimuth ambiguities and correc-tion of the Doppler azimuth offset based on AIS velocity, a manual inspection of the results of this process has been carried out to obtain clean samples of detected and non-detected ships without ambiguous SAR-AIS assignments. The detection of the ship signatures and respective labelling of ship samples is performed by the constant false alarm rate (CFAR)-detector using a fixed false alarm rate smaller than PFA < 10−13. The false alarm rate has been chosen to be as small as possible to only detect true ship signatures and is therefore only limited by numerical double precision. To achieve NRT performances, the CFAR implementation is based on the Gaussian probability density function for modelling of background clutter and therefore the detec-tor is applied on the amplitude image representation. The use of Gaussian function is motivated by the fact that the input SAR image has been processed with high number of looks (~ 9 looks). All pixel’s amplitude values exceeding the derived threshold are marked as detection. In a subse-quent processing step the single pixels are connected to ship signatures [10]. More details about CFAR are introduced in Sect. 5. To each ship sample the SAR-based wind speed is allocated, which is derived by XMOD2 as described in [13, 18]. The SAR-based significant wave height is retrieved by XWAVE as published in [14, 15]. The significant wave height can only be calculated for high-resolution images and is assigned only to each high-resolution ship sample. The amount of ship samples with high sea state above 4 m sig-nificant wave height or with high wind speed above 10 m/s is low. Therefore, this paper only concentrates on low (< 1 m) and moderate (1–4 m) sea state and the few ship samples with high sea state or high wind speed are discarded. Fur-ther, samples marked as invalid in the manual inspection, with an incidence angle outside the TerraSAR-X full per-formance incidence angle range (from 20° to 45°) and/or with image artefacts that disrupt the metocean parameters estimation are also filtered out. Finally, three main datasets and two high-resolution subsets for respectively HH and VV polarisation are defined, for which the detectability models are built:
1. TerraSAR-X high-resolution with 9856 ship samples
(a) 8016 ship samples with HH polarisation(b) 1840 ship samples with VV polarisation
2. TerraSAR-X medium-resolution with 1762 ship samples3. TerraSAR-X low-resolution with 688 ship samples.
According to the ship size provided by the co-located AIS reports, ships are categorized into three labels, i.e. small, medium, and large, as summarized in Table 2.
Figure 2 shows the overlaid histograms of the dataset dis-tribution as function of image class resolution (three histo-grams given each by a different colour) and ship size class (three common bin sizes of the histogram according to the range lengths given in Table 2), i.e. each bin provides the samples count for the specified image resolution class and ship size class. Please note that the number of small ships that have been detected and assigned to a valid AIS message is limited for all image resolution classes, because accord-ing to International Convention for the Safety of Life at Sea (SOLAS) Chapter V on the use of AIS system, these ships are often not mandatory required to be equipped with such safety system [19].
3 Development of the data‑driven ship detectability model
The detectability model is represented by a binary clas-sifier, which differentiates detectable and non-detectable ship samples based on ship length, incidence angle, wind speed and significant wave height. For the binary classifica-tion task the L2-regularized Logistic Regression classifier, as explained in [20, 21], has been selected. This classifier provides optimal linear separating hyperplanes in the four
Fig. 2 Ship’s dataset distribution according to the image resolution classes and ship sizes defined in Tables 1 and 2

B. Tings et al.
1 3
dimensional space, which are useful also for qualitatively interpretation of the detectability model to understand the underlying dependencies. As qualitative interpretation is not possible in the four dimensional space for a human observer, the dependent variable that is not of interest, is removed by setting a fixed value hence obtaining a three dimensional representation.
Classifiers like support vector machines, which also esti-mate optimal separating hyperplanes, are not capable of cal-culating probabilities of class affiliation [22], but these prob-abilities are used here to represent probability of detection. The use of this non-complex linear classifier also reduces the possibility of overfitting. L2-regularization has been applied because the training datasets are fully filled. The classifier training is explained as a minimization task of the following function:
where, the cost parameter is C = 1 , N defines the number of training samples, xi defines the training instance vector and yi ∈ {1,−1} the class label with index i in the training set. The set of weights, which are optimized during the train-ing process are represented by w . The term log(1 + e−yiw
Txi ) represents the logistic regression loss function, giving the classifier its name. 10-fold cross-validation was used to determine the cost parameter of C = 1 . However, the cost parameter was identified to have almost no effect on the clas-sification accuracy [23].
After training the set of weights w the classification of new samples x is performed by calculating the probability of class affiliation P by the following probability model:
where y defines the class label for the binary classification task. This means the two probabilities of class affiliation sum up to one.
4 Visualisation of data‑driven detectability model
To outline the dependency of ship detectability from the four parameters ship length, incidence angle, wind speed and significant wave height, for each dataset 2D detectabil-ity charts are derived. The models are built for each resolu-tion dataset using the full scalar value range of the parame-ters. For visualisation of the three-dimensional models for medium- and low-resolution data the ship length is binned into the three size classes: small, medium and large. For
(1)minw
f (w) ≡ 1
2wTw + C
N∑
i=1
log(1 + e−yiw
Txi
)
(2)P(y = ±1|x,w) = 1
1 + e−ywTx
the four dimensional models for high-resolution data also the significant wave height needs to be binned into the two considered sea state classes: low and moderate. By setting fixed values to the rounded median value of each bin for these two parameters the corresponding third and fourth dimension can be removed to obtain 2D plots. The median is calculated for each class as a rounded value over all input samples of all datasets. This means for the small ships the bin median is fixed to 20 m, for medium ships to 100 m and for large ships to 200 m ship length. Similarly, for low sea state the bin median is set to 0.5 m and for moderate sea state to 2.5 m significant wave height. With sea state information only available for the high-resolution data, for the respective high-resolution models 12 charts and for the medium and low-resolution model, respectively, three charts are derived. Each chart is created in two steps:
1. Sampling the co-domain of incidence angles (from 20° to 45°) and of wind speeds (from 2 to 16 m/s) into inte-gers.
2. Calculating the probability of class affiliation to class “detected” for each combination of incidence angle integers and wind speed integers, while ship length and significant wave height parameters are kept fixed by the respective bin center.
3. Assigning a representative colour for each probability value and placing the colour at its corresponding posi-tion in the chart (wind speed integers plotted on x-axis and incidence angle integers plotted on y-axis).
The following Figs. 3, 4, 5, 6, 7 and 8 display the derived detectability charts. In all charts the linear nature of the underlying model can be observed. Large ships are generally better detectable and the impact of low versus moderate sea state is significant. The probability of detection from worst case scenario (high wind speed, low incidence angle) to best case scenario (low wind speed, high incidence angle) is ris-ing for all resolution plots, but only in the high-resolution dataset the incidence angle has a pronounced impact. As in the underlying dataset no samples with wind speed above 10 m/s are included, the charts represent an extrapolation of the data in the value range of 10–16 m/s. This extrapolation is displayed to achieve consistency with the charts provided for the simulation-based models in Sect. 6, which are valid for the full performance wind speed range of XMOD2.
The detectability models can also be utilized to estimate and compare the minimum detectable ship sizes subject to the other parameters between the different image resolu-tion classes given a defined minimum level of probability of detection. In the following two plots, the minimum ship size is plotted either in dependency to wind speed (Fig. 9) or incidence angle (Fig. 10), where all other parameters must

Modelling ship detectability depending on TerraSAR-X-derived metocean parameters
1 3
Fig. 3 Dataset(1)—TerraSAR-X high-resolution HH and VV polarisation ship detectability chart for low sea state conditions based on wind speed, incidence angle and from left to right small, medium and large vessels
Fig. 4 Dataset(1)—TerraSAR-X high-resolution HH and VV polarisation ship detectability chart for moderate sea state conditions based on wind speed, incidence angle and from left to right small, medium and large vessels
Fig. 5 Dataset(1)—TerraSAR-X high-resolution HH polarisation ship detectability chart for low sea state conditions based on wind speed, inci-dence angle and from left to right small, medium and large vessels

B. Tings et al.
1 3
Fig. 6 Dataset(1)—TerraSAR-X high-resolution VV polarisation ship detectability chart for low sea state conditions based on wind speed, inci-dence angle and from left to right small, medium and large vessels
Fig. 7 Dataset(2)—TerraSAR-X medium-resolution ship detectability chart based on wind speed, incidence angle and from left to right small, medium and large vessels
Fig. 8 Dataset(3)—TerraSAR-X low-resolution ship detectability chart based on wind speed, incidence angle and from left to right small, medium and large vessels

Modelling ship detectability depending on TerraSAR-X-derived metocean parameters
1 3
be set to fixed values. The minimum level of probability of detection has been set to 95% for both plots.
While all plots for the high-resolution datasets reflect well-known impacts of the four investigated parameters on the detectability of ships, the plots for medium- and low-resolution suggest that ship detectability is almost independent from the incidence angle.
The low dependency of incidence angle and ship detect-ability is contradicting to state-of-the-art detectability
models. The next section presents such a detectability model based on simulated target and background intensity distribution as comparison to the data-driven detectability model. This simulation-based model provides theoretical probabilities of detection requiring only a less extensive dataset for tuning.
Fig. 9 TerraSAR-X minimum detectable ship size in depend-ency to wind speed using fixed incidence angle of 30°, low sea state conditions and minimum probability of detection of 95% (stars: low-resolution dataset, triangles: medium-resolution dataset and circles: high-resolu-tion dataset)
Fig. 10 TerraSAR-X minimum ship size in dependency to incidence angle using fixed wind speed of 6 m/s, low sea state conditions and minimum probability of detection of 95% (stars: low-resolution dataset, triangles: medium-resolution dataset and circles: high-resolu-tion dataset)
B. Tings et al.
1 3
5 Review of the simulation‑based detectability model
Due to its simplicity and capability to fulfil Near Real Time (NRT) requirements, the CFAR algorithm is commonly used in SAR ship detection. The ideology to have a detector with constant false alarm rate for a known distribution of the clut-ter is here used for the implementation of simulation-based ship detectability model.
The practical implementation of the CFAR algorithm is composed by three nested image sub-regions named: target sub-window Tw ; guard sub-window Gw ; background sub-window Bw [24]. The background window is assumed to be big enough to capture the underling statistical clutter distri-bution, and small enough to preserve ergodicity. The guard window is used to avoid that the ship signature affects the signal of the background window.
If H0 represents the hypothesis that the cell under test contains only clutter and H1 represents the hypothesis that the cell under test contains a combination of clutter and tar-get, the probability of false alarm Pfa for a given detection threshold Th is expressed by:
and the probability of detection Pd is calculated by:
Therefore, a model capable to simulate the expected probability of detection needs to be able to model the back-ground distribution FA(x) and the target distribution PD(x) , where x represents the random variable of the observation. The simulation model used in this analysis is based on the settings and assumptions of the established procedure proposed by Vachon et al. for diverse C-band SAR satel-lites [25–28], where the sea clutter is modelled using the K-distribution and the target is assumed to follow the Swer-ling Type III fluctuation model [29]. Inspired by the initial results obtained for X-band SAR satellite images in [30, 31], a simulation model based on a larger dataset, i.e. the one described in Sect. 2, is briefly described in the next sections.
5.1 The background distribution
The ability of the K-distribution to model the underling imaging process of sea surface images are explored in many works [8–10]. The K-distribution is illustrated in Eq. 5 below:
(3)Pfa = ∫∞
Th
P(x|H0) dx = ∫∞
Th
FA(x) dx
(4)Pd = ∫∞
Th
P(x|H1) dx = ∫∞
Th
PD(x) dx.
where L is the number of statistically independent looks, G(⋅) is the Gamma function, and K(⋅) is the modified Bessel function of second kind, (�, �) are respectively the mean value and shape factor of the distribution.
The shape parameter � is associated with the skewness of the K-distribution, and is connected with the sea state [14]. In [32] the shape parameter variation is analysed to different X-band image resolutions and incidence angles, showing that it provides satisfactory fitting for images with VV polarizations in a large range of incidence angles. Draw-ing on previous observations [32] and the final setting of the ship detectability model for C-band SAR images [25], the shape parameter � has been set to 4 and 20 during our simulation runs, to take into account for moderate and low sea state conditions present in the real dataset. Those val-ues of the shape parameter are used independently of the image resolution class. The � value corresponds to the mean value of the ocean backscatter captured by the background window. To simulate the mean value of the sea’s surface in X-band SAR images at varying wind speeds, the empirical Geophysical Model Function (GMF) XMOD2, as described in [13], has been used. The XMOD2 function is a non-linear GMF which is able to depict the difference in the sea surface radar backscatter in upwind and crosswind conditions [13], in contrast to the previous linear model XMOD, that has been used for the first results on ship detectability in [31]. In brief, XMOD2 is used to provide an estimation of the � parameter of the K-distribution by varying wind speed U10 , wind direction � and SAR incidence angle �:
Please note that although the XMOD2 function has been trained with VV polarisation data, it is able to estimate accu-rately wind speed also for HH polarisation data using the Polarisation Ratio (PR) function [13].
Once the background distribution is defined, Th is deter-mined from Eqs. 3 and 5, for a given sea state, i.e. here expressed by the estimated parameter �̃� which assumes the values 4 and 20, and wind condition, i.e. here expressed by the estimated parameter �̃� . In other words, Th can be seen as the critical value of sigma nought �c that would be detected as target for a given probability of false alarm Pfa . Taken into account that the background distribution is modelled as K-distribution in Eq. 5, it is clear that:
To invert such relationship the approach proposed in [25] is implemented by finding �c numerically and setting a Pfa = 0.5% . Finally, taking into the critical value of sigma nought �c and the SAR spatial resolution characteristics in
(5)P(x) =2
x
(L�x
�
)L+�∕21
G(L)G(�)K�−L
[2
(L�x
�
)1∕2]
(6)�̃� = XMOD2(U10, 𝜃,𝜙).
(7)𝜎c = f (Pfa, �̃�, �̃�, L).

Modelling ship detectability depending on TerraSAR-X-derived metocean parameters
1 3
ground range �r and azimuth �a , the minimum point target radar cross section that triggers the detection is [25]:
5.2 The target distribution
The ship signal in a SAR image is composed by the con-tribution of many scatter centres and different scattering processes and interactions [33]. The Swerling Type III fluc-tuation model is employed here to describe the statistical properties of the RCS of the three classes of ship size (see Table 2). The Swerling type III probability density function (pdf) belongs to the �2-distribution which is able to capture statistically the fluctuations of the reflected signal when the target can be considered as a superposition of a dominant isotropic reflector and many smaller ones [29]. The pdf of the RCS � of such target is given in Eq. 9:
where �r is a free-parameter that stands for sigma-reference, and represents the arithmetic mean of all values of RCS of the reflecting target. Making use of the large database of ships’ radar signatures at hand, the �r can be empiri-cally derived for each of the three ship size groups: small, medium, and large. For a given confidence � , the sigma-reference �r is calculated by means of the quantile function which is provided in the Eq. 10
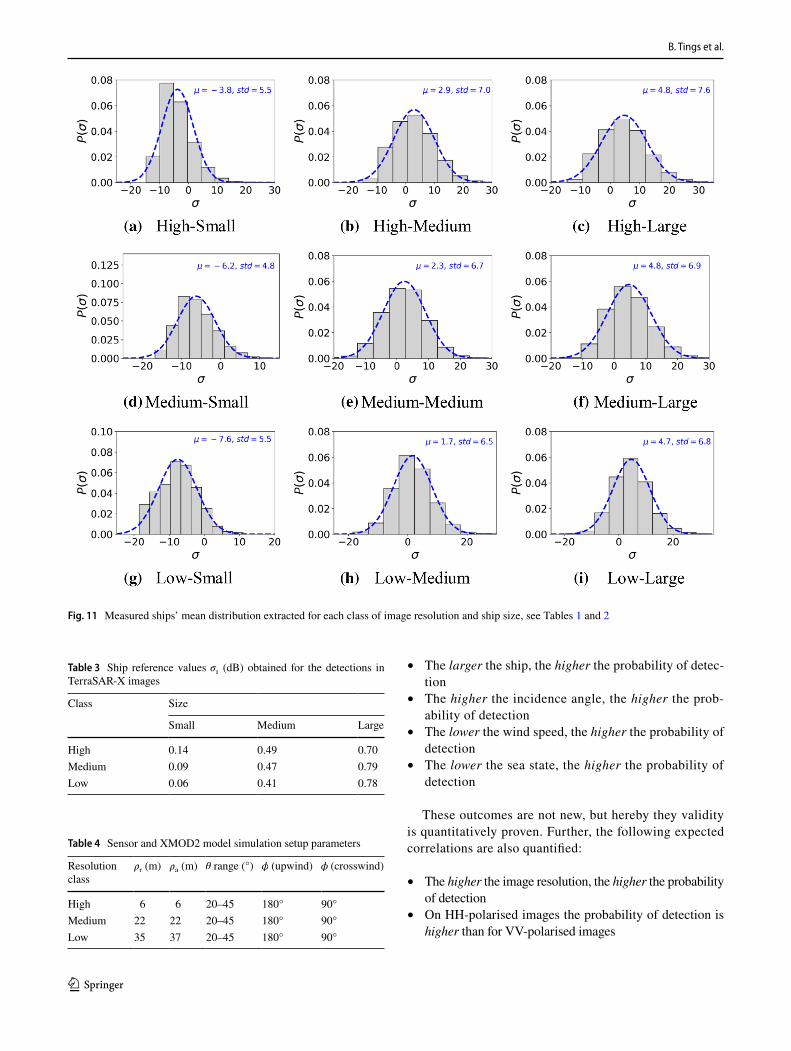
where �ship and �ship are the arithmetic average and standard deviation of the respective ships’ mean distribution. The choice of using the quantile function to obtain �r is justified by the fact that in each ship’s size class, i.e. small, medium, and large, different types of ships with different geometry of observation are included. Figure 11a–i show the ships’ mean distributions for each case considered with the relative �ship and �ship . For reference the Gaussian pdf curves (dotted blue curve) are plotted over the histograms. As expected, the mean value �ship and standard deviation �ship increase going from small (left column in Fig. 11) to large (right column in Fig. 11) size. In general, they also decrease going from high (top row in Fig. 11) to low (bottom row in Fig. 11) class, with the exception of the large size where �ship is almost con-stant. This is probably due to the limited amount of samples present for medium and low-resolution dataset.
Setting � = 0.8 for the nine resolution–size combina-tions the obtained �r according to Eq. 10 are summarized in Table 3.
(8)RCSmin = �r�a�c.
(9)p(�) =4�
�2r
e−
2�
�r
(10)�r = �ship −√2 × erf−1(2� − 1) × (�ship)
6 Visualisation of simulation‑based detectability model
Similar to the data-driven ship detectability model results shown in Sect. 4, the simulation-based dependency from the four parameters ship size, incidence angle, wind speed and significant wave height, can be visualized in form of 2D detectability charts. Taking into account that there are three classes of image resolution, three classes of ship size (see Fig. 1 for details) and two sea state conditions are modelled (low and moderate), 18 charts showing the probability of detection with varying incidence angle and wind speed are generated. The probability of detection is calculated using Eqs. 4 and 9, for: a given �r in Table 3, sensor and XMOD2 setup parameters summarized in Table 4 and the result of Eq. 8 as threshold.
The following Figs. 12, 13, 14, 15, 16 and 17 display the simulation-based detectability results. As can be seen, the model is capable of taking into account the different sea state conditions, although the difference is very limited. On the other hand, the influence of the ship size on the results obtained for the resolution class high (Figs. 12, 13), seems to be not very pronounced. Also the prediction on the prob-ability of detection of small ship (Figs. 12, 13 left panel) seems a bit too optimistic and in practise does not reflect what we have observed in real data. In fact, the slope from the possible best favourable condition (low wind − high inci-dence angle) and the worst one (high wind − low incidence angle) is quite flat with the impact of the nonlinearity of the XMOD2 almost unperceivable. Indeed, for the class medium and low, the slope rapidly decreases and the nonlinearity of the wind speed is quite present.
7 Confrontation of data‑driven and simulation‑based approach
All datasets were found sufficiently large to qualify for clas-sifier training. The obtained high-, medium- and low-resolu-tion data-driven models are thus confronted with the respec-tive state-of-the-art simulation-based models. As sea state information is only available in the high-resolution data-set, in this section only high-resolution data-driven model results for low and moderate sea state are confronted with the respective simulation-based results. The results of the medium and low-resolution models are compared without taking sea state information into account.
In general, the well known impacts of the four inves-tigated parameters, i.e. ship size, incidence angle, wind speed and sea state, on the detectability of ships is accu-rately represented in the data-driven model and qualita-tively represented in the simulation-based model results:
B. Tings et al.
1 3
• The larger the ship, the higher the probability of detec-tion
• The higher the incidence angle, the higher the prob-ability of detection
• The lower the wind speed, the higher the probability of detection
• The lower the sea state, the higher the probability of detection
These outcomes are not new, but hereby they validity is quantitatively proven. Further, the following expected correlations are also quantified:
• The higher the image resolution, the higher the probability of detection
• On HH-polarised images the probability of detection is higher than for VV-polarised images
Fig. 11 Measured ships’ mean distribution extracted for each class of image resolution and ship size, see Tables 1 and 2
Table 3 Ship reference values �r (dB) obtained for the detections in
TerraSAR-X images
Class Size
Small Medium Large
High 0.14 0.49 0.70Medium 0.09 0.47 0.79Low 0.06 0.41 0.78
Table 4 Sensor and XMOD2 model simulation setup parameters
Resolution class
�r (m) �
a (m) � range (°) � (upwind) � (crosswind)
High 6 6 20–45 180° 90°Medium 22 22 20–45 180° 90°Low 35 37 20–45 180° 90°

Modelling ship detectability depending on TerraSAR-X-derived metocean parameters
1 3
While the models for the three resolutions show signifi-cant differences in the probability of detection, the two mod-els with different polarisation are similar. This means, HH
polarisation is only slightly better suited for ship detection than VV polarisation.
In contrast to the simulation-based model results the impact of incidence angle to the detectability of ships is almost not
Fig. 12 Simulation results for the image resolution class high and low sea state condition. From left to right small, medium and large vessels
Fig. 13 Simulation results for the image resolution class high and moderate sea state condition. From left to right small, medium and large ves-sels
Fig. 14 Simulation results for the image resolution class medium and low sea state condition. From left to right small, medium and large vessels

B. Tings et al.
1 3
Fig. 15 Simulation results for the image resolution class medium and moderate sea state condition. From left to right small, medium and large vessels
Fig. 16 Simulation results for the image resolution class low and low sea state condition. From left to right small, medium and large vessels
Fig. 17 Simulation results for the image resolution class low and moderate sea state condition. From left to right small, medium and large ves-sels

Modelling ship detectability depending on TerraSAR-X-derived metocean parameters
1 3
present for medium- and low-resolution data. Only outside the full performance incidence angle range a significant depend-ency to the detectability was observed during experiments. However, as TerraSAR-X images are only exceptionally acquired outside the full performance range, this is not further considered in this paper.
Further the simulation-based models are more optimistic about the detectability of ships than the data-driven models. The high-resolution models agree only under the extreme con-ditions given by the couples (high wind speed, low incidence angle) and (low wind speed, high incidence angle) under low sea state conditions. The agreement between the medium and low-resolution models is even worse; here only one extreme condition couple (high wind speed, low incidence angle) coincide. For the other extreme condition couples (low wind, high incidence angle), the simulation-based model predicts a certainty of detection even for small ship size. This means in reality the probability to detect ships is less than the simula-tion predicts.
Discrepancies between the data-driven and simulation-based approach may occur due to several reasons. Main dif-ference is that the basis of the data-driven approach is a lin-ear model, while the basis of the simulation-based model is non-linear. As the data-driven approach is based on classifier training, the model can be easily converted to any non-linear basis by replacing the underlying classification method. But an increasing model complexity could also result in an over-fitted model.
The data-driven model actually completely ignores false alarms in the calculation of the probability of detection. Theo-retically, calling the model output then “probability of detec-tion” is wrong, but the applied probability of false alarm was smaller than PFA < 10−13 during the generation of the training dataset. This means false alarms can be ignored and naming is kept.
8 Conclusion
This paper presents a full data-driven ship detectability model for ship signatures on TerraSAR-X SAR images. The model is based on a large database of verified ship positions and the binary training of a L2-regularized logis-tic regression classifier. The classifier provides probability of detection by calculating probabilities of class affiliation for ship samples labelled either with “detected” or “non-detected”. Using such approach, it was possible for the first time to investigate the influence of sensor acquisition parameters and metocean conditions on the detectability of ships in SAR images not only from a qualitative point of view but also from a quantitative perspective. In addition, the proposed data-driven model is compared to results from a state-of-the-art simulation-based ship detectability
model in SAR images. Indeed, both methods are capa-ble of providing probability of detection maps at varying target’s, sensor’s and metocean conditions. Comparing the results of both methods is not straightforward and the models were found to only be in conformity for extreme characteristics of wind speed and incidence angle param-eters. However, the newly presented data-driven model is expected to better reflect the reality. Future research should verify this statement by application of a different non-linear classification technique. Last but not least, the outcome of this work is an important achievement that could lead future improvements in NRT SAR ship detec-tion service and represent a quantitative analysis of the performances which is very welcome from the end-user point of view.
Acknowledgements TerraSAR-X data has been acquired using the science proposals OCE2203, OCE3207 and OCE3596. Includes cop-yrighted material of vesseltracker.com GmbH. Includes copyrighted material of JAKOTA Cruise Systems GmbH.
Open Access This article is distributed under the terms of the Crea-tive Commons Attribution 4.0 International License (http://creat iveco mmons .org/licen ses/by/4.0/), which permits unrestricted use, distribu-tion, and reproduction in any medium, provided you give appropriate credit to the original author(s) and the source, provide a link to the Creative Commons license, and indicate if changes were made.
References
1. Eldhuset, K.: An automatic ship and ship wake detection system for spaceborne SAR images in coastal regions. IEEE Trans. Geosci. Remote Sens. 34, 1010–1019 (1996)
2. Wackerman, C.C., Friedman, K.S., Pichel, W.G., Clemente-Colón, P., Li, X.: Automatic detection of ships in RADARSAT-1 SAR Imagery. Can. J. Remote Sens. 27, 371–378 (2001)
3. Joint Research Centre: Integrated maritime surveillance. http://ec.europ a.eu/marit imeaff airs /polic y/integ rated _marit ime_surve illan ce_en. Accessed 25 Oct 2018
4. Copernicus: Copernicus-security service. http://www.coper nicus .eu/main/secur ity. Accessed 25 Oct 2018
5. Brusch, S.: EMSec-maritime security. http://www.dlr.de/dlr/en/deskt opdef ault.aspx/tabid -10081 /151_read-19273 /. Accessed 25 Oct 2018
6. Singha, S., Velotto, D., Lehner, S.: Near real time monitoring of platform sourced pollution using TerraSAR-X over the North Sea. Mar. Pollut. Bull. 86, 379–390 (2014)
7. Bentes, C., Frost, A., Velotto, D., Tings, B.: Ship-iceberg dis-crimination with convolutional neural networks in high resolution SAR images. In: Proceedings of EUSAR 2016: 11th European Conference on Synthetic Aperture Radar, pp. 1–4 (2016)
8. Bentes, C., Velotto, D., Lehner, S.: Target classification in ocean-ographic SAR images with deep neural networks: architecture and initial results. In: 2015 IEEE International Geoscience and Remote Sensing Symposium (IGARSS), pp. 3703–3706 (2015)
9. Brusch, S., Lehner, S., Fritz, T., Soccorsi, M., Soloviev, A., van Schie, B.: Ship surveillance with TerraSAR-X. IEEE Trans. Geo-sci. Remote Sens. 49, 1092–1103 (2011)

B. Tings et al.
1 3
10. Tings, B., da Silva, C.A.B., Lehner, S.: Dynamically adapted ship parameter estimation using TerraSAR-X images. Int. J. Remote Sens. 37(9), 1990–2015 (2015)
11. Velotto, D., Bentes, C., Tings, B., Lehner, S.: First comparison of sentinel-1 and TerraSAR-X data in the framework of mari-time targets detection: South Italy case. IEEE J. Ocean. Eng. 41, 993–1006 (2016)
12. Fernandez Arguedas, V., Velotto, D., Tings, B., Van Wimersma Greidanus, H., Bentes, C.: Ship classification in high and very high resolution satellite SAR imagery. In: 11th Future Security, September 26–28, 2016. Fraunhofer Verlag, Stuttgart (2016)
13. Li, X.M., Lehner, S.: Algorithm for sea surface wind retrieval from TerraSAR-X and TanDEM-X data. IEEE Trans. Geosci. Remote Sens. 52, 2928–2939 (2014)
14. Bruck, M., Lehner, S.: Coastal wave field extraction using Ter-raSAR-X data. J. Appl. Remote Sens. 7, 073694–073694 (2013)
15. Pleskachevsky, A.L., Rosenthal, W., Lehner, S.: Meteo-marine parameters for highly variable environment in coastal regions from satellite radar images. ISPRS J. Photogramm. Remote Sens. 119, 464–484 (2016)
16. Breit, H., Fritz, T., Balss, U., Lachaise, M., Niedermeier, A., Von-avka, M.: TerraSAR-X SAR processing and products. IEEE Trans. Geosci. Remote Sens. 48, 727–740 (2010)
17. Breit, H., Fischer, M., Balss, U., Fritz, T.: TerraSAR-X staring spotlight processing and products. In: Proceedings of EUSAR 2014; 10th European Conference on Synthetic Aperture Radar, pp. 1–4 (2014)
18. Jacobsen, S., Lehner, S., Hieronimus, J., Schneemann, J., Kühn, M.: Joint offshore wind field monitoring with spaceborne SAR and platform-based Doppler LiDAR measurements. In: ISPRS-International Archives of the Photogrammetry, Remote Sens-ing and Spatial Information Sciences, pp. 959–966. Copernicus GmbH, Göttingen (2015)
19. International Maritime Organization. http://www.imo.org/en/Pages /Defau lt.aspx. Accessed 25 Oct 2018
20. Lin, C.-J., Weng, R.C., Keerthi, S.S.: Trust region newton meth-ods for large-scale logistic regression. In: Proceedings of the 24th International Conference on Machine Learning, pp. 561–568. ACM, New York (2007)
21. Fan, R.-E., Chang, K.-W., Hsieh, C.-J., Wang, X.-R., Lin, C.-J.: LIBLINEAR: a library for large linear classification. J. Mach. Learn. Res. 9, 1871–1874 (2008)
22. Wu, T.-F., Lin, C.-J., Weng, R.C.: Probability estimates for multi-class classification by pairwise coupling. J. Mach. Learn. Res. 5, 975–1005 (2004)
23. Kohavi, R.: A study of cross-validation and bootstrap for accu-racy estimation and model selection. In: Proceedings of the 14th International Joint Conference on Artificial Intelligence, vol. 2, pp. 1137–1143. Morgan Kaufmann Publishers Inc., San Francisco (1995)
24. Crisp, D.J.: The state-of-the-art in ship detection in synthetic aperture radar imagery. Edinburgh: DSTO Information Sciences Laboratory (2004)
25. Vachon, P.W., Campbell, J.W.M., Bjerkelund, C.A., Dobson, F.W., Rey, M.T.: Ship detection by the RADARSAT SAR: validation of detection model predictions. Can. J. Remote Sens. 23, 48–59 (1997)
26. Vachon, P.W., Wolfe, J., Greidanus, H.: Analysis of Sentinel-1 marine applications potential. In: 2012 IEEE International Geosci-ence and Remote Sensing Symposium, pp. 1734–1737 (2012)
27. Vachon, P.W., Wolfe, J.: GMES Sentinel-1 Analysis of Marine Applications Potential (AMAP). Defence R&D Canada, Ottawa (2008)
28. Olsen, R.B., Wahl, T., Engen, G.: Expected performance of the ENVISAT ASAR for near real-time maritime applications. In: Geoscience and Remote Sensing Symposium, 1999. IGARSS’99 Proceedings. IEEE 1999 International, vol. 2, pp. 962–964 (1999)
29. Swerling, P.: Probability of detection for fluctuating targets. IRE Trans. Inf. Theory 6, 269–308 (1960)
30. Bentes, C., Velotto, D., Lehner, S.: Analysis of ship size detect-ability over different TerraSAR-X modes. In: Geoscience and Remote Sensing Symposium (IGARSS), 2014 IEEE International, pp. 5137–5140. IEEE, New York (2014)
31. Vachon, P.W., English, R., Sandirasegaram, N., Wolfe, J.: Devel-opment of an X-band SAR ship detectability model: analysis of TerraSAR-X ocean imagery. Defence Research and Development Canada, Canada (2013)
32. Crisp, D.J., Rosenberg, L., Stacy, N.J., Dong, Y.: Modelling X-band sea clutter with the K-distribution: shape parameter vari-ation. In: 2009 International Radar Conference “Surveillance for a Safer World” (RADAR 2009), pp. 1–6 (2009)
33. Margarit, G., Mallorqui, J.J., Fortuny-Guasch, J., Lopez-Martinez, C.: Phenomenological vessel scattering study based on simulated inverse SAR imagery. IEEE Trans. Geosci. Remote Sens. 47, 1212–1223 (2009)