modelling of wind speed fields over europe and power correlations in a 400 gw scenario
DESCRIPTION
Modelling of Wind Speed Fields over Europe and Power Correlations in a 400 GW Scenario. Jens Tambke, Lueder von Bremen, Michael Schmidt, Gerald Steinfeld, Jörg-Olaf Wolff ForWind & ICBM / Universität Oldenburg Frans Van Hulle XPwind, Belgium. Overview. - PowerPoint PPT PresentationTRANSCRIPT

Modelling of Wind Speed Fields over Europe and Power Correlations in a 400 GW Scenario
Jens Tambke, Lueder von Bremen, Michael Schmidt,Gerald Steinfeld, Jörg-Olaf Wolff
ForWind & ICBM / Universität Oldenburg
Frans Van HulleXPwind, Belgium
Overview
Grid Design in the IEE-study „OffshoreGrid“
Mesoscale Wind Power Modelling
Fluctuations and Pan-European Wind Power Correlations

Meshed Prototype Grid

Meso-scale Model: WRF
WRF-speeds [m/s] at 90maverages in 2007
[m/s]
FNL initialization
2-domain-setup, one-way-nesting
1st domain resolution: 27x27 km²
2nd domain resolution: 9x9 km²

Mean Wind Speeds at 100m:~10m/s
Mean Potential Power Production:~50% of the installed Capacity
~8760h Bias
m/s
RMSE
m/s
ECMWF
Op. Analysis
-0.4 1.5
DWD Op. Analysis
<-0.1 1.4
MM5 using NCEP
<0.1 2.3
(2004)
MM5
usingECMWF
<0.1 1.5
(2004)
WRF
using NCEP
<-0.1 2.0
(2008)
WRF
usingECMWF
<-0.1 1.5
(2008)
FINO1, alpha ventus
Meso-scale Errors at FINO1

Spatial Smoothing EffectsBelgium / Mid-West EU / EU+No+CH
slide 6

Total European On&Offshore Power
2030: 267 GW inst. Onshore - mean production: 64 GW
127 GW inst. Offshore - mean theoret. prod.: 66 GW[GigaWatt]
Time in the Year [h]
Total Sum

Spatial Smoothing EffectsCorrelation with real German Wind Power Generation
von-Bremen-Map
winter
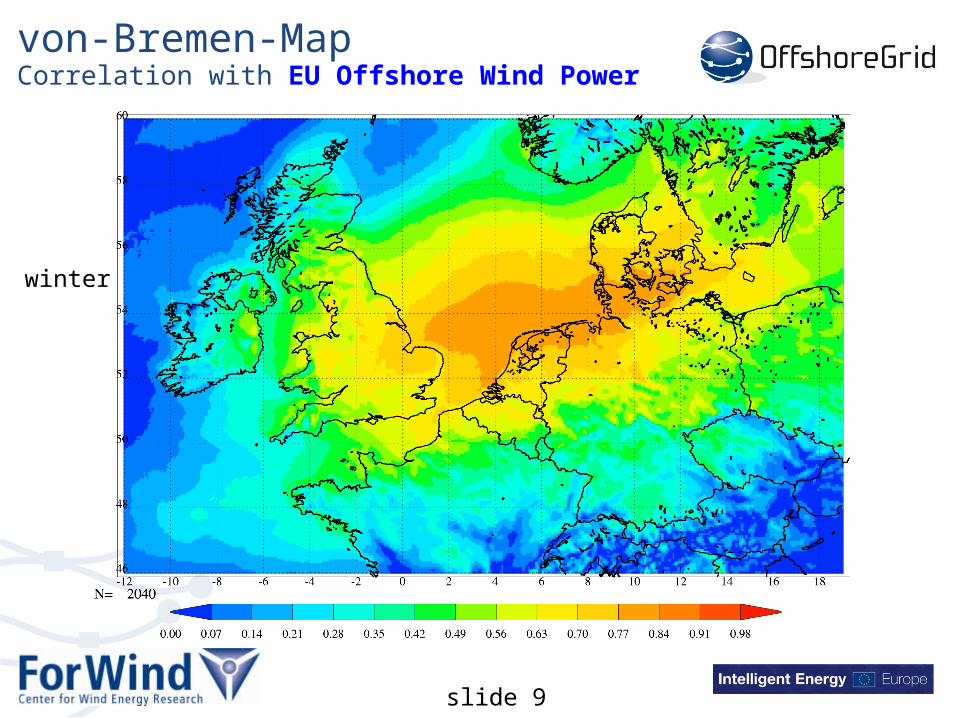
von-Bremen-MapCorrelation with EU Offshore Wind Power
winter
slide 9

von-Bremen-MapCorrelation with EU Onshore Wind Power
winter

von-Bremen-MapCorrelation with total EU On+Offshore Wind Power
winter

von-Bremen-MapCorrelation with EU Offshore Wind Power
wholeyear

von-Bremen-MapCorrelation with EU Onshore Wind Power
wholeyear
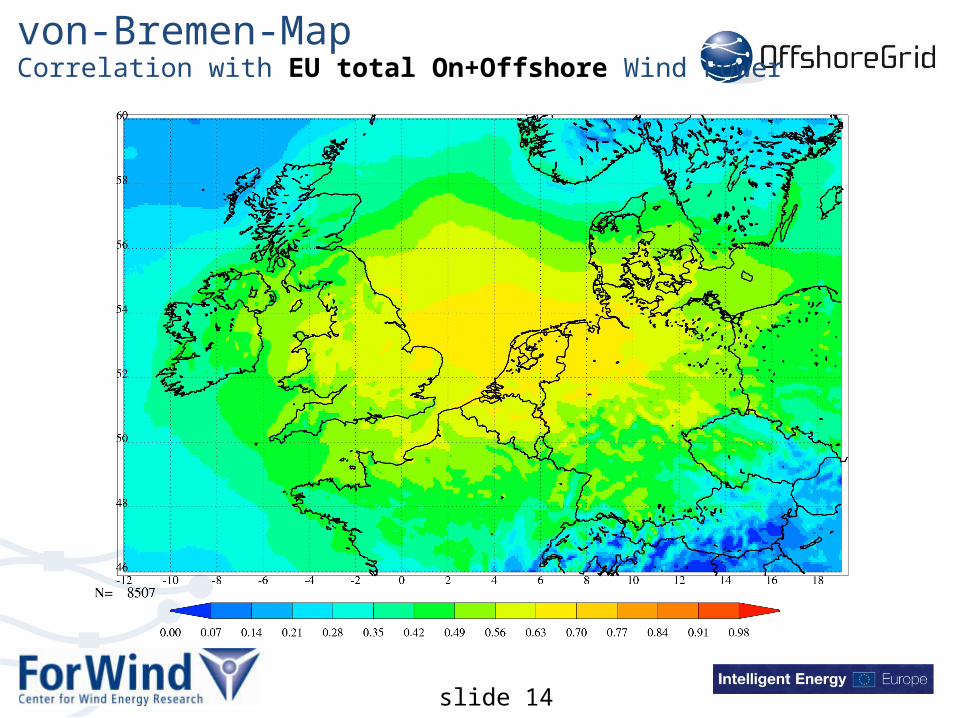
von-Bremen-MapCorrelation with EU total On+Offshore Wind Power
slide 14

Spatial Smoothing Effects1-hour Power Gradients

Monthly Solar & Wind Generation & Load Fluctuations in Europe
consumption anom
aly [GW
] (mean=
357GW
)
PV Wind Lastanomalie
Source:L.von Bremen et al. Proc. 8th Int. Offshore Integration Workshop (Ackermann Workshop), Bremen 2009
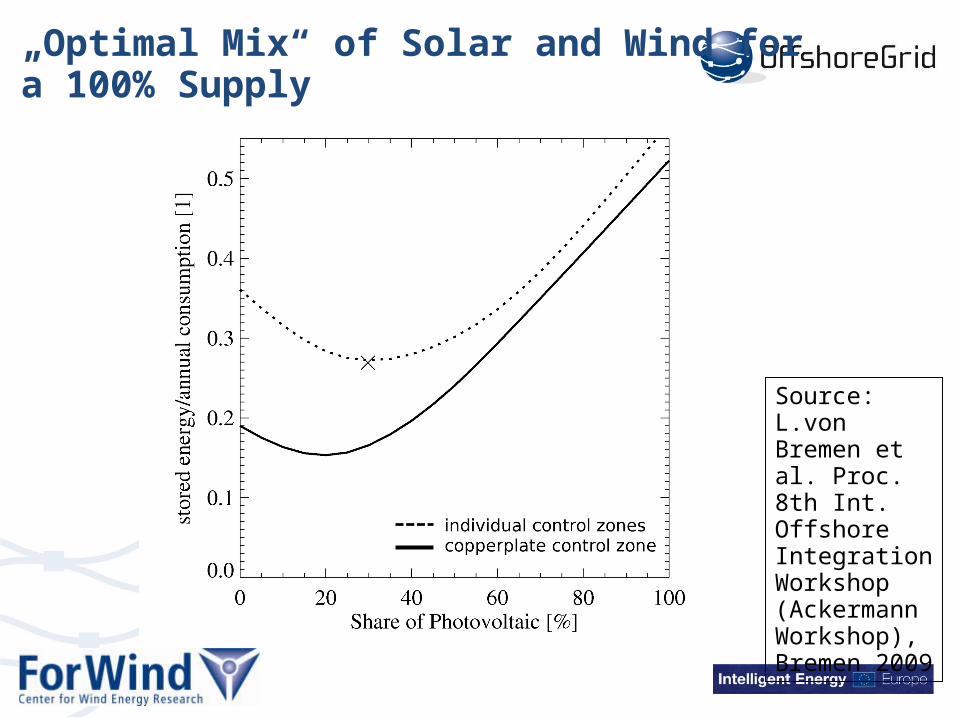
„Optimal Mix“ of Solar and Wind for a 100% Supply
Source:L.von Bremen et al. Proc. 8th Int. Offshore Integration Workshop (Ackermann Workshop), Bremen 2009

Conclusions
Meso-scale simulations exhibit stronger variability of regional power than former studies using only global-scale analysis
Large-scale wind power integration (e.g. 80%) will be much easier with an On+Offshore SuperGrid to smooth variability
www.OffshoreGrid.euwww.SafeWind.eu
Back up slides

Meso-scale Model WRF
WRF model:
NCEP initialization
2-domain-setup, one-way-nesting
1st domain resolution: 27x27 km²
2nd domain resolution: 9x9 km²
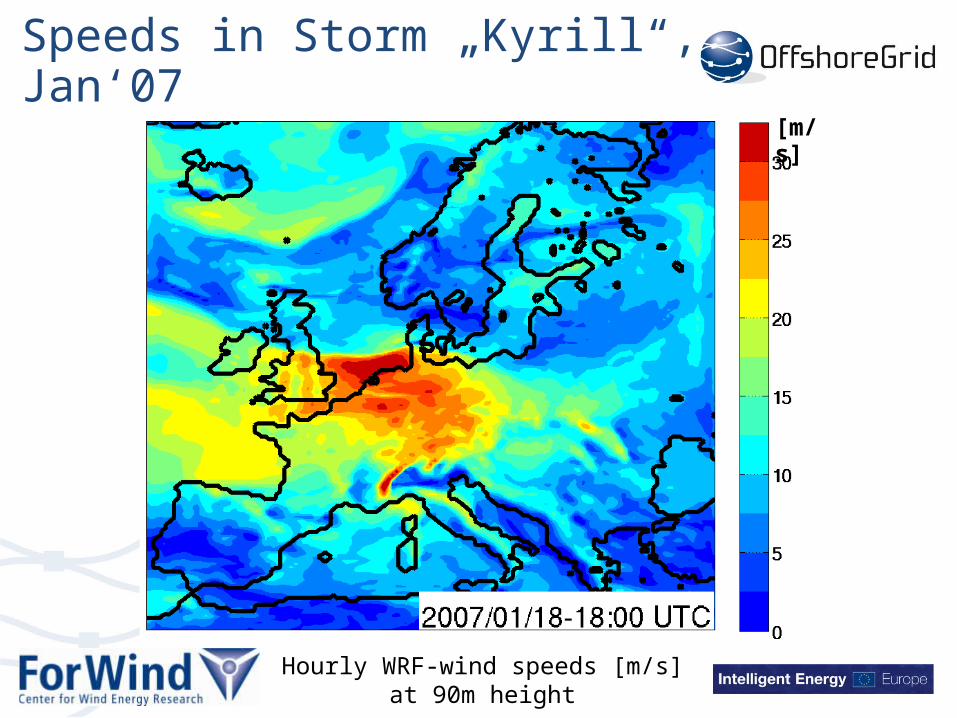
Speeds in Storm „Kyrill“, Jan‘07
Hourly WRF-wind speeds [m/s]at 90m height
[m/s]

Storms at FINO1 and in WRF
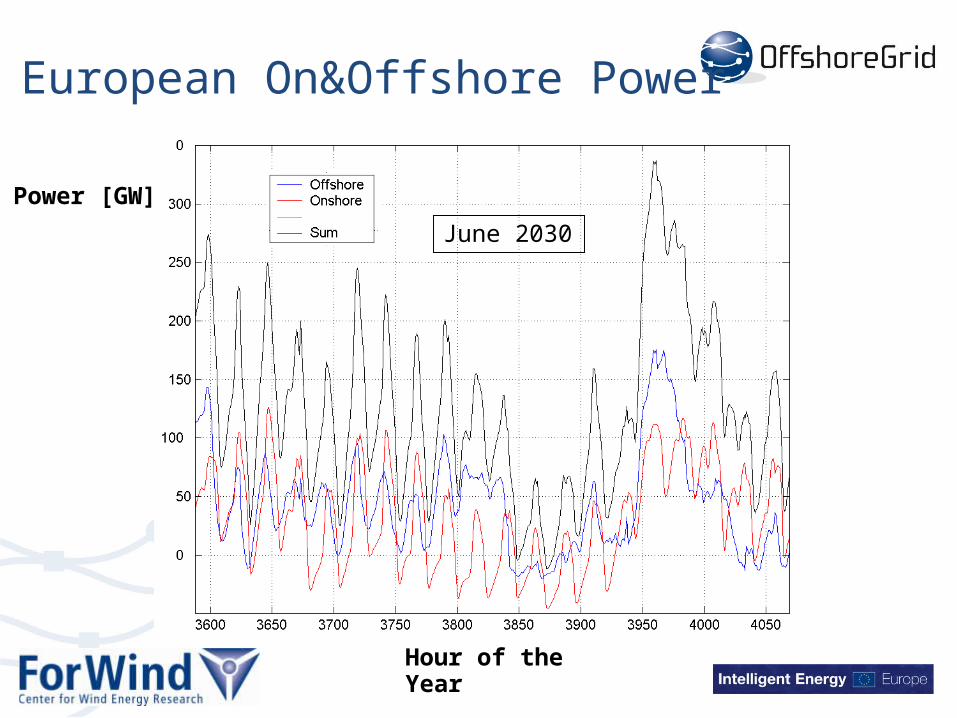
European On&Offshore Power
Hour of the Year
Power [GW]
June 2030
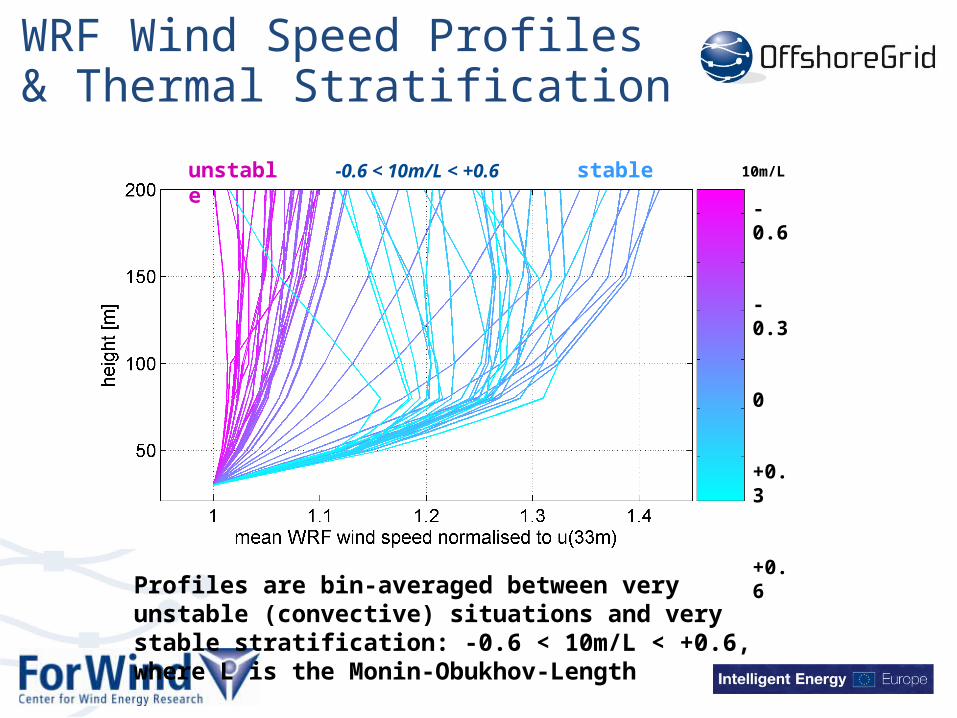
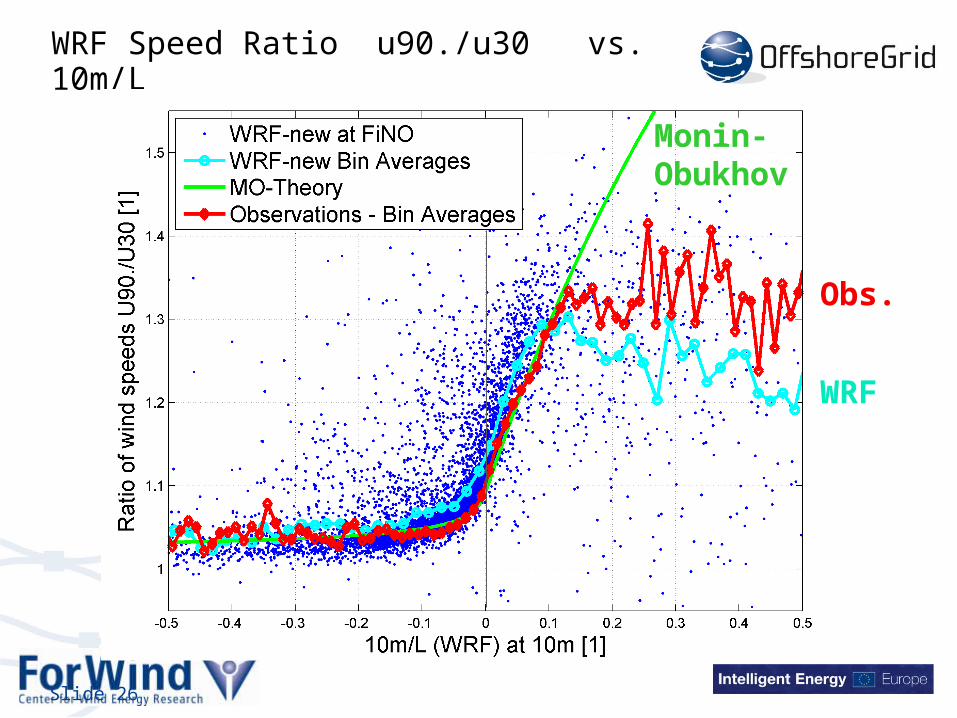
WRF Wind Speed Profiles & Thermal Stratification
-0.6
-0.3
0
+0.3
+0.6
10m/Lunstable stable-0.6 < 10m/L < +0.6
Profiles are bin-averaged between very unstable (convective) situations and very stable stratification: -0.6 < 10m/L < +0.6, where L is the Monin-Obukhov-Length

Mean Wind Profiles at FINO1
WRF
Observation
DWD-LME
for wind directions between 190° and 250°
Slide 26
WRF Speed Ratio u90./u30 vs. 10m/L
WRF
Obs.
Monin-Obukhov