modelling of the behavior of post-tensioned concrete
TRANSCRIPT

Modelling of the behavior of post-tensioned concrete structures subjected to long term thermal loads
Medina Reguera, Fernando1; Cifuentes Bulté, Héctor2; Medina Encina, Fernando3
ABSTRACT
The effect of the reduction of concrete material strength and the deformations and stress level due to the non-uniform temperature distribution within a structural element such as a storage tank has a coupled negative effect on the post-tensioned concrete design. Heated strands embedded in a heated concrete element will elongate, hence reducing the post-tensioning force. This reduction will reduce the confinement of concrete, which added to the temperature gradient derived tension results in a greater level of damage and cracking. This study sets up a strongly non-linear model that attempts to account for all these effects. The results show that cracking localization grows surrounding the tendon duct, producing a sharp decrease in the post-tensioning force and a significant reduction of global stiffness
Keywords: Post-tensioned, Concrete, Thermo-mechanical, Damage, Fracture.
1. INTRODUCTION
The effect of high temperature in concrete has been addressed in a variety of ranges and applications, from relatively low increases, e.g. due to sun radiation to elevated temperatures during a short exposition, such as fire. For temperatures up to 80ºC, it is widely accepted by concrete standards and codes that the alterations of the material properties can be addressed as an instantaneous stress-strain relation alteration, which may be maintained regardless the duration of the exposition. Concrete shows a significant reduction in its strength, both compressive and tensile, as well as in its stiffness due to a decrease of the modulus of elasticity. Besides, fracture energy drops also with temperature increase, diminishing the ductility of the structural element.
The change of these properties onto a certain structural element, which has a previous stress level due to external loads needs to be studied. Furthermore, the non-uniform temperature distribution that the concrete structure may exhibit due to its thermal boundary conditions on its sections will generate a differential thermal expansion. The strain compatibility will generate a thermally induced stress field that may result in unexpected cracking of concrete and larger global displacements.
1 Grupo de Estructuras Escuela Superior de Ingenieros de Sevilla [email protected] (Corresponding author)
2 Grupo de Estructuras Escuela Superior de Ingenieros de Sevilla. [email protected]
3 Grupo de Estructuras Escuela Superior de Ingenieros de Sevilla. [email protected]
385
This issue gains relevance in post-tensioned concrete, where the hoop (circumferential) compressive stress field generated by the strands tension is dependent of the deformation of the structural element after post-tensioning.
A model is developed to evaluate the coupled effect of temperature in post-tensioned concrete, including the material properties affection as well as the evolution of the thermo-mechanical non-linear relation with the post-tensioning force transmitted to the element.
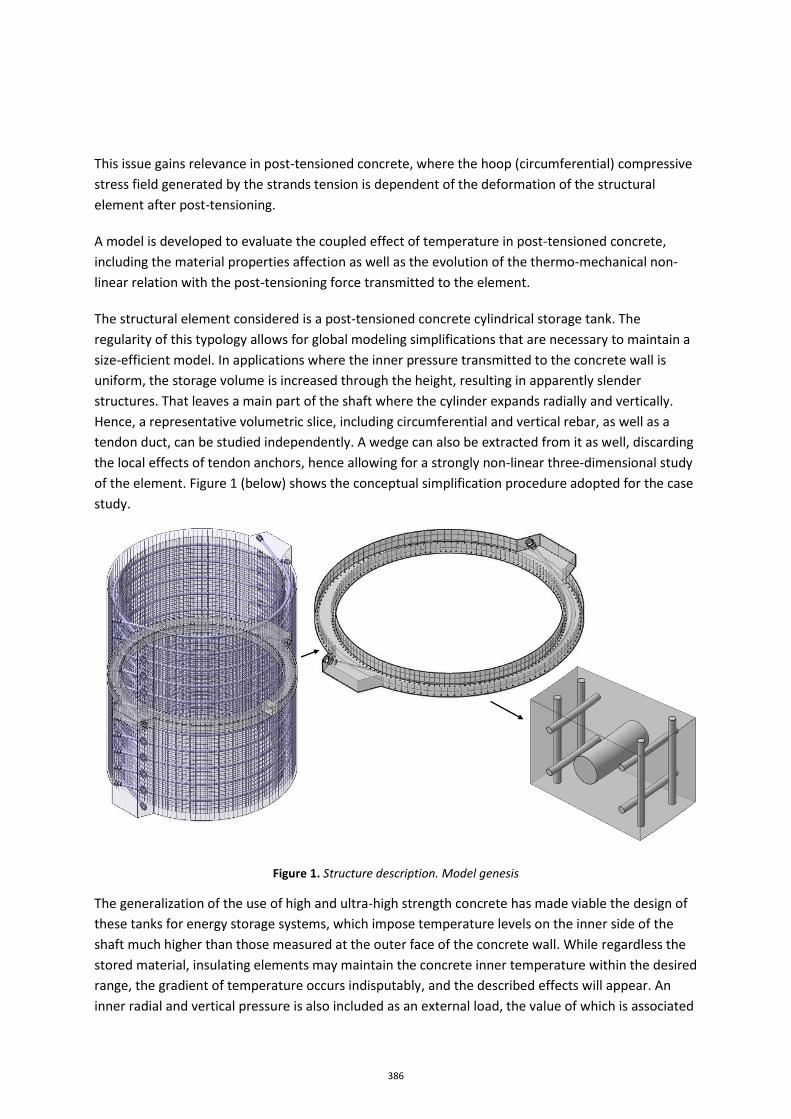
The structural element considered is a post-tensioned concrete cylindrical storage tank. The regularity of this typology allows for global modeling simplifications that are necessary to maintain a size-efficient model. In applications where the inner pressure transmitted to the concrete wall is uniform, the storage volume is increased through the height, resulting in apparently slender structures. That leaves a main part of the shaft where the cylinder expands radially and vertically. Hence, a representative volumetric slice, including circumferential and vertical rebar, as well as a tendon duct, can be studied independently. A wedge can also be extracted from it as well, discarding the local effects of tendon anchors, hence allowing for a strongly non-linear three-dimensional study of the element. Figure 1 (below) shows the conceptual simplification procedure adopted for the case study.
Figure 1. Structure description. Model genesis
The generalization of the use of high and ultra-high strength concrete has made viable the design of these tanks for energy storage systems, which impose temperature levels on the inner side of the shaft much higher than those measured at the outer face of the concrete wall. While regardless the stored material, insulating elements may maintain the concrete inner temperature within the desired range, the gradient of temperature occurs indisputably, and the described effects will appear. An inner radial and vertical pressure is also included as an external load, the value of which is associated
386

to the temperature level, so that the total effect of the hot stored material is accounted for. Besides, developing a model and a methodology to optimize the post-tensioning force, to increase the maximum transmitted temperature and hence reduce the insulation, and to control cracking is necessary to improve the efficiency-cost relation of these structures. In general terms, designing a cracked post-tensioned section reduces the cost of the structure.
A material model combining macro-cracking, continuous displacement fields, damage and plasticity has been used to characterize concrete. The main model parameters are considered as temperature dependent. Elastic-plastic models are used for the embedded steel rebars, tendon and duct, and a fictitious no-tension steel strand host is included within the steel duct in order to model the discharge arch of the radial compressive force generated through strand tensioning and to maintain a strain compatibility that can reproduce the coupled thermo-mechanical dependency of the post-tensioning force.
The set-up of this model to evaluate of the effect and parametric influence of the temperature in the structural post-tensioned concrete is the main goal of this study. The results attempt to show that the consideration of temperature dependent fracture parameters is essential to evaluate properly the stress level of the section, the post-tensioning force and the measurable strains. The convenience of post-tensioning vertically the structure is also shown for certain ranges of pressure that may be associated to a temperature gradient.
2. THEORETICAL BACKGROUND
2.1. Temperature dependent parameters
The models describing the temperature dependency of the tensile strength, fracture and stiffness of concrete that have been used to characterize concrete in this model are those included in [1]. The formulation is valid for temperatures ranging between 0⁰C and 80⁰C. Other models that establish a temperature dependency relationship ranging much elevated temperatures may be found in [2].
In order to introduce the parameters in the models, 7 temperatures Tii have been applied, from T1=20⁰C to T7=80⁰C.
The parameters that are directly dependent with temperature express their relationship to their values at 20⁰C. These are:
Mean value of Compressive Strength:
(1)
Mean value of Tensile Strength:
(2)
387

Modulus of Elasticity:
(3)
Crushing Energy:
(4)
Fracture Energy:
(5)
As for the Crushing Energy, this relationship is not included in [1]. An assumption has been made that the relationship between GcI at 20⁰C and Tii is the same as that for most of the other parameters.
A regular high strength C50 concrete is used in this analysis, following a formulation valid only for the studied temperature range that has been used.
2.2. Uniaxial behavior characterization
The uniaxial stress-strain relationship with temperature dependency has been derived both in tension and compression, even though no compressive damage occurs for the loading and temperature conditions studied. Several definitions of the stress-strain curve have been studied in order to evaluate the sensitivity of the model to the shape of the curve, with special emphasis on the strain softening curve after reaching the tensile strength and the damage parameter associated to it. As for the basic parameters, the temperature dependence is indicated through the variable ii and a subindex T where a reference value for 20⁰C exists.
The uniaxial compression stress-strain characterization has been divided by the compressive strength into two branches. The parabolic pre-peak branch defined by the Model Code 2010 has been used up to the strain at maximum compressive stress.
(6)
Where
(7), (8) , (9)
388

For the Post-peak branch, a comparative study has been developed with the work of [3]and [4].
(10)
Where the descent function is
(11)
And the Compressive Parameter, also used for the Damage definition, is
bc = 0.70 (12)
Figure 2. Compressive Stress-Strain Relationship for Concrete Grade 50
The latter author uses experimental data for a concrete similar to that used in this study (C50). Both curves are also compared to the model by [5] as used in [6], which does not depend on the crushing energy or the element size, but only on the mean compressive strength. This last model, while commonly used by several commercial software packages, is not recommended in accordance with [7].
In Figure 2 a comparison of the three curves is presented, showing a match between experimental data by [4] and the model in [1], while the curve by [5] seems to assign a less ductile post-peak behavior to the material, enclosing a much smaller crushing energy.
The post-peak response by [8] has been finally chosen for this study given the similarities with the experimental data and the conclusions of [3].
As for the tensile stress-strain relationship, four different models have also been studied. The Model Code 2010 proposes a bilinear pre-peak curve as well as bi-linear post-peak strain softening curve. The experimental data of [4]is also compared, as well as the simple linear-linear model. The fourth model is the linear pre-peak, non-linear post-peak curve as defined by [9]. The analytical models have been
389

derived using the same fracture energy, which is similar to that obtained experimentally for this grade of concrete.
Figure 3. Compressive Stress-Strain Relationship for Concrete Grade 50
The overlaid plots in Figure 3 show the similarities of the non-linear and bilinear model, as well as their good fit with the experimental data. Conceptually, the pre-peak bi-linear branch (green curve above) accounts for the preliminary micro-cracking in concrete. For this reason, the model described in [1] has been used in this study.
2.3. The Fracture Mechanics Approach: Inelastic damage model for Concrete
This study has been developed using the finite element software Abaqus. The model developed by Lubliner et al and elaborated by Lee and Fenves (see [10]) called Concrete Damage Plasticity (CDP) is based on the Smeared Crack Model by [11] and uses a yield surface in the plane p-q of the Drücker-Prager type, isotropic damage and non-associated flow. Based on the smeared crack concept, this model can account for the effect of crack opening and closing in cyclic unloading and re-loading through compressive and tensile recovery parameters. The damage evolution functions define the stiffness degradation after the peak strength is reached.
Other parameters allow for a better fitting of the model to experimental results, such as the relationship between 2D stresses in order to reproduce the Kupfer curve (see [12]). The necessary experimental data and a procedure to adjust the parameters of this model can be found in [4].
As for reducing the mesh dependency, the key aspect is that the strain softening be defined as the stress-crack opening relationship in a specimen, which is in fact independent of the size of the specimen, since it represents the elongation of the localized crack band in the uniaxial tension test. The software converts this relationship into stress-strain, which implies that finite elements should not have a characteristic length any smaller than the crack bandwidth, since localization will occur in one row of elements, while the adjacent ones start recovering their initial state. There is also a limitation to the maximum element size, but this is related to numerical instabilities. As a total strain model, the CDP assumes that an element is a box containing microcracks that will relax and a crack band (with a
390

fixed width). If the element is too large, the elastic recovery (shortening) of the element may be larger than the crack opening (elongation), thus resulting in a snap-back. For this reason, elements close to the crack bandwidth will produce a sufficiently small elastic shortening during cracking, so that the fracture energy related crack opening results in a total elongation of the element, and hence an increase of the element strain.
The CDP model however uses a characteristic length, i.e. the √𝑉𝑒𝑙𝑡3 , to convert the displacement w into
strain. This implies that the displacement that an element will withstand while decreasing its stress level is in proportion to the element length normal to the crack direction and the characteristic length. Practically squared elements are recommended in order to maintain a certain level of accuracy in the results. This is impractical however, and the displacement results shall be obtained for several discretization.
As for the damage evolution function, the stiffness reduction is defined independently for tension and compression. The damage parameter represents the percentage of the initial modulus of elasticity remaining when a fictitious crack (or overlapped crack in compression ([13]) is developed up to a certain point. The damage function is inverse to the strain softening curve, and the damage is maximum for the maximum strain. If the model were capable of showing a real crack splitting the continuum, the stiffness would be zero and the damage would be 100%. Cyclic data such as that from Reinhardt and Cornelissen for tension and Sinha et al for compression (see [3]) may be used to calibrate the damage parameter. For the specific approach of this study, the damage parameter is indirectly temperature dependent as can be seen in Figure 4, where the damage evolution fucntions are shown for 20⁰C (red) and 80⁰C (blue).
Figure 4. Compressive Damage
Figure 5. Tensile Damage
391

The tensile damage curves plotted in Figure 5 show how the value that has been adopted for the damage parameter bt, applied to the post-peak branch of the bi-linear model, fits the experimentally based work by [4]
As a final comment regarding Abaqus model, it must be noted that this is a fixed crack model. The cracking direction is stored by the solver and used in subsequent increments and steps ([10]). Therefore, this model cannot account for changes in the principal directions along the loading step in these elements, opposite to the rotating crack models. While this type of cracking seems more realistic (once the crack appears, it does not make physical sense to rotate it), the fixed crack usually produces models that are too stiff ([14]). Besides, there is a shear retention effect that the rotating models do not need to calibrate, since the tension vector at the the crack plane is always normal to it.
2.4. Material model for Steel
None of the steel elements in the model reach the yield stress of the material for the considered thermal and pressure loading combinations. Although primarily the Menegotto-Pinto relationship was obtained in accordance with [1], the numerical solution shows that an elastic model is sufficient. Direct temperature dependency of modulus of elasticity has been neglected in this study.
2.5. Uniaxial Behavior Temperature Dependency
The significant reduction of the compressive and tensile strength of concrete is shown in Figure 6 and Figure 7 respectively, for temperatures of 20⁰C and 80⁰C following the equations in [1] as described in section 2.2.
Figure 6. Compressive Stress-Strain curve. Comparative results for 20º and 80º.
392

Figure 7. Tensile Stress-Strain curve. Comparative results for 20º and 80º.
Figure 6 shows a reduction of in the mean compressive strength of a 18%, while Figure 7 shows a drastic decrease in the maximum tension of a 48%.
3. NUMERICAL MODEL
3.1. Geometrical description
Following the assumptions described in the first section of this study, a wedge is modeled in order to analyze the nonlinear effect of temperature and pressure in a post-tensioned concrete cylindrical tank. The section has been pre-designed analytically to account for post-tensioning instantaneous losses such as friction due to curvature and wedge penetration, as well as long-term losses related to rheological effects in concrete and relaxation of prestressing steel. None of these losses have been considered to be affected by temperature in this study. Tensile stresses are expected at the outer face of the wall so that cracking occurs.
The post-tensioned wall is 500mm wide and it contains a tendon of 27 strands of 0.62” Y1860S7 separated vertically 350mm. The post-tensioning stress considered in the analysis is 775MPa, which corresponds to a post-tensioning at a stress level of the 70% of the tensile strength 1860MPa, with a total loss of the 40% of it. For short tendons with large curvature this is not such an overestimation of losses as it may seem.
The wall also includes passive reinforcement φ25 of in both vertical and circumferential directions, distributed at 150mm and 175mm respectively. This way, the analyzed wedge contains a tendon and two rebars of each kind to capture the three-dimensional effects of the interaction between repetitive sections.
The tendon duct diameter is 125mm, made of structural steel duct 3mm thick. The duct is injected with high strength grout after post-tensioning so that a bonded tendon can be considered. Modeling considerations on this are presented later in this section.
393

Figure 8. Structure geometry description. Cross Section and Wedge Perspective (prior to tendon grout injection).
The schematics in Figure 8 show the cross section of the two-buttress studied tank and the geometry of the post-tensioned representative volume considered in the analysis, including the reinforcement bars as well as the tendon inside the duct.
3.2. Thermal and Pressure Loads and Boundary Conditions
The model loading is divided into two steps: post-tensioning of the tendon and thermal plus pressure concomitant loading.
Post-tensioning is implemented through fictitious thermal cooling of the embedded 1D element hosted by the no-tension transfer solid attached to the tendon duct. Although this methodology has been used for decades, including the tendon as a reinforcement connected to a host allows for an effective reactive component in the model. This way, radial stress is transmitted in a similar manner to what strands contact would transfer to the duct. The no-tension transfer solid produces automatically a discharge arch without stiffening significantly the steel duct. For this reason, the radial tensile forces transmitted by the duct on the back (closer to the outer face of concrete) are only due to fully bonding of the contact pair duct-concrete, i.e., no external load is applied to the duct nodes where the strands would not contact them. This allows also for the deformation of the shape of the duct, which has been found to be critical for the results of this model, since cracking surrounds the duct, relaxing the post-tensioning force. Bond-slip conditions between duct and concrete are within the objectives of further studies on this model.
A steady state solution to the thermo-dynamical problem has been adopted here. If we consider a fixed temperature set on the inner face of the wall as well as a convective boundary condition on the outer face (air flow around the cylinder), after a brief period of time the temperature distribution within the concrete wall thickness becomes linear. Slow loading up to full temperature is considered in this study so that no inertial or transient effect needs to be considered.
It is a key aspect of this study that the differential temperature between the two faces of the wall will produce an increase in the circumferential and vertical compressions in the inner face and the opposite effect, i.e. increase of tension, on the outer wall, which already happens to be the less compressed face by the post-tensioning. One can picture the wall as if split into two centered cylinders, each one
394

of them with half the thickness and a different average uniform temperature. The hottest cylinder (the inner) will expand while the colder (outer) will expand less. To compatibilize these expansions, the inner tube must be compressed from its free expansion, and the outer one must be tensioned to adapt to the pressure received.
Figure 9. Temperature gradient affecting every element in the model. Initial ambient temperature of
20º scaled as zero.
The temperature field as shows in Figure 9 varies linearly in the radial direction, being constant both circumferentially and vertically.
In industrial and energy applications is common that the stored material applies on the inner face of the wall an isostatic pressure the value of which is associated to the temperature. For this reason, both thermal and pressure loads are assumed to increase together. The loading rate has been assumed to be linear and proportional during the loading stage for simplicity. A vertical pressure is also included to account for the vertical resultant on the tank cap.
The model includes boundary conditions in cylindrical coordinates so that the angular displacement is constrained (cyclic symmetry of the model). The top and bottom face are assumed to remain horizontal, which requires the use of a equation constraint of nodes from the top elements, linking the vertical displacement d.o.f. of all of them but one, to that of the excluded node. The effects of this assumption are discussed in the following section.
3.3. Structural pattern
The boundary conditions that will be applied to the wedge model imply the imposition of a three-dimensional solution pattern. This is not unique, and may be a goal of further studies in this model. From a vertical plane cross section, the pattern chosen imposes that the arbitrary cracking occurring in one wedge be symmetrical with the wedge immediately above it. The solution of both wedges together is repeated in a vertical pattern for all the height of the tank that is assumed to be far enough from bottom and cap local effects. The cracking pattern that result from the analysis is presented through mirror and translation in Figure 10 to display the discussed pattern:
395
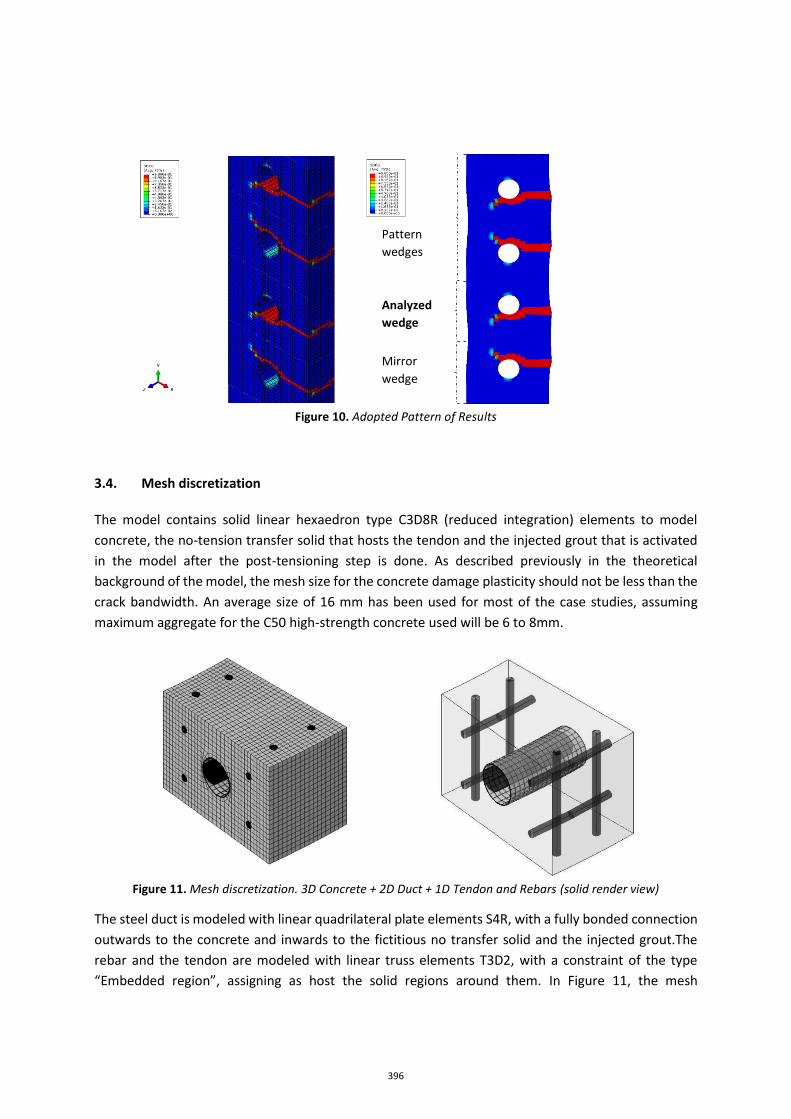
Figure 10. Adopted Pattern of Results
3.4. Mesh discretization
The model contains solid linear hexaedron type C3D8R (reduced integration) elements to model concrete, the no-tension transfer solid that hosts the tendon and the injected grout that is activated in the model after the post-tensioning step is done. As described previously in the theoretical background of the model, the mesh size for the concrete damage plasticity should not be less than the crack bandwidth. An average size of 16 mm has been used for most of the case studies, assuming maximum aggregate for the C50 high-strength concrete used will be 6 to 8mm.
Figure 11. Mesh discretization. 3D Concrete + 2D Duct + 1D Tendon and Rebars (solid render view)
The steel duct is modeled with linear quadrilateral plate elements S4R, with a fully bonded connection outwards to the concrete and inwards to the fictitious no transfer solid and the injected grout.The rebar and the tendon are modeled with linear truss elements T3D2, with a constraint of the type “Embedded region”, assigning as host the solid regions around them. In Figure 11, the mesh
Pattern wedges
Mirror wedge
Analyzed
wedge
396

discretization is displayed for the 3D elements of the concrete region as well as the 2D and 1D elements using the render capabilities of the software.
Special emphasis must be made in the no-tension transfer solid that hosts the tendon (blue region within the duct in Figure 12 below).
Figure 12. Region modeling. No-tension Tendon Host and Injected Grout activated through Model Change
Interaction
This solid allows to host a tendon modeled using truss elements. Therefore, the element will only show axial forces, which is convenient to analyze the post-tensioning force variations. This solid is stiff as the concrete surrounding the duct on the outside, but has no tension strength. For this reason, it can only push the duct inwards during post-tensioning, occupying the space where the strands would be in the real structure. The no-tension condition allows for an automatically distributed normal pressure from the truss element to the duct, and then to the concrete. This space cannot be grouted afterwards in any case, so that when the red part in Figure 12 above appears only occupies the rest of the duct to account for bonded post-tensioning strain compatibility. This way, the tendon is fully reactive to the strains caused by both its own thermal expansion due to heating and the progressively cracked concrete strain field that is caused by the thermal and pressure loading.
4. MAIN RESULTS
The results are presented for the model referenced as W3, the main characteristics of which are described in Table 1 below.
Reference Global Mesh Size
Temperature Dependency
Temperature at inner-outer face (⁰C)
Inner Radial / Vertical Pressure (MPa)
Load Case Tension Stiffening Model
Damage Parameter (bt)
W3 16 mm Temp_Dependent Concrete 80-30 1 / 2
1 load step. Temp+Press simultaneously MC2010 0.75
Table 1. Model description summary
The evolution of the main output variables can be evaluated as the simultaneous action of the thermal gradient and pressure load act simultaneously. The load factor presented indicates the percentage of both the vertical and horizontal applied pressure, as well as the nodal temperature for the whole field. Concomitant linear increase at the same rate is considered for both actions.
397

4.1. Reference Model: W3
Radial Stress at Postensioning (Pa) Circumferential Stress at Postensioning (Pa) Fictitious No-tension Transfer Solid. Radial Stress (Pa)
Figure 13. Postensioning through Embedded Bar within a No-Tension Fictitious Solid Host
Since the host of the tendon does not resist any tension, a discharge arch is generated from the elements where the tendon bar is embedded towards the duct. As seen in Figure 13 (right), this is similar to the stress distribution that strands would produce through contact with the duct without the complexity of introducing material discontinuous material for each of the strands or friction contact for a solid made of steel for which cable axial stress would hardly be possible to identify. As for the post-tensioning effect, circumferential compression is shown in Figure 13 (middle). A stress difference of 5MPa along the thicknedd is displayed, 21MPa in the outer concrete face to 17MPa in the inner face. This means that posttensioning is a 20% less effective when compressing the outer face than expected if design were made considering a uniform pressure distribution. The deformability of the duct achieved by not filling it with any material but that acting as the strands in contact during post-tensioning is partially responsible for this. Figure 14 demonstrates how the duct is able to deform pushing the inner face inwards, which also has a smaller average radius, resulting in a total larger compressive force.
Figure 14. Duct deformation during postensioning. Radial displacement (in m)
As for the damage analysis, a small initiation is found in the vertical direction, on the quadrants of the duct. Because full bond is assumed in this study, the likely slip that would occur as the duct tends to pass from a circle to an oval is reproduced as damage in these models. The evolution of damage is presented in Figure 15, where the combined pressure + temperature field load factor is indicated below each progressive contour plot. No significant cracking occurs until 60% of the thermal and
398

pressure load is reached. Localization of the cracks can be seen, forming two main cracks at the lowest level of the duct and at the middle of the height of the wedge.
Figure 15. Damage evolution with thermal and pressure loading. Crack localization.
4.2. Evolution of results
Figure 16. Vertical displacement and Tendon Stress
The crack localization at 60% of the load can be seen in both plots in Figure 16. The tendon post-tensioning force suffers a drop at first cracking and then another significant stiffness change when the crack is fully developed beneath the duct at 90% of the load. An initial increase in the force is also shown due to expansion in concrete, which elongates the tendon (up to 20% of the loading as seen in Figure 16 on the right). Expansion in steel and cracking end up increasing the post-tensioning force losses an additional 2% that may not have been considered without this type of analysis.
T+P Load Factor:0.62 T+P Load Factor:0.60 Post-tensioning
T+P Load Factor: 1.00 T+P Load Factor:0.63
399
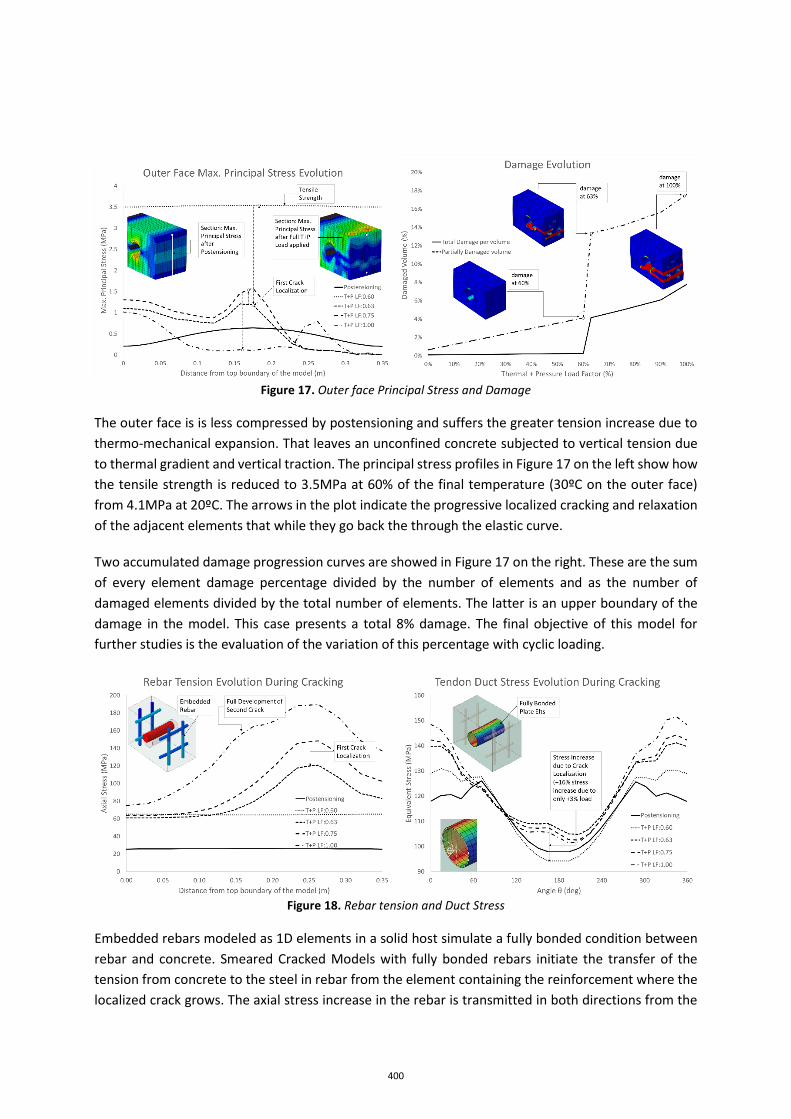
Figure 17. Outer face Principal Stress and Damage
The outer face is is less compressed by postensioning and suffers the greater tension increase due to thermo-mechanical expansion. That leaves an unconfined concrete subjected to vertical tension due to thermal gradient and vertical traction. The principal stress profiles in Figure 17 on the left show how the tensile strength is reduced to 3.5MPa at 60% of the final temperature (30ºC on the outer face) from 4.1MPa at 20ºC. The arrows in the plot indicate the progressive localized cracking and relaxation of the adjacent elements that while they go back the through the elastic curve.
Two accumulated damage progression curves are showed in Figure 17 on the right. These are the sum of every element damage percentage divided by the number of elements and as the number of damaged elements divided by the total number of elements. The latter is an upper boundary of the damage in the model. This case presents a total 8% damage. The final objective of this model for further studies is the evaluation of the variation of this percentage with cyclic loading.
Figure 18. Rebar tension and Duct Stress
Embedded rebars modeled as 1D elements in a solid host simulate a fully bonded condition between rebar and concrete. Smeared Cracked Models with fully bonded rebars initiate the transfer of the tension from concrete to the steel in rebar from the element containing the reinforcement where the localized crack grows. The axial stress increase in the rebar is transmitted in both directions from the
400

crack, producing an elongation of the steel element. Since nodes are attached to the host element in the embedded formulation, the bar expands the concrete element where it is hosted to making it fail through smeared cracking. This concept is different to that of a bond-slip model, where the nodes of the hosted bar can separate from the originals nodes in the solid host. However, the global results are similar in these cases where the reinforcement stress level is still below from its yield stress. In a similar manner, the tendon steel duct nodes are attached to concrete, and the loss of bond is reproduced by degradation of the concrete material elements in contact with them. The duct stress gap seen in Figure 18 right, curves for 60% and 63% of the load show an increase of 16% with only +3% of the load, reproducing the transfer of stress from the concrete to the steel. Figure 18 left show the tensile stress evolution on the indicated rebar. Comparing damage plots at 100% of the thermo-mechanical load in Figure 15 and Figure 17, and the 100% rebar stress curve in Figure 18 helps understanding the stress increase due to the development of the second localized crack. The associated effect in concrete is displayed in Figure 19, where the deformed mesh indicates the sewing effect of the rebar in the main crack and the debonding of the duct.
Figure 19. Damage around embedded rebar
5. CONCLUSIONS
The model developed attempts to simulate the behavior of post-tensioned concrete including temperature dependency from two perspectives: the temperature dependent nonlinear fracture mechanics applied to concrete and the coupled thermo-mechanical action in the reactive tendon stress to the progressively cracked strain field. It also accounts for thermal expansion of the tendon and rebar.
The introduction of the duct and a no-tension transfer solid to host the tendon allows for the deformation of the duct while modeling the tendon itself. The latter activation of the injected grout ensures the bonded behavior of the strands.
It has been shown that the dependency of the strength, the stiffness and both the crushing and fracture energy should be taken into account in order to capture the actual losses in the tendon stress, which may result in a loss of confinement that will increase cracking. Consequently, the loss of stiffness will alter the mechanical expansion producing an impredictable strain field that may result in both a siginificant increase or decrease in the prestressing force.
The material temperaturte dependent properties however should be calibrated for the specific concrete, since the literature contains contradictory experimental data regarding this, specially for high strength and high performance concrete.
401
Further studies shall be focussed in analyzing cyclic thermal loading. It is expected that during the concomitant pressure and temperrature unloading process, confinement may vary significantly around already formed cracks, producing crack growth or even compressive crushing.
BIBLIOGRAPHY
[1] Fib, Model code 2010 Vol.1. 2012.
[2] J. V. Carstensen, “Material modelling of reinforced concrete at elevated temperatures,” Technical University of Denmark, 2011.
[3] V. Birtel and P. Mark, “Parameterised Finite Element Modelling of RC Beam Shear Failure,” in 2006 ABAQUS Users’ Conference, 2006, pp. 95–108.
[4] T. Jankowiak and T. Lodygowski, “Identification of parameters of concrete damage plasticity constitutive model,” Found. Civ. Environ. …, no. 6, pp. 53–69, 2005.
[5] E. Thorenfeldt, A. Tomaszewics, and J. J. Jensen, “Mechanical properties of high-strength concrete and applications in design,” in Proc. Symp. Utilization of High-Strength Concrete (Stavanger, Norway), 1987.
[6] “Diana Finite Element Analysis User’s Manual 9.6.” TNO DIANA BV, 2014.
[7] Rijkswaterstaat. Ministerie van Infrastructuur en Milieu, “Guidelines for Nonlinear Finite Element Analysis of Concrete Structures Scope,” 2012.
[8] W. B. Krätzig and R. Pölling, “An elasto-plastic damage model for reinforced concrete with minimum number of material parameters,” Comput. Struct., vol. 82, pp. 1201–1215, 2004.
[9] D. a. Hordijk, “Tensile and tensile fatigue behaviour of concrete; experiments, modelling and analyses,” Heron, vol. 37. pp. 1–79, 1992.
[10] D. Systemes, “Abaqus Theory Guide 6.14.” Dassault Systemes, 2014.
[11] Z. P. Bažant, “Analysis of Work-of-Fracture Method for Measuring Fracture Energy of Concrete,” Journal of Engineering Mechanics, vol. 122, no. 2. pp. 138–144, 1996.
[12] H. Cifuentes Bulté and F. Medina Encina, Mecánica de la fractura aplicada al hormigón. 2014.
[13] M. Paggi, M. Corrado, G. Mancini, and a. Carpinteri, “The overlapping crack model for uniaxial and eccentric concrete compression tests,” Mag. Concr. Res., vol. 61, no. 9, pp. 745–757, 2009.
[14] U. Häussler-Combe, Computational Methods for Reinforced Concrete Structures. 2015.
402