modelling of safety measure effects and risk compensation
TRANSCRIPT
Accid. Anal. & Prev. Vol. 25, No. 3, pp. 277-288, 1993 Printed in the U.S.A.
oool-4575/93 $6.00 + .Oo 0 1993 Pergamon Press Ltd.
MODELLIN~ OF SAETY MEASURE EFFECTS AND RISK COMPENSATION
GEOFFREYUNDERWOOD,C.JIANG, andC.1. HOWARTH
Accident Research Unit, Department of Psychology, University of Nottingham, Nottingham, NG7 2RD, U.K.
(Received 15 April I99 I ; in revisedform I5 h4arch 1992)
Abstract-A model is proposed for the deception of effects of safety measures intr~uced into a road transport system. The model explains the motives of road users’ risk nomination towards the measures, and indicates when behavioural adaptation is likely to take place and its effects on road safety programmes. At its core the model has the notion that when a transport system is changed by engineering safety measures, road users do not respond only in the direction towards safety improvement but respond, in general, with three possible ways of behavioural adaptations, one of them towards more risk taking. Supported by illustrative examples, it also sug- gests that due to risk compensation, engineering safety measures alone are usually not sufficient, and, hopefully,
us chances to modify road users’ behaviour to make carefully designed motivational safety measures can give trafFrc safer.
1. INTRODtrCTION
One of the priority needs of road safety is to assess the safety programmes and countermeasures developed: Effective assessment of the effects of safety measures depends on a knowledge of road users’ behavioural changes that occur following the introduction of pro- grammes. This knowledge can be best achieved through a theoretical model that will explain behav- iour. A recommen~tion has been provided by an OECD report ( 1990) as a concrete suggestion for road safety administrators, programme planners, and re- searchers:
There is a need for further development of theories of road user behaviour to assist in the understanding and pre- diction of behavioural adaptation. At the same time there is a need for those conducting evaluations of road safety pro- grammes to incorporate theory testing in their research to provide a basis for the development of theory. (p. 117)
It is clear that the development of such a model should result in improvements in road safety pro- grammes and in the research designed to evaluate them. It is the purpose of the present paper to intro- duce a model to explain risk com~n~tion and the effects of safety measures. The model has at its core the notion that when a transport system is changed by engineering safety measures, road users do not re- spond only in the direction towards safety improve- ment but respond, in general, with three possible ways of behavioural adaptations, one of them to- wards more risk taking.
277
The model explains the motives for the behav- iour changes, and indicates when ~havioum1 adap- tation is likely to take place and its effects on road safety programmes. Supported by illustrative exam- ples, it also suggests that due to risk compensation, engineering safety measures alone are usually not suf- ficient, and, hopefully, carefully designed motiva- tional safety measures can give us chances to modify road users’ behaviour to make traffic safer. In the long term, positive and sustained benefits can be expected, as a better understanding of the mechanism of risk compensation leads to a better formulation and im- plementation of safety measures.
2. BRIEF REVIEW OF THEORETICAL MODELS
In the last 10 or so years, there has been a tre- mendous attempt to understand human behavioural change towards risk and its link to traffic accidents. A number of different models aimed at unde~tan~ng and reducing the effects of risk compensation have been developed (OECD report 1990). Among them, the following ones have received great attention.
Klebelsberg’s model distinguishes between ob- jective and subjective safety (Klebelsberg 1977). It shows that safety increases on the behaviour level when objective safety increases, without subjective safety increasing to the same extent.
NUtPnen and Summala’s model can be re- garded as a relatively comprehensive cognitive struc- ture-model of driver behaviour (N%tHnen and Sum-

278 G. UNDERWOOD etal.
mala 1974). It describes the cognitive process by means of several constructs that are controlled by the action caused by stimulation in a situation.
Wilde’s model (Wilde 1982, 1988) formulates the “principle of preservation of the accident rate” as follows: “The number of accidents in a certain coun- try depends solely on the accident rate which the pop- ulation is prepared to tolerate and not on the mea- sures taken in the other areas of this control system, at least not over a longer period of time”. It expects the estimated and the accepted risks to retain their equilibrium through risk homeostasis. This model has attracted controversy from a number of different directions. A basic question is: to what extent can the- ories of equilibrium be used as an adequate basis for the problem in question? In addition, after a theoret- ical analysis of the theory of risk homeostasis, it was concluded: “There is no reason why exact homeosta- sis should be expected to occur as a response of road users to safety hardware improvements: partial com- pensation seems to be the rule instead” (Janssen and Tenkink 1987). The debate over the model is, so far, inconclusive.
Evans’s model {Evans 1985a,b) provides a for- malism for human behavior feedback. The term feed- back is chosen to supersede such terms as danger compensation because feedback can, in principle, be of either sign and of any magnitude. It is also pro- posed that the actual safety benefit is not necessarily identical to the engineering change. But this model is not an explanatory behavioural model and makes no attempt to account in detail for the behaviour.
O’Neill bases his decision-theory model of dan- ger compensation on the assumption that the driver (i) cannot be considered constant with regard to his driving behaviour and (ii) adapts his driving behav- iour to changes in the surroundings as a tendency to danger compensation (O’Neill 1977). He derives the “compensation*’ from the invariable aims of the driver who-assuming he acts “rationally’‘-tries to maximize the benefit of the action. During the deci- sion processes necessary for this. the wish to avoid ac- cidents also appears. O’Neill assumes that the driver can correctly assess the situation and his own action. From this O’Neill concludes that, as far as the reac- tion of rationally oriented drivers is concerned, safety measures can do harm instead of help and that danger compensation must be taken into account before safety measures are introduced. However, it is not certain as to how “rational” should be understood in this context and how far the driver can estimated to be a rationally acting entity. The assumption that the driver can adequately judge the accident probability of each of his actions is also uncertain. In addition, there is no description of an individual process such as reaction to the introduction of safety measures.
Janssen and Tenkink ( 1987, 1988) are con- cerned with cost-benefit assessments among road users in their utility model. They describe risk taking as a consequence of utility maximization. Reasons for making a trip are found in the sphere of utility maximization, in which accident risk is considered to be only one of the relevant components. Presumably the road user must find a balance among these com- ponents to achieve a total cost for the trip that is min- imal. Thus, the risk level obtaining after a change will depend on the structure of the total utility function: it is a product of a utility-maximizing process rather than an independent control variable. It is also argued that risk compensation need not be complete.
Although the above models have led to a better understanding of the effects of risk compensation, there is still a need for a more detailed description of the compensatory process and the explanation of be- havioural motivation. The purpose of this paper is to strive towards these goals for the quantitative mod- elling of effects of risk compensation.
3. DEVELOPMENT OF THE MODEL
Risk compensation is defined here with a refer- ence to the definition of behavioural adaptation in the OECD report ( 1990, p. 14). It is defined as those be- haviours that may occur following the risk changes to the road-vehicle-user system and that were not in- tended by the initiators of the changes. It creates a continuum of effects ranging from a positive increase in safety to a decrease in safety.
Our model is based on the following assumption, which is adopted from O’Neill’s ( 1977) decision the- ory and Janssen and Tenkink’s (1987) utility model: the aim of road users in making a trip is to maximize the benefit of the action; risk compensation occurs as road users respond to changes in the system such that their personal needs are achieved as a result.
Nevertheless, we criticize O’Neill’s assumption that the driver can adequately judge the accident probability of each of his actions; we believe that this claim is unneces~~ly strong on theoretical grounds and is unsup~~ed by empirical data.
To try to explain the phenomena described by these authors we use a different cost-benefit analysis model, which can provide a more detailed description and explanation of a compensatory process as reac- tion to the introduction of safety measures.
To examine the effects of safety measures on road users’ behavior, we need to analyse users’ moti- vations first. The very basis of the human behaviour in a transport system, just as anywhere else, is moti- vational. The road users’ principal motive is usually reaching their destination. They do not want to use more time than necessary, and they try to avoid any

Modelling of safety measure effects 279
extra effort in their driving. They also want to satisfy their other needs set for their trip. Here the basic no- tion is that the users treat safety as one of a number of goals. They are not just trying to maximize safety, but trying to maximize a more general utility func- tion in which safety, saving time, extra motives, driv- ing pleasure, etc., are all competing motives. Thus, what the users actually do involves trade-offs in their traffic goals.
For the convenience of modelling the trade-offs, all of the users’ needs except safety can be represented by a measure of benefit denoted by Bin the following equations. Usually, the more benefit demanded, the more risk involved. Typically, extra needs, such as time saving, push drivers towards faster and more hazardous driving, thus facing a higher probability of accident occurrence. Roughly representing this trend, we can have the following curve shown in Fig. 1 for the relationship between the wanted benefit E and the accident risk, which is measured by the prob- ability of occurrence of an accident and is denoted as P.
Taking accident probability P into account, the users’ target benefit B can only be achieved with un- certainty. If we denote expected benefit as B,, we have
B,= BX(1 -P). (1)
This equation shows that the expected benefit B, first increases steadily as risk P increases and then falls down beyond its maximum point at the risk level of 0.5. When P = 1, there will be no expected benefit, i.e. E, = 0 (see Fig. 1).
On the other hand, the users’ need for traffic safety can be measured by their target levels of aver- age accident cost, which contains the information of
Benefit
both road accident frequency and severity thus pro- viding a good indicator for safety need. Cost in this sense is not just a financial cost, but should be seen as the opposite of the benefit if adopting a particular driving style. If we denote the average cost by C,, then at a particular level of risk P, we will have an expected accident cost C,,
c, = c, x P. (2)
Usually, as more safety is demanded, the lower will be the expected accident cost required (see Fig. 2).
To compare 3, B, and C,, we can put their curves into one figure as shown in Fig. 3. It is noticeable that, within a range of risk, modern transport systems and safety programmes make it possible for people to ob- tain an amount of net gain {denoted as G) from the difference between the expected benefit and the ex- pected accident cost,
G = B, - C,
=BX(l-P)-CaxP. (3)
The resulting net gain curve is shown in Fig 4.
c0 I a . . . . . . ./ .,.,. . . . .,. . . . . . . . . .
Li4G-b Fig. 2. The relationship between expected accident cost C, and ac-
cident risk R.
B
Benefit cost
Fig. I. The relationship between the drivers’ overall benefit Band accident risk P can be represented by a linear function, as a first approximation. The expected benefit curve B, first goes up steadily and then falls down beyond its maximum point at the risk level
of 0.5.
0 0.5 1 P-
Fig. 3. The benefit curve and expected accident cost curve are ap- proximately straight lines going up as risk P increases. The ex- pected benefit curve first goes up and then goes down toward zero.

G.UNDERWOOD etal.
max
b 1 P
Fig. 4. The net gain curve is obtained when B, curve in Fig. 3 is reduced by subtraction of C, curve. The curve first goes up steadily and then falls down sharply beyond its maximum point at the risk level of P*, since beyond the P* point, B, declines rapidly as C,
continues to increase.
The marginal gain (MG) curve shown in Fig. 5 is above a certain level of risk as shown in Figs. 6-8. In derived from the net gain curve in Fig. 4, which in- the figures, P* denotes the risk level at which the net dicates by how many units G is increased when a unit gain has its maximum value, and P’ denotes the risk of P is increased. It is easy to see that the marginal at which the marginal gain has its maximum value. In gain curve goes down as risk P increases. the emergency situations, users may take a risk be-
In the situations when benefit curve, expected benefit curve, expected cost curve, and net gain curve appear like the ones shown in Fig. 3 and Fig. 4, we see that the road users are likely to take a risk between P = 0 and P = P* to pursue the maximum net gain or the maximum margin gain or as a trade-off between the two. Here P* is the risk level at which the users obtain the maximum net gain.
A G I
max
However, there are other situations in which users’ benefit, net gain, and margin gain increase enormously above a certain level of risk. For exam- ple, sometimes people drive faster to catch an air- plane, or to send a dying person to hospital in an emergency. Without involving the risk of high speed driving, the airplane may be missed or the patient may die. In these special cases, the users’ benefit, net gain, and margin gain curves go up tremendously
Fig. 7. In the situations when the users’ expected benefit increases enormously above a certain level of risk and expected cost remains the same, users’ net gain also increases enormously above a certain level of risk. (As elsewhere, G = net gain, and P = the risk level
at which the net gain has its maximum value.)
Fig. 5. The marginal gain curve goes down as risk P increases
Ce
0 0.5 1- P
Fig. 6. In some situations the users’ benefit and expected benefit increase enormously above a certain level of risk. (As elsewhere, B= target benefit, B, = expected benefit, C, = expected cost, and
P = accident risk).
max
Fig. 8. The users’ marginal gain curve derived from the net gain curve in Fig. 7 also increases enormously above a certain level of risk and then declines rapidly as risk continues to increase- (MC = marginal gain, P' = the risk level at which the marginal gain gets
its maximum value.)

Modelling of safety measure effects 281
Here, we just give two examples to explain why road users take risks and even sometimes relatively high risks, The actual shapes of the benefit curve, cost curve, net gain curve, and margin gain curve are not necessarily the same as those shown in Figs. 3-8. In fact, there may be many different shapes of curves for different users, and, furthermore, the same user may have different curves in different situations. But the main results of the analysis given above remain the same:
1.
2.
3.
In
In transport systems, the users are not just try- ing to maximize safety. Instead, they are try- ing to maximize the net gain, which is a trade-
The maximum net gain can only be obtained at a risk level above zero.
off among a number of goals.
Below this level, normally the more risk taken, the greater will be the benefit obtained,
some extreme situations, the user may take a
tween P = P’ and P = P* that is higher than the ones chosen in normal situations.
risk far big8er than P*. If driving fast is subjectively a matter of life or death, people will take a risk to the extent of driving as fast as possible to obtain this ex- treme benefit.
4. THE EFFECTS OF ENGINEERING SAFETY MEASURES
To improve road safety, many measures have been introduced into the transport system. For con- ceptual convenience, these measures can be divided into two categories:
1. Engineering measures, which change the physical safety conditions;
2. Motivational measures, which change the road users’ motives and behaviour rather than changing physical conditions to im- prove safety.
We are going to examine the effects of engineer- ing measures first. The main effects of engineering measures can be viewed as two kinds:
I. Those that act to reduce the number of road accidents, i.e. reduce the probability of acci- dent occurrence.
2. Those that, when an accident occurs, act to reduce the severity ofthe accident, i.e. reduce average cost of the accidents.
Effect 1 will not change the expected cost curve in our mode& but it will change accident probability,
When the probability of accident occurrence is reduced, the users will obtain the same amount of benefit at a relatively lower level of risk, as shown in Fig. 9.
If we look at the risk level of P”, we find that at this same level of risk, the benefit has been increased from B,(P”) to B,(P”) due to effect 1. This is equiva- lent to an effect of moving the benefit curve upwards, as shown in Fig. 10.
As the influence of effect 1 increases, the net gain curve will move upwards again and again as shown in Fig. 12. As a result, more net gain can be obtained than before at the same level of risk.
The increase of benefit B will lead to the increase of expected benefit. When the expected benefit is in- creased and the expected cost remains the same, the net gain will be increased too, as shown in Fig. 11.
In contrast to effect 1 on accident probability, ef- fect 2 on accident severity will not change the benefit B curve and expected benefit B, curve, since both of them are only the functions of accident probability (see Fig. 1). However, effect 2 changes the average
Fig. 9. When the probability of accident occurrence is reduced by effect I, road users will obtain the same amount of benefit at a rel-
atively lower level of risk, i.e. &(P”) = &(P’).
P’ P
Fig. IO. Effect 1 moves the benefit curve upwards. As the objective probability of an accident decreases, the benefit to a road usex
increases.

282 G. UNDERWOOD et al.
Benefit Benefit
/
B2 cost
G2
0 0.5 1 P 0.5 t P
Before increase After increase
Fig. I I. The increase of benefit B leads to the increase of expected benefit B,. When expected benefit is increased and expected cost Ce remains the same, the net gain G (shown by dark region) will be increased,
too. (Subscripts I and 2 denote the states of the variables before and after the measures are introduced.)
cost of accidents, which is a function of accident se- verity. When the average cost is reduced by effect 2, for example, from CX, to Caz (C*, > CJ, the expected cost wiil be reduced from C, = C,, X P to Ce2 = C,? X P (see eqn 2). Then the expected cost curve will be pushed down due to cutting of the cost, as shown in Fig. 13. The decrease of expected cost will turn a greater portion of the expected benefit into net gain (see Fig. 13 and Fig. 14).
As the average cost of accidents gets lower and lower, effect 2 is likely to have more influence on the increase of net gain than does effect 1 (compare Fig. 14 with Fig. 12).
5. RISK COMPENSATION TOWARDS THE EFFECTS OF ENGINEERING
MEASURES
Human risk compensation behaviour against the effects of safety measures can also be examined by
G
Fig. 12. As the influence of effect 1 increases, the net gain curve moves upwards again and again, from G, to Gz then to G3. As a result, more and more net gain can be obtained at the same level of
risk than before, i.e. G,(P’) > G,(P’) 3;- G&P’).
means of the model. Presented above are descriptions of ~havioural responses to safety measures by which we can start to examine the behavioural phenomenon of risk compensation in relation to the costs and ben- efits associated with risk.
First, let us look at the compensation towards ef- fect 2 in which accident severity is decreased. When there is a reduction of accident cost leading to an in- crease of net gain, the users will face three choices, as shown in Fig. 15.
These choices are:
1. Enjoy the same amount of net gain as G, as before, but at a new lower level of risk Pz com-
Benefit cost t
~
I/ C@l
” ;~~~;_.. i:
~~ ) ce2
.::. j ;::.. :,, ‘: E3e
0 0.5 1 P
Fig. 13. The introduction ofeffect 2 pushes down the expected cost curve by cutting the average accident cost. Be = expected benefit, which is not changed by effect 2. Ce, = the expected cost before introduction of effect 2, Cez = the expected cost after introduction of effect 2, Ce, > Ce2. The region marked by dense dots indicates the net gain before introduction of effect 2, the region marked by
dots indicates the net gain after introduction of effect 2.

Modelling of safety measure effects 283
means that these measures can be used to serve the other goals of users instead of improving safety.
We can examine the risk compensation towards effect 1 of the engineering measures in the same way, as shown in Fig. 16. In this case accident probability is decreased, but there are still three possible out- comes, and two of them lead to a failure in the at- tempt to improve safety.
The following factors may influence the direc- tion or magnitude of risk compensation towards en- gineering measures (How~h 1987). These effects can also be predicted by the model.
b 1 P
Fig. 1.5. Risk compensation in response to effect 2. When the re- duction of accident cost leads to an increase of net gain, road users have three choices of reactions shown by arrows in the figure. G, = the net gain before the introduction of effect 2, PI = the risk asso- ciated with the net gain Gr. Pz = the smaller risk associated with the net gain G, after the intr~uction of effect 2. G2 = the greater net gain obtained at the risk level of P, atIer the intr~uction of ef- fect 2. Gr = the even greater net gain obtained at a higher risk level of P3 by behavioural change after me introduction of effect 2,
Fig. 14. The reduction of expected cost turns a greater portion of expected benefit into net gain. The region G,, marked by dense dots, indicates the net gain before introduction of effect 2; the re- gion Gz, marked by dots indicates the net gain after introduction of
effect 2, G2 > G,.
1. Factors that could reduce the safety benejts of a measure: (a) High conspicuity of the safety measures
associated with highly obvious safety ben- efit
This factor may make the users over- estimate the safety benefit provided by the measure and make them believe that either probability of accident occurrence or severity of accidents or both could be reduced significantly by the measure. Then they will try to pursue a bigger net gain at a higher level of risk, which has been underestimated due to misleading information. The consequence of this wrong judgement can be quite harmful as shown in the case studies that we will dis- cuss later (case l), as users’ over-compen- satory behaviour could seriously damage the safety function of the measure and
G t G2 63 pared with the previous level of P,. This is the expected or desired effect to be introduced by the engineering measures.
2. Take the same level of risk P, as before but enjoy an increased amount of net gain of Gp
3. Take the new op~~unity of gaining more at the point of G, while facing a higher risk of PS.
When users select the second or the third choices, for example when they increase speed, or concentrate more on other things when driving, or drive in more severe weather, etc., we will see the fail- ure of a sahety improvement supposed to be provided by the engineering measures. But this should not be seen as the total failure of the measures, it simply
~~~.
P2 Pl P3 P
Fig. 16. Risk compensation towards effect I of the engineering measures. When the reduction of accident probability leads to an increase of net gain, road users have three possible choices of re- actions shown by arrows in the figure, and two of them lead to a failure in the attempt to improve safety. G, = the net gain before the introduction of effect 1, Pr = the risk associated with the net gain G,. Pz = the smaller risk associated with the net gain G, after the introduction of effect 1. Gz = the greater net gain obtained at the risk level of P, after the introduction of effect I. G, = the even greater net gain obtained at a higher risk level of Px by behaviowal
change after the introduction of effect I, P3 > PI > Pr.

284 G. UNDERWOOD et al.
sometimes may even result in a* effect opposite to that intended. High /eve1 o~-~ubl~eity~or the safety ben- efit
Publicity has the same effect as con- spicuity in that the road user is made aware of the measure and its benefits in both cases.
2. Factors that coked reduce the likelihood of risk CornRe~sut~o~ (4 Lo*~cons~ic~ity of the measures
In this case, the users have little knowledge about the safety measures in- stalled. Therefore, there is little chance for them to shape their risk compensatory behaviour towards the effects of the mea- sures. Some safety devices such as stud- ded tyres are not as easy to detect as oth- ers such as seat belts or helmets. As long as their safety effects are not fully recog- nized, these devices will be free or par- tially free from risk compensation. An ex- ample of this case will be examined later in case 5.
(b) Low or zero ~ub~icityfor the measures This will have the same effect as low
conspicuity. In both cases the road users will be less aware of the changes and so less likely to modify their behaviour.
The findings here, of several possible outcomes of an engineering safety mea- sure do not, in any general way, imply that engineering safety measures are usu- ally ineffective. What they do imply is that such measures can serve different purposes, that is, their safety effects may be traded for other benefits. Hence, engi- neering measures alone cannot guarantee safety improvement, and the human re- actions to the measures may be of the ut- most importance. The direction and magnitude of such compensation will de- pend on the specific safety change and users’ attitude under consideration. Ide- ally, these factors should be known em- pirically. Unfortunately, for innovative safety measures, such empirically deter- mined info~ation is inherently unavail- able. Then, one must resort to reason, sometimes analogy with prior compara- ble measures, and judgement. The model presented here provides a tool for this purpose, and with it the potential effec- tiveness of a safety change may be esti-
mated together with the clearly stated human interactive effects.
6. THE EFFECTS OF MOTIVATIONAL MEASURES ON RISK COMPENSATION
In transport systems, each individual has his own motives and attitudes towards risk. Some users think safety first, and some put their other needs ahead of safety. The conflict of road users’ interests in the sys- tem, like conflicts in other areas, cannot be compro- mised by engineering solutions alone. If someone’s exchange of safety for other needs goes too far beyond public tolerance, some safety limits or restraints have to be introduced by legal actions to defend the inter- ests of the public as a whole.
In contrast to the engineering measures, moti- vational measures such as education and traffic laws cannot be traded. They are specifically designed for shaping habitual and well-practised safety behaviour of the kind that can be carried out in a relatively au- tomatic manner to reduce risk taking. By introducing a framework of rewards and punishment, they can also prevent the possibility of risk compensation towards engineering safety measures.
The motivational safety measures such as speed limits indeed broke the corn~n~to~ loop. They set up clear environment markers, indicating that more care should be given in certain areas for safety pur- pose, and hence caused a major ~fety-promoting change in driver behaviour and made it possible for enginee~ng measures to show safety benefits.
What distinguishes motivational measures from engineering measures is that they leave no alterna- tives for human reactions other than a reduction of risk taking. The only direction they allow the users to move towards is safer behaviour as shown in Fig. 22, rather than up to three possible directions allowed by engineering measures, as we have seen in Fig. 15 and Fig. 16. In this way, motivational measures leave no room for risk compensation, and the users have to give up some other benefits for safety purposes.
This can be seen as the most distinguished ad- vantage of motivational measures over engineering measures. Carefully designed motivational safety measures can provide more direct and significant ef- fects on road safety compared with engineering mea- sures, and in many cases, they can also help engineer- ing measures to perform an expected safety function more effectively by ensuring that the latter cannot be used for other purposes. This gives us the chance to modify users’ motivational structures to make traffic safer.
The following factors may influence the intro-
Modelling of safety measure effects 285
duction of motivational measures to prevent the neg- ative effects of risk compensation.
I. Low conspicuity for the compensatory behaviour Low conspicuity for the compensatory behav-
iour may lead to inadequate legal actions to introduce motivational safety measures against risk compensa- tion, as the scale and consequence of the risk com- pensation are not fully recognized. This situation makes it quite difficult to design motivational mea- sures that can fully cope with aimed compensation so as to allow safety devices to work effectively.
2. Slow or delayedfeedback of the consequences of the compensatory behaviour
Slow or delayed feedback means that the conse- quences of the compensatory behaviour can come to light only after a certain period of time, during which no legal actions are likely to be taken to introduce any motivational safety measures. Therefore, safety de- vices installed will suffer from the negative effects caused by risk compensation until the period is over.
3. Social approval, or at least lack of disapproval, for the compensatory behaviour
In this case, it is impossible or quite difficult for an effective motivational measure to be introduced, either because of inadequate public awareness of the negative effects of the behaviour or because a certain amount of safety will be lost in trade-offs for other benefits. No safety improvement can be seen unless public opinion is changed, otherwise compensatory behaviour can cause intolerable troubles.
7. ILLUSTRATIVE CASE STUDIES OF SAFETY MEASURES
We are now going to examine some actual effects of safety measures which have been introduced in the last 20 years. Six cases reported in the literature will be examined through the model, and the outcomes of the studies will be characterized as belonging to direc- tions and ranges of risk compensation rather than to specific values.
Case I: A safety measure which increased accident frequency and accident severity
The outcome of the first case was perverse rela- tive to the intention-the safety measure in fact led to decreases in safety. Asogwa ( 1980) investigated motorcyclist fatalities in Anabra State, Nigeria, be- fore and after the introduction of a law mandating the wearing of helmets. Despite high wearing rate (96%), a substantial increase in both fatality rate ( 17 1%) and
injury rate (55%) occurred in a two-year period after the legislation, compared with a two-year period be- fore the legislation.
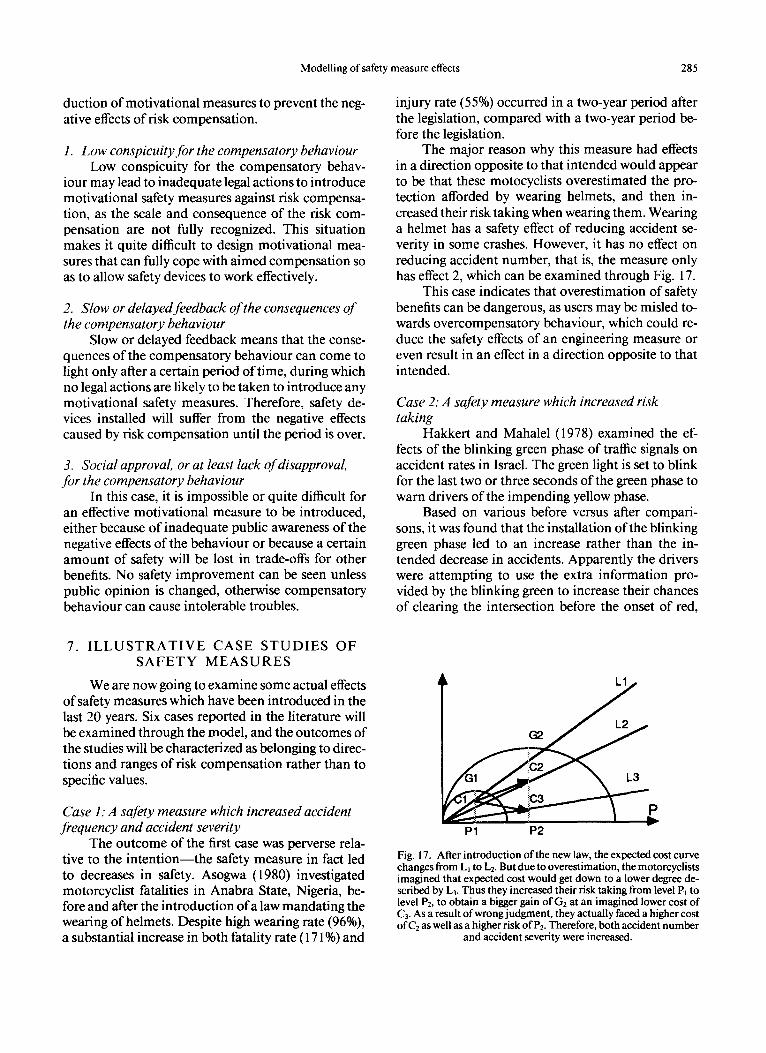
The major reason why this measure had effects in a direction opposite to that intended would appear to be that these motocyclists overestimated the pro- tection afforded by wearing helmets, and then in- creased their risk taking when wearing them. Wearing a helmet has a safety effect of reducing accident se- verity in some crashes. However, it has no effect on reducing accident number, that is, the measure only has effect 2, which can be examined through Fig. 17.
This case indicates that overestimation of safety benefits can be dangerous, as users may be misled to- wards overcompensatory behaviour, which could re- duce the safety effects of an engineering measure or even result in an effect in a direction opposite to that intended.
Case 2: A safety measure which increased risk taking
Hakkert and Mahalel (1978) examined the ef- fects of the blinking green phase of traffic signals on accident rates in Israel. The green light is set to blink for the last two or three seconds of the green phase to warn drivers of the impending yellow phase.
Based on various before versus after compari- sons, it was found that the installation of the blinking green phase led to an increase rather than the in- tended decrease in accidents. Apparently the drivers were attempting to use the extra information pro- vided by the blinking green to increase their chances of clearing the intersection before the onset of red,
Fig. 17. After introduction of the new law, the expected cost curve changes from L, to Lz. But due to overestimation, the motorcyclists imagined that expected cost would get down to a lower degree de- scribed by L,. Thus they increased their risk taking from level PI to level P2, to obtain a bigger gain of Gz at an imagined lower cost of C3. As a result of wrong judgment, they actually faced a higher cost of C2 as well as a higher risk of P2. Therefore, both accident number
and accident severity were increased.

286 G. UNDERWOOD et al.
than to increase their chances of a safe pass as intended.
It is clear that the main intended effect of the measure is effect 1, that is, reducing the number ofac- cidents, and the drivers were supposed to reduce their risk taking (see Fig. 18).
Case 3: Skill, risk taking and accident rates Williams and O’Neill (1974) compared driving
records of America National Competition license holders with the records of other drivers of the same age and sex. The results show that the race drivers had a greater number of crashes and speeding violations per driver than did the drivers composing the matched comparison group. In other words, higher accident involvement rates were found to be associ- ated with a presumably higher level of driving skill.
It is possible that individuals gravitating to sports cars would desire higher-than-average risk taking. Thus, their acquisition of advanced driving skills en- couraged an increase in risk taking rather than an im- provement in safety. In this case, a higher level of driving ski11 has both effect 1 and effect 2, but still can- not result in any safety benefit, simply because the high skill drivers did not want to do so. The direction of compensation is indicated by the arrow in Fig. 18 in a similar way as in the last case.
Cuse 4: A s&y measure which increased risk taking
Adams (1982) examined the efficacy of manda- tory seat-belt laws by comparing the fatality time se- ries of 13 countries that enacted a mandatory seat- belt law with four countries that enacted no such law.
Fig. 18. The intended effect of a blinking green signal was to reduce the number of accidents, and the drivers were supposed to move from point G, towards the safer region on the left, that is, reduce risk taking. But the actual situation was that, instead of increasing their safety, the drivers tried to save more time by taking extra chances when clearing junctions. Their desire of pursuing more benefit shown by G2 led them to a higher risk taking of Pg, that is. moving towards the right region. As a result, the number of acci-
dents increased.
He concluded that no reduction in fatalities coin- cided with the introduction of the law and explained this by claiming that as a result of being compelled to wear seat belts, drivers increased their risk taking.
Let us examine the effect using the model. There is evidence from engineering tests that use of a seat belt does reduce the probabilities of fatality and seri- ous injury in some crashes, that is, it has effect 2, re- ducing the severity of accidents. Thus after introduc- tion of a seat-belt law, the expected cost curve should change in the direction shown in Fig. 19.
When drivers were aware of this, they increased risk taking from P, to Pz, hoping to obtain a bigger gain of G, at a lower cost of C?. The actual outcome of the law resulted from two effects. one from seat- belt use, another from drivers’ compensatory behav- iour. The first reduced the proportion of fatal acci- dents, the second increased the total number of the accidents. The combined effects of the two led to a constant rate of fatality.
Case 5: A succrs~ful sujtity meusure Rumar et al. (1976) measured speeds main-
tained by Swedish drivers using studded or unstudded tyres under actual motorway conditions. Results showed that cars with studded tyres were driven faster, but that the overall margin of safety was still greater for these vehicles than for cars with unstudded tyres. Cars with studded tyres were less likely to skid than those without, but not as much less as the in- creased friction of the studded tyres alone would indicate.
Studded tyres have both effect 1 and effect 2, and present a higher net gain curve, as shown in Fig. 20.
It is found that vehicles equipped with studded tyres were using a significantly smaller proportion of maximum available speed. This gives the reason why some degree of safety improvement can be achieved. As the drivers were not fully aware of the existence of
Pl P2
Fig. 19. After introduction of a seat-belt law. the expected cost curve should change from C,, to C,?.
Modelling of safety measure effects 287
P2 Pl P3
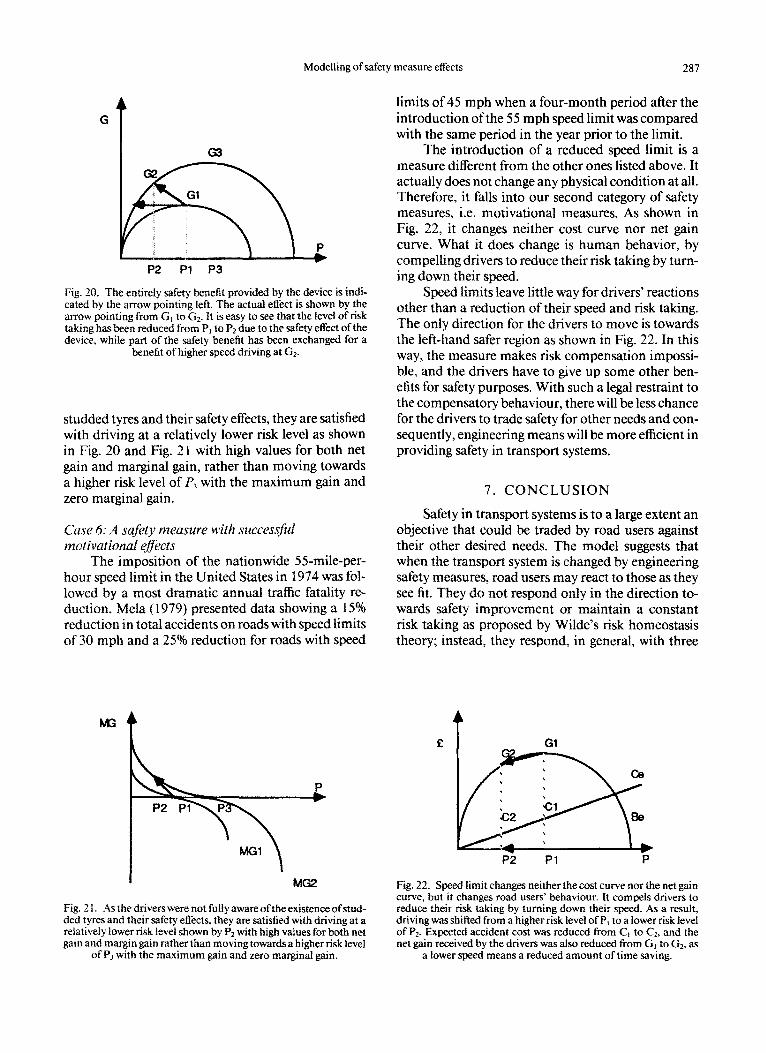
Fig. 20. The entirely safety benefit provided by the device is indi- cated bv the arrow uointine left. The actual effect is shown by the arrow pointing from G, to& It is easy to see that the level of risk taking has been reduced from P, to Pz due to the safety effect of the device, while part of the safety benefit has been exchanged for a
benefit of higher speed driving at Gz.
studded tyres and their safety effects, they are satisfied with driving at a relatively lower risk level as shown in Fig. 20 and Fig. 2 1 with high values for both net gain and marginal gain, rather than moving towards a higher risk level of P3 with the maximum gain and zero marginal gain.
Case 6: A safety meusure with successful motivational efects
The imposition of the nationwide 55-mile-per- hour speed limit in the United States in 1974 was fol- lowed by a most dramatic annual traffic fatality re- duction. Mela ( 1979) presented data showing a 15% reduction in total accidents on roads with speed limits of 30 mph and a 25Oh reduction for roads with speed
Fig. 2 1. As the drivers were not fuliy aware of the existence of stud- ded tyres and their safety effects, they are satisfied with driving at a relatively lower risk level shown by PZ with high values for both net gain and margin gain rather than moving towards a higher risk level
Fig. 22. Speed limit changes neither the cost curve nor the net gain curve, but it changes road users’ ~haviour. It compels drivers to reduce their risk taking by turning down their speed. As a result, driving was shifted from a higher risk level of P, to a lower risk level of P2. Expected accident cost was reduced from C, to C2, and the net gain received by the drivers was also reduced from G1 to G2, as
of P3 with the maximum gain and zero marginal gain. a lower speed means a reduced amount of time saving.
limits of 45 mph when a four-month period after the introduction ofthe 55 mph speed limit was compared with the same period in the year prior to the limit.
The introduction of a reduced speed limit is a measure different from the other ones listed above. It actually does not change any physical condition at all. Therefore, it falls into our second category of safety measures, i.e. motivational measures. As shown in Fig. 22, it changes neither cost curve nor net gain curve. What it does change is human behavior, by compelling drivers to reduce their risk taking by turn- ing down their speed.
Speed limits leave little way for drivers’ reactions other than a reduction of their speed and risk taking. The only direction for the drivers to move is towards the left-hand safer region as shown in Fig. 22. In this way, the measure makes risk compensation impossi- ble, and the drivers have to give up some other ben- efits for safety purposes. With such a legal restraint to the compensatory behaviour, there will be less chance for the drivers to trade safety for other needs and con- sequently, engineering means will be more efficient in providing safety in transport systems.
7. CONCLUSION
Safety in transport systems is to a large extent an objective that could be traded by road users against their other desired needs. The model suggests that when the transport system is changed by engineering safety measures, road users may react to those as they see fit. They do not respond only in the direction to- wards safety improvement or maintain a constant risk taking as proposed by Wilde’s risk homeostasis theory; instead, they respond, in general, with three
f Gl
Id
P2 Pl P

288 G. UNDERWOOD et al.
possible ways of behavioural adaptations and one of them towards more risk taking.
Like Evans’ model, our model can describe the effects of behavioural change on safety measures in- troduced into the road transport system. But in ad- dition, our model can also explain the motives of road users’ risk compensation towards the measures, and predict when behavioural adaptation is likely to take place. However, in some cases there may be not enough data for fitting all the curves in the model. When evidence and data accumulate for certain types of compensation, the model can be used more effec- tively in estimating the safety benefit of an engineer- ing measure.
Evans, L.; Schwing R. C. Human behavior and traffic safety. New York: Plenum Press; 1985a.
Evans, L. Human behavior feedback and traffic safety. Human Factors. 27(5):555-576; 1985b.
Hakkert, A. S.; Mahalel. D. The effect of traffic signals on road accidents-with particular reference to the introduc- tion of a blinking green phase. Traffic Engineering and Control 19(5):2 12-2 15; 1978.
Howarth, C. I. Perceived risk and behavioural feedback: Strategies for reducing accidents and increasing eIh- ciency. Work and Stress 1 (No. f):6 I-65; 1987.
Janssen, W. H.: Tenkink, E. Risk homeostasis theory and its critics: Time for an agreement, Soesterberg: TN0 In- stitute for Perception: 1987.
A model of the driver’s motivations that underlie behavioural adaptation and the cognitive processes necessary for adaptation, is presented in Jiang, Un- derwood and Howarth (1992). Behavioral adapta- tion, which is a necessary condition for increased safety. can be described as following the maximiza- tion of the driver’s utility function, but this depends upon an understanding of risk, the availability of de- cisions, the adaptation of motivations, and the effects of feedback upon behaviour. Supported by illustra- tive examples, the present model also suggests that due to risk compensation any engineering safety mea- sures alone will be usually insufficient. If some poten- tial effects are detected in the direction opposite to that intended, corresponding motivational measures may be implemented to modify the road users’ be- haviour to ensure that the desired level of safety can be achieved.
Janssen, W. H.; Tenkink, E. Consideration on speed selec- tion and risk homeostasis in driving. Accid. Anal. Prev. 20:137-142; 1988.
Jiang, C.Q.; Underwood, Geoffrey.; Howarth, C. 1. To- wards a theoretical model for behavioural adaptation to changes in the road transport system. Transport Reviews 12:253-264: 1992.
Klebelsberg, D. Das Moldell der subjektiven und objek- tiven sicherheit, Schweiz. Z. Psychologie, 4, 28.5-294. 1977.
Mela, D. F. Review of information on the safety effects of the 55 mph speed limit in the U.S. NHTSA Technical Note DOT HS-802 382. Washington, DC: U.S. Depart- ment of Transportation; 1977.
Ntitanen, R.; Summala, H. A model for the role of moti- vational factors in drivers’ decision-making. Accid. Anal. Prev. 3/4:243-26 1; 1974.
OECD. Road transport research-behavioural adaptations to changes in the road transport system. Report prepared by an OECD scientific expert group. Paris: OECD Pub- lications; 1990.
REFERENCES
Adams, J. G. U. The efficacy of seat belt legislation. SAE Paper No. 8208 19. Warrendale, PA: Society of Auto- motive Engineers, 1982.
O’Neill, B. A decision-theory model of danger compensa- tion. Accid. Anal. Prev. 3:157-165; 1977.
Rumar, K. et al. Driver reaction to a technical safety mea- sure-studded tires, Human Factors 18:443-454; 1976.
Wilde. G. J. S. The theory of risk-homeostasis: Implication for safety and health. Risk Analysis 4:209-225; 1982.
Wilde, G. J. S. Risk homeostasis theory and traffic acci- dents: Propositions, deductions and discussion of dis- sension in recent reactions. Ergonomics 3 1(4):44 I-468: 1988.
Asogwa, S. E. The crash helmet legislation in Nigeria: A be- Williams, A. F.; O’Neill. B. On-the-road driving records of fore and after study. Accid. Anal. Prev. 12:2 13-2 16; licensed race drivers. Accid. Anal. Prev. 6:263-270; 1980. 1974.