modelling of errors in measurement
TRANSCRIPT
Measurement theory
Modelling of errors in measurement Prof Dr-lng habil D. Hofmann, Chairman of IMEKO TC-7 Friedrich-Schiller-University Jena, Department of Technology for Scientific Instruments, DDR-6900 JENA, German Democratic Republic
The purpose of this paper is to show different standpoints concerning the modelling and calculation of measurement errors, to discover reasons for topical metrological problems in error analysis, to mention selected confidence limits of measurement errors which have been proved and to recommeend future activities to the unified application of proved error models as well as the concentration of investigations on systematic and residual errors which are insufficiently mastered today.
Introduction
In recent years there has been a rapid growth of interest in measurement. Three main reasons are obvious.
• First: Quality is nowadays the m~ijor element in share of market. Quality is a fuzzy term. Only with the help of measuring quantities can quality be exactly described, step-by-step optimised and objectively tested.
• Second: The dynamic development of science and industry demands the automation of production. The topical problem is a well-defined information acquisi- tion by measurements.
• Third: Microcomputers need sensors to get informa- tion from their environment. The sensor is that part of the measuring instrument which responds directly to the measured quantity.
The purpose of the paper is to analyse some reasons for metrological problems concerning the uniformity and compatibility of precision measurements based on error definitions. Error definitions are software prob- lems.
The modelling of errors
The wide application of microcomputers has resulted in new possibilities for quick and effective measure- ment-data processing to improve the measurement- error analysis. The error of measurement is the discrepancy between the result of the measurement and the value of the measured quantity (OIML, 1978).
The value of the measured quantity is a comparison value equal (according to the particular case) to the true value, the conventional true value, or the arithmetic mean of the results of a series of measurements.
The result of a measurement is the value of the measured quantity obtained by a measurement (OIML, 1978). The discrepancy can be expressed as the difference between the values mentioned above.
The true value is generally unknown and the conventional true value is often unknown, so that the error can only be estimated. The errors are represented by mathematical algorithms. It is necessary to consider that different points of view might supply different models of the same object.
Moasurement Vol 1 No 3, JuI--Sept 1983
The model selection is influenced by the knowledge attained, by certain opinions occurring in considering the model, and by calculational and experimental advantages.
Probabilistic error models are based on the practical experience that one cause may have several effects. Repeated measurements result in different measured values. In measurement processes random errors occur.
Statistical regularities are the basis of all the measured values that seem to be scattering irregularly. A random error is an error which varies in. an unpredictable manner in value and sign when a great many measure- ments of a specific quantity are carried out under effectively identical conditions (Clifford, 1980).
It is not possible to take account of the random error by the application of a correction to the measurement result. It is only possible to fix limits, within which, with a stated probability, this error will lie, on the basis of a series of measurements carried out under identical conditions. Today the evaluation of measurements is characterised by non-uniformity and non-compatibility based on models, algorithms and software not interna- tionally agreed (Rapport BIPM-80/3). To increase the quality of processes and products, it is not only necessary to measure and to check the quality parameters but also to increase the quality of measurements by making both uniform and compatible their models, algorithms and software.
The estimation of uncertainty
Uncertainty is that part of the expression of the result of a measurement which states the range within which the true value of a measured quantity is estimated to be situated. Whenever there is adequate information based on a statistical distribution of results, the uncertainty may be characterised by a standard deviation or by a confidence interval. In other cases, an alternative numerical expression of the degree of confidence is usually given.
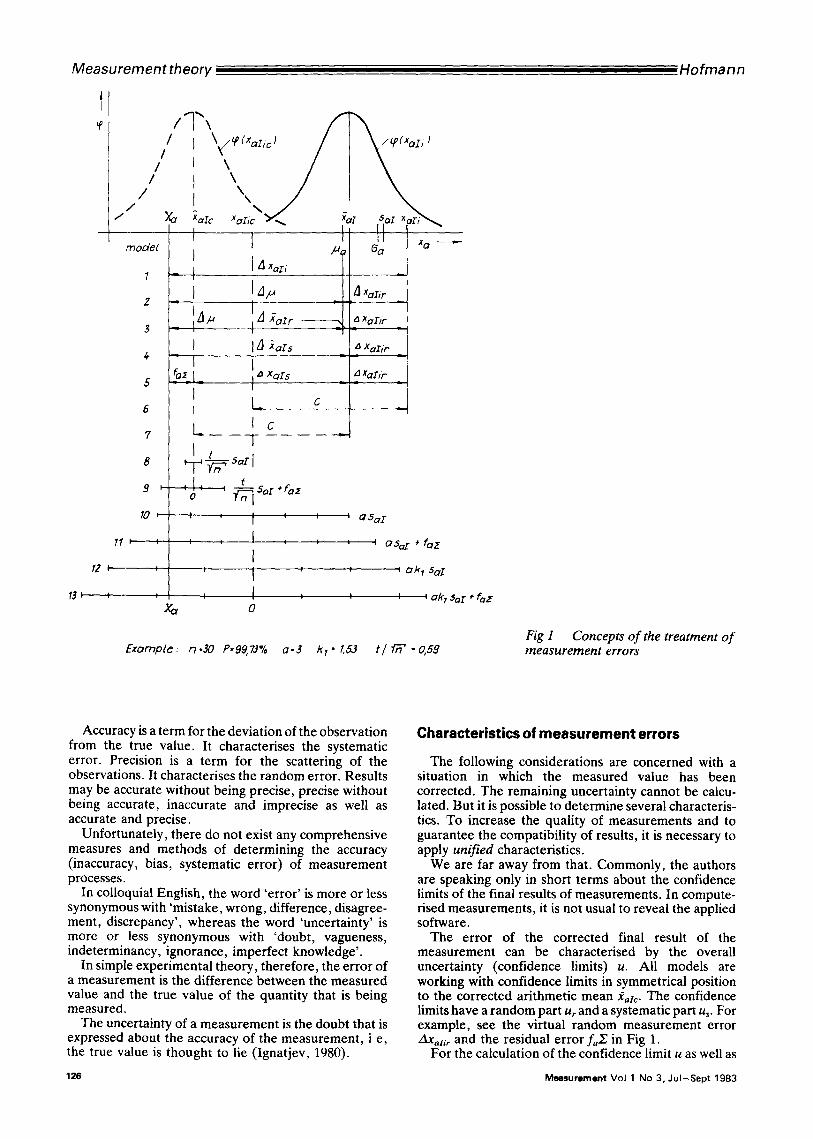
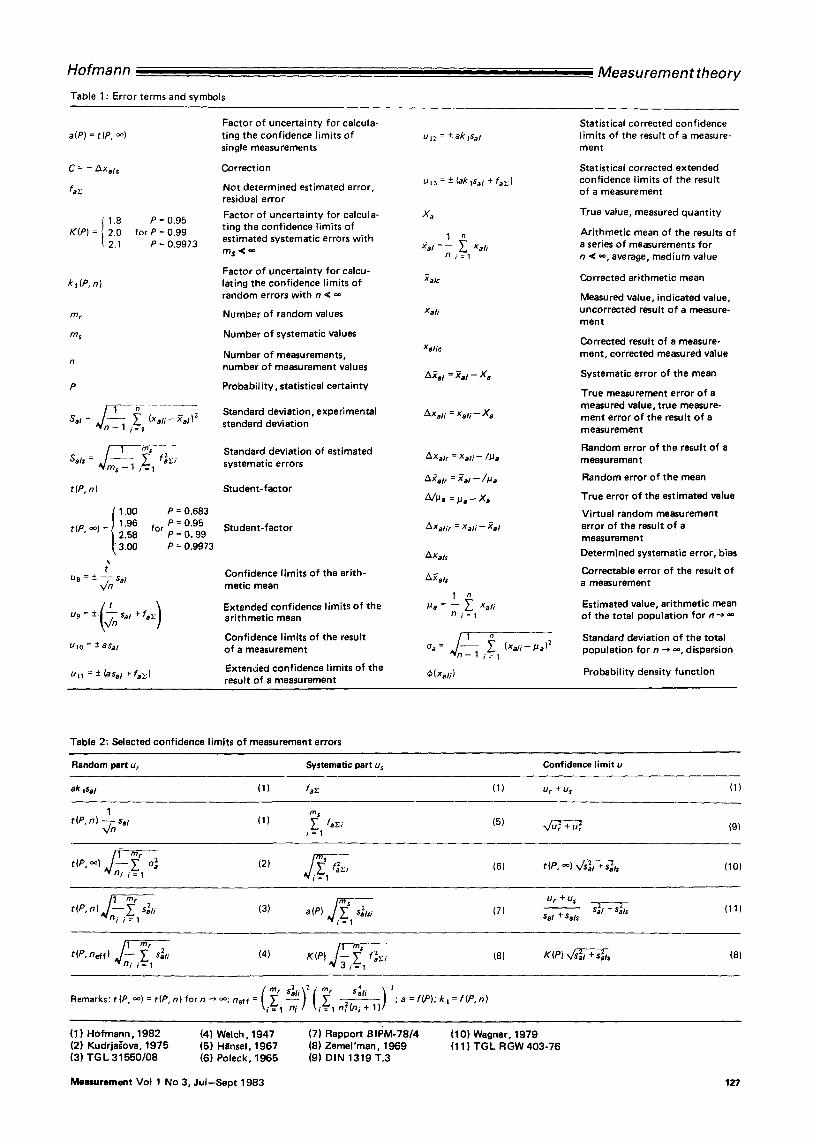
In literature, a remarkable variety of error concepts is used: see Fig 1 and Table 1 (Hofmann, 1981/82; Hofmann, 1982; v. Martens, 1981). There are also many terms concerning the quality of measurements in the English terminology. Examples are:
• systematic error, accuracy, inaccuracy bias; • random error, precision, imprecision, uncertainty.
M e a s u r e m e n t t h e o r y H o f m a n n
t
/ I
I /
/ /
/
mocleL
1 -
2 -
3 -
5
6
?
8
11
x~
_ \ \ \ \ XaIc xoI~c Y ~ x, aZ ,~aZ x ~ r i ~
) i /.'a ~a a
j [ a xor,
) I .,i,,., .4 xaz, r
1~ p jr ~_ £azr 2 I A Xal k. i
I I/1 ~:aI.¢ "¢ XaZir
e a~ l _ t ~ xar~ ,_ A xaz, r _
I I L . 6 _ _ - , _
L_ I c
1- - " I t
7, '~ "So.~ ÷ fa2 0
asaI
oSa_r + faz I
a k~ Sai
akl aoT * faZ 0
Exornplc: n . 3 0 P.99,73% a . 3 k r • 7,53 t / fff" -0,59 Fig 1 C o n c e p t s o f the t r ea tmen t o f m e a s u r e m e n t errors
Accuracy is a term for the deviation of the observation from the true value. It characterises the systematic error. Precision is a term for the scattering of the observations. It characterises the random error. Results may be accurate without being precise, precise without being accurate, inaccurate and imprecise as well as accurate and precise.
Unfortunately, there do not exist any comprehensive measures and methods of determining the accuracy (inaccuracy, bias, systematic error) of measurement processes.
In colloquial English, the word 'error' is more or less synonymous with 'mistake, wrong, difference, disagree- ment, discrepancy', whereas the word 'uncertainty' is more or less synonymous with 'doubt, vagueness, indeterminancy, ignorance, imperfect knowledge'.
In simple experimental theory, therefore, the error of a measurement is the difference between the measured value and the true value of the quantity that is being measured.
The uncertainty of a measurement is the doubt that is expressed about the accuracy of the measurement, i e, the true value is thought to lie (Ignatjev, 1980).
C h a r a c t e r i s t i c s o f m e a s u r e m e n t e r r o r s
The following considerations are concerned with a situation in which the measured value has been corrected. The remaining uncertainty cannot be calcu- lated. But it is possible to determine several characteris- tics. To increase the quality of measurements and to guarantee the compatibility of results, it is necessary to apply un i f i ed characteristics.
We are far away from that. Commonly, the authors are speaking only in short terms about the confidence limits of the final results of measurements. In compute- rised measurements, it is not usual to reveal the applied software.
The error of the corrected final result of the measurement can be characterised by the overall uncertainty (confidence limits) u. All models are working with confidence limits in symmetrical position to the corrected arithmetic mean :¢=ic. The confidence limits have a random part u, and a systematic part us. For example, see the virtual random measurement error ~T, alir and the residual error fa~ in Fig 1.
For the calculation of the confidence limit u as well as
126 Measurement Vol 1 No 3, JuI--Sept 1983
Hofmann
Table 1 : Error terms and symbols
Measurement theory
a(P) = t(P, oo)
C = - ~Xa l s
1.8 P = 0.95 K(P) = 2.0 for P = 0.99
2.1 P = 0.9973
k l ( P , n }
m r
ms
n
P
S a l = n ~ l ~ l i ~ = l ( x a / i - - E a / ) '
t(P, n)
( 1.00 P = 0.683 /
I 1.96 P = 0.95 t(P, /~2.68 f ° r P 0,99 3.00 P = 0.9973
t U 8 = + ~ Sal
us = +- Sal + fa~"
Uzo = +- aSal
UH = + (aSa/ + fa~')
Factor o f uncertainty for calcula- ting the confidence l imits of single measurements
Correction
Not determined estimated error, residual error
Factor of uncertainty for calcula- t ing the confidence l imits of estimated systematic errors wi th m s < ~
Factor o f uncertainty for calcu- lating the confidence l imits o f random errors wi th n ~ =
Number of random values
Number of systematic values
Number of measurements, number o f measurement values
Probabi l i ty, statistical certainty
Standard deviat ion, experimental standard deviation
Standard deviation of estimated systematic errors
Student- factor
Student- factor
Confidence l imits o f the ari th- matic mean
Extended confidence l imits o f the ar i thmet ic mean
Confidence l imits o f the result o f a measurement
Extended confidence l imits o f the result of a measurement
Ul2 = +-ak]Sal
ULs = +- (ak lSal + fa~)
x,
Xal = _ Xal i n i = 1
Xalc
Xali
Xali¢
Z~a l = ~al - X~
AXal i = Xal i - X a
AXal r = Xal i - / k l a
~al~ = ~al - / ~ o
& / ~ a = ~ a - Xa
AXalir = Xali -- Xal
/~. X al s
A -~ al s
1 n
IJa = - - ~ Xali n i = l
O a = (Xal i -- iJa 1~ i = 1
~(xa/ i )
Statistical corrected confidence l imits of the result o f a measure- ment
Statistical corrected extended confidence l imits of the result o f a measurement
True value, measured quant i ty
Ar i thmet ic mean of the results o f a series of measurements for n < 0% average, medium value
Corrected ar i thmetic mean
Measured value, indicated value, uncorrected result o f a measure- ment
Corrected result of a measure- ment, corrected measured value
Systematic error of the mean
True measurement error o f a measured value, t rue measure- ment error o f the result o f a measurement
Random error o f the result o f a measurement
Random error o f the mean
True error o f the estimated value
Vir tual random measurement error o f the result o f a measurement
Determined systematic error, bias
Cor rec tab le error o f the result o f a measurement
Estimated value, ar i thmet ic mean of the total populat ion for n--* =0 "
Standard deviation o f the total populat ion for n ~ ~o, dispersion
Probabil i ty density funct ion
Table 2: Selected confidence l imits o f measurement errors
Random part u r Systematic part u s Confidence l imit u
akzsa/ (1) f a t (1) Ur + us (1)
1 m s t ( P , n ) - ~ n s a l (1) ~. fa~i (5) ~ / ~ r + u~r 19)
,=1
t (P, oo) "~ n i i = 1 a2a (2) s f~aT.i (6) t (P, oo) ~ (10)
/ 1 mr "2 ~ Ur + Us t ( P , n ) J - - ~ . Sal i (3) a(P) ~ i ~ , 1 ; (7) Salsi "~n i i-~1 _ Sal +Sals
(11)
~ / 3 , = 1
Remarks: t (P, oo) = t (P, n ) for n --* oo; neff = ; a = f(P); k = = f (P, n ) i = n i / ~ i = l n ~ ( n i + l )
(~]) Hofmann, 1982 (2) KudrjaJ'ova, 1975 (3) T G L 31550/08
(4) Welch, 1947 (5) Hansel, 1967 (6) Poleck, 1965
(7) Rapport 81PM-78/4 (8) Zemel 'man. 1969 (9) DIN 1319 T.3
(10) Wagner. 1979 (11 ) TGL RGW 403-76
Measurement Vol 1 No 3, JuI--Sept 1983 127
Measurement theory
Table 3: Compatibi l i ty factors for confidence limits
P = 0.683 P = 0.95 P = 0.9973
k, t t/,/n k, t tJ~fn k, t t /x/n
12) 11.8) 11.3) 112.7) 13) (1 32) 10.76) 14.3) (4) 11.20) (0.60) (3.2) (5) 1.15 0.51 2.8 16) 1.11 0A5 2,09 2.6 8 1.08 0.38 1.80 2A
10 1.06 0.34 1.65 2.3 20 1.03 0.23 1.37 2.1 30 1.02 0.19 1.28 2.0 50 1.01 0.14 1.20 2.0
100 1.00 0.10 1.13 2.0 200 1.00 0.07 1.09 1.97
> 200 1.0 0 1.0 1.96
19.0) (235) 1166) (2.48) 119.2) (11.1 ) 11.59) (9.2) (4.6) 1.24 6.6 3.0 1.05 3.96 5.5 2.3 0.84 2,93 4.5 1.6 0.72 2.48 4.1 1.29 0,47 1,75 3.4 0.77 0,37 1.53 3.3 0.59 0.28 137 3.1 0A5 0.20 1.24 3.1 031 0.14 1.16 3.0 0.22 0 1.0 3.0 0
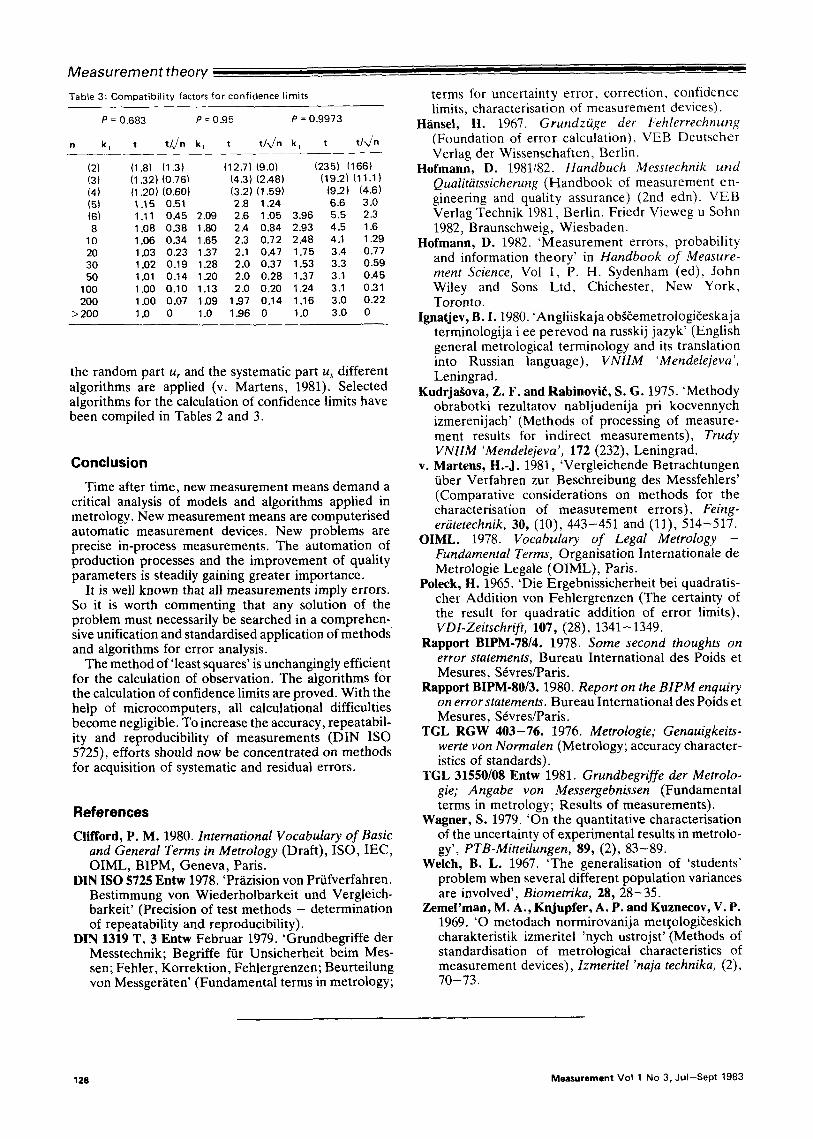
the random part u~ and the systematic part u s different algorithms are applied (v. Martens, 1981). Selected algorithms for the calculation of confidence limits have been compiled in Tables 2 and 3.
Conclusion
Time after time, new measurement means demand a critical analysis of models and algorithms applied in metrology. New measurement means are computerised automatic measurement devices. New problems are precise in-process measurements. The automation of production processes and the improvement of quality parameters is steadily gaining greater importance.
It is well known that all measurements imply errors. So it is worth commenting that any solution of the problem must necessarily be searched in a comprehen- sive unification and standardised application of methods and algorithms for error analysis.
The method of 'least squares' is unchangingly efficient for the calculation of observation. The algorithms for the calculation of confidence limits are proved. With the help of microcomputers, all calculational difficulties become negligible. To increase the accuracy, repeatabil- ity and reproducibility of measurements (DIN ISO 5725), efforts should now be concentrated on methods for acquisition of systematic and residual errors.
References
Clifford, P. M. 1980. International Vocabulary of Basic and General Terms in Metrology (Draft), ISO, IEC, OIML, BIPM, Geneva, Paris.
DIN ISO 5725 Entw 1978. 'Pr~zision von Prfifverfahren. Bestimmung von Wiederholbarkeit und Vergleich- barkeit' (Precision of test methods - determination of repeatability and reproducibility).
DIN 1319 T. 3 Entw Februar 1979. 'Grundbegriffe der Messtechnik; Begriffe ffir Unsicherheit beim Mes- sen; Fehler, Korrektion, Fehlergrenzen; Beurteilung von Messgeriiten' (Fundamental terms in metrology;
te rms fo r unce r ta i n t y e r r o r , co r rec t i on , c o n f i d e n c e limits, characterisation of measurement devices).
H~insel, H. 1967. Grundzage der Fehlerrechnung (Foundation of error calculation), VEB Deutscher Verlag der Wissenschaften, Berlin.
Hofmann, D. 1981/82. Handbuch Messtechnik und Qualitiitssicherung (Handbook of measurement en- gineering and quality assurance) (2nd edn). VEB Verlag Technik 1981, Berlin. Friedr Vieweg u Sohn 1982, Braunschweig, Wiesbaden.
Hofmann, D. 1982. 'Measurement errors, probability and information theory' in Handbook of Measure- ment Science, Vol 1, P. H. Sydenham (ed), John Wiley and Sons Ltd, Chichester, New York, Toronto.
Ignatjev, B. I. 1980. 'Angliiskaja obg~emetroiogi~eskaja terminologija iee perevod na russkij jazyk' (English general metrological terminology and its translation into Russian language), VNIIM 'Mendelejeva', Leningrad.
Kudrjagova, Z. F. and Rabinovii~, S. G. 1975. 'Methody obrabotki rezultatov nabljudenija pri kocvennych izmerenijach' (Methods of processing of measure- ment results for indirect measurements), Trudy VNIIM 'Mendelejeva', 172 (232), Leningrad.
v. Martens, H.-J. 1981, 'Vergleichende Betrachtungen fiber Verfahren zur Beschreibung des Messfehlers' (Comparative considerations on methods for the characterisation of measurement errors), Feing- eriitetechnik, 30, (10), 443-451 and (11), 514-517.
OIML. 1978. Vocabulary of Legal Metrology - Fundamental Terms, Organisation Internationale de Metrologie Legale (OIML), Paris.
Poleck, It. 1965. 'Die Ergebnissicherheit bei quadratis- cher Addition yon Fehlergrenzen (The certainty of the result for quadratic addition of error limits), VDI-Zeitschrift, 107, (28), 1341-1349.
Rapport BIPM-78/4. 1978. Some second thoughts on error statements, Bureau International des Poids et Mesures, S6vres/Paris.
Rapport BIPM-80/3. 1980. Report on the BIPM enquiry on error statements. Bureau International des Poids et Mesures, S6vres/Paris.
TGL RGW 403-76. 1976. Metrologie; Genauigkeits- werte yon Normalen (Metrology; accuracy character- istics of standards).
TGL 31550/08 Entw 1981. Grundbegriffe der Metrolo- gie; Angabe yon Messergebnissen (Fundamental terms in metrology; Results of measurements).
Wagner, S. 1979. 'On the quantitative characterisation of the uncertainty of experimental results in metroio- gy', PTB-Mitteilungen, 89, (2), 83-89.
Welch, B. L. 1967. 'The generalisation of 'students' problem when several different population variances are involved', Biometrika, 28, 28-35.
Zemel'man, M. A., Knjupfer, A. P. and Kuznecov, V. P. 1969. ' 0 metodach normirovanija met~ologi~eskich charakteristik izmeritel 'nych ustrojst' (Methods of standardisation of metrological characteristics of measurement devices), Izmeritel 'naja technika, (2), 70-73.
128 Measurement Vol 1 No 3, Jul-Sept 1983