modelling irrigated cropping systems, with special
TRANSCRIPT

Modelling irrigated cropping systems, with special attention to rice-wheat sequences and raised bed planting Proceedings of a workshop at CSIRO Land and Water, Griffith 25-28 February 2002
Editors: E. Humphreys and J. Timsina
Technical Report 25/02, August 2002

ii
Direct-seeded rice on beds in a farmer’s field in Australia
Wheat on beds in a farmer’s field in Punjab, India
Dr SS Dhillon (right) introduced bed planting to the IGP
iii
Modelling irrigated cropping systems,with special attention to rice-wheat sequences
and raised bed planting
Proceedings of a workshop at CSIRO Land and Water, Griffith25-28 February 2002
Editors: E. Humphreys and J. Timsina
Australian Centre for InternationalAgricultural Research
Agricultural Production SystemsResearch Unit, Australia
CSIRO Land and Water Technical Report 25/02

iv
© 2002 CSIRO To the extent permitted by law, all rights are reserved and no part of thispublication covered by copyright may be reproduced or copied in any form or by any meansexcept with the written permission of CSIRO Land and Water.
Important Disclaimer: CSIRO Land and Water advises that the information contained in thispublication comprises general statements based on scientific research. The reader is advised andneeds to be aware that such information may be incomplete or unable to be used in any specificsituation. No reliance or actions must therefore be made on that information without seekingprior expert professional, scientific and technical advice. To the extent permitted by law, CSIROLand and Water (including its employees and consultants) excludes all liability to any person forany consequences, including but not limited to all losses, damages, costs, expenses and any othercompensation, arising directly or indirectly from using this publication (in part or in whole) andany information or material contained in it.
Citation details:
Humphreys, E and Timsina, J (Editors) (2002). Modelling irrigated cropping systems, withspecial attention to rice-wheat sequences and raised bed planting. Proceedings of a workshopheld at CSIRO Land and Water, Griffith on 25-28 February 2002. CSIRO Land and Water,Griffith, NSW 2680, Australia. 118 pp.
Available on the web: www.clw.csiro.au/publications/technical2002

v
Foreword
The rice-wheat cropping systems of the Indo-Gangetic Plains (IGP) are of immense importancefor food security for south Asia. Over the past 40 years the increase in rice and wheat productionhas kept pace with population growth due to improved varieties, increased inputs, especiallyfertilisers, and the expansion of irrigation. However yield stagnation, and possibly yield decline,water scarcity, and water and air pollution are major threats to the sustainability of rice-wheatsystems and food security. Therefore the design and implementation of alternative productionsystems with increased resource use efficiency (especially water) and productivity and reducedadverse environmental impact are urgently required.
Bed farming, practised for several decades for crops other than rice in Australia, Mexico andelsewhere, was introduced to the rice-wheat regions of the IGP in the mid 1990s. Farmerexperience and research have shown that bed farming offers significant advantages forproductivity and resource use efficiency for wheat and other non-rice crops. More recently,attention has focused on the possibility of also growing rice on beds in the IGP and Australia,with the associated potential benefits of permanent bed systems including reduced landpreparation costs and turn around times, increased cropping flexibility, and increasedproductivity of “upland” crops grown in rotation with rice due to improved drainage and soilstructure and improved rotations.
The radical shift from ponded rice culture on the flat (with or without puddling andtransplanting) to intermittently flooded bed layouts affects a host of interacting factorsinfluencing productivity and resource use efficiency of both rice and crops grown in rotationwith rice. These factors range from weeds to nutrient availability to pests and diseases to waterdynamics to stubble management options. The potential benefits and disadvantages of permanentbed systems need to be quantified under a range of agroecological conditions, and optimumlayouts and management systems need to be identified to maximise potential gains.
The Australian Centre for International Agricultural Research (ACIAR) is funding a major newproject LWR2/2000/89 Permanent beds for rice-wheat and alternative cropping systems in northwest India and south east Australia. This is a collaborative project between Punjab AgriculturalUniversity, CSIRO Land and Water and NSW Agriculture, with additional support from theInternational Atomic Energy Agency (IAEA/FAO) for the work in India, and additional supportfor the work in Australia from the Rural Industries Research and Development Corporation(RIRDC) Rice program, the Grains Research and Development Corporation (GRDC) andColeambally Irrigation Cooperative Ltd and Murray Irrigation Ltd.
The major part of the project comprises field comparison of permanent bed and traditionallayouts for rice-based cropping systems in Punjab, India and NSW, Australia, with detailedmonitoring, in particular focusing on crop growth and development, water and nitrogendynamics and balances, and options for stubble management. The project also seeks to furtherdevelop and refine models for rice-wheat and alternative systems, and apply them to evaluatepermanent bed and traditional layouts for a range of agroecological environments, and to identifyoptions for maximizing resource use efficiency and productivity of rice-wheat cropping systemsin India, and rice-based cropping systems in Australia. Therefore an early activity in the project

vi
was a workshop bringing together a small group of international scientists leading in thedevelopment and application of crop models including the modelling of crop sequences and two-dimensional approaches.
The objectives of the workshop were:
1. to review the state of the art in the modelling irrigated cropping systems (crop sequencesas opposed to single crops) and bed geometries (as opposed to “flat” layouts)
2. to workshop conceptualizations of the ways forward in modelling crop sequences and bedlayouts, and with particular attention to rice-wheat systems
3. to establish a network of contacts working in these areas to share progress and problemsin the future
Acknowledgements
We are grateful to all workshop participants and their organisations for their participation,recognizing the significant time and monetary costs involved.
Sponsorship of international participants was provided by ACIAR, APSRU (AgriculturalProduction Systems Research Unit), the Crawford Fund and IRRI (International Rice ResearchInstitute).
We thank Professor David Connor, University of Melbourne, for ably facilitating the workshop.
Liz HumphreysWorkshop Convenor
ContentsPage no.
Foreword v
Acknowledgements vi
Overview of rice-wheat systems in Punjab and the Indo-Gangetic Plains
Bijay-Singh, P R Gajri, J Timsina, Yadvinder-Singh, and S S DhillonSome issues on water and nitrogen dynamics in rice-wheat sequences on flats 1and beds in the Indo-Gangetic Plains.
Modeling approaches for rice and wheat
U Singh, J Timsina, and D Godwin 17Testing and application of CERES-rice and CERES-wheat models for rice-wheatcropping systems
M J Robertson, and S N Lisson 33Modelling growth and development of wheat and rice in APSIM
M E Probert 39Modelling crop sequences using APSIM
R Williams 51TRYM: A simplified process model in use by the NSW rice industry
Modeling bed geometries
P de Willigen and M Heinen 57A short description of the simulation model FUSSIM2 illustrated with two examples
E Xevi and J Timsina 63Potential for application of HYDRUS-2D to analysis of water flow and solutetransport of bed layouts in irrigated cropping systems
D Godwin,E Humphreys, DJ Smith, J Timsina, E Xevi, and W Meyer 69Application of SWAGMAN� Destiny to rice-wheat cropping systems
N I Huth, M E Probert, and M J Robertson 83A version of APSIM with multi-point/spatial capabilities
Monitoring on beds
R J Cabangon, G Lu, and T P Tuong 91Bed experiments at IRRI and China: a report.
viii
J S Gill, B M MacKenzie, and J M Tisdall 97IImmpprroovveedd ssooiill mmaannaaggeemmeenntt ooff rraaiinnffeedd vveerrttiissooll iinn WWeesstteerrnn NNuussaa,, TTeennggggaarraa
Key questions, issues and opportunities, and recommendations
E Humphreys 99Key questions for modeling
J Timsina, E Humphreys, and D Godwin 101Issues and opportunities for modelling rice-wheat crop sequenceson flat and bed layouts
Workshop recommendations for the ACIAR project and the wider group 113
Appendix 1. Workshop program 115
Appendix 2. Participants and contact details 117
1
Some issues on water and nitrogen dynamics in rice-wheat sequences on flatsand beds in the Indo-Gangetic plains���
Bijay-Singh1, P.R. Gajri1, J. Timsina2, Yadvinder-Singh1 and S.S. Dhillon1
1Punjab Agricultural University, Ludhiana 141 004, India2CSIRO Land and Water, PMB 3, Griffith, NSW 2680, Australia
Rice-wheat systems of the Indo-Gangetic plains
Rice (Oryza sativa L.) and wheat (Triticum aestivum L.) grown sequentially in an annual rotationconstitute a rice-wheat system. The system brings together conflicting and complementarypractices as repeated transitions from aerobic to anaerobic to aerobic soil conditions change thephysical, chemical and biological environment of soils, and most importantly, soil structure andnutrient relations (Timsina and Connor 2001). In the annual cycle, suitable thermal conditionsfor both rice and wheat exist in the Indo-Gangetic Plains (IGP) (Figure 1), where climate is sub-humid with a distinct wet, monsoon, summer season and a dry, cool, winter season.Temperatures can exceed 45oC in summer and frost occurs in some areas in winter. Soils aremainly alluvial, based on deposits of the Indus and Ganges river systems. Texture ranges fromloamy sand to silty clay loam. Many soils are alkaline, although acid soils are also present in thepiedmont and some floodplains. The northwest part of the IGP is endowed with extensive canalirrigation systems using water storage reservoirs in the Himalayan mid-hills. Canal irrigation issupplemented with tube-well water and most of the rice-wheat areas are either fully or partiallyirrigated. The IGP is probably one of the most fertile and productive agricultural areas in theworld.
The rice-wheat rotation is one of the world’s largest agricultural production systems (13.5 M hain South Asia), occupying about 85% of the cultivated land in the IGP and nearly one-sixth ofthe total geographical area of the sub-continent. The system accounts for about one-third of thearea of both rice and wheat grown in South Asia. Rice-wheat rotations produce more than 45%of the region’s food, and provide staple grains for nearly 42% of the total population of 1.3billion of South Asia. Demand for rice and wheat in south Asia will grow at 2.5% per year overthe next 20 years, but the per capita rice-wheat growing area has already shrunk from 1,200 m2
in 1961 to less than 700 m2 in 2001. Future growth in food production can only come fromincreased yield rather than area (Ladha et al. 2000).
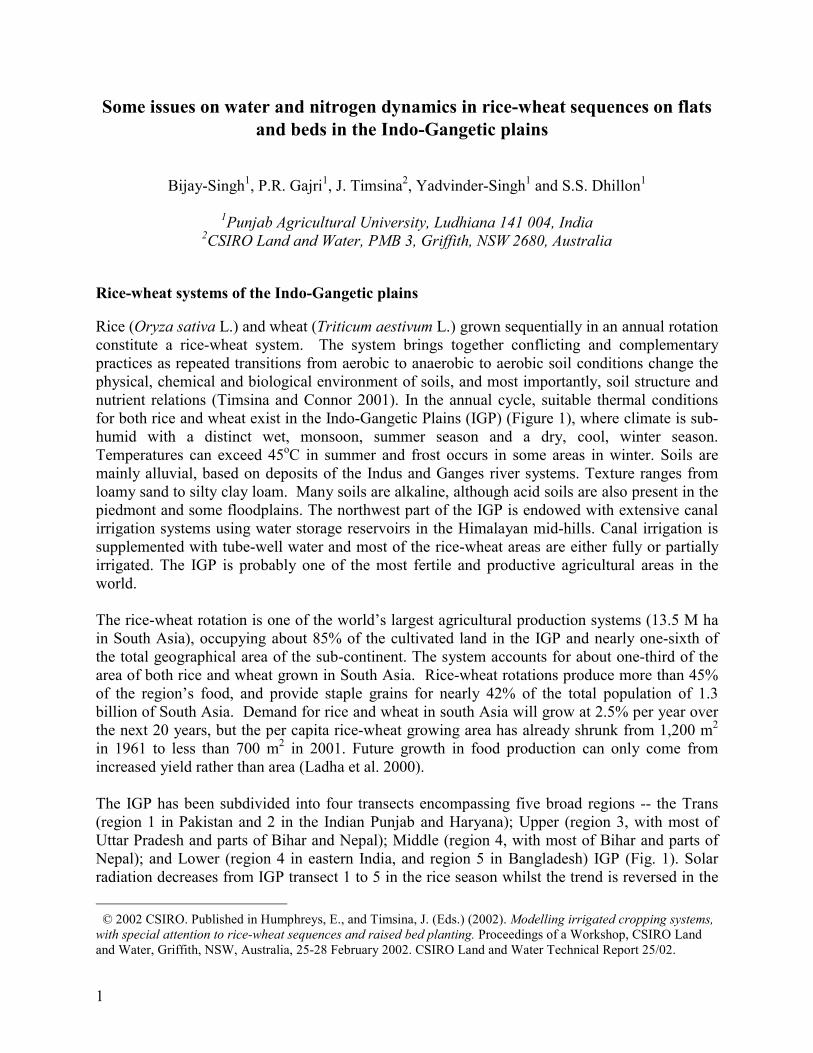
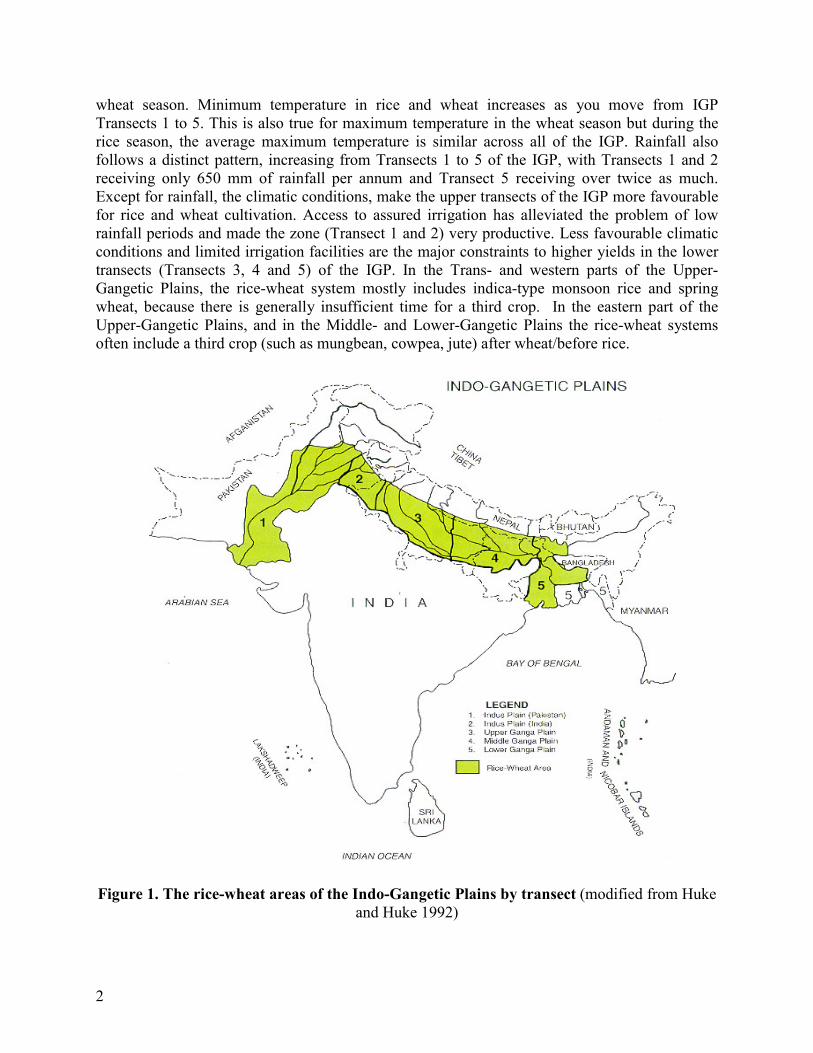
The IGP has been subdivided into four transects encompassing five broad regions -- the Trans(region 1 in Pakistan and 2 in the Indian Punjab and Haryana); Upper (region 3, with most ofUttar Pradesh and parts of Bihar and Nepal); Middle (region 4, with most of Bihar and parts ofNepal); and Lower (region 4 in eastern India, and region 5 in Bangladesh) IGP (Fig. 1). Solarradiation decreases from IGP transect 1 to 5 in the rice season whilst the trend is reversed in the ���© 2002 CSIRO. Published in Humphreys, E., and Timsina, J. (Eds.) (2002). Modelling irrigated cropping systems,with special attention to rice-wheat sequences and raised bed planting. Proceedings of a Workshop, CSIRO Landand Water, Griffith, NSW, Australia, 25-28 February 2002. CSIRO Land and Water Technical Report 25/02.
2
wheat season. Minimum temperature in rice and wheat increases as you move from IGPTransects 1 to 5. This is also true for maximum temperature in the wheat season but during therice season, the average maximum temperature is similar across all of the IGP. Rainfall alsofollows a distinct pattern, increasing from Transects 1 to 5 of the IGP, with Transects 1 and 2receiving only 650 mm of rainfall per annum and Transect 5 receiving over twice as much.Except for rainfall, the climatic conditions, make the upper transects of the IGP more favourablefor rice and wheat cultivation. Access to assured irrigation has alleviated the problem of lowrainfall periods and made the zone (Transect 1 and 2) very productive. Less favourable climaticconditions and limited irrigation facilities are the major constraints to higher yields in the lowertransects (Transects 3, 4 and 5) of the IGP. In the Trans- and western parts of the Upper-Gangetic Plains, the rice-wheat system mostly includes indica-type monsoon rice and springwheat, because there is generally insufficient time for a third crop. In the eastern part of theUpper-Gangetic Plains, and in the Middle- and Lower-Gangetic Plains the rice-wheat systemsoften include a third crop (such as mungbean, cowpea, jute) after wheat/before rice.
Figure 1. The rice-wheat areas of the Indo-Gangetic Plains by transect (modified from Hukeand Huke 1992)

3
The yields of both rice and wheat have gradually increased over the past four decades as the rice-wheat system has developed. Rice yields more than wheat but mean yields of both crops in thefour South Asian countries (2.7 and 2.1 t ha-1 for rice and wheat, respectively) are small relativeto potential attainable yield. Much of the system, especially in the middle and lower IGP,operates at low yield because of inadequate nutrition and poor water management. In the Trans-and Upper IGP, however, mean yields of both crops are substantially higher, because of assuredirrigation and high nutrient use. The challenge to research is to understand crop responses to therequired combination of practices so that management systems can be devised for high andsustainable system yield (Timsina and Connor 2001).
Rice-wheat systems of the Indian Punjab
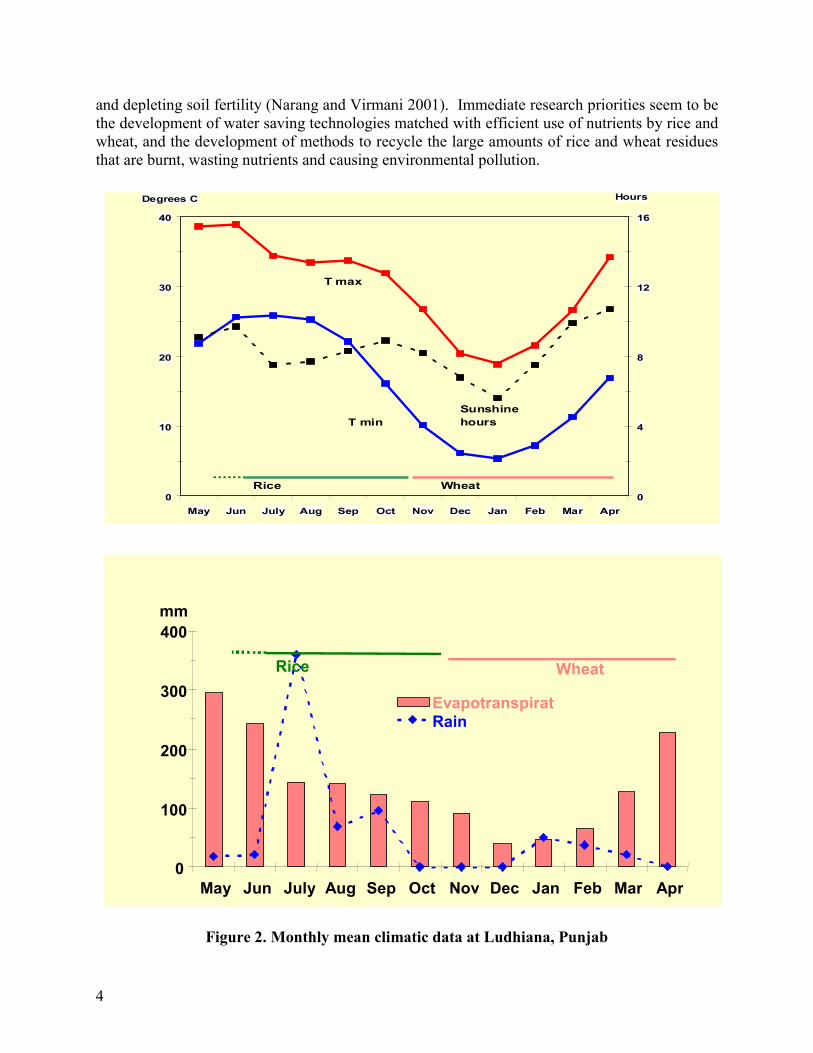
Punjab and Haryana are the home of the 'Green Revolution' in India, where the use of seed ofhigh yielding, short duration and N responsive cultivars, extensive use of chemical fertilizers andpesticides, irrigation, and improved farm machinery have been implemented starting from the1960s. Hot, wet summers and cold dry winters characterize the climate of Punjab. The annualrainfall in Punjab ranges between 400-800 mm, increasing from west to east, and is equivalent toaround 40% of potential evapo-transpiration (Fig. 2). The soils of the region are predominantlycoarse textured (sands, loamy sands, sandy loams and loams) with smaller areas of silty claysand clays. The traditional rice fields have loam to clay loam soils, but the non-traditional ricesoils, which came under cultivation to rice from the mid-70s, are more porous (sands, loamysands, and sandy loams), and now constitute about 60% of rice soils of Punjab. Punjab is nowthe greatest user of irrigation water and fertilizer for rice and wheat in India.
Rice replaced traditional crops of maize, sorghum, pearl millet, cotton, and pulses, while wheatreplaced barley, pulses, and mustard. The central plain districts of Punjab show the maximumconcentration of rice because this zone has the highest irrigation intensity in the country, withmore than 94% of the net area sown being irrigated through a network of perennial canals andnearly 0.8 million tube-wells. Thus in Punjab the rice area has increased from 0.4 M ha in 1960-61 to 2.8 M ha in 1990-91, while the wheat area increased from 1.7 to 3.2 M ha over the sameperiod (Yadav et al 1998). The shift in cropping patterns was also associated with increasedyields of rice from 1.0 t ha-1 to 5.1 t ha-1 between 1960-61 and 1996-97, and of wheat from 1.0-2.0 t ha-1 to 4.2 t ha-1. Now the groundwater reserves are being over exploited, with sharpdeclines in ground watertables, averaging 20 cm per annum. Although sustainability of ricecultivation is at risk due to falling watertables (at some places 100 cm per annum), an increase inrice area has continued because stable yields of rice are being obtained with high use of Nfertilizers (120-150 kg N ha-1), assured irrigation, and favorable growing conditions (13-14 hbright sunshine per day during most of the growth period of rice). On relatively coarse-texturedsoils, farmers apply about 1500 mm of irrigation water over a 100-110 day growing period tosupplement the 330 mm average effective rain received during the season.
The total productivity of rice and wheat in Punjab is the highest (5.1 + 4.2 = 9.3 t ha-1) in thecountry (Statistical Abstract of Punjab, Economic Advisor, Punjab, Chandigarh). There areconcerns over the sustainability of the rice-wheat system in Punjab and this system is no longerexhibiting increased production with increases in input use. It is suggested that by incorporatingsuitable innovations the system will overcome the emerging problems of receding watertables
4
and depleting soil fertility (Narang and Virmani 2001). Immediate research priorities seem to bethe development of water saving technologies matched with efficient use of nutrients by rice andwheat, and the development of methods to recycle the large amounts of rice and wheat residuesthat are burnt, wasting nutrients and causing environmental pollution.
Figure 2. Monthly mean climatic data at Ludhiana, Punjab
0
100
200
300
400
May Jun July Aug Sep Oct Nov Dec Jan Feb Mar Apr
mm
EvapotranspiratRain
Rice Wheat
0
10
20
30
40
May Jun July Aug Sep Oct Nov Dec Jan Feb Mar Apr
Degrees C
0
4
8
12
16
Hours
Rice Wheat
T max
T minSunshinehours
5
Nitrogen management in rice-wheat systems
Fertilizer use in rice and wheat in India
The productivity of both rice and wheat is related to total use of N, P and K. Diagnostic surveys(Yadav et al. 2000) indicate that farmers apply 130-195 kg N ha-1 to non-basmati rice, with anaverage of 153 kg N ha-1 in Punjab. The ability to irrigate substantially influences the use offertilizer N and the productivity of both rice and wheat crops. A positive interaction betweenwater and nutrient use in the rice-wheat system is well documented.
Transformations and losses of nitrogen
Nitrogen from rice-wheat systems is mostly lost via ammonia volatilization, nitrification-denitrification, and leaching.
NitrificationIn several areas in the IGP, continuous flooding for rice usually cannot be maintained either dueto shortage of water or due to high percolation rates, leading to alternating flooded (reduced oranaerobic) and drained (oxidized or aerobic) conditions. Consequently, nitrification occursduring "dry spells” and nitrates thus produced are subsequently reduced to N2 and N2O bydenitrification when soils are reflooded. Although there is much variation in the data onnitrification rates estimated at different locations in the IGP, a trend with respect to soiltemperature and pH is easily discernible (Aulakh and Bijay-Singh 1997).
Nitrification rates in excess of NO3- utilization by plants can result in increased levels of NO3
--Nin run-off and groundwater rendering it unsafe for human consumption. On the other hand, slowrates of nitrification would result in accumulation of NH4
+-N, which may enhance fertilizer-useefficiency by reducing denitrification and leaching losses. However, reduced nitrification couldalso increase N losses via NH3 volatilization. Thus nitrification acts as a key process indetermining fertilizer-use efficiency by crops as well as N losses from soils. Since the majorportion of total fertilizer N used in the rice-wheat cropping systems in the IGP is urea, the rate ofnitrification is a primary determinant of N losses. The use of neem (Azadirachtca indica) cake orneem extract coated urea has been shown to retard nitrification in soils and enhance N useefficiency in rice under many situations.
Ammonia volatilizationIn coarse-textured or porous soils grown to rice, NH4
+-N in floodwater is readily transported tosubsurface soil layers along with percolating water, and cannot move back to the soil surface dueto the downward flux of percolating water. Thus, in contrast to heavy clay soils, highlypermeable soils under wetland rice are not prone to substantial losses of N via ammoniavolatilization. Urea is generally applied after the first irrigation to minimize leaching anddenitrification losses, but its placement on the wet surface of alkaline porous soils promotesammonia volatilization. Since leaching and denitrification are not significant loss mechanisms inwheat crops, volatilization of NH3 seems to be the most likely mechanism of loss (Katyal et al.1987). The timing and placement of fertilizer and the timing of irrigation could further influencethe losses of urea applied to porous soils. When applied on the wet soil surface followingirrigation, as much as 42% of the applied N was lost, most likely due to volatilization. Deep
6
placement of urea before irrigation reduced the loss of applied N from 42 to 15% (Katyal et al.1987).
DenitrificationIn submerged soils under rice, nitrification in oxidized soil zones and floodwater converts theammonical N formed by ammonification and hydrolysis of urea into nitrate N. The nitrate N canthen move into reduced soil zones where it is readily denitrified. Thus alternating aerobic–anaerobic conditions in soils under rice could result in greater total N loss from the soil thanwould be found under continuous anaerobic conditions. Very limited information is available,however, of the direct measurement of gaseous N losses via denitrification. A recent studycarried out by Aulakh et al. (2001) estimates that 23-33 % of N applied through fertilizer and/orgreen manures is lost via nitrification-denitrification during rice cropping. In wheat, losses couldbe 8-10 fold less than in rice.
LeachingIn ideal lowland rice fields with fine-textured soils, nitrification proceeds very slowly producingsmall amounts of nitrates, and due to restricted downward percolation, with little loss by leachingbeyond the rice root zone. In coarse-textured soils, however, leaching losses of NO3
- and alsounhydrolyzed urea may occur, particularly if applied as large granules. In wheat, losses ofapplied N are not large. For urea-based sources, about 75% of the applied N was found in thetop 15 cm soil, reflecting little or no leaching of N (Katyal et al. 1987). When applied beforeirrigation, however, N derived from urea moved down to 15 to 30 cm. In rice, N losses vialeaching were determined by the percolation rates as modified by puddling and the N source.Applying N to rice through urea supergranules (USG) in porous soils resulted in negligible lossesvia ammonia volatilization but extremely small fertilizer use efficiency due to large losses vialeaching (Katyal et al. 1985).
Bijay-Singh and Sekhon (1976) reported that the concentration of NO3- in the water from shallow
(4 to 10 m deep) open wells located in cultivated areas decreased significantly with depth towatertable, and was positively correlated with the amount of fertilizer N applied on farms locatedin the vicinity of the wells. During 1975 to 1988, average fertilizer N consumption in theIndian Punjab increased from 56 to 188 kg N ha-1 year-1 (on net area sown basis). Monitoring ofthe NO3-N concentrations in the shallow well waters in 1982 and 1988 (Bijay-Singh et al. 1991)revealed that the increase of NO3
--N by almost 2 mg l-1 was associated with an increase infertilizer consumption. In a recent survey conducted in 1999, NO3
--N content in shallowgroundwaters drawn though some hand pumps located in village peripheries was more than 10mg l-1. Even in tube wells located at farms in the Punjab, NO3
--N level in water has increasedfrom 0.4 mg l-1 in 1975 to 3.6 mg in 1992 to >5 mg l-1 in 1999.
Amounts, sources and placement of N application
Irrespective of source, application of fertilizer N at 120 kg ha-1 is recommended for most of therice-wheat growing regions, except in the eastern parts of the IGP, where lower N rates areapplied. In soils with low organic carbon, significant and economic responses of rice and wheathave been recorded for application rates up to 150 kg N ha-1. The trend is already evident withmore than 150 kg N ha-1 applied to rice following wheat in Indian Punjab, Haryana and Western
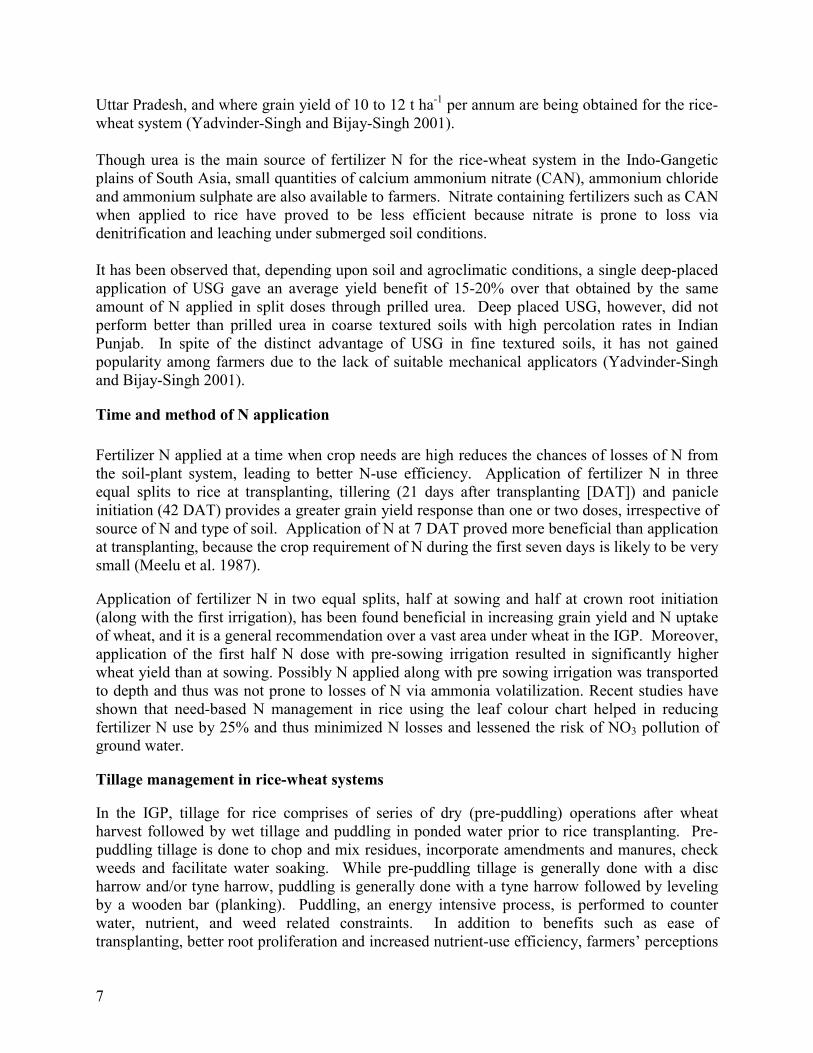
7
Uttar Pradesh, and where grain yield of 10 to 12 t ha-1 per annum are being obtained for the rice-wheat system (Yadvinder-Singh and Bijay-Singh 2001).
Though urea is the main source of fertilizer N for the rice-wheat system in the Indo-Gangeticplains of South Asia, small quantities of calcium ammonium nitrate (CAN), ammonium chlorideand ammonium sulphate are also available to farmers. Nitrate containing fertilizers such as CANwhen applied to rice have proved to be less efficient because nitrate is prone to loss viadenitrification and leaching under submerged soil conditions.
It has been observed that, depending upon soil and agroclimatic conditions, a single deep-placedapplication of USG gave an average yield benefit of 15-20% over that obtained by the sameamount of N applied in split doses through prilled urea. Deep placed USG, however, did notperform better than prilled urea in coarse textured soils with high percolation rates in IndianPunjab. In spite of the distinct advantage of USG in fine textured soils, it has not gainedpopularity among farmers due to the lack of suitable mechanical applicators (Yadvinder-Singhand Bijay-Singh 2001).
Time and method of N application
Fertilizer N applied at a time when crop needs are high reduces the chances of losses of N fromthe soil-plant system, leading to better N-use efficiency. Application of fertilizer N in threeequal splits to rice at transplanting, tillering (21 days after transplanting [DAT]) and panicleinitiation (42 DAT) provides a greater grain yield response than one or two doses, irrespective ofsource of N and type of soil. Application of N at 7 DAT proved more beneficial than applicationat transplanting, because the crop requirement of N during the first seven days is likely to be verysmall (Meelu et al. 1987).
Application of fertilizer N in two equal splits, half at sowing and half at crown root initiation(along with the first irrigation), has been found beneficial in increasing grain yield and N uptakeof wheat, and it is a general recommendation over a vast area under wheat in the IGP. Moreover,application of the first half N dose with pre-sowing irrigation resulted in significantly higherwheat yield than at sowing. Possibly N applied along with pre sowing irrigation was transportedto depth and thus was not prone to losses of N via ammonia volatilization. Recent studies haveshown that need-based N management in rice using the leaf colour chart helped in reducingfertilizer N use by 25% and thus minimized N losses and lessened the risk of NO3 pollution ofground water.
Tillage management in rice-wheat systems
In the IGP, tillage for rice comprises of series of dry (pre-puddling) operations after wheatharvest followed by wet tillage and puddling in ponded water prior to rice transplanting. Pre-puddling tillage is done to chop and mix residues, incorporate amendments and manures, checkweeds and facilitate water soaking. While pre-puddling tillage is generally done with a discharrow and/or tyne harrow, puddling is generally done with a tyne harrow followed by levelingby a wooden bar (planking). Puddling, an energy intensive process, is performed to counterwater, nutrient, and weed related constraints. In addition to benefits such as ease oftransplanting, better root proliferation and increased nutrient-use efficiency, farmers’ perceptions

8
of puddling as a composite part of rice culture are mainly centered around its role in suppressionof weeds and reduction of water losses. More than 60% of the rice area in the IGP receives 2-3pre-puddling, 2 puddling, and 2 planking operations. In some areas with less water available forirrigation, farmers perform 4 to 5 puddlings. Puddling, destroys soil aggregates, increases bulkdensity below the puddled layer, decreasing the proportion of transmission pores and hydraulicconductivity, and therefore decreases the percolation rates. Destruction of aggregates andincrease in bulk density may influence the performance of crops following rice, however theevidence for this is inconsistent and inconclusive (Gajri et al.1992; Connor et al. 2002). Animportant question is whether there are gains to be made by moving away from puddling tobetter meet the edaphic requirements of both rice and wheat.
Likewise, much labor and energy are spent in seedbed preparation for wheat. Tillage consists of3 operations: (i) disc harrowing as primary tillage, (ii) tyne harrowing as secondary tillage and(iii) planking to level the land. These operations are performed after burning of rice residuesafter harvest. It is followed by irrigation, tyne harrowing and planking at the time of seed bedpreparation. In some areas, where the period before wheat seeding is short and there is enoughmoisture for germination of wheat, the pre-seeding irrigation is omitted. In general, more than80% of the wheat area in the IGP is tilled (disc or tyne harrowed) more than 4 times followed by2-3 plankings. Recently, however, many farmers, especially in Haryana and in the eastern IGPunder fine-textured soils, have started seeding wheat with no or reduced tillage, with or withoutburning of rice residue. Research efforts are underway to replace the conventional tillagesystems for wheat with zero or reduced tillage, bed farming, surface seeding, etc. in soils orregions appropriate for these methods. Residue retention or incorporation will have to be anintegral component of any future tillage system evolved for the rice-wheat system.
Residue management in rice-wheat systems
Throughout the IGP there is little retention of crop residues in the field – they are eitherharvested for fuel, animal feed or bedding, or are burnt in field. Combine harvesting of rice andwheat is now becoming popular among farmers in western parts of the IGP, which leaves a hugeamount of rice residues in the field. It leaves behind both anchored (40-50 cm high) and loosecrop residues in windrows, which can hinder planting of the following crop. In the Indian Punjaband Haryana provinces, about 90% and 45% of area under rice are harvested by machine,respectively, and rice residue is either completely burnt after use of a shredder, or partially(~45%) burnt (P.R. Gajri , unpublished data, 2002). Under wheat, the machine-harvested area is82% in Punjab, 30% in Haryana, 55% in Tarai UP, and 31% in eastern UP. In the machine-harvested wheat fields a chaff maker is used to collect the chaff for fodder leaving only about 15-20% residue in the field, which is usually disposed of by burning. These estimates show that 10.7Mt of rice residues is burnt in Punjab, 2.7 Mt in Haryana, 0.7 Mt in Uttranchal and 2.1 Mt inEastern UP. Stubble burning is the easiest and cheapest way of removing residues from fields.
Residues are an important source of nutrients and organic matter and should be utilizedefficiently. Though farmers perceive that burning helps control weeds, insects and diseases, itresults in loss of nutrients and active soil C, leading to increased costs and soil structure decline.It also causes pollution leading to global warming and health concerns. Residue incorporationcan increase N tie up and may release phytotoxins causing harmful effects on succeeding crops.These findings will assume greater importance when wheat is grown immediately after rice and

9
with minimal cultivation. However, there is no direct evidence of deleterious effects due tophytotoxins released during rice straw decomposition on the growth and yield of wheat in theIGP. If the straw is ploughed in or is given time to decompose near the soil surface before thenext crop is sown, the risk of damage seems to be much lower. The most viable option is toretain residue in the field and burning should be avoided.
Irrigation management in rice-wheat systems
Rice is kept submerged for a period of 2-4 weeks after transplanting. Submergence helps cropestablishment and weed control. In coarse-textured soils, subsequent irrigations are given everysecond day. This practice saves a substantial amount of water without any negative effects onyield. In Punjab and Haryana, due to scarcity of labor during the transplanting season, farmerstransplant in mid-May when the evaporative demand is very high. This increases the waterrequirement of rice that is met generally using underground water resources. Studies have shownthat high intensity puddling coupled with intermittent flooding and matching of transplantingtime with a lower evaporative demand period increases irrigation efficiency for these areas(Singh et al. 2001). However, alternative soil management options for efficient watermanagement for rice are available. Such options include soil compaction, bed and furrowsystems, and unpuddled direct-seeded rice. Rice grown on beds avoids water required forpuddling, results in uniform application/distribution of water in the field, and should help reduceevaporation.
In the IGP, wheat is generally sown after a pre-seeding irrigation. A total of 3 to 5 irrigations isapplied during the growing season depending upon soil type and rainfall pattern. The firstirrigation to wheat is applied 3-4 weeks after seeding. This irrigation has special significance asit reduces soil strength, promotes root proliferation, and counters water and nutrient stress.Subsequent irrigations are based on the deficit irrigation technique to 0.9 open pan evaporation(Prihar et al. 1974). Irrigation calendars that are available for irrigation scheduling ensureefficient utilization of both the applied and soil-stored water.
Raised bed and furrow irrigation for rice-wheat system
The conventional (flat) system of planting rice and wheat with flood irrigation is a commonpractice in the IGP. Some of the major problems encountered with this system are excessiveleaching loss of nutrients, especially N, and poor aeration. Recent studies have shown that wheatcan be successfully grown on raised beds in various parts of world, including northwest Indiaand northeast Pakistan. The optimum size of beds for wheat in the IGP has been found to be 67.5cm (37.5 cm bed top, 30 cm wide furrows and 15-20 cm high) with two rows (20 cm apart) perbed (S.S.Dhillon, 2000). With bed planting, seed rate and irrigation water requirement can bereduced by about 30% as compared to conventionally tilled flat layouts. This system alsoprovides an option for drilling of fertilizers between two rows of wheat both at sowing and onemonth after sowing. Keeping in view the increasing scarcity of irrigation water and options fordiversification thorough timely planting of crops in the IGP, it has recently been proposed todevelop technology for growing rice and wheat on permanent beds. Shifting rice and wheat fromflats to beds will, however, involve significant changes in the movement and distribution ofwater in the soil profile and will influence N transformations and losses, and fertilizer N-useefficiency. Therefore, it will be worth considering the possible changes in water and N fluxes on

10
raised beds and flats grown to rice and wheat crops in sequence. Such considerations will helpconstruct, calibrate, and validate simulation model(s) for growth, water, and N dynamics for rice-wheat systems on flats and beds.
Possible changes in fluxes of soil water and N, and integrated nutrient management and rice andwheat growth on flats and beds are summarized in Tables 1 and 2. Though generally applicableto the entire IGP of south Asia, they are particularly relevant to coarse- to medium-textured soilsof the Indian Punjab.
Table 1. Possible changes in soil water, nitrogen, and nutrient management, and ricegrowth on flats and beds.
Flats Raised bedsSoil and water management
Puddled TPR or non-puddled DSR Non-puddled:There could be three situations:
a) Permanent consolidated bedsb) Permanent consolidated beds tilled at
edges to facilitate transplantingc) Permanent partially tilled beds
Uncontrolled traffic causing soil compactionand structural deterioration
Controlled traffic in furrows may help structuralregeneration
Flood irrigation Irrigation in the furrows onlyComplete submergence for 15-30 days aftertransplanting followed by intermittent flooding2 days after drainage
Frequent irrigations to keep the furrows wet
Uniform wetting during most part of thegrowing season
Non-uniform wetting in beds and furrowsduring part or most of the growing season
Saturated surface soil during most part of thegrowing season
Unsaturated surface soil on the beds during partor most of the growing season
Unsaturated subsurface water flow in thesubsurface soil
Unsaturated subsurface water flow in thesubsurface soil
Low percolation rates High percolation rates in the furrowsHigh soil water retention and low drainage ratesin the puddled layers
High permeability on bed surface
Almost uniform soil evaporation from the entirearea
Differential evaporation from the beds andfurrows
Crop growthPlant growth generally not limited by waterstress
Plants may suffer water stress
Transplanted rice – generally uniform cropcover
Transplanted rice on edges of the beds – mayhave non uniform crop cover
Uniformly distributed roots down to 40 cmdepth
Non-uniform root growth under beds andfurrows
Adequate weed control through watermanagement, puddling and herbicides
Weeds could be a serious problem

11
Solar radiation interception - generallyuniform, but may lower than on beds
Solar radiation interception- non uniform, butgenerally higher than on flats; cultivardifferences could exist
Nitrogen management*Recommended N dose: 120 kg N ha-1 throughurea in three equal splits at 0, 21 and 42 daysafter transplanting
Rates and dates of application could differ
First N dose through urea:Mixed in the soil during last puddling
1. Urea could be drilled in the center ofrice rows on the beds - should lead todecreased losses of applied N via leaching,volatilization and denitrification ; shouldresult in increased uptake by crop plants
2. Urea could be mixed with surface soil inthe bed - should lead to decreased losses ofapplied N via leaching but increased lossesvia denitrification and ammoniavolatilization; should result in increaseduptake by crop plants
Subsequent N doses through urea:Top dressed before applying irrigation
1. Urea top dressed on beds - - should lead todecreased losses of applied N via leachingbut increased losses via denitrification andammonia volatilization; should result indecreased uptake by crop plants
2. Urea top dressed on beds and furrows - Infurrows, it should lead to increased losses ofapplied N via leaching and denitrification,but decreased losses via ammoniavolatilization; should result in decreaseduptake by crop plants
- In beds, it should lead to decreased lossesof applied N via leaching and denitrificationbut increased losses via ammoniavolatilization; should result in N uptake bycrop plants similar to flats
Other nutrientsNo response to P application when rice followsadequately P fertilized wheat
Rice on beds may respond to P application
Low probability of Fe deficiency High probability of Fe deficiencyIntegrated nutrient management
Technology for green manuring available Technology needs to be worked outTechnology for animal manure managementavailable
Technology needs to be worked out
Crop residue management options available Technology needs to be worked out* Losses of N and crop responses to N will be strongly influenced by soil type and watermanagement
12
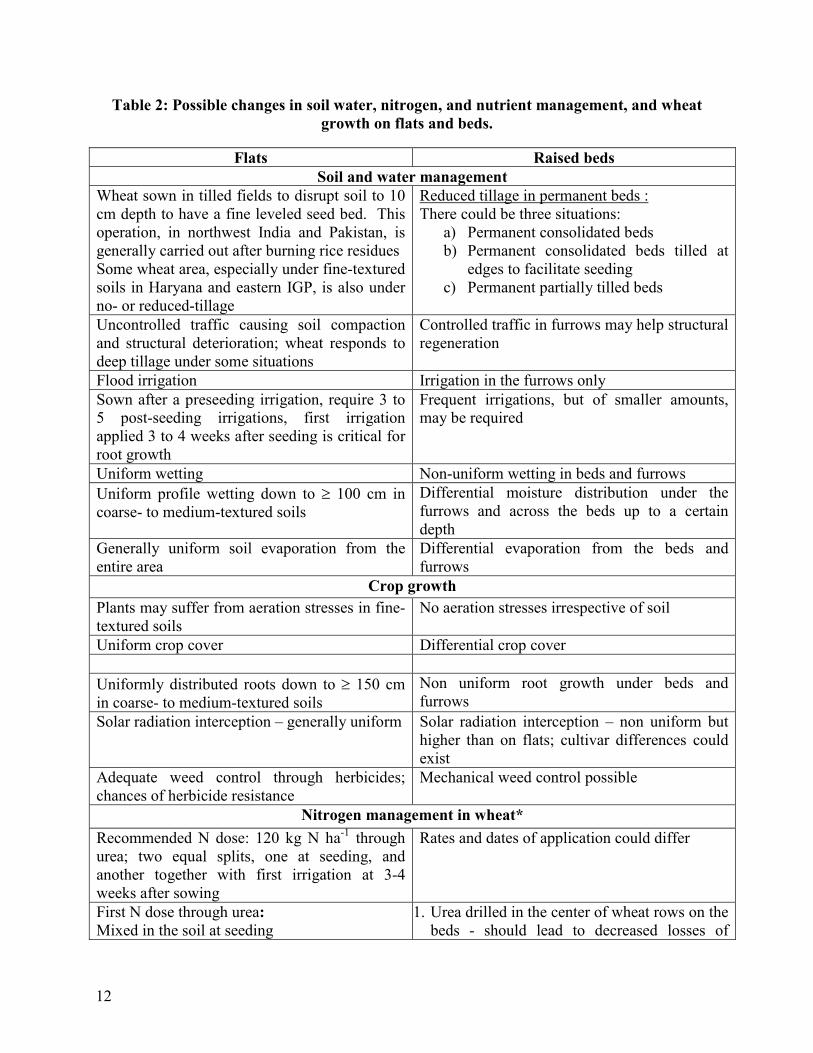
Table 2: Possible changes in soil water, nitrogen, and nutrient management, and wheatgrowth on flats and beds.
Flats Raised bedsSoil and water management
Wheat sown in tilled fields to disrupt soil to 10cm depth to have a fine leveled seed bed. Thisoperation, in northwest India and Pakistan, isgenerally carried out after burning rice residuesSome wheat area, especially under fine-texturedsoils in Haryana and eastern IGP, is also underno- or reduced-tillage
Reduced tillage in permanent beds :There could be three situations:
a) Permanent consolidated bedsb) Permanent consolidated beds tilled at
edges to facilitate seedingc) Permanent partially tilled beds
Uncontrolled traffic causing soil compactionand structural deterioration; wheat responds todeep tillage under some situations
Controlled traffic in furrows may help structuralregeneration
Flood irrigation Irrigation in the furrows onlySown after a preseeding irrigation, require 3 to5 post-seeding irrigations, first irrigationapplied 3 to 4 weeks after seeding is critical forroot growth
Frequent irrigations, but of smaller amounts,may be required
Uniform wetting Non-uniform wetting in beds and furrowsUniform profile wetting down to � 100 cm incoarse- to medium-textured soils
Differential moisture distribution under thefurrows and across the beds up to a certaindepth
Generally uniform soil evaporation from theentire area
Differential evaporation from the beds andfurrows
Crop growthPlants may suffer from aeration stresses in fine-textured soils
No aeration stresses irrespective of soil
Uniform crop cover Differential crop cover
Uniformly distributed roots down to � 150 cmin coarse- to medium-textured soils
Non uniform root growth under beds andfurrows
Solar radiation interception – generally uniform Solar radiation interception – non uniform buthigher than on flats; cultivar differences couldexist
Adequate weed control through herbicides;chances of herbicide resistance
Mechanical weed control possible
Nitrogen management in wheat*Recommended N dose: 120 kg N ha-1 throughurea; two equal splits, one at seeding, andanother together with first irrigation at 3-4weeks after sowing
Rates and dates of application could differ
First N dose through urea:Mixed in the soil at seeding
1. Urea drilled in the center of wheat rows on thebeds - should lead to decreased losses of

13
applied N via leaching, volatilization anddenitrification; should result in increaseduptake by crop plants
2. Urea mixed with surface soil in the bed - -should lead to decreased losses of applied Nvia leaching and denitrification and increasedlosses via ammonia volatilization; should leadto decreased uptake by crop plants
Subsequent N doses through urea:Top dressed before applying irrigation
1. Urea drilled in the center of wheat rows on thebeds - should lead to decreased losses ofapplied N via leaching, volatilization anddenitrification, should lead to increaseduptake by crop plants
2. Urea top dressed on beds - - should lead todecreased losses of applied N via leaching andincreased losses via denitrification andammonia volatilization; should lead todecreased uptake by crop plants
3. Urea top dressed on beds and furrows -should lead to increased losses of applied Nvia leaching and denitrification and decreasedlosses via ammonia volatilization; shouldlead to decreased uptake by crop plants
Other nutrientsDrilling of 26 kg P ha-1 at seeding Amount and method of P application needs to
be worked outPossibility of Mn deficiency in very coarse-textured soils
Possibility of Mn deficiency may decreaseunder bed and furrow system
Integrated nutrient managementCrop residue management options available Technology needs to be worked out.* Losses of N and crop responses to N will be strongly influenced by soil type and watermanagement

14
References
Aulakh MS, Bijay-Singh (1997). Nitrogen losses and N-use efficiency in porous soils. NutrientCycling in Agroecosystems 47, 197-212.
Aulakh MS, Khera TS, Doran JW, Bronson KF (2001). .Denitrification, N2O and CO2 fluxes inrice-wheat cropping system as affected by crop residues, fertilizer N and legume green manure.Biology and Fertility of Soils 34, 375-389.
Bijay-Singh, Sekhon GS (1976). Nitrate pollution of ground water from nitrogen fertilizers andanimal wastes in the Punjab, India. Agriculture and Environment 3, 57-67.
Bijay-Singh, Sadana US, Arora BR (1991). Nitrate pollution of ground water with increasing useof nitrogen fertilizers in Punjab, India. Indian Journal of Environmental Health 33, 516-518.
Connor DJ, Timsina J, Humphreys E (2002). Prospects for permanent beds for rice-wheatsystems. ASA Special Book. ASA-SSSA-CSSA. USA (in press).
Dhillon SS, Hobbs PR, Samra JS (2000). Investigations on bed planting system as an alternativetillage and crop establishment practice for improving wheat yields sustainably. Paper presentedat 15th Conference of International Soil Tillage Research Organisation held at Fortworth, Texas,USA from 2-7 July, 2000.
Fertiliser Association of India (1999). Fertiliser Statistics 1997-98. New Delhi, India: FertiliserAssociation of India. 396 pp.
Gajri PR, Arora VK, Prihar SS (1992). Tillage management for efficient water and nitrogen usein wheat following rice. Soil and Tillage Research 24, 167-182.
Huke R, Huke E (1992). Rice-wheat Atlas of South Asia. IRRI, Los Banos, Philippines.
Katyal JC, Bijay-Singh, Vlek PLG, Buresh RJ (1987). Efficient nitrogen use as affected by ureaapplication and irrigation sequence. Soil Science Society of America Journal 51, 366-370.
Katyal JC, Bijay-Singh, Vlek PLG, Craswell ET (1985). Fate and efficiency of nitrogenfertilizers applied to wetland rice II. Punjab, India. Fertilizer Research 6, 279-290.
Ladha JK, Fischer KS, Hossain M, Hobbs PR, Hardy B (2000). Improving the productivity ofrice-wheat systems of the Indo-Gangetic Plains: A synthesis of NARS-IRRI partnership research.IRRI Discussion Paper No. 40.
Meelu OP, Saggar S, Maskina MS, Rekhi RS (1987). Time and source of nitrogen application inrice and wheat. Journal of Agricultural Sciences, Cambridge 109, 387-391.
Narang RS, Virmani SM (2001). Rice-wheat cropping systems of the Indo-Gangetic plain ofIndia. Rice-Wheat Consortium Pap. Ser. 11. Rice-Wheat Consortium for the Indo-GangeticPlains, New Delhi, India.

15
Prihar SS, Gajri PR, Narang RS (1974). Scheduling irrigation to wheat using pan evaporation.Indian Journal of Agricultural Sciences 44, 567-571.
Singh KB, Gajri PR, Arora VK (2001). Modelling the effect of soil and water managementpractices on water balance and performance of rice. Agricultural Water Management 49, 77-95.
Timsina J, Connor DJ (2001). Productivity and management of rice-wheat systems: issues andchallenges. Field Crops Research 69, 93-132.
Yadav RL, Gangwar KS, Prasad K (1998). Dynamics of Rice-Wheat Cropping Systems in India.Tech. Bull. Project Directorate for Cropping Systems Research, Modipuram, India, 90 pp.
Yadvinder-Singh, Bijay-Singh (2001). Efficient management of primary nutrients in the rice-wheat system. Journal of Crop Production 4, 23-86.

16
17
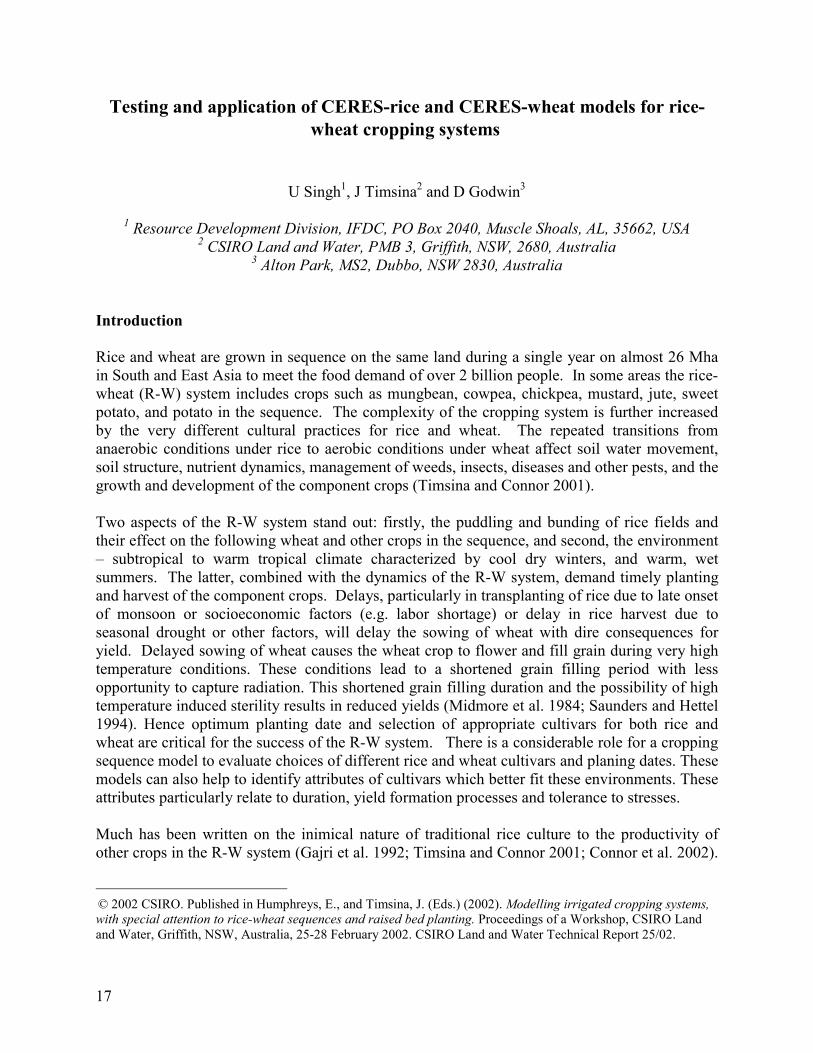
Testing and application of CERES-rice and CERES-wheat models for rice-wheat cropping systems�
U Singh1, J Timsina2 and D Godwin3
1 Resource Development Division, IFDC, PO Box 2040, Muscle Shoals, AL, 35662, USA2 CSIRO Land and Water, PMB 3, Griffith, NSW, 2680, Australia
3 Alton Park, MS2, Dubbo, NSW 2830, Australia
Introduction
Rice and wheat are grown in sequence on the same land during a single year on almost 26 Mhain South and East Asia to meet the food demand of over 2 billion people. In some areas the rice-wheat (R-W) system includes crops such as mungbean, cowpea, chickpea, mustard, jute, sweetpotato, and potato in the sequence. The complexity of the cropping system is further increasedby the very different cultural practices for rice and wheat. The repeated transitions fromanaerobic conditions under rice to aerobic conditions under wheat affect soil water movement,soil structure, nutrient dynamics, management of weeds, insects, diseases and other pests, and thegrowth and development of the component crops (Timsina and Connor 2001).
Two aspects of the R-W system stand out: firstly, the puddling and bunding of rice fields andtheir effect on the following wheat and other crops in the sequence, and second, the environment– subtropical to warm tropical climate characterized by cool dry winters, and warm, wetsummers. The latter, combined with the dynamics of the R-W system, demand timely plantingand harvest of the component crops. Delays, particularly in transplanting of rice due to late onsetof monsoon or socioeconomic factors (e.g. labor shortage) or delay in rice harvest due toseasonal drought or other factors, will delay the sowing of wheat with dire consequences foryield. Delayed sowing of wheat causes the wheat crop to flower and fill grain during very hightemperature conditions. These conditions lead to a shortened grain filling period with lessopportunity to capture radiation. This shortened grain filling duration and the possibility of hightemperature induced sterility results in reduced yields (Midmore et al. 1984; Saunders and Hettel1994). Hence optimum planting date and selection of appropriate cultivars for both rice andwheat are critical for the success of the R-W system. There is a considerable role for a croppingsequence model to evaluate choices of different rice and wheat cultivars and planing dates. Thesemodels can also help to identify attributes of cultivars which better fit these environments. Theseattributes particularly relate to duration, yield formation processes and tolerance to stresses.
Much has been written on the inimical nature of traditional rice culture to the productivity ofother crops in the R-W system (Gajri et al. 1992; Timsina and Connor 2001; Connor et al. 2002).
�© 2002 CSIRO. Published in Humphreys, E., and Timsina, J. (Eds.) (2002). Modelling irrigated cropping systems,with special attention to rice-wheat sequences and raised bed planting. Proceedings of a Workshop, CSIRO Landand Water, Griffith, NSW, Australia, 25-28 February 2002. CSIRO Land and Water Technical Report 25/02.

18
Rice grown using traditional practices of land preparation can be very demanding in its waterrequirement. Water is required for puddling operations prior to establishment of the rice crop.These puddling operations involve destruction of soil structure in the surface layers and theformation of a less permeable layer below the surface The traditional puddled transplanted rice(TPR) culture, however, offers the following benefits: reduced percolation rate, less weed-pressure, optimization of soil pH, improved availability of P, and build-up of organic matter(more carbon sequestered). In addition to more water requirement for land preparation for TPRcompared to that for direct-seeded rice (DSR), TPR may also have higher labour requirement forpuddling and transplanting and, as mentioned above, detrimental effects on other crops followingrice. DSR, however, generally has higher weed pressure. The move from TPR to DSR on raised-bed should not ignore the efficiency of water distribution and application systems.
Changes in rice cultural practices will, to some extent, modify the nature and extent of soilphysical changes and the aerobic-anaerobic-aerobic cycle in puddled versus non-puddled system.The anaerobic-aerobic cycles may occur more frequently under a DSR and raised-bed systemthan with TPR where the soil remains anaerobic most of the time. The need to quantify theseflooding and drying cycles and their impact on water and N dynamics, crop growth, and theenvironment is essential. A dynamic soil-crop model that captures the aboveprocesses/phenomena has benefits in terms of improving our current understanding andidentifying knowledge-gaps, and in illustrating the advantages and tradeoffs associated withmanagement changes both in the short-term and long-term (sustainability). This paper describesthe CERES rice and wheat models and the CROPGRO model under DSSAT (Decision supportsystem for agrotechnology transfer) for simulating rice-wheat sequences as an example ofexisting models that have the capacity to simulate some of the key features of the R-W system.
Model description
The CERES rice and wheat models simulate the growth, development and yield of a componentcrop growing on a uniform area of land under prescribed or simulated management as well as thechanges in soil water, C and N that take place under the cropping system over time. The modelsconsider the effects of weather, genetics, soil water, soil C and N, and management in single ormultiple seasons and in crop rotations at any location where minimum inputs are provided. Theminimum data sets for operation, calibration and validation of rice and wheat models, growneither singly or in sequence, are provided by Hunt and Boote (1994), and are summarized inTable 1.
PhenologyThe phenology component of CERES–Wheat and CERES-Rice has been described elsewhere(Ritchie et al. 1998; Ritchie and NeSmith 1991; Singh 1994). It has been widely tested in adiverse range of environments and has been adopted as the basis for phenology in other cropmodels, eg APSIM–Wheat. The models describe the progress through the crop life cycle using adegree-day accumulation (heat sum). The duration of certain stages varies with cultivars, andcoefficients are used as inputs to describe these differences. In wheat, the duration fromemergence to terminal spikelet formation is influenced by vernalization (chilling requirement)and photoperiod. Cultivars differ in their vernalization requirements and their sensitivity tophotoperiod, and coefficients are used to describe these sensitivities. In rice, a developmental
19
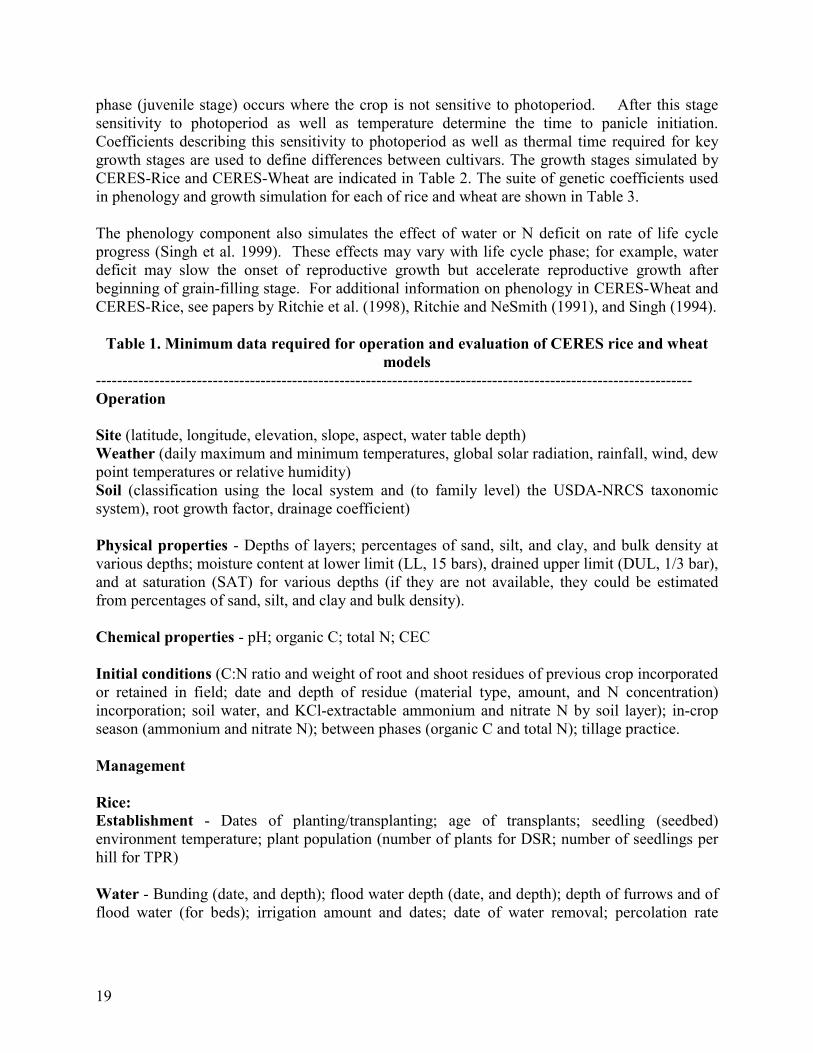
phase (juvenile stage) occurs where the crop is not sensitive to photoperiod. After this stagesensitivity to photoperiod as well as temperature determine the time to panicle initiation.Coefficients describing this sensitivity to photoperiod as well as thermal time required for keygrowth stages are used to define differences between cultivars. The growth stages simulated byCERES-Rice and CERES-Wheat are indicated in Table 2. The suite of genetic coefficients usedin phenology and growth simulation for each of rice and wheat are shown in Table 3.
The phenology component also simulates the effect of water or N deficit on rate of life cycleprogress (Singh et al. 1999). These effects may vary with life cycle phase; for example, waterdeficit may slow the onset of reproductive growth but accelerate reproductive growth afterbeginning of grain-filling stage. For additional information on phenology in CERES-Wheat andCERES-Rice, see papers by Ritchie et al. (1998), Ritchie and NeSmith (1991), and Singh (1994).
Table 1. Minimum data required for operation and evaluation of CERES rice and wheatmodels
-----------------------------------------------------------------------------------------------------------------Operation
Site (latitude, longitude, elevation, slope, aspect, water table depth)Weather (daily maximum and minimum temperatures, global solar radiation, rainfall, wind, dewpoint temperatures or relative humidity)Soil (classification using the local system and (to family level) the USDA-NRCS taxonomicsystem), root growth factor, drainage coefficient)
Physical properties - Depths of layers; percentages of sand, silt, and clay, and bulk density atvarious depths; moisture content at lower limit (LL, 15 bars), drained upper limit (DUL, 1/3 bar),and at saturation (SAT) for various depths (if they are not available, they could be estimatedfrom percentages of sand, silt, and clay and bulk density).
Chemical properties - pH; organic C; total N; CEC
Initial conditions (C:N ratio and weight of root and shoot residues of previous crop incorporatedor retained in field; date and depth of residue (material type, amount, and N concentration)incorporation; soil water, and KCl-extractable ammonium and nitrate N by soil layer); in-cropseason (ammonium and nitrate N); between phases (organic C and total N); tillage practice.
Management
Rice:Establishment - Dates of planting/transplanting; age of transplants; seedling (seedbed)environment temperature; plant population (number of plants for DSR; number of seedlings perhill for TPR)
Water - Bunding (date, and depth); flood water depth (date, and depth); depth of furrows and offlood water (for beds); irrigation amount and dates; date of water removal; percolation rate

20
(beds- from bed surface and furrows); perched water table depth (beds- from bed surface andfurrows)
Others – N fertilizer schedules, source, amount, and depth and placement of incorporation
Wheat:Establishment – Planting date, depth and method, row spacing and direction, plantpopulation
Water and N - Irrigation amount (or depths) and schedules; N fertilizer schedules,source, amount, and depth of incorporation
Calibration and validation (data from separate experiments): All of the above plus:
Phenology (across sowing dates and locations)
Wheat: Date of emergence, 50% flowering, physiological maturity (as identified by nodes andconstant weight of grain), and harvest.
Rice: Date of emergence, PI, 50% heading, 50% flowering, physiological maturity (asidentified by nodes and constant weight of grain), and harvest.
Information on phenology is required for calculation of genetic coefficients (see Table 2).
Performance at harvest (grain and straw yields, panicles or spikes per unit area, grain numberper panicle, grain weight, and N concentrations of grain and straw)
Number of leaves produced in main stem; LAI, canopy dry weight (also leaf, stem, and panicleweight separately), solar radiation interception, and N concentration in above-ground biomass atkey stages such as end of tillering, 50% flowering, and maturity (beds - radiation interception atedges and in centers)
Soil water content at various depths with time (beds - in bed centers and edges, and in furrows;during rice season - depth of water in furrows measured daily and immediately after and beforeirrigation)
Soil nitrate and ammonium content at various depths with time (beds - in bed centers andedges, and in furrows)------------------------------------------------------------------------------------------------------------
Table 2. Growth Stages Simulated by the DSSAT CERES-Rice and Wheat Models
Rice WheatGermination GerminationEmergence Emergence

21
End of JuvenilePanicle Initiation Terminal Spikelet50% Heading End ear growth50% FloweringBeginning grain fill Beginning grain fillMaturity MaturityHarvest Harvest
Table 3. Genetic Coefficients for the DSSAT CERES-Rice and Wheat Models
A. Rice
P1 Time period in growing degree days (base 9oC) from emergence to end of juvenilephase
P2R Photoperiod sensitivity (degree day delay per hour increase in daylength)P2O Critical photoperiod or longest daylength (h) at which development occurs at
maximum rate. At values higher than P2O the development rate is slowed(depending on P2R)
P5 Degree days (base 9oC) from beginning of grain-filling (3-4 d after flowering) tophysiological maturity
G1 Potential spikelet number coefficient as estimated from number of spikelets per gmain culm + spike dry weight at anthesis (#/g)
G2 Single dry grain weight (g) under nonlimiting growing conditionsG3 Tillering coefficient (scalar value) relative to IR64. A higher tillering cultivar will
have values greater than 1G4 Temperature tolerance coefficient. Usually 1.0 for cultivars grown in normal
environment. G4 for japonica type rice grown in warmer environments would be >1.0. Tropical rice grown in cooler environments or season will have G4 < 1.0
PHINT Degree days required for a leaf tip to emerge (phyllochron interval) under idealconditions
B. Wheat
P1D Relative amount development is slowed for photoperiod shorter than optimum (20h)
P1V Relative delay in development rate for each day of unfulfilled vernalizationP5 Relative grain filling duration where each unit increase over zero adds 20 degree
days to an initial value of 430 degree daysG1 Kernel number per unit stem + spike dry weight at anthesis (#/g)G2 Potential kernel growth rate (mg-1 kernel-1day-1)G3 Tiller death coefficient. Standard stem + spike weight when elongation ceases (g)PHINT Thermal time between the appearance of leaf tips

22
GrowthThe models predict daily photosynthesis using the radiation-use efficiency approach as afunction of daily irradiance for a full canopy, which is then multiplied by factors ranging from 0to 1 for light interception, temperature, leaf N status, and water deficit. There are additionaladjustments for CO2 concentration, specific leaf weight, row spacing, and cultivar (Ritchie et al.1998). Growth of new tissues depends on daily available carbohydrate and partitioning todifferent tissues as a function of phenological stage and modified by water deficit and Ndeficiency. Leaf area expansion depends on leaf appearance rate, photosynthesis and specificleaf area. Leaf area expansion is more sensitive to temperature, water deficit, and N stress.During seed fill, N is mobilized from vegetative tissues. As a result, vegetative tissue Nconcentration declines and this in turn lowers photosynthesis and causes leaf senescence toincrease. Protein and carbohydrate mobilized from vegetative tissue contribute to seed growthwhile photosynthesis declines (Godwin and Singh 1998). Cultivar differences in yieldcomponents, tillering, and temperature tolerance are captured by the model using a suite ofcoefficients specific to a cultivar.
Water balanceThe soil water balance model developed for CERES-Wheat has been adapted by all of theDSSAT v3.5 crop models (Ritchie 1998). This one-dimensional model computes the dailychanges in soil water content by soil layer due to infiltration of rainfall and irrigation, verticaldrainage, unsaturated flow, soil evaporation, plant transpiration, and root water uptake processes.The soil has parameters that describe its surface conditions and layer-by-layer soil water holdingand conductivity characteristics. The model uses a “tipping bucket” approach for computing soilwater drainage when a layer’s water content is above a drained upper limit parameter.
Drainage of water through the profile is first calculated based on an overall soil drainageparameter assumed to be constant with depth. The amount of water passing through any layer isthen compared with the saturated hydraulic conductivity of that layer. If the saturated hydraulicconductivity of any layer is less than computed vertical drainage through that layer, actualdrainage is limited to the conductivity value, and water accumulates above that layer. Thisfeature allows the model to simulate poorly drained soils and perched water tables.
CERES-Rice adds to this the simulated effect of the presence of a bund. Floodwater depth,runoff (when floodwater depth exceeds bund height) and evaporation from floodwater aresimulated. The model also simulates the effect of changes in percolation rate and bulk densityassociated with puddling and the reversion to a non-puddled state. The components of the modelto describe puddling effects are rudimentary and would require further work to determine howwell they would work in the coarsely textured soils of NW India.
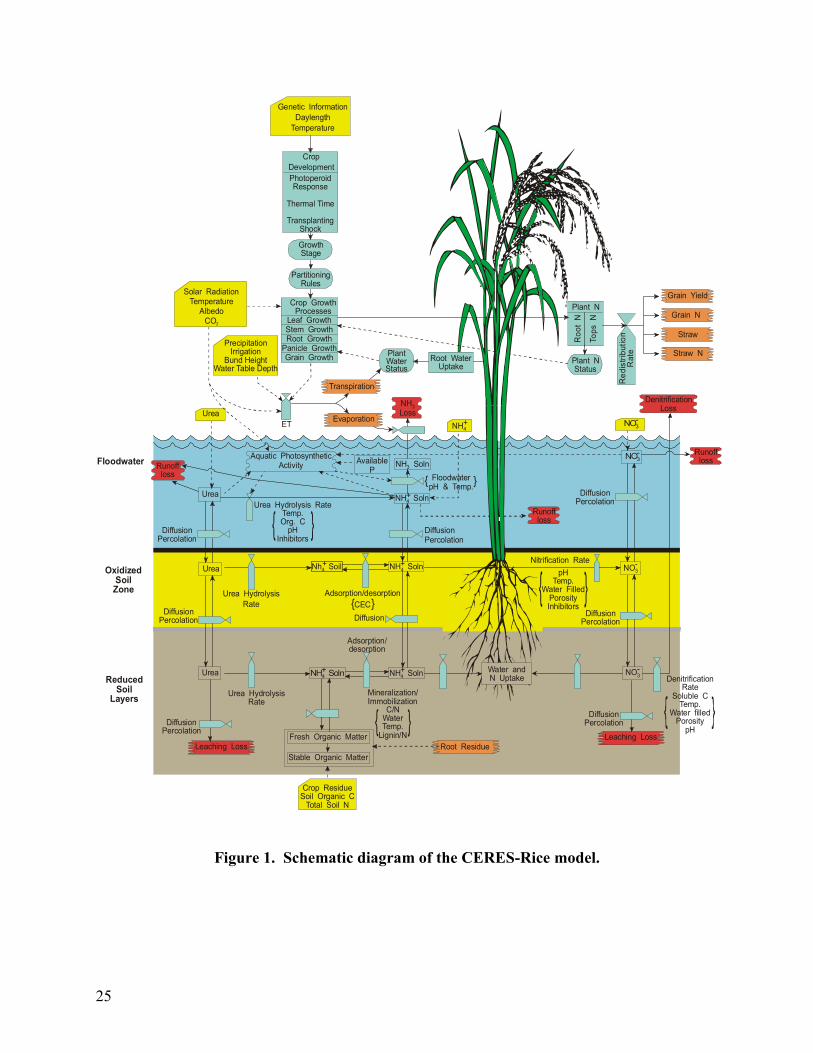
Soil organic mater and nitrogen dynamicsDSSAT has two options to simulate the soil organic matter (SOM) and N balance. First, theoriginal SOM model in DSSAT v3.5 (Godwin and Jones 1991; Godwin and Singh 1998) andsecond, the SOM module developed by Gijsman et al. (2002), based on the CENTURY model(Parton et al. 1988, 1994). The CENTURY-based module (i) divides the SOM into morefractions, each of which has a variable C:N ratio and can mineralize or immobilize nutrients, (ii)

23
has a residue layer on top of the soil, and (iii) considers a texture dependent decomposition rate.In addition, the N module simulates hydrolysis of urea, nitrification, ammonia volatilization, Nleaching, denitrification, algal activity and floodwater pH changes, plant N uptake, grain Ndynamics, and plant N stress indices (Figure 1). The floodwater N chemistry component of themodel (Godwin and Singh 1991, 1998) uses an hourly time step to calculate rapid Ntransformations and to update soil-floodwater-atmosphere equilibria. The water and Nsubmodels can simulate water and N balances under fully irrigated flooded conditions, rainfedconditions where rice is alternately inundated and dry, and fully upland conditions where the soilis never flooded (Singh 1994).
Global climate change simulation
Rice-wheat cropping systems may be profoundly impacted by the effects of global climatechanges. Raised temperatures could markedly affect duration of key processes in the crop lifecycle as well as the rates at which key growth processes such as photosynthesis and leafexpansion proceed. In addition, raised levels of CO2 will affect certain growth processes. TheDSSAT/CERES models have been used in a variety of climate change studies and thus haveappropriate linkages built into the growth and water balance routines to readily examine climatechange scenarios. Details of the changes involved in the models and the resulting simulationsfor a range of climate change scenarios are described in Rosenzweig and Iglesias (1994). Ofparticular relevance to the R-W project are the simulated impacts of climate change on wheatproduction as reported by Rao and Sinha (1994) using CERES Wheat. In all simulations withprojected future climates wheat yields were smaller than for those in the current climate. Inthese cases the beneficial effects of raised CO2 on crop yield were outweighed by yieldreductions associated with a shortening of the wheat growing season resulting from projectedtemperature increases. Karim et al (1994) used CERES Rice in a similar study in Bangladeshand found similar results for rice. Timsina et al. (1997) also used CERES rice, wheat, and maizemodels for predicting the effects of climate change (temperature, CO2, and solar radiation) onthe productivity of rice, wheat, and maize in terai and hills of Nepal. More recent study on thevulnerability of rice and wheat yields in NW India due to future changes in climate has beenconducted by Lal et al (1998) using CERES Rice and CERES Wheat. These studies pointed outthe implications of changed climate scenarios for the water requirements of both crops. CERESrice has also been used as a basis for constructing a model of methane emissions (MERES) fromrice fields in Asia (Matthews et al. 2000).
Validation of CERES-Wheat and CERES-Rice
Both models have been in existence for some years now and have been the subject of continuousevaluation. Earlier testing of CERES-Wheat across many locations in the world has beenreported by Otter-Nacke et al. (1986). Similar though less extensive testing of CERES-Rice hasbeen reported by Godwin et al (1990) and Singh (1994). Hundal and Prabhjyot-Kaur (1997)have evaluated CERES-wheat using eight years of field experiments in Ludhiana. They foundthat the model was able to predict anthesis dates within –9 to + 6 days and for physiologicalmaturity within –6 to +3 days. Simulation of yield and yield components across a range ofexperimental treatments where observed grain yield varied from 3.0 to 5.2 t/ha. Additionaltesting of CERES rice in Kerala, India has been reported by Saseendran et al (1998), in Thailand
24
by Jintrawet (1994), and in Australia before and after inclusion of a routine to simulate theeffects of cold damage by Godwin et al. (1994). Additional examples of testing for wheat inthe rice growing regions of Australia are presented in these proceedings (Godwin et al. 2002).
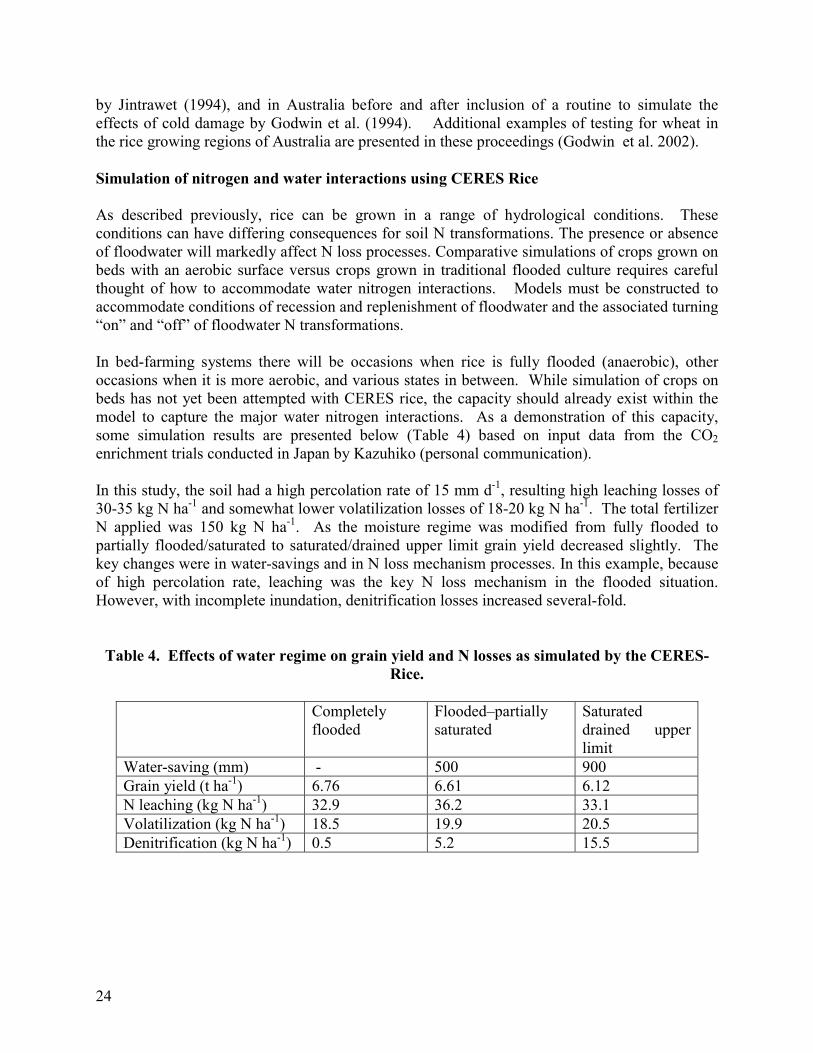
Simulation of nitrogen and water interactions using CERES Rice
As described previously, rice can be grown in a range of hydrological conditions. Theseconditions can have differing consequences for soil N transformations. The presence or absenceof floodwater will markedly affect N loss processes. Comparative simulations of crops grown onbeds with an aerobic surface versus crops grown in traditional flooded culture requires carefulthought of how to accommodate water nitrogen interactions. Models must be constructed toaccommodate conditions of recession and replenishment of floodwater and the associated turning“on” and “off” of floodwater N transformations.
In bed-farming systems there will be occasions when rice is fully flooded (anaerobic), otheroccasions when it is more aerobic, and various states in between. While simulation of crops onbeds has not yet been attempted with CERES rice, the capacity should already exist within themodel to capture the major water nitrogen interactions. As a demonstration of this capacity,some simulation results are presented below (Table 4) based on input data from the CO2enrichment trials conducted in Japan by Kazuhiko (personal communication).
In this study, the soil had a high percolation rate of 15 mm d-1, resulting high leaching losses of30-35 kg N ha-1 and somewhat lower volatilization losses of 18-20 kg N ha-1. The total fertilizerN applied was 150 kg N ha-1. As the moisture regime was modified from fully flooded topartially flooded/saturated to saturated/drained upper limit grain yield decreased slightly. Thekey changes were in water-savings and in N loss mechanism processes. In this example, becauseof high percolation rate, leaching was the key N loss mechanism in the flooded situation.However, with incomplete inundation, denitrification losses increased several-fold.
Table 4. Effects of water regime on grain yield and N losses as simulated by the CERES-Rice.
Completelyflooded
Flooded–partiallysaturated
Saturateddrained upperlimit
Water-saving (mm) - 500 900Grain yield (t ha-1) 6.76 6.61 6.12N leaching (kg N ha-1) 32.9 36.2 33.1Volatilization (kg N ha-1) 18.5 19.9 20.5Denitrification (kg N ha-1) 0.5 5.2 15.5
25
CropDevelopmentPhotoperoidResponse
Thermal Time
TransplantingShock
Crop GrowthProcesses
Leaf GrowthStem GrowthRoot Growth
Panicle GrowthGrain Growth
PartitioningRules
PlantWaterStatus
GrowthStage
Genetic InformationDaylength
Temperature
Solar RadiationTemperature
AlbedoCO2
PrecipitationIrrigation
Bund HeightWater Table Depth
Urea
Urea
Urea
Urea
Runoffloss
Aquatic PhotosyntheticActivity
Evaporation
Transpiration
NHLoss
3
AvailableP
NH Soln3
NH Soln4
NH Soln4
NH Soln4
Nh Soil4
+
+
+NH Soln4+
+
{
{
}
}
DiffusionPercolation
Adsorption/desorptionCECDiffusion
Adsorption/desorption
Mineralization/Immobilization
C/NWaterTemp.
Lignin/NFresh Organic Matter
Stable Organic MatterRoot Residue
Water andN Uptake
Urea Hydrolysis RateTemp.Org. C
pHInhibitors
DiffusionPercolation
DiffusionPercolation
DiffusionPercolation
Urea HydrolysisRate
Urea HydrolysisRate
Leaching Loss
Runoffloss
DiffusionPercolation
DiffusionPercolation
DiffusionPercolation
Leaching Loss
Floodwater
OxidizedSoilZone
ReducedSoil
Layers
NO3
NO3
-
NO3-
NO3-
-
Nitrification Rate
DenitrificationRate
Soluble CTemp.
Water filledPorosity
pH
Plant N
Roo
t N
Tops
N
Plant NStatus
Grain Yield
Red
istri
butio
nR
ate
ET
Root WaterUptake
NH4+
pHTemp.
Water FilledPorosityInhibitors
DenitrificationLoss
Grain N
Straw
Straw N
FloodwaterpH & Temp.
Runoffloss
Crop ResidueSoil Organic C
Total Soil N
Figure 1. Schematic diagram of the CERES-Rice model.

26
Rice-wheat sequence
In the sequence mode of DSSAT 3.5, water, N, C, and other soil balances are simulated as acontinuum, and rice, wheat, fallow (using CROPGRO) and other crops can be simulated acrossmultiple years. One of the key features of the sequence application is quantification of the long-term changes in soil properties as a function of various crop sequence strategies. A sequence ofobserved historical weather data must be used when evaluating the performance of the modelswith data from long-term cropping sequence experiments (LTEs). For example, the sequentialmode of DSSAT3.5 has been evaluated using data from a long-term R-W experiment fromPantnagar, India (Timsina et al. 1995, 1996). In this case, the weather conditions observedduring the LTE period and the actual crop management practices were used as inputs forvalidating the R-W sequence model (Figure 2), but long-term generated weather data were usedin simulating the long-term behaviour of the sequence (see Timsina et al. 1996).
The simulated yield trends in the LTE exhibited a declining trend, though not significant, for riceat both zero-N (Fig. 2) and 120 kg N ha-1 rates (data not shown). In contrast, the simulatedwheat yield trend showed significant increases over the 15-year period at both N rates. Thisexample illustrates the complexity of the R-W system where various factors including N rates aswell as irrigation management, planting dates, choice of cultivars, etc. influenced rice and wheatyields in the sequence (Timsina et al. 1995, 1996). The CERES rice and wheat models have alsobeen validated and applied for R-W sequences in Bangladesh (Timsina et al. 1998; Timsina andGodwin 2002).
To capture the interaction of weather with crops in any sequence and to evaluate different cropmanagement scenarios, for example, to look at the effect of late transplanting date on rice andwheat yields in a R-W sequence one must use generated weather. A weather generator using adifferent “seed” or random number has to be used at the start of each sequence of weather years.For example, as shown in Fig. 3, for a 20-year maize-maize or mucuna-maize rotation with 5replicates of weather sequence, a new random number will be used at the start of the trial– year“1990”, for each of the 5 replicates. The “replication” helps capture the variability associatedwith weather. The results indicate that for a coastal savanna region of West Africa, a singlelonger duration maize crop in rotation with mucuna yields similar to two maize crops withsimilar inputs of mineral fertilizers. The weather-related risks are also similar (Fig. 3). Thechoice of system by farmers will depend on storage of grain, stability of prices, other workopportunities, additional benefits of mucuna, etc. The modeling provided crucial information –that both systems are technically feasible.

27
Rice without N fertilizer
Years
1978 1980 1982 1984 1986 1988 1990 1992 1994
Gra
in y
ield
(t h
a-1)
0
1
2
3
4
5
Trend: Y = 2.32 - 0.018X r = 0.15ns
Observed RMSE = 0.68Simulated
Wheat without N fertilizer
Years
1978 1980 1982 1984 1986 1988 1990 1992 1994
Gra
in y
ield
(t h
a-1)
0
1
2
3
4
5
Observed RMSE = 0.52Trend: Y = 1.96 + 0.08X r = 0.61*Simulated
Figure 2. Observed and simulated yield trends for rice-wheat sequence at Pantnagar, India.

28
Generated Weather "Year"
1990 1995 2000 2005 2010
Mea
n G
rain
Yie
ld (k
gha-
1 )
1000
2000
3000
4000
5000
6000
7000
8000
1990 1995 2000 2005 2010
Standard Deviation
A. Maize-Maize (Ikene) B. Mucuna-Maize (Podzarika)
Figure 3. Comparison of cumulative ( 2-season) grain yield with maize-maize croppingsequence (cultivar-Ikene) versus 1-season yield from mucuna-maize system (cultivar-
Podzarika).
Soil Water Content
Rat
e M
odifi
er
0.0
0.2
0.4
0.6
0.8
1.0
Mineralization
Denitrification
Nitrification
Saturated
Urea Hydrolysis
DrainUpper Limit
LowerLimit
Air Dry
Figure 4. Rate modifiers for N transformation processes as function of soil moisture content(Adapted from Godwin and Singh 1998).

29
Conclusions
Increase in productivity, evaluating stability of current and proposed technologies, andquantifying sustainability are issues facing researchers, policymakers, and farmers operating theR-W system. While there are no single mechanisms or tools – a combination of crop simulationmodels, focused field experimentation, and thorough evaluation of past LTEs, offer the bestoption for tackling the above issues. Many resources (time, cost, effort, etc.) can be saved byusing existing models that are capable of simulating the key bio-physical processes (water, C andN dynamics) in the R-W system. The CERES rice and wheat models under DSSAT have beentested and applied for an LTE on a R-W sequence in India and also have been tested and appliedin Bangladesh. There has been widespread testing of the rice and wheat models for single crops.With the recent modifications to the model, improved capabilities exist to simulate long-termchanges in SOM pools.
The tradeoffs and gains associated with any management strategy must be carefully evaluatedand validated before it is implemented. It is envisaged that the CERES models, with additionalvalidations for the R-W system, would allow reliable quantification of C, N and water balances,and grain yields under a wide range of environmental and management scenarios. Efforts, thus,should be continued in collation and generation of critical and good quality data from the R-Wsystem to enable the calibration and validation of models for sequences.
References
Connor DJ, Timsina J, Humphreys E (2002). Prospects of permanent beds in rice-wheat systems.Improving the productivity and sustainability of rice-wheat system: issues and impact. ASASpecial Book. ASA, CSSA, SSSA Publication, USA (in Press).
Gajri PR, Arora VK, Prihar SS (1992). Tillage management for efficient water and nitrogen usein wheat following rice. Soil Tillage Research. 24, 167-182.
Gijsman AJ, Hoogenboom G, Parton WJ, Kerridge PC (2002). Modifying DSSAT for low-inputagricultural systems, using a SOM/residue module from CENTURY. Agronomy J. 94(3), 462-474.
Godwin D, Jones CA (1991). Nitrogen dynamics in soil-crop systems. Pages 287-321. In HanksRJ, Ritchie JT (Eds.) ‘Modeling plant and soil systems’. Agronomy Monograph 31, AmericanSociety of Agronomy, Madison, Wisconsin, USA.
Godwin D, Singh U (1991). Modelling nitrogen dynamics in rice cropping systems. Pages 287-294. In Deturck P, Ponnamperuma FN (Eds.) ‘Rice production on acid soils of the tropics’.Institute of Fundamental Studies, Kandy, Sri Lanka.
Godwin D, Singh U (1998). Nitrogen balance and crop response to nitrogen in upland andlowland cropping systems. Pages 55-78. In Tsuji GY, Hoogenboom G, Thornton PK (Eds)‘Understanding options for agricultural production’. Kluwer Academic Publishers, Dordrecht,The Netherlands.

30
Godwin, D, Humphreys, E, Smith, D, Timsina, J, Xevi, E, Meyer, W (2002). Application ofSWAGMAN� Destiny to rice-wheat cropping systems. Pages 69-82, In: Humphreys, E,Timsina, J (Eds.), Modelling irrigated cropping systems, with special attention to rice-wheatsequences and raised bed planting. Proceedings of a workshop held at CSIRO Land and Water,Griffith on 25-28 February 2002. Griffith, NSW 2680, Australia.
Hundal, S.S., Prabhjyot-Kaur (1997). Application of the CERES-Wheat model to yieldpredictions in the Irrigated plains of the Indian Punjab. J. Agric. Sci., Cambridge 129, 13-18.
Hunt LA, Boote KJ (1994). Data for model operation, calibration, and validation. In: IBSNAT: asystem approach to research and decision making. Tsuji, G.Y., Hoogenboom, G., Thornton, P.K.(eds.). University of Hawaii. Honolulu, Hawaii, USA.
Jintrawet, A (1995). A decision support system for rapid assessment of lowland rice-basedcropping alternatives in Thailand. Agric. Systems 47, 245-258.
Karim, Z, Ahmed, M, Hussain, SG, Rashid, KB (1994). Impact of climate change on theproduction of modern rice in Bangladesh. In: Rosenzweig, C., Iglesias, A. (Eds.), Implications ofclimate change for international agriculture: crop modelling study. US Environmental ProtectionAgency. EPA 230-B-94-003, Washington DC.
Lal, M, Singh, KK, Rathore, LS, Srinivasan, G, Saseendran, SA (1998). Vulnerability of rice andwheat yields in NW India to future changes in climate. Agricultural and Forest Meterology 89,101-114.
Mathews, RB, Wassmann, R, Arah, J (2000). Using a crop/soil simulation model and GIStechniques to assess methane emissions from rice fields in Asia. I. Model development. NutrientCycling in Agroecosystems. 58, 141-159.
Midmore DJ, Cartwright PM, Fischer RA (1984). Wheat in tropical environments. II. Cropgrowth and grain yield. Field Crops Research. 8, 207-277.
Otter-Nacke, S, Godwin, D, Ritchie, JT (1986). Testing and validating the CERES-Wheat modelin diverse environments. IFDC, Muscle Shoals, Alabama, USA.
Parton WJ, Stewart JWB, Cole CV (1988). Dynamics of C, N, P and S in grassland soils: amodel. Biogeochemistry. 5,109-131.
Parton WJ, Ojima DS, Cole CV, Schimel DS (1994). A general model for soil organic matterdynamics: sensitivity to litter chemistry, texture and management. Pages 147-167. In Bryant RB,Arnold RW (Eds.) ‘Quantitative modeling of soil forming processes’. Special Publication 39.SSSA, Madison, WI.
Rao, D, Sinha, SK (1994). Impact of climate change on simulated wheat production in India. In:Rosenzweig, C, Iglesias, A (Eds.) (1994). Implications of climate change for international

31
agriculture: crop modelling study. US Environmental Protection Agency. EPA 230-B-94-003,Washington DC.
Ritchie JT (1998). Soil water balance and plant stress. Pages 41-54. In Tsuji GY, HoogenboomG, Thornton PK (Eds) ‘Understanding options for agricultural production’. Kluwer AcademicPublishers, Dordrecht, The Netherlands.
Ritchie JT, NeSmith DS (1991). Temperature and crop development. Pages 5-29. In Hanks RJ,Ritchie JT (Eds.) ‘Modeling plant and soil systems’. Agronomy Monograph 31, AmericanSociety of Agronomy, Madison, Wisconsin, USA.
Ritchie, JT, Singh U, Godwin D, Bowen WT (1998). Cereal growth, development, and yield.Pages 79-98. In Tsuji GY, Hoogenboom G, Thornton PK (Eds) ‘Understanding options foragricultural production’. Kluwer Academic Publishers, Dordrecht, The Netherlands.
Rosenzweig, C, Iglesias, A (Eds.) (1994). Implications of climate change for internationalagriculture: crop modelling study. US Environmental Protection Agency. EPA 230-B-94-003,Washington DC.
Saseendran, SA, Singh, KK, Rathore, LS, Rao, GSLHVP, Mendiratta, N, Lakshmi Narayan, K,Singh, SV (1998). Evaluation of the CERES-Rice version 3.0 model for the climate conditions ofthe state of Kerala, India. Meterol. Appl. 5, 385-392.
Saunders DA, Hettel GP (1994). Wheat in heat-stressed environments: Irrigated, dry areas andrice-wheat farming systems. CIMMYT, Mexico DF. 402 pp.
Singh U (1994). Nitrogen management strategies for lowland rice cropping systems. Pages 110-130. In ‘Proceedings of the International Conference on Fertilizer Usage in the Tropics(FERTROP)’. Malaysian Society of Soil Science, Kuala Lumpur, Malaysia.
Singh U, Wilkens PW, Chude V, Oikeh S (1999). Predicting the effect of nitrogen deficiency oncrop growth duration and yield. Pages 1379-1393. In ‘Proceedings of the Fourth InternationalConference on Precision Agriculture’. ASA-CSSA-SSSA, Madison, Wisconsin, USA.
Timsina J, Connor DJ (2001). Productivity and management of rice-wheat cropping systems:issues and challenges. Field Crops Research. 69, 93-132.
Timsina, J, Godwin D (2002). Testing and applications of CERES rice and wheat models forrice-wheat sequences of Bangladesh. Agric. Syst. (in preparation).
Timsina J, Singh U, Singh, Y, and Lansigan, F P (1995). Addressing sustainability of rice-wheatsystems: testing and applications of CERES and SUCROS models. pp. 633-656. In: Proc. Int.Rice Res. Conf. 13-17 Feb. 1995. IRRI, Los Banos, Philippines.
Timsina J, Singh U, Singh Y (1996). Addressing sustainability of rice-wheat systems: analysis oflong-term experimentation and simulation. pp. 383-397, In: Kropff et al. (Eds.) ‘Applications of

32
systems approaches at the field level’. Kluwer Academic Publishers, Dordrecht, TheNetherlands.
Timsina, J, Adhikari, B, Ganesh-KC (1997). Modelling and simulation of rice, wheat, and maizecrops for selected sites and the potential effects of climate change on their productivity in Nepal.Consultancy Report submitted to Ministry of Agriculture, Harihar Bhawan, Kathmandu, Nepal.55 pp.
Timsina J, Singh U, Badaruddin M, Meisner C (1998). Cultivar, nitrogen, and moisture effectson a rice-wheat sequence: experimentation and simulation. Agronomy Journal. 90, 119-130.
33
Modelling growth and development of wheat and rice in APSIM�
M J Robertson and S N Lisson
CSIRO Sustainable Ecosystems, 120 Meiers Rd, Indooroopilly, Queensland 4068, Australia
Introduction
APSIM contains a comprehensive array of modules for simulating growth, development andyield of crops, pastures and forests and their interactions with the soil. Currently crop modulesare available for barley, canola, chickpea, cotton, cowpea, hemp, fababean, lupin, maize, millet,mucuna, mungbean, navybean, peanut, pigeonpea, sorghum, soybean, sunflower, wheat andsugarcane. In addition there are general modules for forest, pasture and weed as well as specificimplementations for the pasture species lucerne and stylo. Citation details for these modules areprovided where available in Table 1 of Keating et al. (2002). The scientific bases of simulationapproaches employed for all functional components are included in module documentation onthe APSIM website (www.apsim-help.tag.csiro.au). In the majority of cases these sciencedocuments include information on module performance against observed data.
The plant modules simulate key underpinning physiological processes and operate on a dailytime step in response to input daily weather data, soil characteristics and crop managementactions. The crop modules have evolved from early versions for focus crops such as maize,peanut, sorghum and sunflower. The initial crop modules of APSIM utilised concepts fromexisting models available at the time and added concept enhancements from local research toimprove existing models as required. The on-going development of crop modules in APSIM hasattempted to balance support from scientific understanding with the pragmatics of requirementsfor prediction in applications and the regulatory framework of sound software engineeringpractice.
Currently in APSIM, all plant species use the same physiological principles to capture resourcesand use these resources to grow. The main differences are the thresholds and shapes of theirresponse functions. Descriptions of these processes are covered by Wang et al. (2002). Many ofthese processes have been coded into sub-routines in a process library, held in a stand-alonemodule, which individual crops can call. The routines in the library are structured in separateblocks corresponding to the crop model components of phenology, biomass, canopy, rootsystem, senescence pools, water, nitrogen and phosphorus. The sub-modules contain the scienceand understanding needed to simulate major functional components of crop growth anddevelopment. Crop ontogeny is simulated via relationships defining observed responses totemperature and photoperiod. Leaf area production and senescence is simulated via relationshipsof leaf initiation rate, leaf appearance rate and plant leaf area with temperature. Potential crop
�© 2002 CSIRO. Published in Humphreys, E., and Timsina, J. (Eds.) (2002). Modelling irrigated cropping systems,with special attention to rice-wheat sequences and raised bed planting. Proceedings of a Workshop, CSIRO Landand Water, Griffith, NSW, Australia, 25-28 February 2002. CSIRO Land and Water Technical Report 25/02.

34
water uptake is simulated via relationships with root exploration and extraction potential, whichdepends on soil and crop factors. All coefficients for general crop responses and crop/cultivarspecific coefficients are stored external to the code to allow ease of use and transition acrosscrops/cultivars. The process library includes a number of options for modelling specificfunctions and processes, which have been drawn from a range of existing crop models. Theability to switch between optional processes within sub-modules or between optional entire sub-modules facilitates logical comparative analysis of modelling approaches. The process libraryhas substantially reduced the amount of code needed for simulating multiple crops, resulting ingreater transparency, more robust code with lower maintenance costs.
Externalised constants and parameters from the code are stored in crop parameter files. Each fileis considered as crop species-specific. It consists of two major parts: crop-specific constants andcultivar-specific parameters. Within some individual crop species the category of a “crop class”has been developed. The crop class represents a category of crop below that of the species and isdistinctly different enough to justify a separate parameter section. The separation of code andparameters makes it easy to re-parameterise an existing module for a new crop with few sourcecode changes and significantly accelerates testing and validation procedures.
Wheat modeling in APSIM
The wheat module was developed from a combination of the approaches used in the NWHEAT(Keating et al. 2001) and I-WHEAT (Meinke et al. 1998) models of wheat. NWHEAT was aderivative of CERES-Wheat (Otter-Nacke et al. 1986), while I_WHEAT has features of themodel of Sinclair and Amir (1992). Both models shared the same routines for phenologicaldevelopment, and had similar approaches for biomass accumulation. A derivative of NWHEAThas been extensively validated in Western Australia (Asseng et al. 1998a,b) and in otherenvironments around the world (Asseng et al. 2000).
APSIM-Wheat was created using approaches for different crop growth processes taken fromNWHEAT, I-WHEAT and in some case entirely new approaches were adopted where it wasthought that the existing approaches in either model were not suitable. In some cases theseapproaches already exist in the APSIM crop library and are used by many of the other cropmodules.
The wheat module has been validated against a wide range of data sets varying in water and Nsupply, locations and soil types. Main regions for testing have been the NE Australian wheatbelt and the West Australia wheat belt, although there has been testing in selected internationalenvironments (Fig. 1).
Development of the Rice module
Two parallel ACIAR (Australian Centre for International Agricultural Research) projects(‘Prospects for improved integration of high quality forages in the crop-livestock systems ofSulawesi, Indonesia’ and, ‘Optimising crop-livestock systems in west Nusa Tenggara Province,Indonesia’) have recently commenced in Indonesia involving the use of an integrated modelingapproach to investigate the biophysical, economic and social implications of changes in forageand livestock related farming practice. A key requirement of these projects is a farming systems
35
model that can simulate the growth, development and yield of a range of crops and forages (newand existing), residue and soil related processes, the interactions between these processes and,the responses to climate and management inputs. One shortcoming with APSIM is that it doesnot have a crop module for rice, the dominant annual crop in the mixed crop-livestock systems ofboth Sulawesi and Sumbawa (where the projects are based). This provided the impetus for thedevelopment of a rice growth and development model for use within the APSIM framework.
It was decided that APSIM Rice should be developed in two stages in order to address both theshort-term objectives of the above ACIAR projects, as well as the long-term strategic interests ofthe APSRU group (the developers and owners of APSIM).
The above-mentioned ACIAR projects are of comparatively short duration (2 and 3 yearsrespectively). Consequently, there is a need to develop a functioning APSIM Rice module in ashort period of time, but with adequate performance under the range of growing conditions likelyto prevail in the project locations. While it may be feasible to modify one of the many existingrice models to be compatible with APSIM, a more efficient approach is to take an existingmodule for a ‘like’ crop within the current APSIM crop library and re-parameterise it torepresent the crop of interest. The suitability of this approach is based on the substantialphysiological similarity between the template and new crop, and is amply demonstrated by thecurrent suite of APSIM legume modules developed from a common legume template. With thisin mind, it was decided to use APSIM Wheat as a template for the rice model. The methodinvolved re-parameterising the template using published and unpublished data for rice. Valuesfor those parameters which couldn’t be found in the literature were set through calibrationagainst ‘quality’ datasets. Datasets from a range of irrigation treatments (upland and lowland,irrigated and rainfed) conducted in central and southeast Queensland were used for this purpose.
It is also recognized that there are long-term strategic advantages in having a more robust andwidely applicable rice modeling capability within APSIM. The second stage will aim to build onand improve the first version and will clearly involve a more substantial investment in terms ofmodel development and testing. The intention in this second stage is to construct APSIM Ricefrom a library of sub-routines that are most appropriate for simulating rice growth anddevelopment, as opposed to just using wheat sub-routines (as in Stage 1). This provides moreflexibility in model construction and allows for incorporation of the most appropriate simulationmethodologies. It also enables the inclusion of new rice specific sub-routines e.g. the impact oftransplanting on growth and development.

36
Figure 1: Agreement between observed and simulated crop attributes for datasets fromQueensland and northern NSW (upper 6 panels) and West Australia (lower 6 panels).
Biomass
y = 0.9509x - 4.6858R2 = 0.9119
0
500
1000
1500
2000
2500
0 500 1000 1500 2000 2500Obs erved
Grain DM
y = 1.048x - 56.292R2 = 0.8557
0
200
400
600
800
1000
0 200 400 600 800 1000Obs erved
LAI_MAX
y = 0.9706x + 0.2299R2 = 0.905
0123456789
0 1 2 3 4 5 6 7 8 9Obs erved
Biomass_N
y = 0.8823x + 0.2521R2 = 0.8961
0
5
10
15
20
25
30
0 5 10 15 20 25 30Obs erved
Grain_N
y = 0.9371x - 0.7459R2 = 0.8607
0
5
10
15
20
25
0 5 10 15 20 25Obs erved
Grain No
y = 0.9806x + 2511.8R2 = 0.8499
0
5000
10000
15000
20000
25000
30000
0 5000 10000 15000 20000 25000 30000Obs erved
Grain Protein (%)y = 0.6073x + 4.5193
R2 = 0.322
7
9
11
13
15
17
7 8 9 10 11 12 13 14 15 16 17
Observed
Pred
icte
d
Grain Number (1000 grains/m2)
y = 0.6574x + 3.4301R2 = 0.3532
0
5
10
15
0 5 10 15Observed
Pred
icte
d
total N (kg/ha)
y = 1.043x - 8.6737R2 = 0.8179
0
20
40
60
80
100
120
0 20 40 60 80 100 120Observed
Pred
icte
d
total shoot (t/ha)
y = 0.7219x + 1.962R2 = 0.6745
0
2
4
6
8
10
12
14
0 2 4 6 8 10 12 14Observed
Pred
icte
d
Grain Yield (t/ha)
y = 1.087x - 0.4735R2 = 0.7218
0
1
2
3
4
5
0 1 2 3 4 5Observed
Pred
icte
d
Grain N (kg N/ha)
y = 0.7275x + 4.0611R2 = 0.5069
0
20
40
60
80
0 20 40 60 80Observed
Pred
icte
d

37
The following figure shows example calibration plots for APSIM Rice (Stage 1) of grain yieldand total above ground biomass under a range of flooded and unflooded irrigated treatments(Borrell et al. 1997).
a) b) c) d)
Figure 2. Calibration plots of APSIM Rice output (continuous line) versus observed results (points) from Borrell etal (1997). Treatments include (from left to right) intermittent flood (a), saturated profile (b), partial flood (c) and fullflood (d). Plots are of time series of grain biomass (bottom), and total above-ground biomass (top).
References
Asseng S, Fillery IRP, Anderson GC, Dolling PJ, Dunin FX, Keating BA (1998a). Use of theASPIM wheat model to predict yield, drainage, and NO3 leaching for a deep sand. AustralianJournal of Agricultural Research 49, 363-377.
Asseng S, Keating BA, Gregory PJ, Fillery IRP, Bowden JW, Turner NC, Palta JA, Abrecht DG(1998b). Performance of the APSIM wheat model in Western Australia. Field Crops Research57, 163-179.
Asseng S, van Keulen H, Sto, W (2000). Performance and application of the APSIM Nwheatmodel in the Netherlands. European Journal of Agronomy 12, 37-54.
Borrell A, Garside A, Fukai S (1997). Improving efficiency of water use for irrigated rice insemi-arid tropical environment. Field Crops Research, 52, 231-248
Keating BA, Meinke H, Probert ME, Huth N, Hills IG (2001). Nwheat: Documentation andperformance of a wheat model for APSIM. CSIRO Tropical Agriculture Technical Memorandum9, 66 pp.
Keating BA, Carberry PS, Hammer GL, Probert ME, Robertson MJ, Holzworth D, Huth NI,Hargreaves JNG, Meinke H, Hochman Z, McLean G, Verburg K, Snow V, Dimes JP, Silburn M,Wang E, Brown S, Bristow KL, Asseng S, Chapman S, McCown RL, Freebairn DM, Smith CJ(2002) The Agricultural Production Systems Simulator (APSIM): its history and currentcapability. European Journal of Agronomy. (in press)
0
500
1000
1500
0 50 100
das
biom
ass
(g/m
2)
0
200
400
600
800
1000
0 50 100
das
grai
n (g
/m2)
0
500
1000
1500
0 50 100
das
biom
ass
(g/m
2)
0
200
400
600
800
1000
0 20 40 60 80 100 120 140
das
grai
n (g
/m2)
0
500
1000
1500
0 50 100
das
biom
ass
(g/m
2)0
200
400
600
800
1000
0 20 40 60 80 100 120 140
das
grai
n (g
/m2)
0
500
1000
1500
0 50 100
das
biom
ass
(g/m
2)
0
200
400
600
800
1000
0 20 40 60 80 100 120 140
das
grai
n (g
/m2)

38
McCown RL, Hammer GL, Hargreaves JNG, Holzworth DP, and Freebairn DM (1996). APSIM:A novel software system for model development, model testing, and simulation in agriculturalsystems research. Agricultural Systems, 50, 255-271.
Meinke H, Rabbinge R, Hammer GL, van Keulen H, Jamieson PD (1998). Improving wheatsimulation capabilities in Australia from a cropping systems perspective. II. Testing simulationcapabilities of wheat growth. European Journal of Agronomy 8, 83-99.
Otter-Nacke S, Godwin DG, Ritchie JT (1986). Testing and validating the CERES-Wheat modelin diverse environments. AGRISTARS Yield Model Development. USDA-ARS, Temple, TX.
Sinclair TR, Amir J (1992). A model to assess nitrogen limitations on the growth and yield ofspring wheat. Field Crops Research 30, 63-78.
Wang E, Robertson MR, Hammer GL, Carberry P, Holzworth D, Hargreaves J, Huth N,Chapman S, Meinke, H, McLean, G (2002). Design and implementation of a generic cropmodule template in the cropping system model APSIM. European Journal of Agronomy (inpress).

39
Modelling crop sequences using APSIM�
M E Probert
CSIRO Sustainable Ecosystems, 120 Meiers Road, Indooroopilly. Queensland, 4068
Abstract
Simulation of sequences of crops involves more than judging crop models on their ability topredict crop yield. The carry-over effects of crops in terms of soil water and nitrogen dynamicsare discussed. APSIM’s ability to simulate sequences of crops is illustrated for (1) a selection oftreatments from the Warra Soil Fertility Restoration Experiment (continuous wheat, wheat-chickpea and wheat-lucerne), and (2) a comparison of annual crops (sorghum and barley) withlucerne on a deep black earth at Jimbour, Qld where lucerne dried out the profile to at least 3m.Finally some comments are made on challenges to be faced in order to simulate a flooded rice-wheat system.
Introduction
In talking of crop modelling, it’s all too easy to use language that refers to “a wheat model” or “arice model” or “a model for some other crop”. But the real world of farming is not composed ofsingle crops.
The Agricultural Production Systems Simulator, APSIM (McCown et al. 1996) developed out ofthe recognition that crops come and go, like other aspects of management. Simulation offarming systems needs to be able to deal with sequences of crops, and in some instancesmixtures of crops.
Because of this tendency to think of models of single crops, the performance of models alsotends to focus on how well they predict the growth/development of individual crops. Typically,the soil conditions (water and nitrogen) are specified prior to planting together with the sowingand other management details, and then the output from the model is likely to concentrate onaspects of plant growth, and especially final yield, and how the predictions match up from whatis observed.
To change the focus from a single crop to a sequence of crops (either the same crop or a rotationof different crops), is a much more demanding task. It also creates a need for data sets that arequite different from those that are used to develop/validate a model of the growth of anindividual annual crop. Modelling of perennial crops (such as sugarcane or lucerne) has much incommon with modelling sequences of annual crops.
�© 2002 CSIRO. Published in Humphreys, E., and Timsina, J. (Eds.) (2002). Modelling irrigated cropping systems,with special attention to rice-wheat sequences and raised bed planting. Proceedings of a Workshop, CSIRO Landand Water, Griffith, NSW, Australia, 25-28 February 2002. CSIRO Land and Water Technical Report 25/02.

40
In this contribution, three things are attempted:� The first is to outline the particular demands of modelling sequences of crops.� The second is to show some examples of how APSIM has been, and is, being used to
tackle particular situations that involve sequences of crops.� Finally, I make some passing remarks about the particular challenges that are involved in
modelling rice-wheat systems.
Modelling crop sequences
Many of the problems confronting agriculture today involve extended timescales (well beyondthat of a single crop). Some examples pertinent to Australian agriculture are:
� Dryland salinization caused by deep drainage of water� Soil acidification� Improving N nutrition of crops through rotations with legumes� Greenhouse abatement strategies through carbon sequestration� Increasing water use efficiency by modifying crop rotations.
For each of these examples, there is an expectation that there is a role for modelling to analysethe problem and/or investigate possible strategies that can contribute to its solution. A commonlink is that they all involve sequences of crops. For models to perform in a credible fashion, theparamount requirement is that they adequately represent the manner in which one crop (under theprevailing weather) alters the soil resource, and thus creates a particular set of conditions for afollowing crop.
It is aspects of the water and nitrogen supply to plants that are most amenable to adjustment orcontrol by management. Thus it is no surprise that it is water and N that are the main soilconstraints that are considered in crop models, and also in farming systems models (Probert andKeating 2000).
The following paragraphs indicate the carry-over effects from the previous crop in terms of soilwater and nitrogen. Of particular note is the interdependency between crop growth, the waterbalance, and the dynamics of N in soil.
WaterThe main carry-over effect is the water remaining in the soil profile; a secondary effect will bevia above-ground residues (and their management) that will alter the fate of water (runoff,evaporation) during the ensuing fallow.
A water balance that adequately represents the dynamics of water in the soil-plant system isimperative.
Crops will differ in terms of rate of root elongation and total rooting depth. This determineswater use by the crop, and becomes the crucial factor in the creation of a dry soil buffer(dewatering) following a deep-rooted perennial like lucerne. But it can also be the cause of

41
reduced growth of the following crop if there has not been adequate recharge of the soil waterprofile.
Some contentious issues:� whether different crops have different lower limits of water extraction (may be
confounded with fact that roots of different crops may have been growing for differentlengths of time)
� how roots respond to defoliation (cutting or grazing).
NitrogenCarry-over effects include residual mineral-N remaining in soil, crop residues and roots, andchanges in soil organic matter (that will influence future N mineralization).
Mineral-N is dependent on the soil water balance (which determines mineralisation,redistribution of nitrate in the profile, losses via denitrification) and crop N uptake.
Change in soil organic matter is related to carbon inputs into soil (also N where immobilizationdemand can not be met).
Crop residues and roots have major effects on N supply to following crops. Legume residues(low C:N ratio) contribute N via mineralization; cereal and other residues with wide C:N ratioscause immobilization. Rate of residue decomposition (dependent on temperature and moisture)and length of fallow are other important factors on N mineralization (cf double cropping vsseveral months fallow). The APSIM Residue module that deals with the decomposition ofabove-ground residues is quite simplistic; for example it does not keep track of different types ofresidues, merely averaging the properties of new and existing residues.
The requirement for satisfactory prediction of roots (amount, N content, distribution in profile,rate of senescence, sloughing of C and N) and residues (amount, N content) is a major differencebetween use of a model to predict yield of a single crop, and simulating behaviour of a sequenceof crops. Failure to satisfactorily predict inputs of plant materials, their decomposition andassociated N mineralization/immobilization often results in a strong biennial pattern in predictedcrop growth; a large crop leaves much root and residues creating too much immobilization, sothat following crop suffers unrealistic N stress and growth is under-predicted leading to under-prediction of residues and immobilization, so next crop gets too much N, and so the cyclecontinues.
CarbonIn many models (e.g. the APSIM SoilN module, Probert et al. 1998b), the dynamics of carbonand nitrogen in the crop residues and soil organic matter pools are closely linked through the C:Nratios of the soil organic matter pools.
An example focussing on soil fertility restoration
Data from the Warra Soil Fertility Restoration Experiment (Dalal et al. 1995, Strong et al. 1996)have been used extensively to validate aspects of the APSIM modelling framework, and
42
especially its capability to simulate a sequence of crops (Probert and McCown, GRDC FinalReport, Project CSC15). The experiment commenced in 1986 on a Vertosol (TypicChromustert) that originally supported brigalow-belah vegetation, but cultivation for cerealcropping since 1935 had resulted in decline in soil organic matter and rundown of soil fertility.The experiments involved a range of treatments including continuous wheat with a range of Nfertilizer inputs, rotation of wheat and chickpea, and rotations of wheat and lucerne (1 to 4 yearsof lucerne). The data provide opportunities to test model performance in terms of crop yields, Nuptake and soil water and nitrate-N which were measured in 7 layers to 1.5m twice each year(pre-plant and post harvest).
Figures 1, 2 and 3 illustrate the generally good performance of APSIM in predicting cropperformance on selected treatments in terms of yields, protein content of wheat, and soil waterand nitrate-N in the 1.5m profile. In these simulations, the soil conditions (soil water, nitrate-Nand soil organic matter) were initialised in May 1987 prior to the first crops being sown, and themodel then simulated crop growth for the next 10 years as a continuous run. Note how lucerne,especially in 1993 and 1995, dries the soil to a greater extent than the annual crops (compare Fig.3 with Figs 1 and 2).
Table 1 sets out the statistics for comparing model performance when the sequence of crops ispredicted (initialised only in 1987) or when each crop is predicted individually (with soil waterand nitrate-N re-initialized prior to planting of each crop). There is little difference in thegoodness of fit, indicating that the integrity of the simulation of the soil water, nitrogen andresidues in these system is being maintained over the duration of the experiment.
The capability of APSIM to simulate crop rotations, and especially rotations of cereals andlegumes, has been used to explore strategies for supply of N in farming systems (e.g. legumes vsfertilizer) in Australia (Probert et al. 1998a) and offshore (eastern and southern Africa).
An example focussing on soil water
The Warra soil becomes quite acidic at depth, and this is thought to limit the rooting depth ofcrops, even lucerne. In other studies on the Darling Downs this is not the case. For the blackearth at Jimbour, Queensland there is good evidence that lucerne extracts water to at least 3m.[Elsewhere there are reports of lucerne roots to 16m.] In contrast to lucerne, annual croppingsystems with sorghum and barley do not change water content below 1.8m. Theparameterisation of the soil water characteristics of the soil is shown in Figure 4 and thesimulated soil water for these systems in Figure 5.
The water extraction pattern simulated shows the lucerne root front progressively moving intodeeper soil layers. Whilst there is sound evidence that lucerne dries out the soil to 3m (at least),the productivity of the stand rapidly declined as the deep water resource was used up.
The capability of APSIM to model the water balance has been used to assess how alternativecropping systems (annual cropping, opportunity cropping, phase farming with lucerne,continuous lucerne) would impact on the leakiness of farming systems thus contributing todryland salinization (Keating et al. 2001).
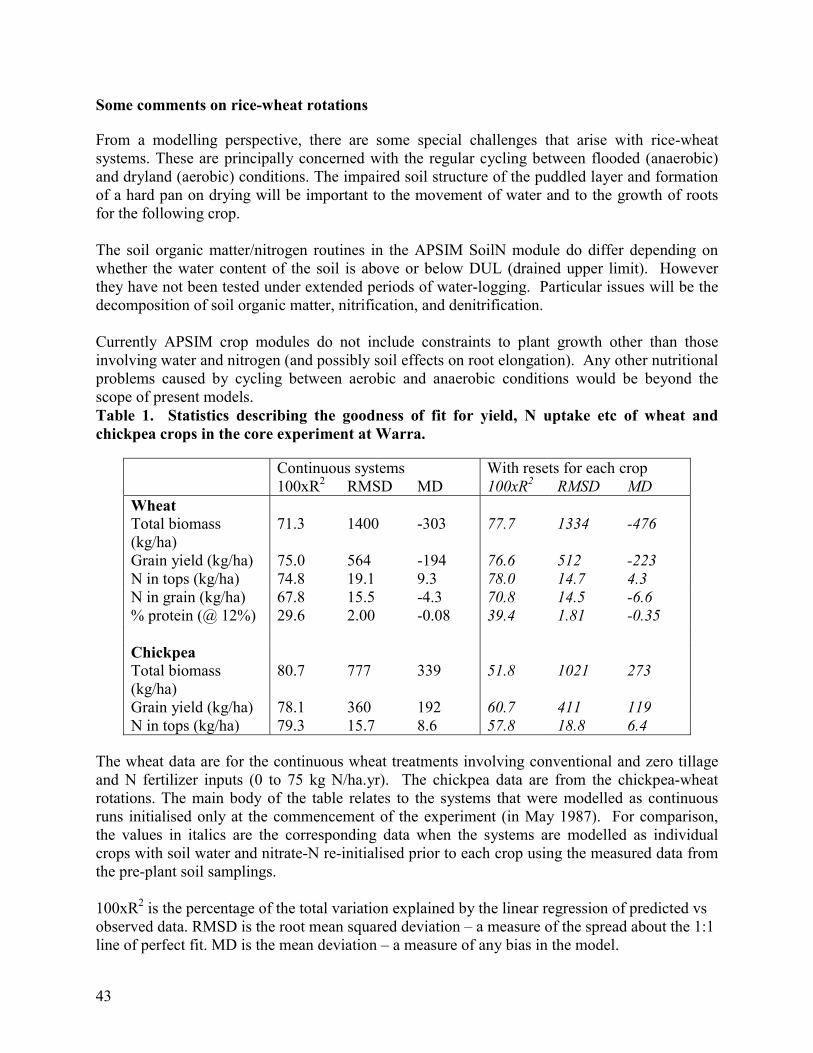
43
Some comments on rice-wheat rotations
From a modelling perspective, there are some special challenges that arise with rice-wheatsystems. These are principally concerned with the regular cycling between flooded (anaerobic)and dryland (aerobic) conditions. The impaired soil structure of the puddled layer and formationof a hard pan on drying will be important to the movement of water and to the growth of rootsfor the following crop.
The soil organic matter/nitrogen routines in the APSIM SoilN module do differ depending onwhether the water content of the soil is above or below DUL (drained upper limit). Howeverthey have not been tested under extended periods of water-logging. Particular issues will be thedecomposition of soil organic matter, nitrification, and denitrification.
Currently APSIM crop modules do not include constraints to plant growth other than thoseinvolving water and nitrogen (and possibly soil effects on root elongation). Any other nutritionalproblems caused by cycling between aerobic and anaerobic conditions would be beyond thescope of present models.Table 1. Statistics describing the goodness of fit for yield, N uptake etc of wheat andchickpea crops in the core experiment at Warra.
Continuous systems With resets for each crop100xR2 RMSD MD 100xR2 RMSD MD
WheatTotal biomass(kg/ha)
71.3 1400 -303 77.7 1334 -476
Grain yield (kg/ha) 75.0 564 -194 76.6 512 -223N in tops (kg/ha) 74.8 19.1 9.3 78.0 14.7 4.3N in grain (kg/ha) 67.8 15.5 -4.3 70.8 14.5 -6.6% protein (@ 12%) 29.6 2.00 -0.08 39.4 1.81 -0.35
ChickpeaTotal biomass(kg/ha)
80.7 777 339 51.8 1021 273
Grain yield (kg/ha) 78.1 360 192 60.7 411 119N in tops (kg/ha) 79.3 15.7 8.6 57.8 18.8 6.4
The wheat data are for the continuous wheat treatments involving conventional and zero tillageand N fertilizer inputs (0 to 75 kg N/ha.yr). The chickpea data are from the chickpea-wheatrotations. The main body of the table relates to the systems that were modelled as continuousruns initialised only at the commencement of the experiment (in May 1987). For comparison,the values in italics are the corresponding data when the systems are modelled as individualcrops with soil water and nitrate-N re-initialised prior to each crop using the measured data fromthe pre-plant soil samplings.
100xR2 is the percentage of the total variation explained by the linear regression of predicted vsobserved data. RMSD is the root mean squared deviation – a measure of the spread about the 1:1line of perfect fit. MD is the mean deviation – a measure of any bias in the model.

44
Figure 1. Simulation of yields and protein content of wheat, and soil water and nitrate-N for Treatment12 (conventional tillage with 25 kg/ha/yr fertiliser N) in the core experiment at Warra with modelinitialisation only in May 1987 prior to the first crop. The symbols represent the measured data. Soilwater and nitrate refer to the totals in the 0-1.5 m profile. Note the increase in nitrate-N following theapplication of fertiliser at sowing, and the long fallow that resulted from the “missed crop” in 1991. Thedashed lines on the soil water figure show the assumed DUL and LL for wheat.
Total Soil W ater (mm)
350
400
450
500
550
600
650
700
1987 1988 1989 1990 1991 1992 1993 1994 1995 1996 1997
Total Soil Nitrate (kg/ha)
0
50
100
150
200
1987 1988 1989 1990 1991 1992 1993 1994 1995 1996 1997
0
2000
4000
6000
8000
10000
12000
1987 1988 1989 1990 1991 1992 1993 1994 1995 1996 1997
grain total DMYie ld (kg/ha )Trt 12
% Prote in in w heat (@12% mois ture)
02468
10121416
1987 1988 1989 1990 1991 1992 1993 1994 1995 1996
Predicted Observed

45
Figure 2. Simulation of total biomass and grain yields of wheat and chickpea, protein content of wheat,and soil water and nitrate-N for Treatment 8 (chickpea – wheat rotation) in the core experiment at Warra.The symbols represent the measured data. Soil water and nitrate refer to the totals in the 0-1.5 m profile.The dashed lines on the soil water figure show the assumed DUL and LL for wheat.
Tota l Soil W ater (mm )
350
400
450
500
550
600
650
700
1987 1988 1989 1990 1991 1992 1993 1994 1995 1996 1997
Tota l Soil Nitra te (kg/ha)
0
50
100
150
200
1987 1988 1989 1990 1991 1992 1993 1994 1995 1996 1997
0
2000
4000
6000
8000
10000
12000
1987 1988 1989 1990 1991 1992 1993 1994 1995 1996 1997
chickpea wheatYie ld (kg/ha) Trt 8
% Prote in in w he at (@12% moisture)
02468
10121416
1987 1988 1989 1990 1991 1992 1993 1994 1995 1996
Predicted Observed
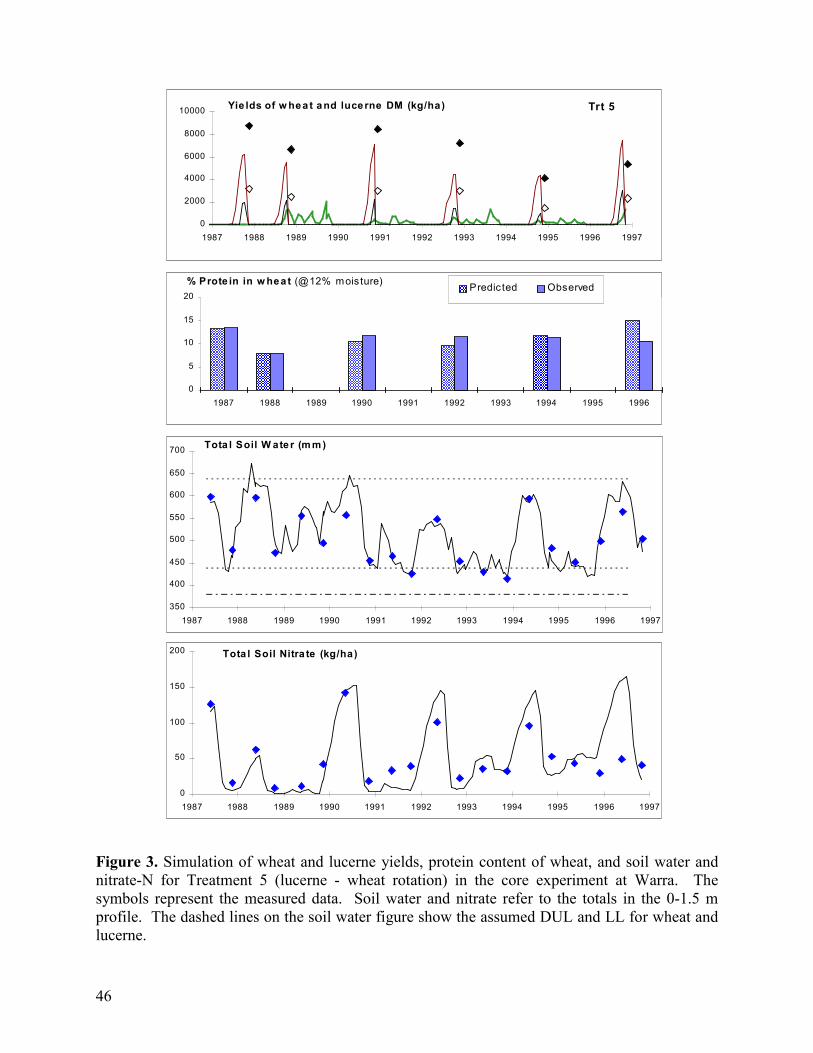
46
Figure 3. Simulation of wheat and lucerne yields, protein content of wheat, and soil water andnitrate-N for Treatment 5 (lucerne - wheat rotation) in the core experiment at Warra. Thesymbols represent the measured data. Soil water and nitrate refer to the totals in the 0-1.5 mprofile. The dashed lines on the soil water figure show the assumed DUL and LL for wheat andlucerne.
0
2000
4000
6000
8000
10000
1987 1988 1989 1990 1991 1992 1993 1994 1995 1996 19970
200
400
600
800
1000Yie lds of w heat and lucerne DM (kg/ha) Trt 5
% Prote in in w heat (@12% mois ture)
0
5
10
15
20
1987 1988 1989 1990 1991 1992 1993 1994 1995 1996
Predic ted Observed
Tota l Soil W ater (m m )
350
400
450
500
550
600
650
700
1987 1988 1989 1990 1991 1992 1993 1994 1995 1996 1997
Tota l Soil Nitra te (kg/ha)
0
50
100
150
200
1987 1988 1989 1990 1991 1992 1993 1994 1995 1996 1997

47
Figure 4. Parameterisation of soil water for lucerne and barley on the deep black earth atJimbour, Qld. The rooting depth for barley was limited to 1.8m.
volumetric soil water
0
30
60
90
120
150
180
210
240
270
300
0.2 0.3 0.4 0.5
dept
h (c
m)
DUL
LL lucerne
LL barley

48
Figure 5. Measured and simulated soil water for two farming systems on a deep black earth onthe Jimbour Plain, Queensland [Neal Dalgliesh, GRDC Eastern Farming Systems Project] Theleft hand panel of figures are for a sequence of annual crops (sorghum in 1997/98 and 1998/99,followed by barley in 1999); the right hand panel for lucerne established in 1997. Note thatlayers shown are not the same for the two systems.[Observed data in first year from NMM; noise thought to be due to failure to adequately correct forsoil shrinkage. In later years based on gravimetric data.]
Soil water (layer 3) 30-60 cm
0.2
0.3
0.4
0.5
0.6
1997.4 1997.9 1998.4 1998.9 1999.4 1999.9 2000.4
Soil water (layer 4) 60-90 cm
0.2
0.3
0.4
0.5
0.6
1997.4 1997.9 1998.4 1998.9 1999.4 1999.9 2000.4
Soil water (layer 6) 120-150 cm
0.3
0.35
0.4
0.45
0.5
1997.4 1997.9 1998.4 1998.9 1999.4 1999.9 2000.4
Soil water (layer 7) 150-180 cm
0.3
0.35
0.4
0.45
0.5
1997.4 1997.9 1998.4 1998.9 1999.4 1999.9 2000.4
Soil water (layer 5) 90-120 cm
0.2
0.3
0.4
0.5
0.6
1997.4 1997.9 1998.4 1998.9 1999.4 1999.9 2000.4
Soil water (layer 2) 15-30 cm
0.2
0.3
0.4
0.5
0.6
1997.4 1997.9 1998.4 1998.9 1999.4 1999.9 2000.4
Soil water (layer 3) 30-60 cm
0
0.1
0.2
0.3
0.4
0.5
0.6
1997.4 1997.9 1998.4 1998.9 1999.4 1999.9 2000.4
Soil water (layer 4) 60-90 cm
0.1
0.2
0.3
0.4
0.5
0.6
1997.4 1997.9 1998.4 1998.9 1999.4 1999.9 2000.4
Soil water (layer 10) 240-270 cm
0.3
0.35
0.4
0.45
0.5
1997.4 1997.9 1998.4 1998.9 1999.4 1999.9 2000.4
Soil water (layer 6) 120-150 cm
0.3
0.35
0.4
0.45
0.5
1997.4 1997.9 1998.4 1998.9 1999.4 1999.9 2000.4
Soil water (layer 8) 180-210 cm
0.3
0.35
0.4
0.45
0.5
1997.4 1997.9 1998.4 1998.9 1999.4 1999.9 2000.4
Soil water (layer 5) 90-120 cm
0.2
0.3
0.4
0.5
1997.4 1997.9 1998.4 1998.9 1999.4 1999.9 2000.4
49
References
Dalal RC, Strong WM, Weston EJ, Cooper JE, Lehane KJ, King AJ, Chicken CJ (1995).Sustaining productivity of a Vertisol at Warra, Queensland, with fertilizers, no-tillage, orlegumes 1. Organic matter status. Australian Journal of Experimental Agriculture 35, 903-913.
Keating BA, Verburg K, Smith CJ, Probert ME, Gaydon D (2001). Assessing leakiness inAustralia’s dryland farming systems. In ‘MODSIM 2001International Congress on Modellingand Simulation’, Australian National University, Dec. 2001, pp 1811-1816.
McCown RL, Hammer GL, Hargreaves JNG, Holzworth DP, Freebairn DM (1996). APSIM: Anovel software system for model development, model testing and simulation in agriculturalsystem research. Agricultural Systems 50, 255-271.
Probert ME, Carberry PS, McCown RL, Turpin JE (1998a). Simulation of legume-cerealsystems using APSIM. Australian Journal of Agricultural Research 49, 317-327.
Probert ME, Dimes JP, Keating BA, Dalal RC, Strong WM (1998b). APSIM’s water andnitrogen modules and simulation of the dynamics of water and nitrogen in fallow systems.Agricultural Systems 56, 1-28.
Probert ME, Keating BA (2000). What soil constraints should be included in crop and forestmodels? Agriculture Ecosystems and Environment 82, 273-281.
Strong WM, Dalal RC, Weston EJ, Cooper JE, Lehane KJ, King AJ, Chicken CJ (1996).Sustaining productivity of a Vertisol at Warra, Queensland, with fertilizers, no-tillage, orlegumes 2. Long-term fertiliser nitrogen needs to enhance wheat yields and grain protein.Australian Journal of Experimental Agriculture 36, 665-674.

50

51
TRYM: A simplified process model in use by the NSW rice industry�
R Williams
Yanco Agricultural Institute, NSW Agriculture, NSW 2703
Abstract
A simplified crop process model, called TRYM (Temperate Rice Yield Model), has beendeveloped for use in the NSW rice industry. TRYM predicts rice growth and yield based onenvironmental conditions and grower management options. It was based on fieldexperimentation with treatments which produced the full range of yields observed by farmers. Atop-down analysis of yield and yield components defined the level of complexity of the cropmodel. TRYM has been widely used as part of a decision support system called maNAge rice.
Introduction
Growing rice in southern NSW can be a very risky occupation, with large yield variation acrossfields and seasons. Below-average temperatures during the reproductive stage can dramaticallyreduce rice yields. In the 1995/96 rice season, the average yield was reduced by 25% as a resultof minimum air temperatures that were 4oC below average for 30 days during the criticalreproductive stage. During that season, farmer yields ranged from 0 to 13 t/ha.
In response to the almost chaotic pattern of rice yields, a computer model of rice growth wasdeveloped, tested, evaluated and incorporated into a decision support system to help farmersmanage their rice crops. The resulting model was named the Temperate Rice Yield Model(TRYM).
Experimental work
The initial aim of the rice modelling work was to mimic the variation in rice yield in a controlledreplicated experiment, changing only the management factors available to rice growers. Thesefactors included variety, N fertiliser application rate, sowing date, and water depth at early pollenmicrospore.
An initial experiment was established in 1991/92 at Deniliquin. This used a factorial combinationof 3 varieties (Amaroo, Jarrah and Doongara), 4 pre-flood N rates (0, 75, 125 and 250 kgN/ha), 2sowing dates (26 September and 31 October) and 2 water depths (5 and 20 cm) at early pollenmicrospore. Details of the trial are described in Williams and Angus (1994).
© 2002 CSIRO. Published in Humphreys, E., and Timsina, J. (Eds.) (2002). Modelling irrigated cropping systems,with special attention to rice-wheat sequences and raised bed planting. Proceedings of a Workshop, CSIRO Landand Water, Griffith, NSW, Australia, 25-28 February 2002. CSIRO Land and Water Technical Report 25/02.

52
Yield for Amaroo in this trial ranged from 0 to 12 t/ha. Total dry matter at maturity was littleaffected by sowing date and water depth, but increased from 16 to 22 t/ha with nitrogenapplication. Grain yield response to N fertiliser was dependent on sowing date, water depth andvariety. For early-sown crops grown in deep water, yields increased from 7 to 13 t/ha withincreased N supply. For early-sown crops grown in shallow water, yields declined from 7 to 3t/ha with increasing N supply. For the later October sowing date, yields declined with applied Nat both water depths.
Guiding principles for developing TRYM
A top-down approach was employed to explore the reasons for yield differences, and to developthe crop model. Yield components were broken down only until each component was adequatelycorrelated with a management decision (such as N application rate or water depth) or anenvironmental variable (temperature or radiation). This process has the advantage of limiting thecomplexity of the resulting model, while ensuring sufficient complexity to describe theexperimental field results. A second guiding principle is to only simulate characters that can bereasonably observed and measured. As a result of this constraint the model does not attempt tosimulate processes such as crop respiration, or the size of different N pools. The third principle isto use a minimum of parameters to describe the yield variation.
Crop Model
Grain yield is described as a product of harvest index and above-ground biomass at maturity.Harvest index is simulated only once (at early microspore). It is assumed to be a geneticallydetermined maximum value, unless panicle temperature at early microspore falls below athreshold, in which case the harvest index is reduced. The reduction is more dramatic for high Nstatus crops. The growth component of the model has a daily time step, and simulates changes inN uptake, leaf area index, radiation interception and above-ground biomass. N uptake for eachday is calculated as the product of the day’s mean temperature and the rate of N uptake per unittemperature. Application of fertiliser N increases this rate, allowing the model to simulate theresponse to applied N. Leaf area index prior to flowering is estimated as a linear function of Nuptake; after flowering, leaf area index is reduced by 1% per day. Radiation interception isestimated from the leaf area index according to Beer’s law. Above-ground biomass is modelledas the product of intercepted solar radiation and a fixed radiation use efficiency.
Data requirements
Inputs required by TRYM are the variety, sowing date, flowering date, fertiliser application ratesand dates, daily maximum and minimum temperatures and solar radiation, as well as oneobservation of N content during the crop cycle. TRYM is unable to simulate N uptake of aparticular soil based on soil characteristics. To enable simulation of N content of the cropthrough the season, one observation is required to initialise the model. This data is used tocalculate the previous soil mineralisation rate, which is then projected into the future. However,once the soil mineralisation rate is set, yield predictions for a range of N management optionscan be calculated.

53
Validation
TRYM was tested using a range of data sets over 3 years to determine whether the observedyield responses to N applied pre-flood and at panicle initiation were simulated correctly. In eachcase the simulation was initialised by the crop N content at panicle initiation. Sowing date, PIdate and the nitrogen uptake of the crop at that time were used as inputs into the model, as weredata on daily temperatures and solar radiation. The model simulated the daily change in leaf area,nitrogen uptake and biomass until maturity.
Table 1. Average observed and simulated rice yield with no PI applied N and with 75 kgN/ha applied for a range of PI N uptake values over a range of locations and 3 years.
Range ofN uptake(kg N/ha)
Numberof crops
Mean Nuptake
(kg N/ha)
Yieldwith no N at PI
(t/ha)
Response to 75 kg N/haat PI(t/ha)
Observed Simulated Observed Simulated15-40 11 26 6.1 5.8 1.6 2.140-70 15 51 8.5 8.2 1.5 1.370-100 6 84 10.3 9.5 1.0 0.8100-130 11 112 11.7 11.3 0.4 0.5130-180 10 155 11.6 11.8 -0.1 0.2
TRYM predicted the average observed yield for crops within particular ranges of N uptake withan average error (Root Mean Square Deviation) of 0.44 t/ha (Table 1). The model predicted grainyield of individual plots with an average error (Root Mean Square Deviation) of 0.95, 1.7 and 1.6t/ha for the years 1995, 1996 and 1996 respectively. The error of observation of grain yield wasjust over 1.0 t/ha in each of the trials. The predicted yields show no bias in relation to theobserved yields (Fig. 1).
TRYM also adequately predicted the yield response to the addition of 75 kgN/ha at panicleinitiation for crops with a range of N uptake (Table 1) with an average error of 0.25 t/ha.Average error of predicted yield response for individual crops was 0.98, 0.93 and 1.2 for theyears 1995, 1996 and 1997 respectively (Fig. 2).

54
Figure 1. Predicted versus observed grain yield for a range of rice crops with no N appliedafter flooding.
a) 1995
4
8
12
16
b) 1996
Sim
ulat
ed g
rain
yie
ld (t
/ha)
4
8
12
16
c) 1997
O bserved grain yield (t/ha)
4 8 12 16
4
8
12
16

55
Figure 2. Predicted versus observed yield response to additional 75 kg N/ha applied atpanicle initiation.
a) 1995
-2
-1
0
1
2
3
4
5
6
b) 1996
Sim
ulat
ed g
rain
yie
ld r
espo
nse
(t/ha
)
-2
-1
0
1
2
3
4
5
6
c) 1997
O bserved grain yield response (t/ha)
-2 -1 0 1 2 3 4 5 6
-2
-1
0
1
2
3
4
5
6

56
Application
TRYM has been used as the basis of the rice decision support system maNage rice. The softwareprogram maNage rice has been used by an increasing number of ricegrowers over the last 9years. Currently more than 500 updates of the software are sent to growers annually. Growersuse the software in 2 ways. The first is as a general educational tool, with the grower askingquestions such as “Can I get 10 t/ha yield every year?”, “To do that what must I change?”, “Whatare the risks of cold damage if I follow the high N input option?”, “What are the economicconsequences of following the high N input option?”, etc. The second way growers use maNagerice is to determine particular predictions for their crops. maNAge rice allows for the predictionof the dates of PI, flowering and maturity, as well as providing information on the costs andbenefits of various PI top dressing rates.
References
Williams, R.L., Angus, J. (1994). Deep floodwater protects high-nitrogen rice crops from lowtemeprature damage. Australian Journal of Experimental Agriculture 34:927-932.
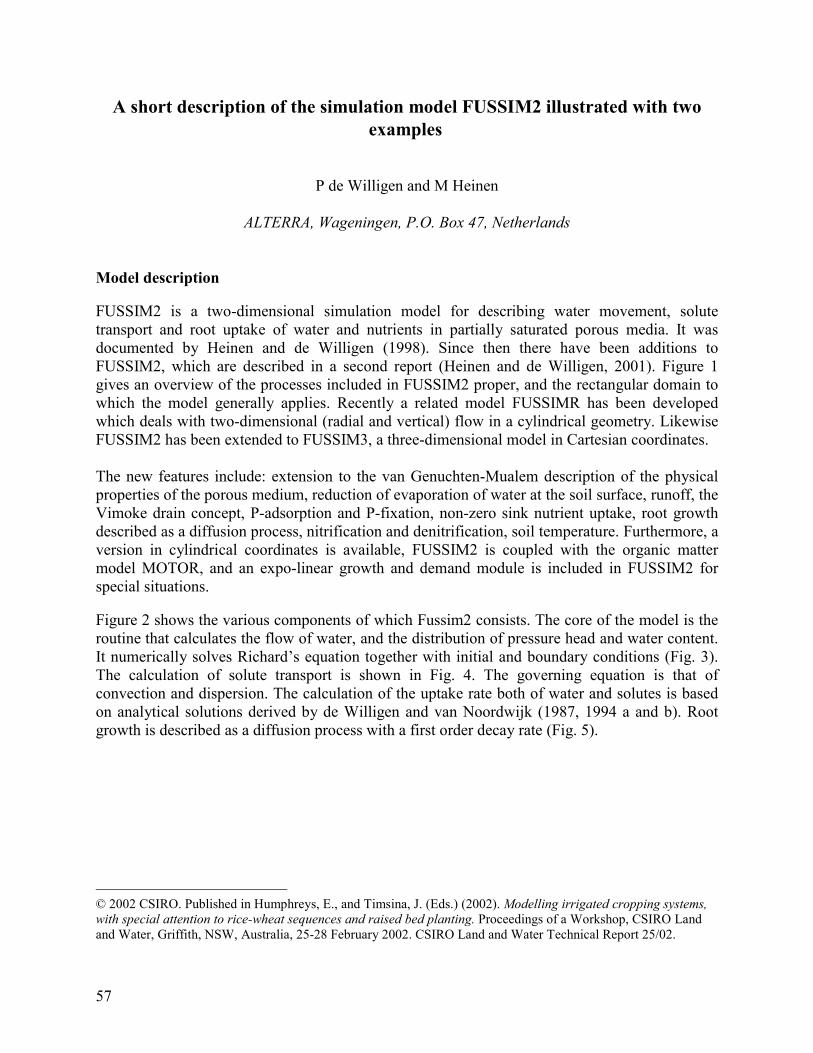
57
A short description of the simulation model FUSSIM2 illustrated with twoexamples�
P de Willigen and M Heinen
ALTERRA, Wageningen, P.O. Box 47, Netherlands
Model description
FUSSIM2 is a two-dimensional simulation model for describing water movement, solutetransport and root uptake of water and nutrients in partially saturated porous media. It wasdocumented by Heinen and de Willigen (1998). Since then there have been additions toFUSSIM2, which are described in a second report (Heinen and de Willigen, 2001). Figure 1gives an overview of the processes included in FUSSIM2 proper, and the rectangular domain towhich the model generally applies. Recently a related model FUSSIMR has been developedwhich deals with two-dimensional (radial and vertical) flow in a cylindrical geometry. LikewiseFUSSIM2 has been extended to FUSSIM3, a three-dimensional model in Cartesian coordinates.
The new features include: extension to the van Genuchten-Mualem description of the physicalproperties of the porous medium, reduction of evaporation of water at the soil surface, runoff, theVimoke drain concept, P-adsorption and P-fixation, non-zero sink nutrient uptake, root growthdescribed as a diffusion process, nitrification and denitrification, soil temperature. Furthermore, aversion in cylindrical coordinates is available, FUSSIM2 is coupled with the organic mattermodel MOTOR, and an expo-linear growth and demand module is included in FUSSIM2 forspecial situations.
Figure 2 shows the various components of which Fussim2 consists. The core of the model is theroutine that calculates the flow of water, and the distribution of pressure head and water content.It numerically solves Richard’s equation together with initial and boundary conditions (Fig. 3).The calculation of solute transport is shown in Fig. 4. The governing equation is that ofconvection and dispersion. The calculation of the uptake rate both of water and solutes is basedon analytical solutions derived by de Willigen and van Noordwijk (1987, 1994 a and b). Rootgrowth is described as a diffusion process with a first order decay rate (Fig. 5).
© 2002 CSIRO. Published in Humphreys, E., and Timsina, J. (Eds.) (2002). Modelling irrigated cropping systems,with special attention to rice-wheat sequences and raised bed planting. Proceedings of a Workshop, CSIRO Landand Water, Griffith, NSW, Australia, 25-28 February 2002. CSIRO Land and Water Technical Report 25/02.
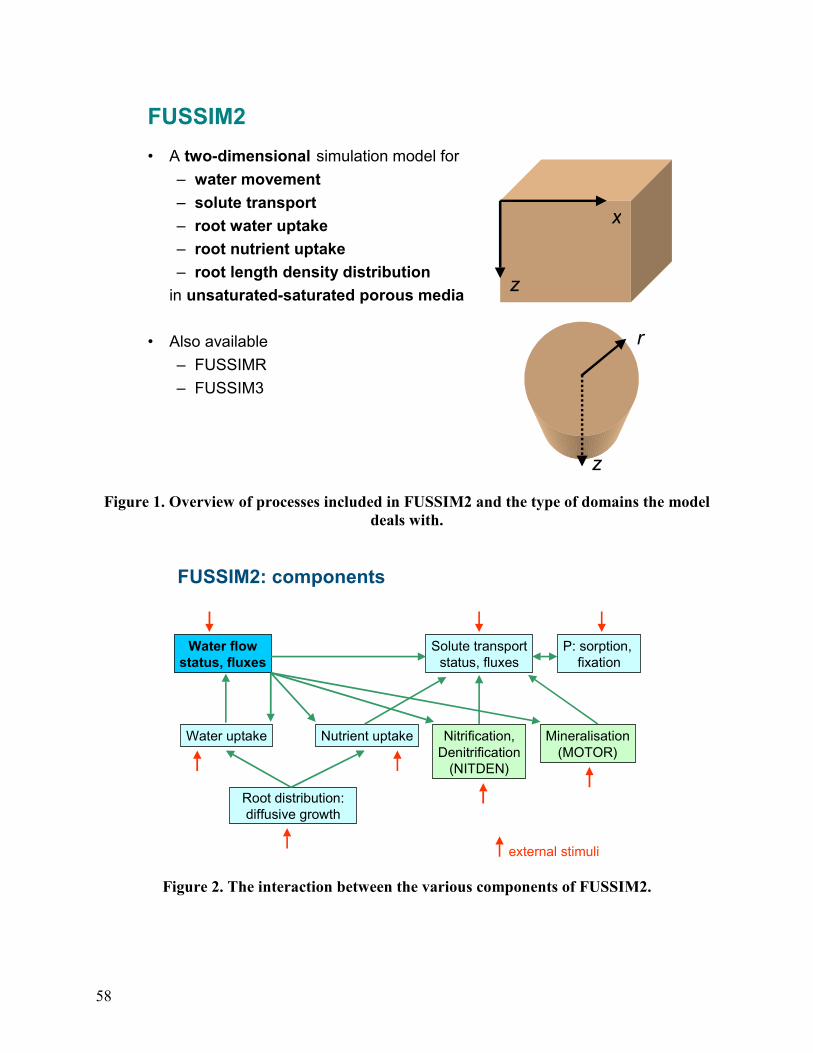
58
FUSSIM2• A two-dimensional simulation model for
– water movement– solute transport– root water uptake– root nutrient uptake– root length density distribution
in unsaturated-saturated porous media
• Also available– FUSSIMR– FUSSIM3
z
x
z
r
Figure 1. Overview of processes included in FUSSIM2 and the type of domains the modeldeals with.
FUSSIM2: components
Water flowstatus, fluxes
Solute transportstatus, fluxes
Water uptake Nutrient uptake
Root distribution:diffusive growth
Nitrification,Denitrification
(NITDEN)
Mineralisation(MOTOR)
external stimuli
P: sorption, fixation
Figure 2. The interaction between the various components of FUSSIM2.

59
Water movement
• Richards equation (1931)– for variably saturated, heterogeneous, isotropic, rigid, isothermal
porous media and incompressible water
• Non-linear hydraulic properties– van Genuchten (1980) retention curve �(h)– Mualem (1976) hydraulic conductivity curve K(h)– Mualem (1984) modified dependent domain hysteresis in �(h)
• Numerical solution– control volume finite element
• Initial and boundary conditions
� �� � � �
� �wS
zK
zhK
zxhK
xth
��
���
�
���
�
�
�
�
��
�
���
�
�
�
�
�
�
� ���
�
Figure 3. Scheme of calculation of watertransport, based on Richard’s equation with a sinkterm (Sw) accounting for water uptake by the plant.
Solute transport• Continuity equation• Nutrient flux density
– mass flow– dispersion - diffusion
• longitudinal and transversal dispersivities• diffusion in free water• tortuosity as a function of water content
• Explicitly solved• Using most recent outcome of water flow equation• P adsorption and fixation treated separately: concept of
Schoumans and de Willigen
2,1,, ����
�
�
��
�
�
��
jiS
xcD
xxcq
tQ
sj
ijii
i�
Figure 4. As for figure 3 for solute transport.
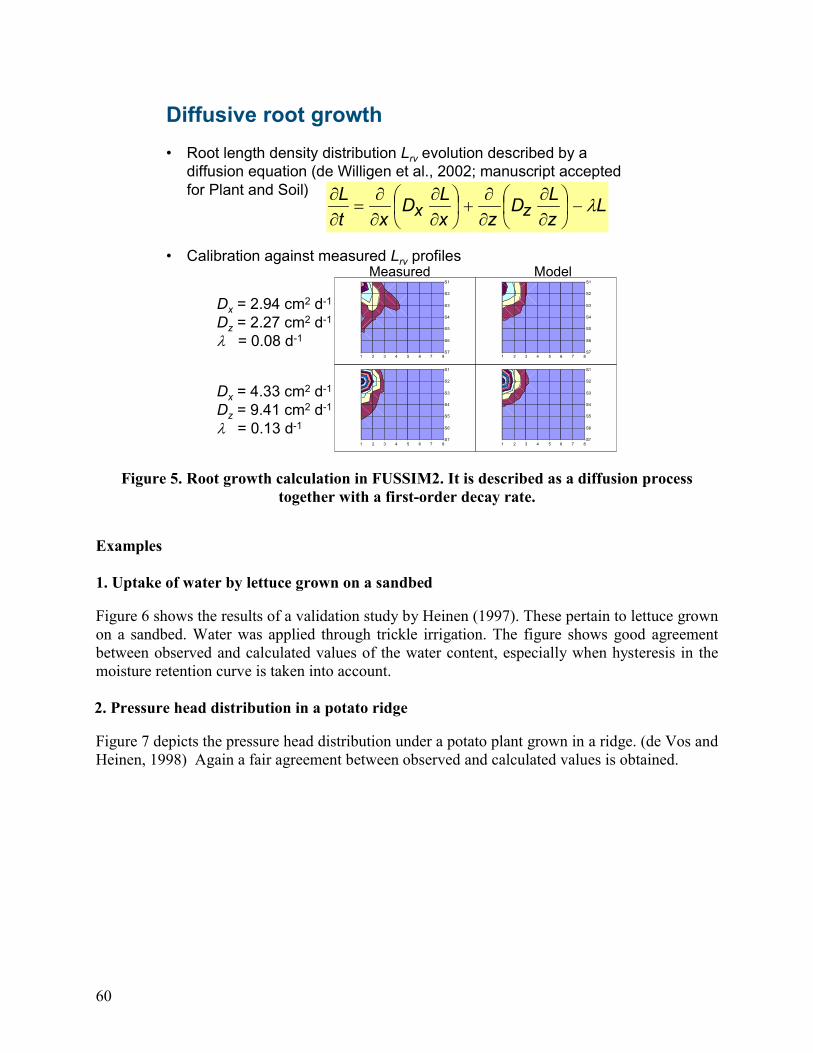
60
Diffusive root growth• Root length density distribution Lrv evolution described by a
diffusion equation (de Willigen et al., 2002; manuscript acceptedfor Plant and Soil)
• Calibration against measured Lrv profiles
LzLD
zxLD
xtL
zx ����
���
�
�
�
�
��
�
���
�
�
�
�
�
�
�
1 2 3 4 5 6 7 8
S1
S2
S3
S4
S5
S6
S71 2 3 4 5 6 7 8
S1
S2
S3
S4
S5
S6
S7
1 2 3 4 5 6 7 8
S1
S2
S3
S4
S5
S6
S71 2 3 4 5 6 7 8
S1
S2
S3
S4
S5
S6
S7
Measured Model
Dx = 2.94 cm2 d-1
Dz = 2.27 cm2 d-1
� = 0.08 d-1
Dx = 4.33 cm2 d-1
Dz = 9.41 cm2 d-1
�� = 0.13 d-1
Figure 5. Root growth calculation in FUSSIM2. It is described as a diffusion processtogether with a first-order decay rate.
Examples
1. Uptake of water by lettuce grown on a sandbed
Figure 6 shows the results of a validation study by Heinen (1997). These pertain to lettuce grownon a sandbed. Water was applied through trickle irrigation. The figure shows good agreementbetween observed and calculated values of the water content, especially when hysteresis in themoisture retention curve is taken into account.
2. Pressure head distribution in a potato ridge
Figure 7 depicts the pressure head distribution under a potato plant grown in a ridge. (de Vos andHeinen, 1998) Again a fair agreement between observed and calculated values is obtained.
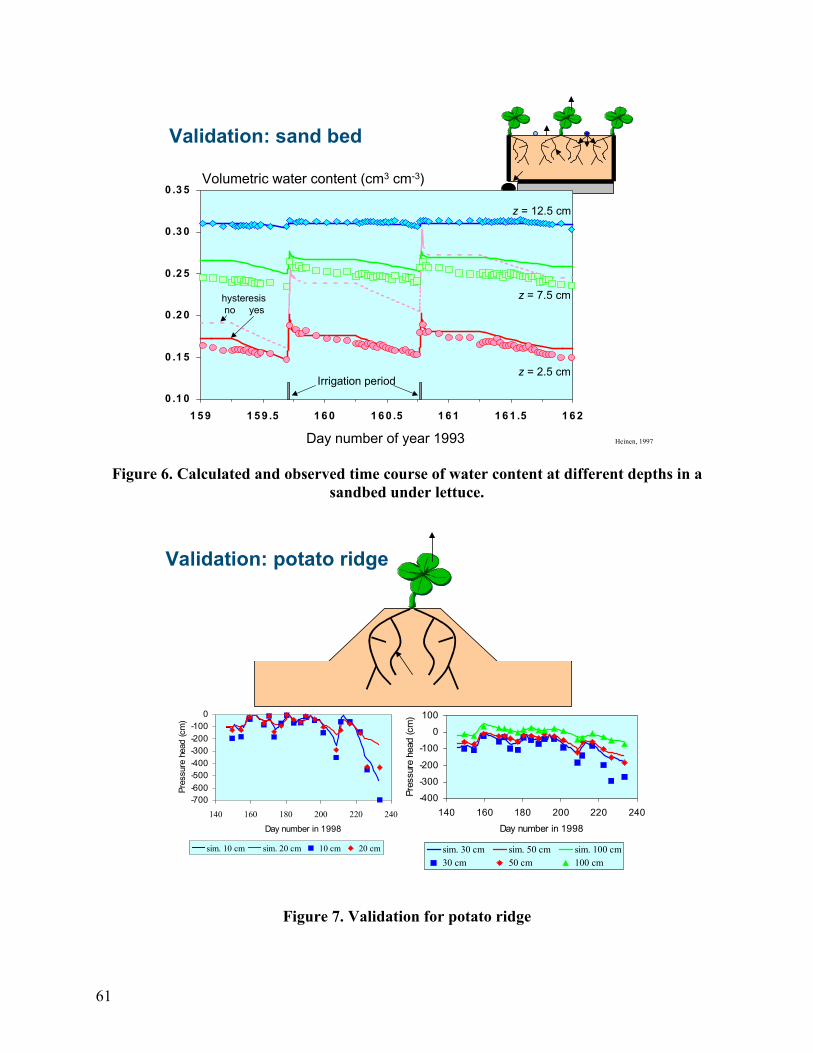
61
Validation: sand bed
0 .1 0
0 .1 5
0 .2 0
0 .2 5
0 .3 0
0 .3 5
1 5 9 1 5 9 .5 1 6 0 1 6 0 .5 1 6 1 1 6 1 .5 1 6 2
Volumetric water content (cm3 cm-3)
Day number of year 1993
Irrigation period
z = 12.5 cm
z = 7.5 cm
z = 2.5 cm
hysteresis no yes
Heinen, 1997
Figure 6. Calculated and observed time course of water content at different depths in asandbed under lettuce.
Validation: potato ridge
-700-600-500-400-300-200-100
0
140 160 180 200 220 240
Day number in 1998
Pres
sure
hea
d (c
m)
sim. 10 cm sim. 20 cm 10 cm 20 cm
-400-300-200
-100
0100
140 160 180 200 220 240Day number in 1998
Pres
sure
hea
d (c
m)
sim. 30 cm sim. 50 cm sim. 100 cm30 cm 50 cm 100 cm
Figure 7. Validation for potato ridge
62
Listing of most important inputs for calibration and validation
� General (spatial and temporal discretisation; initial and boundary conditions)
� Water movement (rain, water demand by crop, evaporation demand, hydraulic properties)
� Nutrient transport (longitudinal and transversal dispersivities, tortuosity parameters, Padsorption and fixation parameters, nutrient demand, fertilization)
� Water uptake, WU (transpiration reduction function, osmotic parameters in WU model)
� Nutrient uptake, NU (physiological maximum NU rate, minimum concentraion at rootsurface at which NU can occur)
� Root diffusive growth (diffusion coefficients and specific decay rate, root radius, rootfresh density, root dry matter content)
References
De Vos JA, Heinen, M (1999). Synchronization of application of manure with spatial andtemporal variation. (In Dutch). Alterra-rapport 110, 44 pp.
De Willigen P, van Noordwijk, DM (1987). Roots, plant production and nutrient use efficiency.PhD Thesis, Agricultural University, Wageningen, The Netherlands, 282 pp.
De Willigen P, van Noordwijk, DM (1994a). Mass flow and diffusion of nutrients to a root withconstant or zero-sink uptake. I. Constant uptake. Soil Science 157: 162-170.
De Willigen P, van Noordwijk, DM (1994b). Mass flow and diffusion of nutrients to a root withconstant or zero-sink uptake. I. Zero-sink uptake. Soil Science 157: 171-175.
Heinen M (1997). Dynamics of water and nutrients in closed, recirculating cropping systems inglasshouse horticulture. PhD Thesis, Agricultural University, Wageningen, The Netherlands, 270pp.
Heinen M., de Willigen, P (1998). FUSSIM2. A two-dimensional simulation model for waterflow, slute transport, and root uptake of water and nutrients in partly unsaturated porous media.Quantitative Approaches in Systems Analysis No. 20, AB-DLO and PE, Wageningen, TheNetherlands, 140 pp.
Heinen M, de Willigen, P (2001). FUSSIM2 version 5. New features and updated user’s guide.Alterra-rapport 363, 164 pp
63
Potential for application of HYDRUS-2D to analysis of water flow and solutetransport of bed layouts in irrigated cropping systems�
E Xevi and J Timsina
CSIRO Land and Water, Griffith, PMB 3, NSW 2680, Australia
Model description
Hydrus-2D is a windows based computer package capable of simulating water, heat and multiplesolutes movement in 2-D variably saturated (unsaturated, partially saturated, or fully saturated)media. The model was developed by scientists and students at U.S. Salinity Laboratory,Agricultural Research Station, Riverside, California. Rien van Genuchten and Jirka Simunek arethe lead authors of the computer program.
Description of the model (version 2.0), its validation, and details of input data requirements andoutput files generated are well-documented (Simunek et al. 1999). Here, only a summary ofmodel and the input data requirements are presented.
Hydrus-2D numerically solves Richards’ equation for saturated-unsaturated water flow and theconvection-dispersion for heat and solute transport. The flow equation incorporates a sink termto account for water uptake by plant roots. The heat transport equation considers transport due toconduction and convection with flowing water. The solute transport equations considerconvective-dispersive transport in the liquid phase, as well as diffusion in the gaseous phase.
The model can handle flow regions delineated by irregular boundaries, and the flow andtransport can occur in the vertical and horizontal planes, or in a 3-D region exhibiting radialsymmetry about the vertical axis. The water flow part of the model can deal with prescribedhead and flux boundaries, boundaries controlled by atmospheric conditions, free drainageboundary conditions, as well as simplified representation of nodal drains using results of electricanalog experiments. A mesh generator that is incorporated in the package generates unstructuredfinite element mesh for any domain and there are provisions for specifying water flowboundaries in addition to flux drainage and seepage faces. These pre-processing tools provideeasy characterization of any flow domain and are well suited for domains with irregularboundaries.
Discretization of the flow domain into triangular or rectangular regions enables water contentsand pressure heads to be determined along the soil profile at the middle and edges of bed thatprovides information about the redox potential and consequent effects on organic matter decay,N transformations and proliferation of plant roots. Velocity profiles provide information aboutpreferential water flow paths and possible soil erosion and disintegration of bed geometry. The © 2002 CSIRO. Published in Humphreys, E., and Timsina, J. (Eds.) (2002). Modelling irrigated cropping systems,with special attention to rice-wheat sequences and raised bed planting. Proceedings of a Workshop, CSIRO Landand Water, Griffith, NSW, Australia, 25-28 February 2002. CSIRO Land and Water Technical Report 25/02.

64
solute transport component provides information about the migration of salts and possiblemigration towards the top center of the bed. The flow equations incorporate a sink term (Feddeset. al. 1978) to account for water uptake by plant roots.
Data requirements
There are seven input data files, which consist of one or more input blocks identified by theletters from A through M. The input files and blocks are:
� SELECTOR.IN (A - Basic information; B – Material information; C – Timeinformation; D – Root water uptake information; E – Solute transportinformation; F – Heat transport information)
� MESHTRIA.TXT (G. Finite element mesh information)� DOMAIN.DAT (H – Nodal information; I – Element information)� BOUNDARY.IN (J – Boundary information)� ATMOSPH.IN (K – Atmospheric information)� DIMENSIO.IN (L – Dimension information)� FIT.IN (M – Inverse solution information)
Basic information consists of data detailing units (length, time, and mass), type of flow(horizontal, vertical, or axis-symmetric flow), number of iterations used, absolute water contenttolerance for nodes in the unsaturated part of the flow region, absolute pressure head tolerancefor nodes in the saturated part of the flow region, and setting up various logical variables eitherTRUE or FALSE depending upon the conditions used in simulation. Material informationincludes the number of soil materials and subregions, absolute values of the upper and lowerlimits of the pressure head interval, soil hydraulic properties model being used (i.e. vanGenuchten, Vogel and Cislerova, or Brooks and Corey), hysteresis, and van Genuchtenparameters (�s, �r, , n, m, Ks) specified for each soil type. Time information includes initialand maximum time increments and initial and final time of the simulation, etc. Root wateruptake information includes pressure heads, potential transpiration rates required for root wateruptake stress function using either Feddes et al. 1978 or van Genuchten 1987, and parametersthresholds for reducing the water uptake due to salinity. Solute and heat transport related dataare required only if their respective logical variables are set to TRUE.
Finite element mesh information includes data on the number of nodes, nodal points, meshedges, finite elements, and beginning and end nodes of edge. Nodal information consists of datasuch as initial values of pressure head and prescribed recharge/discharge rate at node ‘n’, valueof the water uptake distribution in the root zone at node ‘n’, nodal values of the dimensionlessscaling factors associated with the pressure head, saturated hydraulic conductivity, and watercontent, and initial values of temperature, solute concentrations, and adsorbed concentrationsbased on whether logical variables for solutes and temperatures are set to either TRUE orFALSE. Element information consists of data on element number, angle, and first and secondprincipal components.
65
Boundary information includes data on number of boundary and observation nodes, setting uplogical variables to TRUE or FALSE depending on seepage faces, hydraulic gradient boundary,drain simulation, and discharge-groundwater relationship, global node numbers for variousboundary nodes, width of the boundary associated with the boundary node, reference position ofthe groundwater, number of seepage faces and number of nodes on various seepage faces,sequential global numbers of various nodes on the first seepage face, number of drains andglobal numbers of various drains, number of elements surrounding various drains, globalnumbers of various elements surrounding the first drain, and codes specifying the type ofboundary condition for solute and heat transport applied to various boundary nodes if logicalvariables for each of solute or heat transport are set to TRUE.
Atmospheric information includes data such as minimum and maximum allowed pressure headat the soil surface, precipitation, potential evaporation and transpiration rates, drainage fluxacross the bottom boundary and groundwater level, and first and second time-dependenttemperatures and first, second, and third time-dependent solute concentrations for various nodesdepending upon whether logical variables for each of solute or heat transport are set to TRUE orFALSE.
Dimension information consists of data on the maximum number of nodes and elements in thefinite element mesh, and maximum number of boundary nodes, seepage faces, nodes along aseepage face, drains, elements surrounding one drain, materials, observation nodes, and solutesin a chain reaction.
Inverse solution information is not required if only the direct solution is calculated.
Output files: The program output consists of several output files, organized into 3 groups (T-level, P-level, and A-level information). Graphical display of results includes pressure heads,water content, velocity, solute concentrations, and temperature.
Model testing and applications
Hydrus-2D allows for the design of irrigation systems that provide optimal water to crops whilemitigating the pollution of groundwater resource from leached fertilizers and pesticides. It is atool that is ideally suited for preliminary investigations into the water, salt and nitrogen balanceof bed layouts. The model has been applied in both agricultural and non-agricultural sectors.The agricultural-related applications include: irrigation management, drip and sprinkler irrigationand tile drainage designs, salinization and reclamation processes, leaching of salt and movementof pesticides and non-point source pollution, seasonal simulation of water flow and plantresponse, and crop (e.g. cotton) growth modeling.
HYDRUS-2D has been validated and tested for a range of situations across the world. Forexample, Simunek et al. (1998a) used HYDRUS-2D to analyse the soil hydraulic properties dataestimated from the numerical inversion of the Richards’ equation using tension discpermeameter, modified cone penetrometer, and a multiple-step field extraction device in USA.They (Simunek et al. 1998b) also did parameter estimation analyses of the evaporation methodfor determining soil hydraulic properties using the model, also in USA. The model is also being
66
used in simulation of Cl profiles in soil and in understanding the origin and dynamics of Clconcentrations in the drainage water and the salinisation process, resulting from upwardmovement of Cl from the subsoil and from additions of fertilizer in surface soil, in a polder in theNetherlands (Vos et al. 2002) and in simulation of pesticide (picloram, atrazine, and simazine)leaching through soils and into groundwater in New Zealand (Liping et al. 2000). In the latterstudy, the model provided a reasonable link for pesticide transport in both the unsaturated zoneand groundwater, and both observed and simulated bromide and pesticide concentrationsindicated that solutes leached more quickly through the soils that were coarser and moreheterogeneous, but were more diluted in the groundwater system that was more heterogeneous,conductive, and dispersive. Mailhol et al. (2001) used HYDRUS-2D to assess the interpretationsof yield and nitrate leaching data and strengthen the conclusions derived from the observationsfrom two irrigation and fertilization strategies under furrow irrigation in south-east France. Themodel helped illustrate the risk of over-estimation of N leaching when using a simplified 1Dsolute-transport model. Also in France, Chabot et al. (2002) compared calculated soil waterflows from pressure head measurements with predicted pressure heads by the HYDRUS-2D, andpredicted the root water uptake patterns of sugarcane under a lysimeter. Rassam and Cook(2001) used the HYDRUS-2D to simulate the transport of SO4
-- ions through the soils andthrough drainage water in an acid-sulfate soil on a coastal plain in southeast Queensland inAustralia. Results of the field-scale inverse modeling showed that the hydraulic conductivity wastwo orders of magnitude higher than the field measurement using the auger hole method.Adopting the physical non-equilibrium model resulted in predictions of cumulative SO4
-- ions,which were closest to those observed in the field.
The model continues to evolve due to cooperative research and development agreement withColorado school of mines international groundwater modeling center (IGWMC) in Golden,Colorado. IGWMC distributes the model, provides help to users and runs short courses.
Conclusions
There is a great potential for using HYDRS-2D in simulating the water and nutrients flow underbed and furrow system of growing crops under irrigation situation.
References
Chabot R, Bouarfa S, Zimmer D, Chaumont C, Duprez C (2002). Sugarcane transpiration withshallow water-table: sap flow measurements and modeling. Agricultural Water Management 54,17-36.
De Vos JA, Raata, PAC Feddes, RA (2002). Chloride transport in a recently reclaimed Dutchpolder. Journal of Hydrology 257, 59-77.
Feddes RJ, Kowalik PJ, Zaradny H (1978). Simulation of field water use and crop yield.Simulation Monographs 188 p. Pudoc, Wageningen, Netherlands.
Mailhol JC, Ruelle P, Nemeth I (2001). Impact of fertilization practices on nitrogen leachingunder irrigation. Irrigation Science 20, 139-147.

67
Pang L, Close ME, Watt PC, Vincent KW (2000). Simulation of picloram, atrazine, and simazineleaching through two New Zealand soils and into groundwater using HYDRUS-2D. Journal ofContaminant Hydrology 44, 19-46.
Rassam DW, Cook FJ (2001). Modelling the transport of SO4-- ions in acid sulfate soils. In:
Ghassemi, F., Post, D., Sivapalan, M., Vertessy, R. (Eds.), MODSIM 2001 InternationalCongress on Modeling and Simulation. 1. Natural Systems (Part one). Modeling and SimulationSociety of Australia and New Zealand Inc., ANU, Canberra, Australia.
Simunek J, Sejina M, van Genuchten M Th (1999). The HYDRUS-2D software package forsimulating two-dimensional movement of water, heat, and multiple solutes in variably-saturatedmedia, version 2.0, U.S. Salinity Laboratory, USDA, ARS, Riverside, California. 227 pp.
Simunek J, van Genuchten M Th, Gribb MM, Hopmans JW (1998a). Parameter estimation ofunsaturated soil hydraulic properties from transient flow processes. Soil and Tillage Research 47,27-36.
Simunek J, Wendroth O, van Genuchten M Th (1998b). Parameter estimation analyses of theevaporation method for determining soil hydraulic properties. Soil Science Society of AmericaJournal 62, 894-905.

68
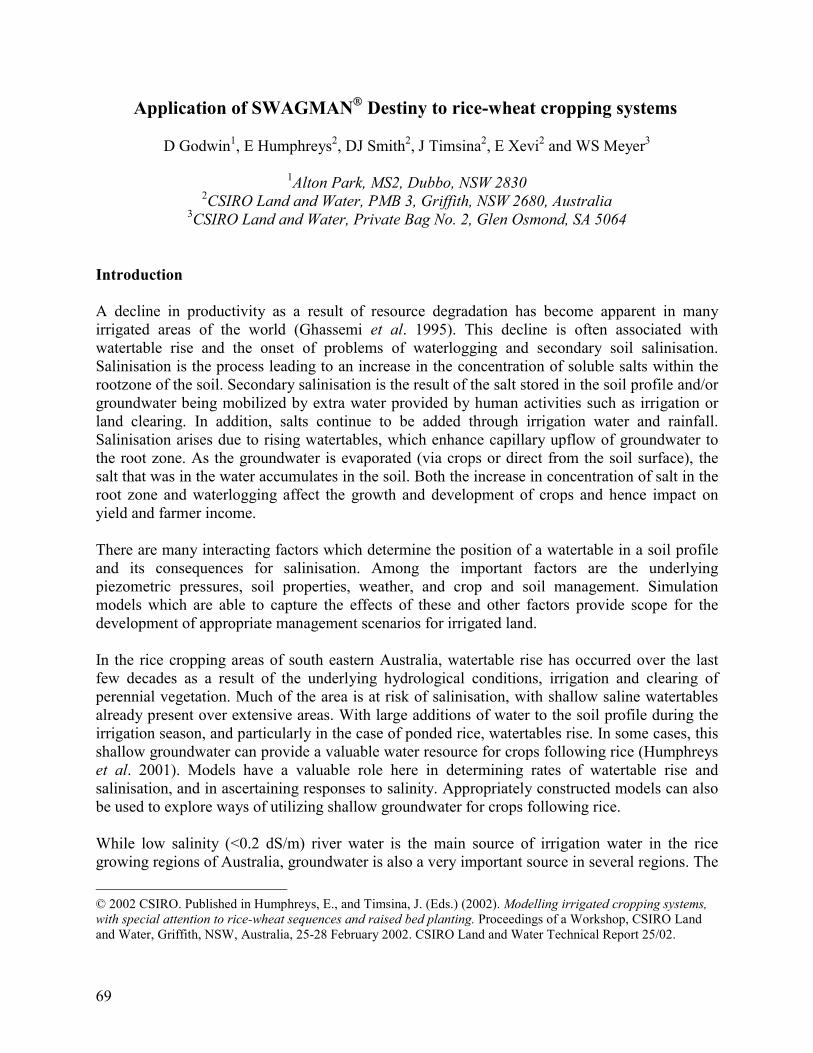
69
Application of SWAGMAN� Destiny to rice-wheat cropping systems�
D Godwin1, E Humphreys2, DJ Smith2, J Timsina2, E Xevi2 and WS Meyer3
1Alton Park, MS2, Dubbo, NSW 28302CSIRO Land and Water, PMB 3, Griffith, NSW 2680, Australia
3CSIRO Land and Water, Private Bag No. 2, Glen Osmond, SA 5064
Introduction
A decline in productivity as a result of resource degradation has become apparent in manyirrigated areas of the world (Ghassemi et al. 1995). This decline is often associated withwatertable rise and the onset of problems of waterlogging and secondary soil salinisation.Salinisation is the process leading to an increase in the concentration of soluble salts within therootzone of the soil. Secondary salinisation is the result of the salt stored in the soil profile and/orgroundwater being mobilized by extra water provided by human activities such as irrigation orland clearing. In addition, salts continue to be added through irrigation water and rainfall.Salinisation arises due to rising watertables, which enhance capillary upflow of groundwater tothe root zone. As the groundwater is evaporated (via crops or direct from the soil surface), thesalt that was in the water accumulates in the soil. Both the increase in concentration of salt in theroot zone and waterlogging affect the growth and development of crops and hence impact onyield and farmer income.
There are many interacting factors which determine the position of a watertable in a soil profileand its consequences for salinisation. Among the important factors are the underlyingpiezometric pressures, soil properties, weather, and crop and soil management. Simulationmodels which are able to capture the effects of these and other factors provide scope for thedevelopment of appropriate management scenarios for irrigated land.
In the rice cropping areas of south eastern Australia, watertable rise has occurred over the lastfew decades as a result of the underlying hydrological conditions, irrigation and clearing ofperennial vegetation. Much of the area is at risk of salinisation, with shallow saline watertablesalready present over extensive areas. With large additions of water to the soil profile during theirrigation season, and particularly in the case of ponded rice, watertables rise. In some cases, thisshallow groundwater can provide a valuable water resource for crops following rice (Humphreyset al. 2001). Models have a valuable role here in determining rates of watertable rise andsalinisation, and in ascertaining responses to salinity. Appropriately constructed models can alsobe used to explore ways of utilizing shallow groundwater for crops following rice.
While low salinity (<0.2 dS/m) river water is the main source of irrigation water in the ricegrowing regions of Australia, groundwater is also a very important source in several regions. The © 2002 CSIRO. Published in Humphreys, E., and Timsina, J. (Eds.) (2002). Modelling irrigated cropping systems,with special attention to rice-wheat sequences and raised bed planting. Proceedings of a Workshop, CSIRO Landand Water, Griffith, NSW, Australia, 25-28 February 2002. CSIRO Land and Water Technical Report 25/02.
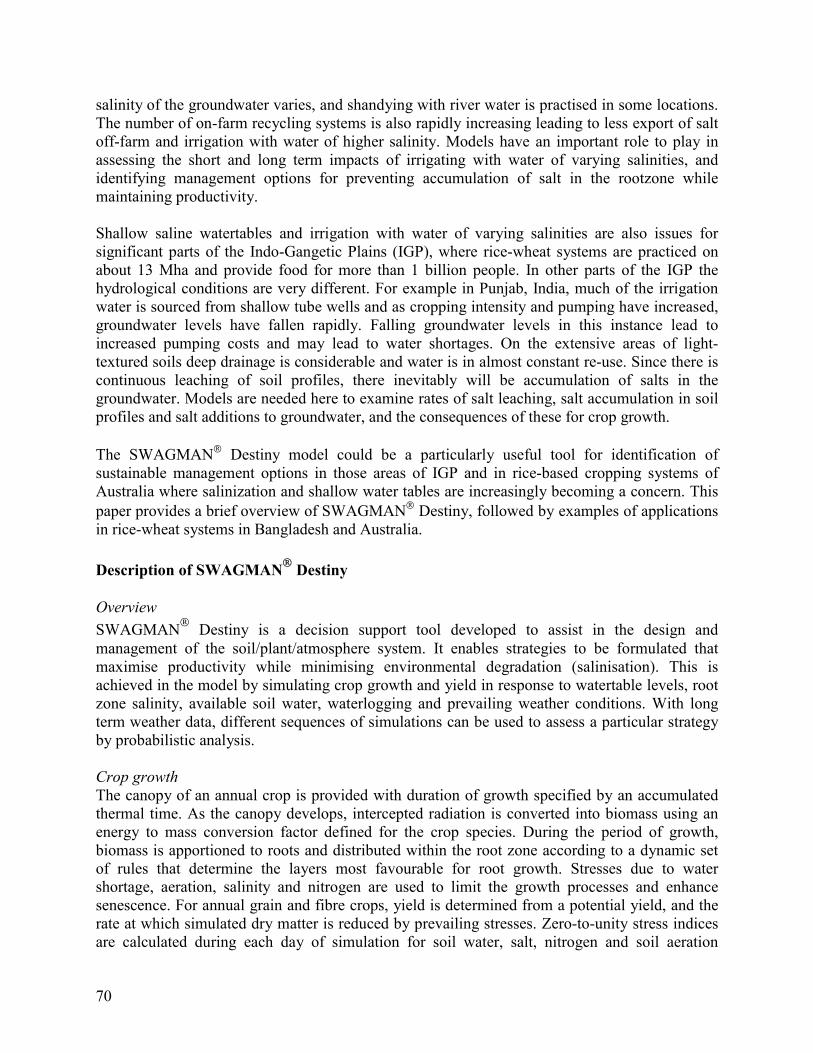
70
salinity of the groundwater varies, and shandying with river water is practised in some locations.The number of on-farm recycling systems is also rapidly increasing leading to less export of saltoff-farm and irrigation with water of higher salinity. Models have an important role to play inassessing the short and long term impacts of irrigating with water of varying salinities, andidentifying management options for preventing accumulation of salt in the rootzone whilemaintaining productivity.
Shallow saline watertables and irrigation with water of varying salinities are also issues forsignificant parts of the Indo-Gangetic Plains (IGP), where rice-wheat systems are practiced onabout 13 Mha and provide food for more than 1 billion people. In other parts of the IGP thehydrological conditions are very different. For example in Punjab, India, much of the irrigationwater is sourced from shallow tube wells and as cropping intensity and pumping have increased,groundwater levels have fallen rapidly. Falling groundwater levels in this instance lead toincreased pumping costs and may lead to water shortages. On the extensive areas of light-textured soils deep drainage is considerable and water is in almost constant re-use. Since there iscontinuous leaching of soil profiles, there inevitably will be accumulation of salts in thegroundwater. Models are needed here to examine rates of salt leaching, salt accumulation in soilprofiles and salt additions to groundwater, and the consequences of these for crop growth.
The SWAGMAN� Destiny model could be a particularly useful tool for identification ofsustainable management options in those areas of IGP and in rice-based cropping systems ofAustralia where salinization and shallow water tables are increasingly becoming a concern. Thispaper provides a brief overview of SWAGMAN� Destiny, followed by examples of applicationsin rice-wheat systems in Bangladesh and Australia.
Description of SWAGMAN� Destiny
OverviewSWAGMAN� Destiny is a decision support tool developed to assist in the design andmanagement of the soil/plant/atmosphere system. It enables strategies to be formulated thatmaximise productivity while minimising environmental degradation (salinisation). This isachieved in the model by simulating crop growth and yield in response to watertable levels, rootzone salinity, available soil water, waterlogging and prevailing weather conditions. With longterm weather data, different sequences of simulations can be used to assess a particular strategyby probabilistic analysis.
Crop growthThe canopy of an annual crop is provided with duration of growth specified by an accumulatedthermal time. As the canopy develops, intercepted radiation is converted into biomass using anenergy to mass conversion factor defined for the crop species. During the period of growth,biomass is apportioned to roots and distributed within the root zone according to a dynamic setof rules that determine the layers most favourable for root growth. Stresses due to watershortage, aeration, salinity and nitrogen are used to limit the growth processes and enhancesenescence. For annual grain and fibre crops, yield is determined from a potential yield, and therate at which simulated dry matter is reduced by prevailing stresses. Zero-to-unity stress indicesare calculated during each day of simulation for soil water, salt, nitrogen and soil aeration

71
(waterlogging). The most limiting of these stress indices is used to scale each day’s potentialgrowth.
Water and salt balanceThe water balance component of SWAGMAN� Destiny is based on the SALUS model ofRitchie (1999 unpublished). Additional variations of the SALUS water balance now occur in themost recent versions of the CERES models. The water balance model simulates infiltration ofwater with provision for accumulation of ponded water on the surface, drainage from the profile,surface runoff, uptake of water by the crop, evaporation from the soil surface, and upwardmovement of water associated with evaporation.
The model uses a daily time step and simulates the prevailing water balance for a point in thelandscape usually to the depth of rooting. Alterations to the SALUS model in SWAGMAN�
Destiny involve the addition of procedures to describe the interaction with deeper groundwater.To accomplish this water balance calculations are performed over a 5 m depth of soil from thesurface. In addition to this, piezometric pressure heads and fluxes at a plane 5 m deep are used asinputs to the model. Depending upon these pressures and the position of a watertable, water caneither enter or leave the soil profile through the bottom boundary.
SWAGMAN� Destiny also simulates the balance of salt over a 5 m depth of soil from thesurface. Salt additions from irrigation water and from saline groundwater entering the profile aresimulated. Salt losses from the profile due to salt in surface runoff, deep drainage or sub-surfacedrainage are also simulated. Salt concentrations in each soil layer are updated daily and theconsequences of this for root distribution and crop growth are determined. Detailed descriptionsof the model can be found in (Godwin et al. 2002).
Model Validation
SWAGMAN� Destiny has been evaluated in a range of conditions. Weighing lysimeterexperiments conducted by Meyer and co-workers (Meyer 1988; Meyer et al. 1990; Smith et al.1993, 1996), with careful observations of evapotranspiration (ET) from crops grown with orwithout shallow watertables, formed the basis of early testing. Comparison of simulations withobservations on ET, crop leaf area, root length density, volumetric water content, crop biomassand grain yield showed good agreement for crops of maize, wheat, soybean and lucerne.Additional field experiments on irrigated pastures overlying shallow saline watertables (Meyer etal. 1995) and data from perennial horticultural crops (peaches, vines) irrigated with saline waterfrom several locations in Victoria have also been used to test the model (Boland et al. 1997) andapply it to evaluate lands throughout Victoria previously not used for growing horticultural crops(Agricultural Victoria 1999). Additional validation of the groundwater simulation has come fromobservations tracking the watertables on a dryland pasture site in central Victoria. Details ofother validation studies are presented in Xevi et al. (2002).
More recently, SWAGMAN� Destiny was validated against the performance of wheat growingin lysimeters and fields in the rice growing areas of south eastern Australia. Both the CERESWheat and SWAGMAN� Destiny models were calibrated for three wheat varieties –Bindawarra, Janz and Yecora, and validated for a range of crop and soil parameters against
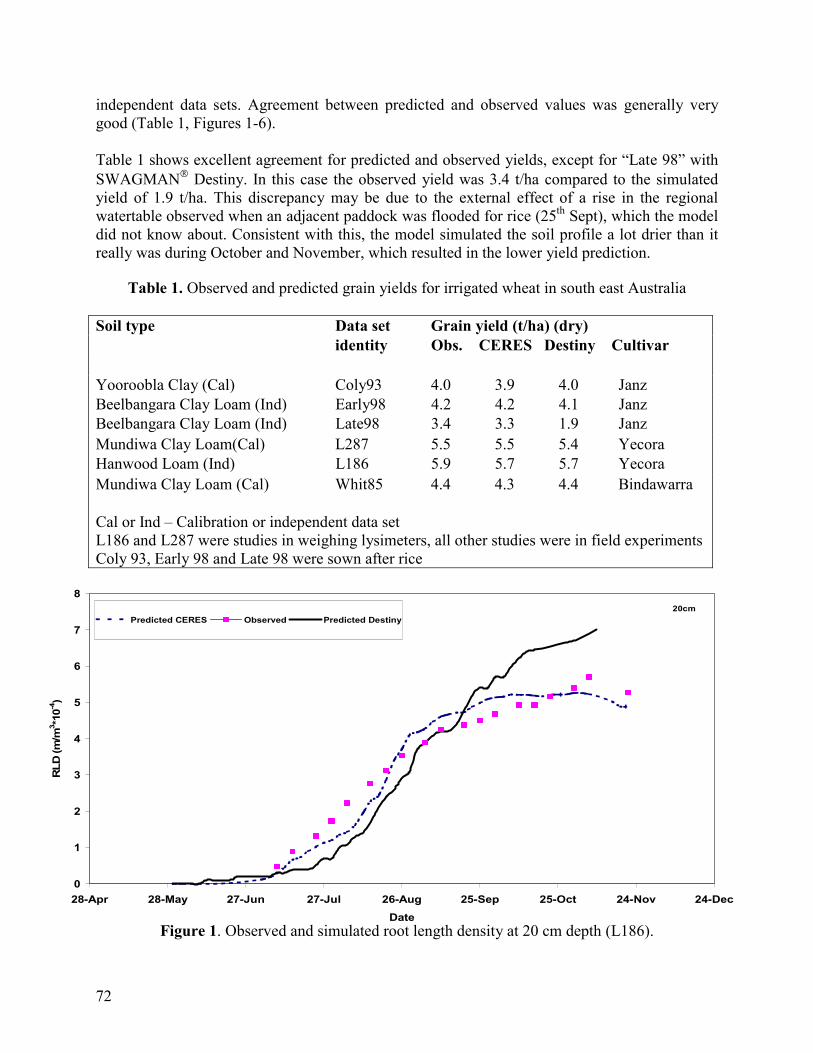
72
independent data sets. Agreement between predicted and observed values was generally verygood (Table 1, Figures 1-6).
Table 1 shows excellent agreement for predicted and observed yields, except for “Late 98” withSWAGMAN� Destiny. In this case the observed yield was 3.4 t/ha compared to the simulatedyield of 1.9 t/ha. This discrepancy may be due to the external effect of a rise in the regionalwatertable observed when an adjacent paddock was flooded for rice (25th Sept), which the modeldid not know about. Consistent with this, the model simulated the soil profile a lot drier than itreally was during October and November, which resulted in the lower yield prediction.
Table 1. Observed and predicted grain yields for irrigated wheat in south east Australia
Soil type Data set Grain yield (t/ha) (dry)identity Obs. CERES Destiny Cultivar
Yooroobla Clay (Cal) Coly93 4.0 3.9 4.0 JanzBeelbangara Clay Loam (Ind) Early98 4.2 4.2 4.1 JanzBeelbangara Clay Loam (Ind) Late98 3.4 3.3 1.9 JanzMundiwa Clay Loam(Cal) L287 5.5 5.5 5.4 YecoraHanwood Loam (Ind) L186 5.9 5.7 5.7 YecoraMundiwa Clay Loam (Cal) Whit85 4.4 4.3 4.4 Bindawarra
Cal or Ind – Calibration or independent data setL186 and L287 were studies in weighing lysimeters, all other studies were in field experimentsColy 93, Early 98 and Late 98 were sown after rice
Figure 1. Observed and simulated root length density at 20 cm depth (L186).
0
1
2
3
4
5
6
7
8
28-Apr 28-May 27-Jun 27-Jul 26-Aug 25-Sep 25-Oct 24-Nov 24-DecDate
RLD
(m/m
3 *10-4
)
Predicted CERES Observed Predicted Destiny20cm

73
Figure 2. Observed and simulated soil volumetric water content at 10 cm depth (Early 98).
Figure 3. Observed and simulated soil volumetric water content at 60 cm depth (Early 98).
0.10
0.15
0.20
0.25
0.30
0.35
0.40
0.45
0.50
24-Feb 15-Apr 4-Jun 24-Jul 12-Sep 1-NovDate
VWC
Predicted CERES Observed Predicted Destiny10cm
0.10
0.15
0.20
0.25
0.30
0.35
0.40
0.45
0.50
24-Feb 15-Apr 4-Jun 24-Jul 12-Sep 1-NovDate
VWC
Predicted CERES Observed Predicted Destiny60cm
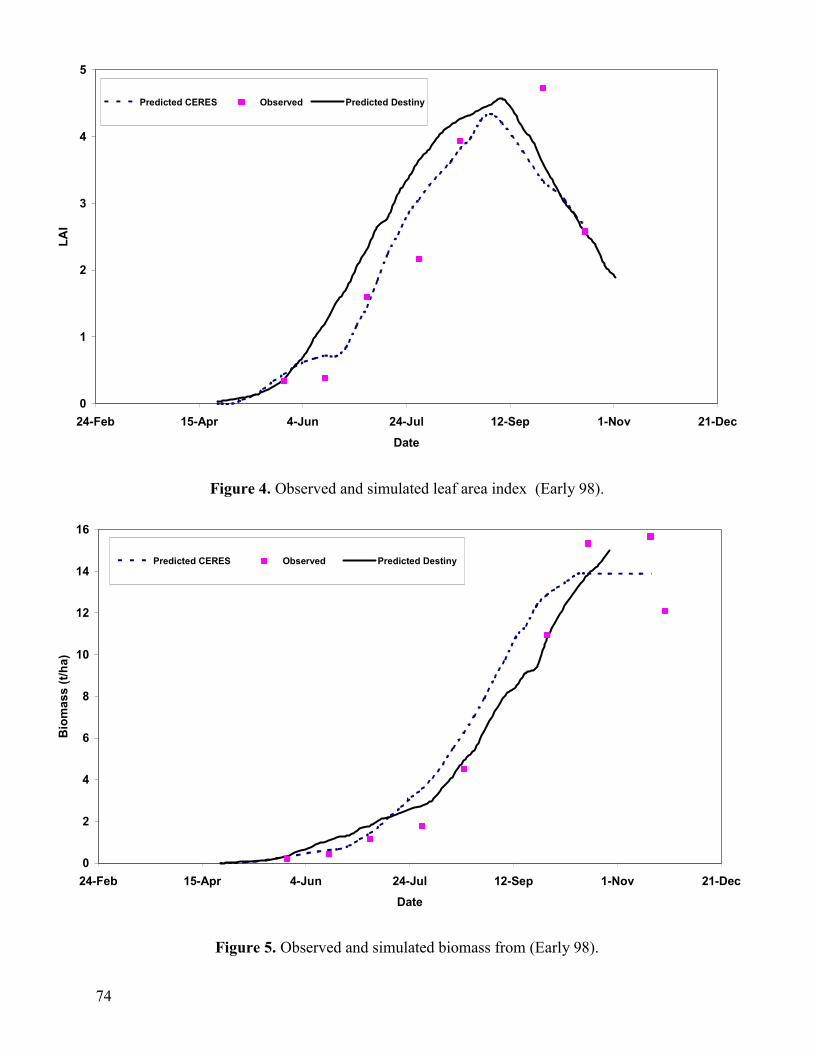
74
Figure 4. Observed and simulated leaf area index (Early 98).
Figure 5. Observed and simulated biomass from (Early 98).
0
1
2
3
4
5
24-Feb 15-Apr 4-Jun 24-Jul 12-Sep 1-Nov 21-DecDate
LAI
Predicted CERES Observed Predicted Destiny
0
2
4
6
8
10
12
14
16
24-Feb 15-Apr 4-Jun 24-Jul 12-Sep 1-Nov 21-DecDate
Biom
ass
(t/ha
)
Predicted CERES Observed Predicted Destiny

75
Figure 6. Observed and simulated ETcrop (L186).
Model applications in rice-wheat cropping systems
Timsina et al. (2000) used SWAGMAN� Destiny to examine crop productivity options formungbean grown in the pre-monsoon season in Bangladesh. Mungbean is a short duration cropwhich can be grown immediately prior to the main wet season rice crop in the rice-wheatcropping areas of Bangladesh. During this season there can be extended periods without rain andalso periods of excessive rainfall if the pre-monsoon rains arrive early. SWAGMAN� Destinywas used together with long term weather records to determine tradeoffs between early and lateplanted crops. Early sown crops are more likely to suffer moisture deficit stress early in theseason but can avoid some of the problems of waterlogging late in the season. Later sown cropsavoid the earlier water stress but generally are more likely to suffer from waterlogging. Themodel showed that yields were higher for earlier planting, but that responses to planting timewere very much affected by the depth of the underlying watertable (Figure 7). With earlyplantings, the crop was able to utilize some water from shallow watertables, but the presence ofshallow watertables exacerbated later season waterlogging. Yields were much higher wherewatertables were deep, for all sowing dates. Other simulations suggested the potential forshallow surface drains to increase mungbean yields.
0
2
4
6
8
10
12
28-Apr 28-May 27-Jun 27-Jul 26-Aug 25-Sep 25-Oct 24-Nov 24-DecDate
ETcr
op (m
m)
Predicted CERES Observed Predicted Destiny

76
Figure 7. Effect of planting date and water table depth of mungbean on grain yield at Nashipur,simulated using SWAGMAN� Destiny, under non-drained shallow and deep watertable fields
with irrigation. The water table depths were set at 0.5 and 5.0 m.
In rice cropping regions of south eastern Australia SWAGMAN� Destiny was used to explorethe likely yields of Janz wheat sown after rice on a red clay loam soil, and impacts onwatertables and rootzone salinity, for a range of site and management conditions.
Effect of seasonal variabilityYield was determined for 39 different years of weather data (1962-1999) for wheat sown at theend of April (“early”) in a situation with a shallow (0.5 m), fresh (1 dS/m) watertable, and noirrigation. Figure 8 shows that yields vary greatly from next to nothing to over 6 t/ha, dependingon the incidence and amount of rain. The lowest yield (0.1 t/ha) occurred in 1994 when therewere only 58 mm of rain between sowing and maturity, with 20 mm in each of June and July,and virtually no effective rain after that. The results suggest that in about 60% of years, yields ofearly sown wheat after rice will exceed 3.2 t/ha with no irrigation if there is a shallow, freshwatertable at the time of sowing. The results also suggest that yields would be less than 5 t/ha in85% of years.
Shallow watertable
0.0
0.2
0.4
0.6
0.8
1.0
0.0 0.5 1.0 1.5 2.0Yield (t/ha)
Cum
ulat
ive
prob
abili
ty
Mar-15 Apr-07 Apr-30
Deep watertable
0.0
0.2
0.4
0.6
0.8
1.0
0.0 0.5 1.0 1.5 2.0Yield (t/ha)
Cum
ulat
ive
prob
abili
ty
Mar-15 Apr-07 Apr-30

77
Effect of time of sowingFor exactly the same conditions as in Figure 8, a late sown (end of June) non-irrigated Janz crophas a much lower yield potential. Figure 9 shows that yields are generally reduced by 1-2 t/ha,and will always be less than 4 t/ha, whereas with early sown Janz yield exceeds 4 t/ha in 40% ofyears (Figure 8). The yield of the late sown crop is lower because it experiences highertemperatures during grain filling, shortening the grain filling period, and because the crop runsout of water towards the end of the season. The yield decline with late sowing is consistent withobservations for non-irrigated wheat sown after rice in the field (Humphreys et al. 2001).
Figure 8. Yield of Janz wheat sown on 24 April, on a red clay loam soil with a shallow, freshwatertable and no irrigation. Initial soil water content (SWC) was “wet” to represent the wet soil
profile present after a rice crop.
Figure 9. Effect of time of sowing on of Janz on a red clay loam soil with a shallow, freshwatertable, and no irrigation. Early wheat was sown on 24 April, late wheat on 29 June.
0.0
0.2
0.4
0.6
0.8
1.0
0 1 2 3 4 5 6 7Yield (t/ha)
Cum
ulat
ive
prob
abilt
y
Initial WT Depth 0.5mInitial WT salinity 1 dS/mInitial SWC "wet"No irrigation
0.0
0.2
0.4
0.6
0.8
1.0
0 1 2 3 4 5 6 7Yield (t/ha)
Cum
ulat
ive
prob
abili
ty
Late wheat Early wheat
Initial WT Depth 0.5mInitial WT salinity 1 dS/mInitial SWC "wet"No irrigation

78
Effect of a shallow saline watertableFor early sown Janz after rice, if the watertable is shallow and saline at the time of sowing, andthe crop is not irrigated, then yields are much lower than for a fresh watertable (Figure 10).However for an initial 1.5 m deep watertable, yields are unaffected by salinity of the watertable.
0.0
0.2
0.4
0.6
0.8
1.0
0 1000 2000 3000 4000 5000 6000 7000Yield (kg/ha)
Cum
ulat
ive
prob
abili
ty
1 dS/m wt 0.5 m20 dS/m wt 0.5 m1 dS/m wt 1.5 m20 dS/m wt 1.5 m
Figure 10. Effect of watertable salinity of yield of early sown Janz sown after rice on a red clayloam, with no irrigation.
Effect of irrigationA single irrigation during flowering increases yields substantially in most years, and further yieldincrease is achieved with a second irrigation during grain filling (Figure 11). Frequent irrigationto avoid soil water deficit (e.g. whenever crop water use reaches 60 mm since the previousirrigation) raises yields of both early and late sown wheat for all watertable conditions. Theexample in Figure 11 is for a shallow, fresh watertable, and shows that yields will exceed 4 t/hain most years with one irrigation, and 5 t/ha with frequent irrigation.
What happens to the watertable?Without irrigation, the depth to the watertable is almost always lowered when wheat is sownafter rice, except for the wettest of years (Figure 12) in areas where there is a downwards leakageto depth (NB this will not be the case in discharge areas, which occur in parts of the irrigationareas). The lowering is due to two factors – crop water use from capillary upflow from thewatertable, and slow downwards percolation of the shallow groundwater to deeper depths. In theexample in Figure 12, the downwards leakage rate was 0.1 mm/day and the watertable was at 1.5m at the time the wheat was sown, and in most years was deeper than 1.5 m at the end of theseason with no irrigation.
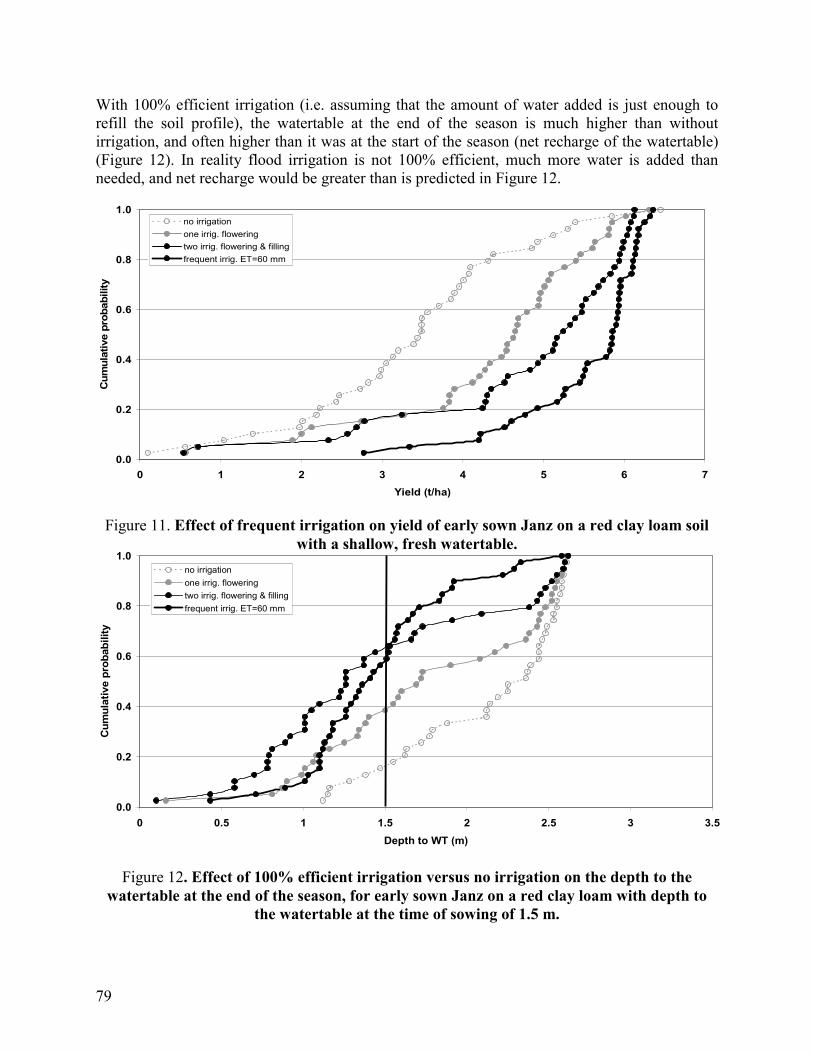
79
With 100% efficient irrigation (i.e. assuming that the amount of water added is just enough torefill the soil profile), the watertable at the end of the season is much higher than withoutirrigation, and often higher than it was at the start of the season (net recharge of the watertable)(Figure 12). In reality flood irrigation is not 100% efficient, much more water is added thanneeded, and net recharge would be greater than is predicted in Figure 12.
Figure 11. Effect of frequent irrigation on yield of early sown Janz on a red clay loam soilwith a shallow, fresh watertable.
Figure 12. Effect of 100% efficient irrigation versus no irrigation on the depth to thewatertable at the end of the season, for early sown Janz on a red clay loam with depth to
the watertable at the time of sowing of 1.5 m.
0.0
0.2
0.4
0.6
0.8
1.0
0 0.5 1 1.5 2 2.5 3 3.5Depth to WT (m)
Cum
ulat
ive
prob
abili
ty
no irrigationone irrig. floweringtwo irrig. flowering & fillingfrequent irrig. ET=60 mm
0.0
0.2
0.4
0.6
0.8
1.0
0 1 2 3 4 5 6 7Yield (t/ha)
Cum
ulat
ive
prob
abili
ty
no irrigationone irrig. floweringtwo irrig. flowering & fillingfrequent irrig. ET=60 mm

80
Further results are presented in Smith and Humphreys (2001) and Smith et al. (2002).
Conclusions
With the capacity to determine both the onset of watertable problems and soil salinisation as wellas the impact of these on crop performance, SWAGMAN� Destiny is a useful tool foridentifying and examining crop management strategies in rice-based cropping systems whichstrive to minimise environmental harm and maximize productivity.
References
Agriculture Victoria (1999). Land capability and environmental risk analysis of the LoddenMurray 2000 plus prime development zone. Final report to Lodden Murray 2000 plus SteeringCommittee. Centre for Land Protection Research, Agriculture Victoria, DNRE, Bendigo,Victoria.
Boland AM, Martin S, Jerie P (1997). Evaluation of critical irrigation quality for perennialhorticulture. Project #I5011. Final Report submitted to Murray Darling Basin Commission todevelop Natural Resource Management Strategy. 75 pp (plus appendices).
Ghassemi I, Jakeman AJ, Nix HA (1995). Salinisation of Land and Water Resources. UNSWPress Ltd, Sydney (Australia).
Godwin D, Meyer WS, Xevi E, White RJG (2002). SWAGMAN� Destiny: A simulation modelof irrigated crops as affected by irrigation practice, watertables and salinity. 1. Model description(in preparation).
Humphreys E, Bhuiyan AM, Fattore A, Fawcett B, Smith DJ (2001). The benefits of wintercrops after rice harvest Part 1: Results of field experiments. Farmers' Newsletter Large Area No.157, pp. 39-42.
Meyer WS (1988). Development of management strategies for minimising salinisation due toirrigation: Quantifying components of the water balance under irrigated crops. AWRACResearch Report, 84/162.
Meyer WS, Dugas WA, Barrs HD, Smith RCG, Fleetwood RJ (1990). Effects of soil type onsoybean crop water use in weighing lysimeters 1. Evaporation. Irrig. Sci. 11: 69-75.
Meyer WS, Godwin DC, White RJG, Smith DJ (1995). NRMS Cohuna Project. Detailedsimulations of upward water movement using SWAGMAN Destiny. A Consultancy Reportsubmitted to Goulbourn Valley Waters.
Smith DJ, Humphreys E (2001). The benefits of winter crops after rice harvest Part 2: Models topredict what will happen in your situation. Farmers' Newsletter Large Area No. 157, pp. 36-38.

81
Smith DJ, Meyer WS, Barrs HD (1993). Effects of soil type on maize crop daily water use andcapillary upflow in weighing lysimeters during 1989/90. CSIRO Division of Water Resources,Technical Memorandum 93/20.
Smith DJ, Meyer WS, Barrs HD, Schwamberger, EC (1996). Lucerne daily water use andcapillary upflow using weighing lysimeters: Effects of soil type and groundwater salinity.CSIRO Division of Water Resources, Technical Memorandum 96/6.
Smith DJ, Humphreys E, Godwin, D ( 2002). Effect of management, site and seasonal conditionson net recharge and yield of wheat sown after rice. CSIRO Land and Water Technical Report (inpreparation).
Timsina J, Godwin D, Connor DJ (2000). Watertable management for mungbean within rice-wheat cropping systems of Bangladesh: a simulation study. Proceedings (CD-ROM computerfile) of the International Symposium on Systems Approaches for Agricultural Development(SAAD3) symposium. 8-10 November, Lima, Peru.
Xevi E, Smith DJ, Humphreys E, Godwin D, Meyer WS (2002). SWAGMAN� Destiny: Asimulation model of irrigated crops as affected by irrigation practice, watertables and salinity. 2.Model testing and evaluation (in preparation).

82
83
A version of APSIM with multi-point/spatial capabilities�
N I Huth, M E Probert and M J Robertson
CSIRO Sustainable Ecosystems, 120 Meiers Road, Indooroopilly. Queensland, 4068
Abstract
APSIM version 2, released in 2001, provides capabilities for multi-point simulations.Applications for this functionality include systems where there are spatial issues (e.g. multiplepaddocks, agroforestry, windbreak effects) and also systems with smaller scale heterogeneity(e.g. skip rows, beds and furrows). Examples of a windbreak effect and skip row maize areillustrated.
Introduction
The Agricultural Production Systems Simulator, APSIM (McCown et al. 1996) has beendeveloped to provide a flexible framework for simulation of diverse agro-ecological and naturalecosystems. The early releases of APSIM were strictly one dimensional in how they dealt withboth above- and belowground components that need to be modelled.
However it has long been recognised that many systems have spatial dimensions that it would bedesirable to represent in APSIM models. The types of spatial issues of interest are situations likemultiple paddocks (to better represent farming systems, especially those involving grazinganimals), agroforestry (to cope with the tree-crop interface), and effects of windbreaks. Howeverit is also recognised that the approach that has been adopted to address these spatial issues mightalso have application involving heterogeneity at a smaller scale. The multi-point capabilitybecame operational in APSM version 2, which was released in the later part of 2001.
In this contribution, we do three things:� outline the concept that is used to introduce a multi-point capability into APSIM� show two examples of how this capability has been used – one is a fairly well developed
application studying effects of windbreaks (Huth et al. 2002), the other a somewhatpreliminary look at how it could be used to study geometry effects in soil at a scalecomparable to what might be involve when rice-wheat systems are grown on beds
� finally, we offer some comments on the need for geometry effects in cropping systemsmodels based on experience in modelling other systems where there might appear to beimportant geometry issues.
Modelling spatial effects using APSIM
© 2002 CSIRO. Published in Humphreys, E., and Timsina, J. (Eds.) (2002). Modelling irrigated cropping systems,with special attention to rice-wheat sequences and raised bed planting. Proceedings of a Workshop, CSIRO Landand Water, Griffith, NSW, Australia, 25-28 February 2002. CSIRO Land and Water Technical Report 25/02.
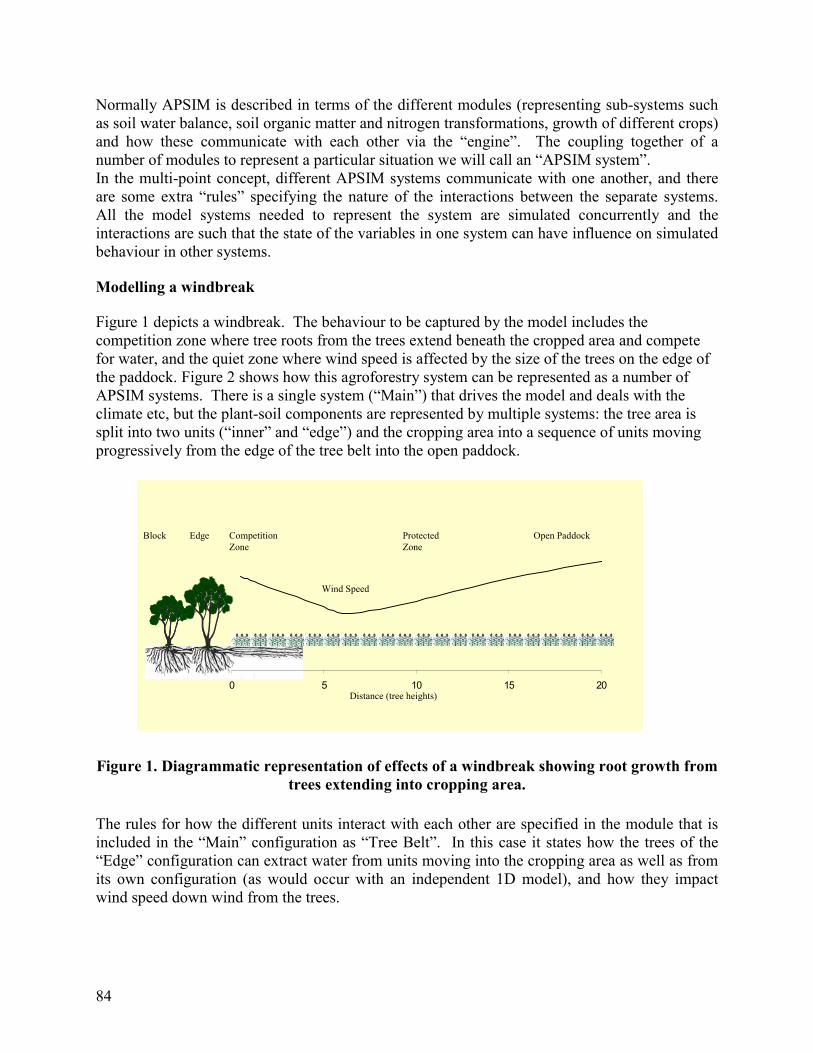
84
Normally APSIM is described in terms of the different modules (representing sub-systems suchas soil water balance, soil organic matter and nitrogen transformations, growth of different crops)and how these communicate with each other via the “engine”. The coupling together of anumber of modules to represent a particular situation we will call an “APSIM system”.In the multi-point concept, different APSIM systems communicate with one another, and thereare some extra “rules” specifying the nature of the interactions between the separate systems.All the model systems needed to represent the system are simulated concurrently and theinteractions are such that the state of the variables in one system can have influence on simulatedbehaviour in other systems.
Modelling a windbreak
Figure 1 depicts a windbreak. The behaviour to be captured by the model includes thecompetition zone where tree roots from the trees extend beneath the cropped area and competefor water, and the quiet zone where wind speed is affected by the size of the trees on the edge ofthe paddock. Figure 2 shows how this agroforestry system can be represented as a number ofAPSIM systems. There is a single system (“Main”) that drives the model and deals with theclimate etc, but the plant-soil components are represented by multiple systems: the tree area issplit into two units (“inner” and “edge”) and the cropping area into a sequence of units movingprogressively from the edge of the tree belt into the open paddock.
Figure 1. Diagrammatic representation of effects of a windbreak showing root growth fromtrees extending into cropping area.
The rules for how the different units interact with each other are specified in the module that isincluded in the “Main” configuration as “Tree Belt”. In this case it states how the trees of the“Edge” configuration can extract water from units moving into the cropping area as well as fromits own configuration (as would occur with an independent 1D model), and how they impactwind speed down wind from the trees.
0 5 10 15 20
Block Edge CompetitionZone
ProtectedZone
Open Paddock
Wind Speed
Distance (tree heights)0 5 10 15 20
Block Edge CompetitionZone
ProtectedZone
Open Paddock
Wind Speed
Distance (tree heights)

85
Results from such a simulation are shown in Figure 3. Obvious features of the system, such asbetter growth of the edge trees than the inner trees, less soil water in the cropped area prior tosowing, and reduced growth of the crop near the tree belt, are satisfactorily captured by themodel.
Figure 2. APSIM software configuration of the windbreak example shown in Figure 1
Point 1•Crop•SoilWat•SoilN•Residue•Tree root•Micromet•Report•Manager
Edge•Forest•SoilWat•SoilN•Residue•Tree root•Micromet•Report•Manager
Point 2•Crop•SoilWat•SoilN•Residue•Tree root•Micromet•Report•Manager
Point N•Crop•SoilWat•SoilN•Residue•Tree root•Micromet•Report•Manager
…..
Main•Met•Report•Manager•Tree Belt
Cropping Area
Inner•Forest•SoilWat•SoilN•Residue•Tree root•Micromet•Report•Manager
Tree Area

86
Figure 3. Output from simulation of windbreak effects. Results for pre-sowing soil waterand crop yields (lower panes) show output for different years.
Tree Age (years)
0 5 10 15 20 25 30
Stem
Woo
d Vo
lum
e (m
3 /ha)
0
100
200
300
400
500
600
Edge TreesInner Trees
Distance from Windbreak (m)
0 25 50 75 100 200 300 400 500
Chi
ckpe
a Yi
eld
(kg/
ha)
0
200
400
600
800
1000
1200
1400
1600
1800
2000
Pres
owin
g So
il W
ater
(mm
)
0
50
100
150
200
250
300

87
Modelling skip row maize
The axes of symmetry in Figure 4 indicate that the system can be reduced to a single 1-Drepresentation of the above ground canopy which resides in the main system configuration andfour sub-units to represent the soil (each 0.5m wide). Row-spacing effects on light extinction ishandled in the main program.
Figure 4. Row spacing of double skip row” maize (rows 1m apart) and APSIM softwareconfiguration of the system.
The interactions between the soil sub-units are defined in the “Root Controller”. In the exampleshown at the workshop, the only effects considered were root growth and water uptake. The
SkipRow
SkipRow
SkipRow
SkipRow
Point 1•SoilWat•SoilN•Residue•Root•Report•Manager
Point 2•SoilWat•SoilN•Residue•Root•Report•Manager
Point 4•SoilWat•SoilN•Residue•Root•Report•Manager
Main•Met•Report•Manager•Maize•Root Controller
Soil System
Point 3•SoilWat•SoilN•Residue•Root•Report•Manager
Plant-AtmosphereSystem
Point 1•SoilWat•SoilN•Residue•Root•Report•Manager
Point 2•SoilWat•SoilN•Residue•Root•Report•Manager
Point 4•SoilWat•SoilN•Residue•Root•Report•Manager
Main•Met•Report•Manager•Maize•Root Controller
Soil System
Point 3•SoilWat•SoilN•Residue•Root•Report•Manager
Plant-AtmosphereSystem

88
maize module in the main configuration willdetermine the downwards growth of roots in thesub-units directly under the crop. The “RootController” then specifies the lateral spread ofroots into the adjoining units. The daily outputfor the four sub-units then permits theconstruction of the full matrix of distance (acrossthe row / skip row) x depth x time for soil watercontent.Figure 5 illustrates the pattern of waterextraction on two occasions, early and late in thelife of the crop. For the simulation shown, thesoil was uniformly wet at initialisation. Thesesnapshots in time illustrate how water under theskip rows is used later in the growth of the crop.By maturity, the simulation shows that the upper60 cm of soil has almost uniform water contentacross the rows and skip rows, but there is stillsome difference in moisture content at depth.
Figure 5. Contours of volumetric soil water content under skip row maize early in thegrowth of the crop (left hand figure) and approaching maturity (right hand pane). The
maize rows were located at –50 and +50 cm on the horizontal axis.
In the example that was prepared for the workshop the emphasis was placed on water extractionby the crop roots. However it would seem straightforward to extend the interaction to the uptakeof nitrogen, to fertilizer placement effects, and also lateral flow of water between units whenwater content differs between adjoining cells (a similar algorithm as already used in APSIMSoilWat module (Probert et al. 1998) for unsaturated flow of water within a sub-unit).
On the need for including geometry effects in cropping system models
The growing of rice-wheat systems using beds would seem to call for models that canaccommodate the special demands caused by the geometry of the soil surface, the dimension ofthe beds, and the presence of irrigation water in the furrows. Here we draw attention to
Row Position (cm)
-200 -100 0 100 200
Dep
th (c
m)
0
50
100
150
200
0.45
0.45
0.40
0.40
0.40
0.40
0.40
0.40
0.400.35
0.35
0.35 0.35
0.35
0.35
0.30
0.30 0.30
0.30
0.25
0.25 0.25
0.25
0.45
0.45
Row Position (cm)
-200 -100 0 100 200
Dep
th (c
m)
0
50
100
150
200
0.40
0.40
0.40
0.40
0.40
0.35
0.35
0.35
0.35
0.35
0.30
0.30
0.30
0.30
0.30
0.25
0.25
0.25
0.25
0.25
0.30
0.25
0.25 0.25
0.25
0.30 0.30
0.30

89
somewhat similar features (excluding flooding) that are present in other cropping systems, andwhere it has been the experience of colleagues that useful simulations have been obtained usingstrictly 1-D models.
Some systems that have been modeled without addressing seemingly important “geometryissues” include: • sugarcane which is typically grown on 1.5m spacing with the rows hilled up
- placement of fertilizer in the hill- furrow (& alternate furrow) irrigation systems- trickle tape (typically at 30 cm depth), including fertigation
• skip row cotton (also skip row sorghum, maize)• irrigated cotton• intercropping (sorghum/pigeonpea; maize/cowpea)
The multi-point functionality now available in APSIM has not yet been applied to any of thesystems listed above. However experiments are in progress to study skip row maize (MikeRobertson, unpublished) and these will provide data that will be used to explore the extent towhich the multi-point capability improves understanding of the behaviour of this systemcompared with 1-D models.
References
Huth NI, Carberry PS, Poulton PL, Brennan LE, Keating BA (2002). Simulating AgroforestrySystems Using APSIM. European Journal of Agronomy (in press).
McCown RL, Hammer GL, Hargreaves JNG, Holzworth DP, Freebairn DM (1996). APSIM: Anovel software system for model development, model testing and simulation in agriculturalsystem research. Agricultural Systems 50, 255-271.
Probert ME, Dimes JP, Keating BA, Dalal RC, Strong WM (1998b). APSIM’s water andnitrogen modules and simulation of the dynamics of water and nitrogen in fallow systems.Agricultural Systems 56, 1-28.

90

91
Bed experiments at IRRI and China: A Report�
R J Cabangon1, G Lu2 and T P Tuong1
1Crop Soil and Water Sciences Division, IRRI, DAPO Box 7779, Metro Manila, Philippines.2 Hua Zhong Agricultural University, Wuhan, P.R. China
Background
To cope with the increased water scarcity for agriculture, there is a need to develop “watersaving irrigation” (WSI) techniques that require less irrigation input than the traditionalcontinuous flooding. WSI techniques include alternate wetting and drying (AWD) irrigations,which allow the soil to dry out to a certain extent before re-applying irrigation water and thecultivation of rice as an irrigated upland crop (aerobic rice). Other technologies are beingproposed to save water that entail a more radical change in production technique: the cultivationof rice on raised beds under soil saturation culture. In raised bed systems, water is applied to thefurrows infiltrates laterally into the beds. The areal extent of water application is less for flatlayouts, and the bed surface is often without standing water, therefore it is hypothesized that thewater requirements of rice in raised beds is less than the conventional puddled systems.
Objectives
The objectives of these experiments were to determine the effects of bed configuration (at IRRI),and water regime, variety and fertilizer (in China) on the growth and yield of rice and (2) todetermine the water use and water productivity in different bed and water regime treatments.
Methodology
IRRI
In the 2001 wet season (WS) experiments were conducted at 2 sites namely, Block J7-J11 in thelowland farm, and at UX1 in the upland farm, IRRI, Los Baños, Laguna. The experiments havethe same split plot design in 3 replications with water regime as the main plot and bedconfiguration as the subplots. The two sites have contrasting soil properties and water regimes.The lowland site has a relatively low percolation rate since it had been continuously puddled formany more years than the upland site. The soil is also heavier in the lowland site than in theupland site. There was also a large field variability in soil characteristics and soil hydraulicproperties in the upland site.
Treatments: � © 2002 CSIRO. Published in Humphreys, E., and Timsina, J. (Eds.) (2002). Modelling irrigated cropping systems,with special attention to rice-wheat sequences and raised bed planting. Proceedings of a Workshop, CSIRO Landand Water, Griffith, NSW, Australia, 25-28 February 2002. CSIRO Land and Water Technical Report 25/02.

92
Water regime (main plots)� W1 (well watered)
� B1, B2, B3 (rice on beds): irrigated when water depth is 10 cm below bedsurface; irrigated until level with the bed surface
� B4 (rice on furrow): water depth on the furrow is maintained between 2 to10 cm above furrow surface
� B5 (flat bed): continuous flooding, 2 to 10 cm above the soil surface� W2 (rainfed with supplementary irrigation)
� Irrigated when soil water potential reaches –30 KPa� W3 (purely rainfed with survival irrigation)
� Irrigated when the crop shows signs of stress (leaf score of 3)
Bed configuration : (subplots)
BedBed spacing (centerto center in cm)
Bed width(cm)
Location ofrice Tillage
B1 195 155 rice on bed dryB2 130 90 rice on bed dryB3 65 30 rice on bed dryB4 65 30 rice on furrow dryB5 flat flat conventional puddled
Crop establishment, variety and fertilizer rates
21 day old rice seedlings (APO) were transplanted at a spacing of 15 cm between rows by 20 cmbetween hills for all bed treatments. Fertilizer rates were 20 kg N/ha, 30 kg P/ha, 20 kg K/ha, and5 kg Zn/ha at basal application. At 20 days after seeding (DAS), 20 kg N/ha was applied and 30kg N/ha at P.I.
Perched water table tubes were used to measure the standing water depth as well as the perchedwater table. Perched water table depth was measured at different locations across the bed tomonitor the subbing. Tensiometers were installed to monitor soil matric potential to indicate timeof irrigation. Irrigation amounts were measured using a flow meter. Grain yield and itscomponents were measured.
Tuanlin, China
The experiment was conducted in farmers' fields in a split-split-plot design with threereplications. The main plots have four water treatments altogether. They were:
1. Alternate wetting and drying (AWD): Land is prepared as conventional puddled soil.Water is kept at 4-6 cm until 10 DAT (re-greening period). At the end of tillering stage,soil is dried out for 7 to 15 days (mid-season drainage). After this, irrigation follows theAWD (1 to 3 days) cycles.
2. Flushing irrigation (FI). Plots are irrigated quickly with large discharge until the wholesurface is covered with water.

93
3. Rainfed (RF). Field water is maintained during transplanting until 10 date aftertransplanting (DAT), i.e. re-greening period). No irrigation is given after that.
4. Raised beds (RB). Land is prepared dry and divided into beds and furrows. Rice istransplanted on 0.9 m wide beds. Furrows are about 30 cm wide x 30 cm deep. Waterlevel was raised to about 2–3 cm above the bed surface for transplanting. Water is kept5–10 cm deep until 10 DAT (green revival period). After that irrigation was providedwhen water in furrow fell to 20 cm below the bed surface and was irrigated to bringwater level to the bed surface.
The subplots consisted of two rice varieties: hybrid rice (2you725) and aerobic rice (HD502).
The sub-subplots consisted of 2-N application rates:N1: No N fertilizer used but 70 kg P ha-1 and 70 kg K ha-1 were used. All P and K are applied asbasal.N2: 180 kg N ha-1, 70 kg P ha-1 and 70 kg K ha-1 were used. 30% of N applied as basal, 30% at10 DAT, 30% at PI, and 10% at heading. All P and K are applied as basal.
Rice plants were transplanted at a spacing of 20x20 cm and 2 seedlings per hill for hybrid ricewhile the aerobic rice HD502 was spaced at 27x13 cm at 4 seedlings per hill. The hybrid ricewas transplanted on 24 May, and the aerobic variety was transplanted on 15 Jun.
Perched water table tubes were used to measure the standing water depth as well as the perchedwater table. Irrigation amounts were measured using flow meter. Grain yield and its componentswere measured.
Preliminary results
IRRI
Irrigation and water depth
There were large variations in soil properties at the upland site which caused a large variation inirrigation water input across replications. Hence, irrigation amounts in the upland field variedtremendously. In the lowland field relatively low irrigation water was applied due to frequentrains. High seepage losses in one W1 plot caused a high variation in irrigation water input. Forthese reasons, irrigation results are not presented here.
The perched water depth across the beds showed subbing towards the middle of the bed. It wasmore pronounced in the upland than in the lowland field due to higher vertical permeability ofthe upland soil.
Grain yield
Grain yields ranged from 2.6 to 4.9 t/ha (Table 1). Yields were higher in the flats compared tothe bed treatments. In the lowland field, the widest bed B1 had the lowest grain yield comparedto the other bed sizes. In the upland field, there were no significant differences in grain yield

94
among the bed treatments. The higher grain yield in the flats (B5) may be due to the higher plantpopulation (33 hills/m2) compared to the bed treatments (28 hills/m2 in B1, 26 hills/m2 in B2 and22 hills/m2 in B3 and B4). Lower yields in the wider beds may be due to less subbing of waterfrom the furrow to the center of the bed as observed in the upland site. Furthermore, yields mayalso be affected by lower light interception in the middle of the beds compared to plants near thefurrows. Plants sampled near the furrows were taller and had more tillers than plants in themiddle of the bed.
Table 1. Mean (+ SE) grain yields in different bed configurations at IRRI, Philippines.2001 wet season
Mean grain yield (t/ha)Bed Lowland field Upland fieldB1 4.1 + 0.1 2.8 + 0.1B2 4.4 + 0.2 2.6 + 0.1B3 4.3 + 0.1 2.8 + 0.1B4 4.5 + 0.2 2.7 + 0.1B5 4.9 + 0.2 3.3 + 0.2
Tuanlin, China
The average grain yield ranged from 4.9 to 9.5 t ha-1 in hybrid rice treatments Table 2), and from0.3 to 1.6 t ha-1 in aerobic rice treatments. Low yields in the aerobic riceV2 were due to stemborer damage. Thus, only the results of the hybrid rice will be reported here. There was asignificant difference between the nitrogen treatments. In the No-N (N1) treatment, there was nosignificant difference in yield among the water treatments, However, in +N treatment (N2),AWD had the highest grain yield, while RB had lowest yield. There was no significantdifference between the RF and FI. There were also no significant differences between RF or FIcompared with the AWD or RB treatment. The RB treatment had lowest grain yield possibly dueto lower hill density (21 hills per square meter), while the density of other water treatments wasabout 25 hills per square meter. Relatively high yields obtained in RF and FI despite low totalwater input can be attributed to capillary rise from the shallow groundwater table in the site. Thegroundwater table depth ranged from 0 to 60 cm below the field surface with a seasonal mean of30 cm.
Table 2. Mean (+ SE) of grain yields in Hybrid rice in different water regimes andfertilizer treatments in Tualin, China. 2001 mid-rice season
Mean grain yield (t/ha)Water Regime Control With nitrogen
AWD 5.2 + 0.4 9.5 + 0.3Rainfed 5.0 + 0.3 8.8 + 0.2
Flush Irrigation 4.9 + 0.2 8.8 + 0.5Raised Bed 5.4 + 0.3 8.2 + 0.1
95
Irrigation
Irrigation input in hybrid rice ranged from 36 to 490 mm (Figure 1). The highest water use wasobserved in the AWD treatment in both N1 and N2 treatment. RF and FI had the lower water usecompared to AWD or RB. Comparing RB and AWD, RB had lower irrigation input than AWD.
The total water input (rainfall + irrigation) ranged from 324 to 779 mm. Rainfall fromtransplanting to harvest was 288 mm. RF and FI had the lower water use compared to AWD orRB. Furthermore, RB had lower irrigation input than AWD. Lower water use in RB may beattributed to the smaller area of the furrows compared to the whole plot in AWD (flat). It mayalso be due to the shallow groundwater table in the site. However, results may be different if theexperiment was conducted in a site with deeper water table.
Water productivity
In the hybrid treatment, water productivity (WP) in terms of grain yield per unit of total waterinput (rainfall + irrigation (I+R)), or (WP (I+R) ranged from 1.34 to 2.44 kg m-3. RF and FIcertainly had the higher WP (I+R) among the four water treatments due to less water applied.AWD had the least WP (I+R) among the four treatments. WP (I+R) in AWD was significantlylower than RF and FI. However, it was not significantly different from RB treatment.
Water productivity in terms of irrigation (WP (I)) ranged from 2.3 to 13.2 kg m-3. Similar trendswere observed as in WP (I+R).
Issues and concerns in raised bed system
In the raised bed treatments, beds that were formed at the start at land preparation were about 25to 30 cm high. However, at the end of the season, measurements showed that the heights werereduced to 10 cm. Rainfall and irrigation erode the bed surface and side slopes of the bedsespecially when the beds are newly formed. Thus, stability of the bed slopes is of great concernif permanent beds are desired.
In terms of crop establishment, transplanting on raised beds is a disadvantage. Measurements oftime required for transplanting in beds showed higher man-days than in flats. Thus, mechanicaltransplanting or other crop establishment methods such as direct seeding may be studied in thefuture.
Uneven bed level is also an important criterion in bed systems. Uneven leveling will lead to non-uniform plants along the bed. Uniform bed level is another constraint in adopting this method. Agood land leveling prior to bed forming must be realized.
Weeds also pose a problem in raised bed. Since the bed is often under aerobic conditions, growthof weeds especially of grasses is promoted. Proper weed management techniques in beds mustalso be developed.

96
In the 2002 Dry Season, an experiment is ongoing at IRRI, and in China experiments will beimplemented in May.
Figure 1. Water input and productivity at Tuanlin
Water input in hybrid rice at Tuanlin
0.0
100.0
200.0
300.0
400.0
500.0
600.0
700.0
800.0
900.0
N1 N2 N1 N2
Irrigation Irrigation + Rainfall
Irrig
atio
n (m
m)
W1-AWDW2-RfedW3-FIW4-beds
Water Productivity: Tuanlin, ZIS 2001
13.2+ 3.0
15.7+ 4.9
9.0+ 3.0
7.0+ 1.3
0.0
0.5
1.0
1.5
2.0
2.5
3.0
3.5
4.0
N1 N2 N1 N2
WPI WPI+R
Wat
er P
rodu
ctiv
ity W
PI (k
g/m
3)
W1-AWDW2-RfedW3-FIW4-beds

97
Improved soil management of rainfed vertisol soil in West Nusa TenggaraProvince, Indonesia
J S Gill, B M MacKenzie and J M Tisdall
La Trobe Univeristy, VIC, 3086
In West Nusa Tenggara, Vertisols are the second dominant soil class after Inceptisols occupyingbroad valley bottoms of fairly level topography. Rice is direct–seeded on nearly 40,000 ha ofVertisols under the gogorancah cropping system. Gogorancah is characterized by rice sown intodry soil and submergence when the wet season starts. This early start allows a secondary cropsuch as soybeans, mungbeans or maize (following rice) to be grown on residual soil water.Tillage of dry soil (400 mm) is very labour-intensive (200 person day/ha). This system is riskyas there may not be enough water for the secondary crop. A collaborative research projectfunded by the Australian Centre for International Agriculture Research (ACIAR) links LaTrobeUniversity and the University of Mataram in seeking to improve the management of theseVertisols. In this project permanent raised beds are being tested under best crop, soil and watermanagement system. Once set up, permanent raised beds, are less labour-intensive, and havehigher water use efficiency (Borrell et al., 1997) than gogorancah. With permanent raised beds,the unused water is being collected during the rainy season, and will be used to irrigate thesecondary crop.
Field trials were installed in September, 2001 at two sites on Lombok, Indonesia. There are sixmajor treatments at both the sites: T1 (permanent raised beds for rice and secondary crop underbest soil management); T2 (permanent raised beds with soil management and cropping rotationsimilar to “gogorancah”); T3 (permanent raised beds for vegetable and secondary crops underbest soil management); T4 (no tillage, flat with herbicide use for rice and soybean); T5(intercropping on wavy beds); T6 (gogorancah). Crops were sown at site 1 on 6th and 7th of Dec,2001 and at site 2 on 19th and 20th of Nov. 2001. Crops were sown after a total of 60 mm of rainover 10 consecutive days. Emergence of sown plants and weeds was recorded. Different soilphysical, chemical and biological properties and shifts in water status are being monitored duringthe trials as is the growth of crops.
Laboratory studies are underway to evaluate the effect of different factors that can improve thephysical conditions of heavy clayey soils. Changes in the soil water movement and soil structureare being closely studied in the field experiments. Possible factors responsible for these changesare being studied in the laboratory to understand the processes causing these changes. Results ofthese laboratory studies will help in understanding the long-term affect of these factors in thefields.
� © 2002 CSIRO. Published in Humphreys, E., and Timsina, J. (Eds.) (2002). Modelling irrigated cropping systems,with special attention to rice-wheat sequences and raised bed planting. Proceedings of a Workshop, CSIRO Landand Water, Griffith, NSW, Australia, 25-28 February 2002. CSIRO Land and Water Technical Report 25/02.

98

99
Key questions for modelling�
Liz Humphreys
CSIRO Land and Water, PMB 3, Griffith, NSW 2680
An important question for workshop participants was “what do we want to achieve through theapplication of models in the ACIAR project? – what are the key questions that we want themodels to help us to answer?”.
A suggested key question was:
Does rice-wheat on permanent beds “perform” better than on conventionallayouts/management (puddled translanted rice followed by conventionally tilled wheat onthe flat), and under what conditions?
“Performance” criteria
- component crop and total crop yields- component crop and total system water use- non-beneficial evaporative loss (from soil surface and floodwater)- deep drainage beyond the rootzone- partial factor productivity (N, water, other?)- greenhouse gas emission (beyond the scope of this project)- pollution of groundwater (related to deep drainage)
How is this affected by…..
Management
- sowing/planting date- method of rice establishment (e.g. dry-seeded rice, transplanted rice)- bed geometry (width, height, furrow width)- row/plant spacing- irrigation management (time, amount)- N management (placement, time, amount, source)- mulching/stubble management- soybeans instead of rice
Site
- soil type
© 2002 CSIRO. Published in Humphreys, E., and Timsina, J. (Eds.) (2002). Modelling irrigated cropping systems,with special attention to rice-wheat sequences and raised bed planting. Proceedings of a Workshop, CSIRO Landand Water, Griffith, NSW, Australia, 25-28 February 2002. CSIRO Land and Water Technical Report 25/02.

100
- watertable depth and salinity- irrigation water salinity- weather variability (within a climatic region)- climate (beyond the scope of this project)- climate change
Factors influencing the performance of rice-wheat on beds, for which current crop modelswould not be of assistance, include:
- weeds- diseases, pests- nutrients other than N- other inputs e.g. diesel, labour- changes in soil structure over time- bed stability

101
Issues and opportunities for modelling rice-wheat crop sequenceson flat and bed layouts�
J Timsina1, E Humphreys1 and D Godwin2
1CSIRO Land and Water, PMB 3, Griffith, NSW 26802Alton Park, MS2, Dubbo, NSW 2830
Gaps between potential yields and farmers’ and researchers’ yields
An important role for crop models is the estimation of yield potential and yield gaps at regionaland site specific scales, identification of reasons for the gaps, and evaluation of managementoptions for closing the yield gaps.
Average rice-wheat (RW) system yields in farmers’ fields in India (5.5 t/ha) and in the state ofPunjab (7-8 t/ha) are much lower than potential yields (Timsina and Connor 2001; Narang andVirmani 2001). Based on a grain-filling duration of 25 days and total growth duration of 100days for each stage, average daily solar irradiance of 15 MJ/m2/day, and radiation-use efficiencyof 1.5 g dry matter/MJ short-wave radiation, Timsina and Connor (2001) estimated yieldpotential of 14 t/ha for the RW system in the IGP (7 t/ha each for rice and wheat). Aggarwal etal. (2000a) estimated potential yields of rice and wheat for several states of India usingORYZA1N (Bouman et al. 2001) and WTGROWS (Aggarwal et al. 1994). They (Aggarwal etal. 2000b) determined potential yield of 16.0 t/ha (rice 9.0 t/ha and wheat 7.0 t/ha) for Delhiusing CERES-rice and CERES-wheat model. Using the CERES models under the sequencemode of DSSAT (Thornton et al. 1994), Timsina et al. (1996) estimated potential yields of about13 t/ha (rice 7.5 t/ha and wheat 5.5 t/ha) for RW systems for Pantnagar, Uttar Pradesh. Thusthere appear to be large gaps between yield potential and actual yields being achieved by farmersin RW systems.
Long-term yield trends, and yield decline or stagnation
Yield stagnation in RW systems is a major concern for food security in south Asia. Yield declinedoes not appear to be as extensive or serious as previously suggested: long term experimentsshow that rice yields have declined in a small number of locations, and there is good evidence ofyield decline in wheat in a very few locations (Dawe et al. 2000; Yadav et al. 2000). While thereare several “standalone “ models for each of wheat and rice, few models exist which cansimulate sequences of wheat and rice and the intervening fallow period. There are issues in theRW system of carryover of soil organic matter as well as nutrients and water between phases.Models suitable for examining long term yield trends require the capacity to address these issues.Timsina et al. (1996, 1998) used the DSSAT RW sequence model to satisfactorily simulateyields of a longterm RW experiment at Pantnagar, India, and to study long-term yield trends at
© 2002 CSIRO. Published in Humphreys, E., and Timsina, J. (Eds.) (2002). Modelling irrigated cropping systems,with special attention to rice-wheat sequences and raised bed planting. Proceedings of a Workshop, CSIRO Landand Water, Griffith, NSW, Australia, 25-28 February 2002. CSIRO Land and Water Technical Report 25/02.

102
Nashipur, Bangladesh. These are the only examples of application of a crop sequence model toRW systems that we are aware of, and further validation and testing of the DSSAT RW model isrequired.
Global climate change
Global climate change will impact on yield potential and production through changed weatherand atmospheric carbon dioxide concentration, affecting crop growth and development, irrigationdemand, and the supply of irrigation water. Analysis of the effects of climate change on yieldpotential, and its consequences for yield gaps and water resource requirements, requires theapplication of rigorously tested and validated crop models, calibrated for key species and currentvarieties. There is potential for the ACIAR project to contribute towards this effort. TheDSSAT/CERES models have been used in a variety of climate change studies and thus haveappropriate linkages built into the growth and water balance routines to readily examine climatechange scenarios (Singh et al. 2002). RW cropping systems can also be significant contributorsto greenhouse gas evolution via the evolution of carbon dioxide from organic matterdecomposition, via nitrous oxide evolution from aerobic soils, and via methane evolution fromanaerobic (saturated or flooded) soils. Models that can describe the transformations of N inflooded soils (CERES Rice) and methane evolution (MERES – derived form CERES) (Matthewset al. 2000) can contribute significantly to quantifying greenhouse gas evolution and the impactsof water, stubble and nitrogen management.
Tillage
Most areas under RW systems in the IGP are heavily tilled for both crops, including puddling forrice, however zero or reduced tillage for wheat after rice is expanding rapidly. In southern NSWthe soil is less heavily tilled for rice than in the IGP, but is typically tilled to 5-10 cm depth withone pass of offset discs and one pass with tynes or harrows, followed by one pass with a ridgeroller for water seeded rice. Where wheat is grown immediately after rice harvest, it is typicallydirect drilled using a triple or double disc, or sometimes with an air seeder with narrow points.
Puddling affects soil structure in many ways, with benefits for the rice crop including softer soilfor rice root growth and reduction in percolation rate. However there is much evidence that soilstructure is impaired for crops grown after rice (e.g. formation of a plough pan, massive soilstructure and cracking), but the effect on performance of crops after rice is variable, and maydepend on soil type and management (Connor et al. 2002).
CERES rice simulates the effect of changes in percolation rate and bulk density associated withpuddling and the reversion to a non-puddled state. The components of the model to describepuddling effects are rudimentary and would require further work to determine how well theywork in the coarsely textured soils of NW India. A new tillage routine has been introduced intothe DSSAT framework which can redistribute organic matter and make changes to surfaceinfiltration properties. This needs to be evaluated for RW systems.
Simulating the effect of tillage with a particular machine on a given soil in a given condition, andhow soil condition changes over time, would be extremely challenging. The implications for our
103
ability to model soil water/aeration/N dynamics in switching from conventional cultivation todirect drilling (with or without beds) remain to be seen.
Soil organic matter (SOM) management and residue management
There is a concern about the decline in soil organic carbon (SOC) in RW systems in the IGP,however its implications for yield and connections with yield decline are not apparent. Most riceand some wheat residues in Punjab and Haryana are burnt. Most rice and wheat residues insouthern NSW rice-based cropping systems are burnt.
The original version of DSSAT 3.0, with one soil organic matter (SOM) pool, did not accuratelysimulate the long-term decline in SOC and total N in a long-term experiment at Pantnagar, India(Timsina et al. 1996). In the modified SOM routine (Gijsman and Bowen 2002) of DSSAT 3.5,based on the CENTURY model, there are three SOM pools (passive SOM, slow SOM, andactive microbial SOM), one SOM pool on soil surface (microbial SOM), and two litter pools (inthe soil and on soil surface). In contrast to the earlier version, the SOM and residue flows nowvary with soil texture. The APSIM soil OM model has been evaluated under various sequencesin wheat based cropping systems but lacks components for flooded soil turnover of C and N. Thenew version of the DSSAT, which also incorporates detailed flooded soil C and N dynamics,requires rigorous testing. Thorough evaluation of the models under DSSAT to simulate changesin SOC in response to different stubble management treatments is beyond the scope of theACIAR project. This would require a long-term project, and much better understanding of thepools of SOM that would need to be measured than is currently available. Furthermore, changein SOM content and composition has implications for soil structure and soil water and aerationdynamics.
Soil chemistry (N, P)
Changing from puddled ponded rice culture to non-puddled intermittently irrigated bed systemswill have major implications for soil N transformations and transport. A major strength of theCERES rice model is its ability to handle fluctuating water regimes and their impact on Ntransformations and transport. CERES rice simulates nitrate and urea transport in the soil,ammonia volatilization from floodwater, and movement of nitrate, urea and ammonium betweenthe floodwater and the soil. It does not, however, simulate ammonium leaching which Katyal etal. (1985) found to be significant in the coarse-textured soils of Punjab. Description of thisprocess needs to be incorporated in the CERES models. Since CERES Rice has the capacity tosimulate ammonium exchange between the surface soil layer and floodwater it should bepossible to simulate ammonium fluxes in the soil. The ability of CERES rice to simulate the Ndynamics for a non-uniform bed geometry needs to be tested for the “average” situation, and forpoints in the system (e.g. middle of bed, edge of bed). CERES Rice has well developed routinesthat simulate response to uptake of N, tissue %N and growth processes. ORYZA 2000 (Boumanet al. 2001), a successor to a series of rice growth model developed under SARP (Simulation andSystems Analysis for Rice Production) Project in 1990s at IRRI, also simulates tissue %N, Nuptake and growth processes, but not rigorously the soil or floodwater transformations of N.

104
The CERES wheat model currently does not simulate ammonia volatilisation, and this can be animportant loss process on the calcareous light textured soils of the Punjab where urea andammonium fertilisers are broadcast onto the soil surface. The potential for ammoniavolatilisation is likely to be high on furrow-irrigated beds if N fertiliser is broadcast on the bedsurface. An adaptation of the floodwater ammonia volatilization routines from CERES Rice tosoil surface ammonia volatilization for Punjabi wheat growing conditions should be possible.
The anaerobic/aerobic transitions in traditional RW systems also have major implications for Pavailability, and the impact of changing from traditional systems to intermittently irrigated bedsystems needs to be understood. There has been some work on incorporating P into the uplandDSSAT models, and capabilities of DSSAT with regard to P for RW sequences need to beexplored.
Matching crop species and cultivars to local conditions
Simulation modelling offers the ability to help match species and cultivars to local conditions,for the range of likely climatic variability, simply by varying sowing dates. However the geneticcoefficients of the varieties of interest need to be determined by rigorous calibration. Varietalduration and effects of temperature and radiation are major considerations.
To better fit the 2 crops, and in some instances 3 crops, into the RW system of the IGP, there is aneed to develop better early- or medium-maturing cultivars of both rice and wheat crops. Whiledoing so, the effect of crop duration on yield potential needs to be considered as there isgenerally positive relationship between yield and crop duration.
In RW systems, wheat is often sown late (for a range of reasons), and hence suffers from hightemperatures during the flowering and grain-filling stages. High temperature shortens the grain-filling period and may also induce water stress leading to slow growth rates and sterility. As aconsequence, grain yield of wheat decreases substantially as sowing is delayed beyond theoptimum date. Early or medium maturity of both rice and wheat crops would be a desirablecharacter, with additional traits for wheat to cope under high temperature conditions.
Though DSSAT models have very strong and detailed phenology routines, recent experience hasshown that in trying to broaden the range of environments where the CERES-wheat model isbeing tested, its temperature response (e.g. temperature vs. phenology, grain yields andpartitioning to grain, etc.) against data from international trials of CIMMYT has beenunsatisfactory (White et al. 2000), and so the model is currently under review (personalcommunication with Tony Hunt, University of Guelph and Jeff White, CIMMYT, Mexico).Likewise, the phenology routine of CERES rice (e.g. for growth and development as affected bystress factors such as water deficit, N deficit) is also under revision (personal communicationwith Upendra Singh, IFDC). Nevertheless, the current versions of DSSAT models provide afairly good framework for simulating crop cultivars for intensive cropping systems, but will bebetter with further improvements
105
Soil water
Many currently available models (DSSAT, SWAGMAN Destiny, APSIM, the Wageningenmodels, etc.) can satisfactorily simulate soil water dynamics and components of the waterbalance during the growing season, despite using differing approaches (e.g. mechanisticapproaches based on Richard’s equation, or functional approaches as used in the CERESmodels). The choice of water balance simulation approach is most often decided by availabilityof input data. All models still have problems with cracking soils. SWAGMAN Destiny andDSSAT can also simulate the interaction with a shallow watertable. In addition, SWAGMANDestiny simulates the effect of waterlogging (aeration stress) on upland crops, and salt dynamicsand salt stress (Godwin et al. 2002). An example of application of SWAGMAN Destiny formanaging waterlogging through providing shallow surface or sub-surface drainage for pre-kharifseason mungbean in RW systems of Bangladesh has been provided by Timsina et al. (2000). Itneeds further testing.
Issues for sequences
Two approaches for simulating crop sequences are:(i) string crop models together, and add a fallow model for in between periods e.g.
DSSAT(ii) construct a soil focused model coupled with crop models and soil perturbation models
e.g. EPIC, APSIM, SALUS
The models need to be able to carryover state variables from the end of one crop (or fallow) tothe start of the next crop. The main state variables that need to be carried over are soil watercontent in the different soil layers, soil temperature, soil nutrients (N), SOM (amount, pools,nature - C:N), watertable depth and salinity and soil salinity. An important issue is what happensin the fallow period, for example, there will be implications for N, soil water and the distributionof organic matter across layers depending on whether a fallow is bare, tilled, weedy or grazed,and simulation of the water, N and SOM dynamics over the fallow period is essential. Systemsmodels needs the capacity to simulate whatever is happening between crops.
DSSAT and APSIM both provide a framework for simulation of cropping sequences, so that soilwater, residual N, and organic matter status at harvest of one crop become the starting conditionsfor the next. APSIM does not yet have a rice model and thus cannot simulate RW sequences.There has, however, been limited testing of CERES rice and wheat models for sequences in theIGP, and further testing is needed using the latest version of DSSAT with the new SOM routine.Further, the sequence routine in the current version of DSSAT is not user friendly, mainly due toirrigation switches for rice and rules for sequencing. The rules for automatically running cropsequence models need to be very site specific, and must include decision rules (e.g. rules forirrigation, N application, drainage) and rules that account for factors such as the effect on thechoice of variety if sowing is delayed due to delay in harvest of the previous crop. The sequenceroutine is under revision (personal communication with Jim Jones, University of Florida andUpendra Singh, IFDC).

106
ROTAT_RW (Bouman et al. 1994) is a rice-wheat sequence modal that can simulate carry-overeffects of soil water but not N-related processes. ROTAT_RW is based on ORYZA_W for rice(Wopereis et al. 1996), WHEAT_W for wheat (van Laar et al. 1992), and WATBAL for waterbalance (Wopereis et al. 1993). WHEAT_W is based largely on SUCROS (Spitters et al. 1989).WATBAL can simulate the water balance of both puddled and non-puddled soil. There has alsobeen limited testing of ROTAT_RW for RW sequences (Timsina et al. 1994).
Cropping systems on beds
Changing from traditional flat to a permanent bed system will have major implications in termsof tillage and residue management, water and nutrient dynamics, and light interception. On theflat with flood irrigation, movement of water, nutrients and salts is generally in the vertical plane,or one-dimensional. However, on beds with furrow irrigation, there will be both vertical andhorizontal components of movement (2-dimensional) from the furrows into the beds. Furrowirrigation will result in variable soil water status across and below the bed-furrow system. Thiswill affect fluxes of water and solutes, and transformations of nutrients. It is generally expectedthat losses through evaporation and deep drainage could be reduced with intermittently irrigatedbed layouts, but deep drainage losses could also be higher from the furrows than fromconventional puddled flooded systems.
Switching to bed layouts may have little impact on water availability for crops (provided bedgeometry and water management are managed to meet crop water requirements), however it mayhave major implications for N availability to the crop due to effects of the changed hydrology onN transformations and transport. If N is not managed carefully, intermittently irrigated bedlayouts for rice will predispose the system to high N losses. For example, topdressing onto themoist bed surface could lead to high losses by ammonia volatilization, especially on alkalinesoils. The frequent wetting and drying cycles with intermittent irrigation of rice also suggest thepotential for high losses from nitrification/denitrification, therefore the fertiliser needs to beplaced where the soil remains wet. There is also the potential for transport of nitrate to the bedsurface by capillary upflow, where it would be unavailable if the soil surface remained dry forextended periods, as is the case in winter which is generally dry (i.e. throughout the wheatseason).
However, switching to bed layouts with mechanization also offers new opportunities forimproved management of N fertilisers. For example, banding N fertiliser below the surface of thebeds, under the rows or centre of the bed prior to sowing, and between the rows for laterapplications, would reduce ammonia volatilization losses. The distribution of wheat roots at theearly jointing stage (see Photo 1) suggests that banding of fertiliser below the bed surface atsowing, followed by application into the furrows before irrigation or applying it in the irrigationwater at the end of the tillering stage, would be a very efficient method of N application forwheat. In this photo, there is a mass of older wheat roots below the centre of the bed, and prolificgrowth of younger roots under the furrows. The topsoil in the IGP is a loamy sand, with a sandyloam subsoil. The development of the bed former/seeder and the portable machine for makingsupergranules also provides the opportunity for deep placement of urea or combination fertilisersupergranules (Photo 2).

107
Recommendations for the ACIAR team
1. DSSAT version 3.5 is the best starting point for modelling RW systems since it has welldeveloped and tested rice and wheat models, and the capability of carry-over of key statevariables such as water, N and C. The latest version of DSSAT (with new tillage routine andSOM module) needs to be validated/tested against field data sets from crop sequenceexperiments from Yanco and Deniliquin in NSW, and from Punjab in India. This will help toidentify any weaknesses in the models, what to measure, and what to model. The latest versionof DSSAT has a modular approach as described by Jones et al. (2001, 2002). This version shouldbe obtained as soon as possible from the ICASA, or from the University of Florida (Jim Jones),or IFDC (Upendra Singh). The cold damage routine developed by Godwin et al. (1994) needs tobe incorporated into the rice model in the latest version of DSSAT.
2. Crop sequencing capability needs to be incorporated into SWAGMAN Destiny to enableinvestigation of groundwater, waterlogging and salinity issues.
3. Initial investigations using the models should be made to estimate the potential yields ofcomponent crops for sequences in both Punjab and NSW. The models need to be applied toidentify risks associated with sowing/planting date of component crops, method of riceestablishment (DSR, TPR), row/plant spacing, irrigation management (time, amount, etc.), Nmanagement (placement, time, amount, source, etc.), mulching/stubble management, andgrowing soybean instead of rice for a range of sites (soil, watertable, climate), management andseasonal conditions.
4. In the short-term, the ability of 1-dimensional models to simulate the “average” system needsto be assessed, followed by consideration of the potential gains from a 2-point approach, usingDSSAT and SWAGMAN Destiny.
5. At the same time, some initial investigations using a 2-dimensional model (e.g. HYDRUS 2D;Simunek et al. 1999) (and/or other such model (e.g. FUSSIM2; de Willigen 2002) should be usedto investigate water and solute dynamics for a range of bed geometries and soil types.
6. Some of the key processes that need to be modelled initially for bed systems are vertical andhorizontal fluxes of water and N, N transformations across beds and furrows, and radiationinterception across beds and furrows. Measurements of soil water status and mineral nitrogen,across the beds/furrows and with depth, and of light interception across the beds/furrows, arecrucial to help understand the effect of the bed geometry on crop response to water and nitrogenmanagement.

108
Photo 1 Root distribution of wheat growing on beds in
Ludhiana, Punjab, India – 2 rows per bed
FURROW FURROW MID BED
MID BED
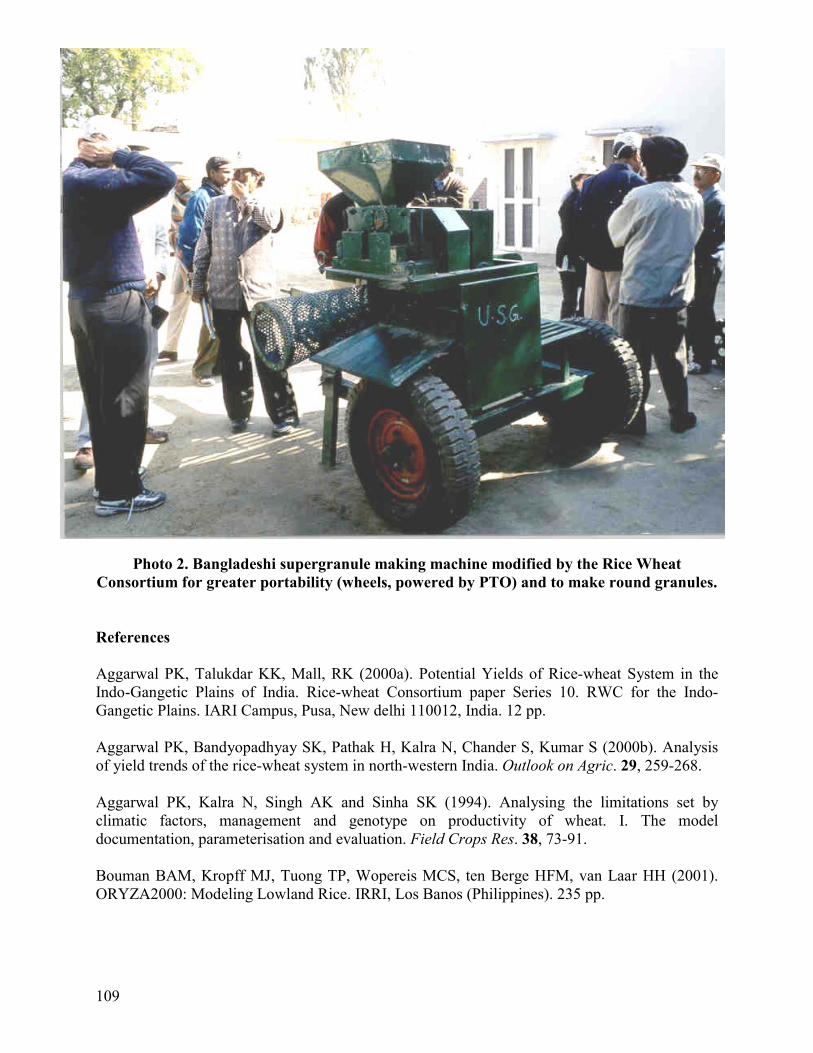
109
Photo 2. Bangladeshi supergranule making machine modified by the Rice WheatConsortium for greater portability (wheels, powered by PTO) and to make round granules.
References
Aggarwal PK, Talukdar KK, Mall, RK (2000a). Potential Yields of Rice-wheat System in theIndo-Gangetic Plains of India. Rice-wheat Consortium paper Series 10. RWC for the Indo-Gangetic Plains. IARI Campus, Pusa, New delhi 110012, India. 12 pp.
Aggarwal PK, Bandyopadhyay SK, Pathak H, Kalra N, Chander S, Kumar S (2000b). Analysisof yield trends of the rice-wheat system in north-western India. Outlook on Agric. 29, 259-268.
Aggarwal PK, Kalra N, Singh AK and Sinha SK (1994). Analysing the limitations set byclimatic factors, management and genotype on productivity of wheat. I. The modeldocumentation, parameterisation and evaluation. Field Crops Res. 38, 73-91.
Bouman BAM, Kropff MJ, Tuong TP, Wopereis MCS, ten Berge HFM, van Laar HH (2001).ORYZA2000: Modeling Lowland Rice. IRRI, Los Banos (Philippines). 235 pp.
110
Bouman BAM, Penning de Vries FWT, Wan Harun WS, Timsina J, Hartkamp AD (1994).Optimising rice-wheat rotations under water-limited conditions. Paper presented at thesymposium “Scenario studies for the rural environment”, 12-15 Sept 1994, Wageningen,Netherlands, and the “Third Congress of the European Society for Agronomy. 18-22 Sept 1994,Podowa, Italy. 4 p.
Connor DJ, Timsina J, Humphreys E (2002). Prospects for permanent beds for rice-wheatsystems. ASA Special Book. ASA-SSSA-CSSA. USA (in press).
Dawe D, Dobermann A, Moya P, Abdulrachman S, Bijay Singh, Lal P, Li SY, Lin B, PanaullahG, Sarim O, Singh Y, Swarup A, Tan PS, Zhen Q (2000). How widespread are yield declines inlong-term rice experiments in Asia? Field Crops Res. 66, 175-193.
de Willigen P, Heinen M (2002). A short description of the simulation model FUSSIM2illustrated with two examples. Pp. 57-62, In: Humphreys, E, Timsina, J (Eds.), Modellingirrigated cropping systems, with special attention to rice-wheat sequences and raised bedplanting. Proceedings of a workshop at CSIRO Land and Water, Griffith (Australia) 25-28February 2002.
Gijsman AJ, Hoogenboom G, Parton WJ, Kerridge PC (2002). Modifying DSSAT for low-inputagricultural systems, usinf a soil organic matter- residues from CENTURY. Agron. J. 94: 462-474.
Godwin DC, Meyer WS, Singh U (1994). Simulation of effect of chilling injury and nitrogensupply on floret fertility and yield in rice. Aust. J. Exp. Agric. 34: 921-926.
Godwin DC, Meyer WS, Xevi E, White RJG (2002). SWAGMAN Destiny: a simulation modelof irrigated crops as affected by irrigation practice, watertables and salinity. I. Model description(In preparation).
Jones JW, Keating BA, Porter CH (2001). Approaches to modular model development. Agric.Syst. 70: 421-443.
Jones JW, Hoogenboom G, Porter CH, Boote KJ, Batchelor WD, Hunt LA, Wilkens PW, SinghU, Gijsman AJ, Ritchie JT (2002). The DSSAT cropping system model. European J. Agron. (inpress).
Katyal JC, Bijay-Singh, Vlek PLG, Craswell ET (1985). Fate and efficiency of nitrogenfertilizers applied to wetland rice II. Punjab, India. Fert. Res. 6, 279-290.
Narang RS, Virmani SM (2001). Rice-wheat cropping systems of the Indo-Gangetic plain ofIndia. Rice-Wheat Consortium Pap. Ser. 11. Rice-Wheat Consortium for the Indo-GangeticPlains, New Delhi, India.
111
Simunek J, Sejina M, van Genuchten M Th (1999). The HYDRUS-2D software package forsimulating two-dimensional movement of water, heat, and multiple solutes in variably-saturatedmedia, version 2.0, U.S. Salinity Laboratory, USDA, ARS, Riverside, California. 227 pp.
Singh U, Timsina J, Godwin DC (2002). Testing and applications of CERES-rice and CERES-wheat models to rice-wheat cropping systems. Pages 17-32, In Humphreys, E, Timsina, J (Eds.),Modelling irrigated cropping systems, with special attention to rice-wheat sequences and raisedbed planting”. Proceedings of a workshop at CSIRO Land and Water, Griffith (Australia) 25-28February 2002.
Spitters CJT, van Kuelen H, van kraalingen DWG (1989). A simple and universal crop growthsimulator: SUCROS87. In: Rabbinge R, Ward SA, van Laar, HH (Eds.). Simulation and SystemsManagement in Crop Production. Simulation Monographs. Wageningen (Netherlands): Pudoc.Pp 147-181.
Thornton PK, Wilkens PW, Hoogenboom G, Jones JW (1994). Sequence Analyses User Guide.In: Tsuji GY, Uehara G, Balas S (Eds.), DSSAT 3.0. University of Hawaii, Honolulu, HI, USA.Pp. 67-136.
Timsina J, Connor DJ (2001). Productivity and management of rice-wheat systems: issues andchallenges. Field Crops Res. 69, 93-132.
Timsina J, Bouman BAM, Penning de Vries FWT, van Kraalingen DWG, Wan Harun WS(1994). Modeling tropical rice-wheat systems. In: Lansigan FP, Bouman BAM, van Laar HH(Eds), Proceedings of the SARP Applications Workshop: Agro-ecological Zonation andCharacterization and Crop Rotation Optimization. IRRI, Los Banos, Philippines, pp. 58-70.
Timsina J, Singh U, Singh Y, Lansigan FP (1995). Addressing sustainability of rice-wheatsystems: testing and application of CERES and SUCROS models. In: Fragile Lives in FragileEcosystems. Proc. Int. Rice Res. Conf. IRRI, Los Banos, Philippines, pp. 633-656.
Timsina J, Singh U, Singh Y (1996). Addressing sustainability of rice-wheat systems: analysis oflong-term experimentation and simulation. In: Kropff MJ, Teng PS, Aggarwal PK, Bouma J,Bouman BAM, Jones JW, van Laar HH (Eds), Applications of Systems Approaches at the FieldLevel, Vol. 2. Kluwer Academic Publishers, Dordrecht, The Netherlands, pp. 383-398.
Timsina J, Singh U, Badaruddin M, Meisner C (1998). Cultivar, nitrogen, and moisture effectson a rice-wheat sequence: experimentation and simulation. Agron. J. 90, 119-130.
Timsina J, Godwin DC, Connor DJ (2000). Water management for mungbean within rice-wheatcropping systems of Bangladesh: a simulation study. CD-ROM Proceedings of the ThirdInternational Symposium on Systems Approaches for Agricultural Development (SAAD 3), 8-10November 1999. Lima, Peru.

112
van Laar HH, Goudriaan J, van Keulen H (Eds) (1992). Simulation of crop growth for potentialand water-limited production situations (as applied to spring wheat). Simulation Reports 27,CABO-TPE, Wageningen, The Netherlands. 72 pp.
White JW, Grace P, Fox PN, Rodriguez-Aguilar A, Corbett, JD (2000). Modelling the responseof wheat yield potential to temperature- a global perspective. Pages 39-44, In: White JW, GracePR (Eds), Modelling Extremes of Wheat and Maize Crop Performance in the Tropics.Proceedings of a Workshop, CIMMYT, El Batan, Mexico, 19-22 April 1999. NRG-GIS Series00-01. Mexico, D.F.: CIMMYT.
Wopereis MCS, Wosten JHM, ten Berge HFM, Woodhead T, de san Agustin EMA (1993).Comparing the performance of soil-water balance model using measured and calibratedhydraulic conductivity data: a case study for dryland rice. Soil Sci. 156, 133-140.
Wopereis MCS, Bouman BAM, Tuong TP, ten Berge HFM, Kropff MJ (1996). ORYZA_W:rice growth model for irrigated and rainfed environments. SARP Research Proceedings.Wageneingen (Netherlands): IRRI/AB-DLO. 159 pp.
Yadav RL, Dwivedi BS, Pandey PS (2000). Rice-wheat cropping systems: assessment ofsustainability under green manuring and chemical fertilizer inputs. Field Crops Res. 65, 15-30.

113
Workshop recommendations and actions for the ACIAR project and thewider group�
1. Mobilize groups to start putting together existing data for RW in the IGP, and for currentrice varieties in southern NSW (plenty of data sets already for wheat in southern NSW)Driver: Jagadish (Collaborators: PAU, CSIRO, NSW Agric., IRRI, Jaikirat)
2. Get existing models (DSSAT, APSIM, SWAGMAN Destiny) up and running forcalibrations, validations and scenario analyses for flat layouts, for individual crops and for cropsequences. Some improvements in DSSAT, e.g. refinements of puddling, phenology routine inwheat and rice, cold routine in rice, irrigation switches for rice, rules for sequencing, etc., wouldbe required. Sequencing capability needs to be added to Destiny.Drivers: Jagadish, Emmanuel, Doug (Collaborators: Upendra, Bijay, Gajri, Arora, Michael)
3. Use HYDRUS-2D for comparative investigation (scoping) of water dynamics of bedgeometries/soil characteristics (investigate drainage under various E and T scenarios).Drivers: Emmanuel and Jagadish (Collaborators: Gajri, Arora)
4. Use FUSSIM2 to follow water and N dynamics—scoping studyDriver: Peter (Collaborators: Romy, Bas)
5. Evaluate the need to develop a spatial model based on the findings from 1-4 above, andexperimental data comparing beds and flat experiments.
6. Maintain the network established at this workshop via distribution of the workshopproceedings, email updates on progress, and another joint meeting after 2-3 years.
7. Widen the network to others with similar interests (water saving in rice platform, IAEACRP, NATP India, DSSAT/IBSNAT, GCTE, Wageningen, etc.)
© 2002 CSIRO. Published in Humphreys, E., and Timsina, J. (Eds.) (2002). Modelling irrigated cropping systems,with special attention to rice-wheat sequences and raised bed planting. Proceedings of a Workshop, CSIRO Landand Water, Griffith, NSW, Australia, 25-28 February 2002. CSIRO Land and Water Technical Report 25/02.

114

115
Appendix 1. Workshop Program (25-28 Feb. 2002)--------------------------------------------------------------------------------------------------------------------------------Monday 25 Feb11 am - Welcome - John Blackwell, OIC CSIRO Land and Water, Griffith Laboratory
- Introductions - Background to and purpose of workshop ( Liz Humphreys)
11:20 am - Rice-wheat cropping in IGP/Punjab - issues, future directions, soil, water and N mgt and dynamics (Bijay Singh and PK Gajri)
- ACIAR Project on permanent beds on a vertisol in Lombok, Indonesia (Jai KiratSingh)
1:30-4:45 - Brief overviews on modelling approaches for rice and wheat - DSSAT/CERES models (Upendra Singh) - APSIM models (Michael Robertson) - TRYM and maNage rice (Rob Williams/John Angus) - SWAGMAN� Destiny (Doug Godwin/Emmanuel Xevi)
Tuesday 26 FebAM Modelling crop sequences - current and potential approaches, what's the
state of the art, problems and issues, data requirements?- Issues for crop sequences re carryover (Doug Godwin)- Modelling sequences with APSIM (Merv Probert)- DSSAT/CERES models (Upendra Singh)- Potential for SWAGMAN Destiny to model sequences (Emmanuel Xevi)- Discussion
PM - - Visit bedfarming sites (Terry McFarlane)
Wednesday 27 FebAM Modelling bed geometries, especially for rice
- Impact of bed geometry on hydrology, implications for N transformations, possible modelling approaches (Doug Godwin)- Hydrus 2D (Paul Hutchinson)- FUSSIM2D model (Peter de Willigen)- APSIM with multipoint/spatial capabilities (Merv Probert)- Discussion - pro's and con's of various approaches
PM- - Data collection – past, current and planned field experiments - PAU and collaborators (Bijay Singh and PR Gajri) - Rice on beds in Philippines and China (Romy Cabangnon)
Thursday 28 Feb AM - Where to from here?
- opportunities for synergies? complementarities? shared learning? - how to facilitate - email chat group? 1:1? future get togethers?

116

117
Appendix 2. Participants
Name Organisation Address e-mail Phone(international)
Dr Upendra Singh Inernational FertilizerDevelopment Centre
Muscle Shoals, P.O. Box 2040, Alabama 35662, USA [email protected] 1-256-381-6600
Dr Peter de Willigen ALTERRA, Wageningen P.O. Box 47, Netherlands [email protected] 31 317 474204
Dr Romy Cabangon IRRI DAPO Box 7777, Metro manila, Philippines [email protected] 63 2 845-0563 ext 365
Dr Merv Probert CSIRO SustainableEcosystems
120 Meirs Rd., Indooroopilly, Queensland 4068 [email protected] 61 7 32142388
Dr Mike Robertson CSIRO SustainableEcosystems
120 Meirs Rd., Indooroopilly, Queensland 4068 [email protected] 61 7 32142305
Dr Wayne Meyer CSIRO Land and Water Private Bag No. 2, Glen Osmond, SA 5064 [email protected] 61 8 83038683
Mr. Geoff Beecher NSW Agriculture Private Bag, Yanco, NSW 2703 [email protected] 61 2 69512725
Mr. Rob Williams NSW Agriculture Private Bag, Yanco, NSW 2703 [email protected]
61 2 69512679
Mr. John Thompson NSW Agriculture PO Box 736, Deniliquin NSW 2710 [email protected] 61 3 58819928
Dr John Angus CSIRO Plant Industry GPO Box 1600, Canberra ACT 2601 [email protected] 61 2 62465095
Dr Tony Fischer ACIAR G.P.O. Box 1571, Canberra, ACT 2601 [email protected] 61 2 62170533
Prof. David Connor University of Melbourne
Institute of Land and FoodResources
Parkville, VIC 3010 [email protected] 61 3 83445019
Dr Doug Godwin Consultant Alton Park, MS2, Dubbo, NSW 2830 [email protected] 61 2 68885647
Dr Emmanuel Xevi CSIRO Land and Water PMB 3, Griffith, NSW 2680 [email protected] 61 2 69601581
Dr Liz Humphreys CSIRO Land and Water PMB 3, Griffith, NSW 2680 [email protected] 61 2 69601528
Dr Jagadish Timsina CSIRO Land and Water PMB 3, Griffith, NSW 2680 [email protected] 61 2 69601571

118
Dr Paul Hutchinson CSIRO Land and Water PMB 3, Griffith, NSW 2680 [email protected] 61 2 69601558
Dr John Blackwell CSIRO Land and Water PMB 3, Griffith, NSW 2680 [email protected] 61 2 69601521
Dr Jaikirat Singh La Trobe University
Dept Agricultural Sciences
La Trobe University, Bundoora, VIC 3086 [email protected] 61 3 94792190
Dr Yash Dang MIA Rural 12 Merrigal St., Griffith, NSW 2680 [email protected] 61 2 69646242
Dr Bijay Singh Punjab AgriculturalUniversity, Dept Soils
PAU, Ludhiana 141004, India [email protected] 91 161 401960 ext317
Dr P.R. Gajri Punjab AgriculturalUniversity, Dept Soils
PAU, Ludhiana 141004, India [email protected] 91 161 401960 ext 317