modelling intermittent microwave convective drying … · modelling intermittent microwave...
TRANSCRIPT
MODELLING INTERMITTENT
MICROWAVE CONVECTIVE DRYING
(IMCD) OF FOOD MATERIALS
Chandan Kumar
B. Sc. In Mechanical Engineering
Submitted in fulfilment of the requirements for the degree of
Doctor of Philosophy
Chemistry, Physics and Mechanical Engineering
Science and Engineering Faculty
Queensland University of Technology
2015
To my family (Basanta Kumar, Parul Rani, Dipika Roy, Ronzan Kumar
Roy, Ety Roy, Shailendra Nath Roy, Dipti Roy, Prabir Roy Sanjib)


Modelling Intermittent Microwave Convective Drying (IMCD) of Food Materials i
Keywords
Apple
Binary diffusion
Capillary diffusion
COMSOL Multiphysics
Convection drying model
Dielectric properties
Diffusion coefficient
Drying
Effective diffusivity
Electromagnetics
Energy efficiency
Equilibrium vapour pressure
Evaporative cooing
Evaporation rate
Experimental investigation
Food drying
Food quality
Heat and mass transfer
Intermittent microwave convective drying
Lambert’s Law
Mathematical modelling
Maxwell’s equations
Microwave
Microwave power distribution
Modelling
Multicomponent transport
Multiphase porous media model
Non-equilibrium evaporation
Non-uniform heating
Vapour pressure

ii Modelling Intermittent Microwave Convective Drying (IMCD) of Food Materials

Modelling Intermittent Microwave Convective Drying (IMCD) of Food Materials iii
Abstract
Drying of foodstuffs is an important and the oldest method of food processing.
However, drying is very energy-intensive process and consumes about 20–25% of
the energy used by food processing industry. The energy efficiency of the process
and the quality of the dried product are the two most crucial concerns in food drying.
The global energy crisis and increasing demand for quality dried food further
challenge researchers to explore innovative techniques in food drying to address
these issues. Intermittent microwave convective drying (IMCD) has proved to be an
advanced technology, which improves both energy efficiency and food quality in
drying. However, the physical understanding of the heat and mass transport
mechanism of IMCD is still not understood properly. To understand and optimize
IMCD, it is critical to develop mathematical models that can provide insight into the
physics involved in the process. Although there are some experimental investigations
of IMCD, there are until now no mathematical models to describe heat and mass
transfer in IMCD process for food.
This study aims to develop a mathematical model for IMCD of food materials.
First diffusion based and then multiphase porous media based IMCD models have
been developed in the study. The final model in this thesis is the first fundamental
and the most comprehensive multiphase model for IMCD, which considers 3D
electromagnetics coupled with multiphase porous media heat and mass transport. The
3D electromagnetics considered Maxwell’s equation and a multiphase transport
model considering three different phases: solid matrix, liquid water and gas (water
vapour and air) and considered pressure-driven flow, capillary diffusion, binary
diffusion, and evaporation. Thus, the model provides an in-depth understanding of
IMCD drying enabling investigation of moisture distribution, temperature
distribution and redistribution, evaporation, and fluxes due to different mechanisms.
Water and vapour fluxes obtained from the model showed that the pressure gradient
flow of water and vapour in IMCD is about 5–20 times higher than convective
drying, which significantly reduces the drying time in IMCD. Understanding of these
factors can, in turn, lead to an improvement in the food quality, the energy
efficiency, increased ability to automation and optimization.
iv Modelling Intermittent Microwave Convective Drying (IMCD) of Food Materials
List of Publications
Journal papers
1. C. Kumar, M. A. Karim and M. U. H. Joardder (2014) Intermittent
Drying of Food Products: A Critical Review. Journal of Food
Engineering, 121, 48–57 (Impact Factor 2.27).
doi: http://dx.doi.org/10.1016/j.jfoodeng.2013.08.014
2. C.A. Perussello, C. Kumar, F. Castilhosc, and M. A. Karim (2014) Heat
and mass transfer modelling of the osmo-convective drying of Yacon roots
(Smallanthus sonchifolius). Applied Thermal Engineering, 63(1), 23–32
(Impact Factor 2.12).
doi: http://dx.doi.org/10.1016/j.applthermaleng.2013.10.020
3. C. Kumar, G. J.Millar, and M. A. Karim (2015) Effective Diffusivity and
Evaporative Cooling in Convective Drying of Food Material. Drying
Technology, 33 (2), 227–237.
doi: http://dx.doi.org/10.1080/07373937.2014.947512
4. C. Kumar, M. U. H Joardder, M. A. Karim, G. J. Millar, and Z. M. Amin
(2014) Temperature redistribution modelling during intermittent
microwave convective heating. Procedia Engineering, 90(2014), 544–
549.
doi: http://dx.doi.org/10.1016/j.proeng.2014.11.770
5. C. Kumar, M. U. H. Joardder, T.W. Farrell, G. J. Millar, M. A. Karim
(2015) Modelling of Intermittent Microwave Convective Drying (IMCD)
of Apple. Drying technology, (Under review).
6. C. Kumar, M. U. H. Joardder, T.W. Farrell, M. A. Karim and G. J. Millar
(2015) Non-equilibrium multiphase porous media model for heat and mass
transfer during food drying. Journal of Food Engineering, (Under review).
Modelling Intermittent Microwave Convective Drying (IMCD) of Food Materials v
7. C. Kumar, M. U. H. Joardder, T.W. Farrell, and M. A. Karim, (2015)
Multiphase porous media model for Intermittent microwave convective
drying (IMCD) of food: Model formulation and validation. Journal of
Thermal Scienc,. (To be submitted).
8. C. Kumar, M. U. H. Joardder, T.W. Farrell, and M. A. Karim (2015) A
3D coupled electromagnetic and multiphase porous media model for
IMCD of food material. Food and Bioprocess Technology, (To be
submitted).
9. M. U. H Joardder, M.A. Karim, R.J. Brown, and C. Kumar (2014)
Determination of effective moisture diffusivity of banana using
thermogravimetric analysis. Procedia Engineering, 90, 538–543.
Doi: http://dx.doi.org/10.1016/j.proeng.2014.11.769
10. M. U. H. Joardder, M.A. Karim, and C. Kumar (2013) Effect of
temperature distribution on predicting quality of microwave-dehydrated
food. Journal of Mechanical Engineering and Sciences, 5, 562–568.
Doi: http://dx.doi.org/10.15282/jmes.5.2013.2.0053
11. M. U. H. Joardder, C. Kumar, and M. A. Karim (2015) Food Structure:
Its Formation and Relationships with Other Properties. Critical Reviews in
Food Science and Nutrition, (available online).
12. M. U. H. Joardder; C. Kumar, R. J Brown, and M. A. Karim (2015) A
micro-level investigation of the solid displacement method for porosity
determination of dried food. Journal of Food Engineering,166, 156–164
13. M. U. H Joardder, R. J. Brown, C. Kumar, and M. A. Karim (2015) Effect
of cell wall properties on porosity and shrinkage of dried apple.
International Journal of Food Properties, 18(10), 2327-2337.
14. C. Kumar, T. W. Farrell, M.A. Karum (2015), Multiphase porous media
model considering bound water for drying of agricultural product. Journal
of Thermal Science, (To be submitted).
vi Modelling Intermittent Microwave Convective Drying (IMCD) of Food Materials
Book:
1. M. U. H. Joardder, C. Kumar, M. A. Karim, and R. J. Brown
(2015) Porosity: Establishing the Relationship between Drying Parameters
and Dried Food Quality. Springer (In press).
Peer reviewed conference paper
1. C. Kumar, G. J. Millar, T. W. Farrell, and M. A. Karim (2015)
Multiphase porous media transport in apple tissue during drying. ICEF12–
12th International Congress on Engineering and Food, 14–18 June 2015,
Québec, Canada.
2. C. Kumar, M. U. H. Joardder, T. W. Farrell, G. J. Millar, and M.A. Karim
(2014) Multiphase porous media model for heat and mass transfer during
drying of agricultural products. In 19th Australasian Fluid Mechanics
Conference, 8–11 December 2014, RMIT University, Melbourne, VIC.
3. M. U. H. Joardder, M. A. Karim, C. Kumar, and R. J. Brown (2014)
Effect of cell wall properties on porosity and shrinkage during drying of
Apple. 1st International Conference on Food Properties (iCFP2014),
Kuala Lumpur, Malaysia, January 24–26, 2014 (Best paper award).
4. C. Kumar, M. A. Karim, M. U. H. Joardder, G. J. Miller, M. A. Karim,
and Z. M. Amin (2014) Intermittent microwave convective heating:
modelling and experiments. 10th International Conference on Mechanical
Engineering, 20–21 June, 2014, BUET, Dhaka, Bangladesh.
5. M. U. H. Joardder, M. A. Karim, C. Kumar, and R. J. Brown (2013)
Fractal dimension of dried foods: A correlation between microstructure
and porosity. Food Structures, Digestion and Health International
Conference 22–24 October, 2013 - Melbourne, Australia.
6. C. Kumar, M. A. Karim, S. C. Saha, M. U. H. Joardder, R. J. Brown, and
D. Biswas (2013) Multiphysics modelling of convective drying of food
materials. Global Engineering, Science and Technology Conference, 28–
29 December 2013, Dhaka, Bangladesh.

Modelling Intermittent Microwave Convective Drying (IMCD) of Food Materials vii
7. M. U. Joardder, M. A. Karim, and C. Kumar (2013) Better Understanding
of Food Material on the Basis of Water Holding Capacity. International
Conference on Mechanical, Industrial and Material Engineering, 1–3
November, 2013, Rajshahi, Bangladesh.
8. M. U. H. Joardder, M. A. Karim, and C. Kumar (2013) Effect of moisture
and temperature distribution on dried food Microstucture and Porosity.
From Model Foods to Food Models, the DREAM Project International
Conference, 24– 26 June 2013, Nantes, France.
9. M. U. H. Joardder, M. A. Karim, and C. Kumar (2013) Determination of
Moisture Diffusivity of Banana Using Thermogravimetric Analysis. 10th
International Conference on Mechanical Engineering, 20–21 June, 2013,
BUET, Dhaka, Bangladesh.
10. C. Kumar, M. A. Karim, M. U. H. Joardder, and G. J. Miller (2012)
Modeling Heat and Mass Transfer Process during Convection Drying of
Fruit. 4th International Conference on Computational Methods, 25–27
November, 2012, Gold Coast, Australia.
Posters presentation
1. C. Kumar, M. A. Karim, and G. J. Millar (2014) Multiphase Porous
Media Model for Microwave Convective Drying of Agricultural Products.
In Research Showcase: Opportunities with ACIAR and the Rural Research
and Development Corporations, 21 February 2014.
2. J. Davies, C. Kumar, Z. M. Amin, and M. A. Karim (2013) Design and
construction of a microwave convective food dryer. In Queensland
University of Technology, Science & Engineering Faculty Showcase, 31
October 2013, Queensland University of Technology, Brisbane, QLD.
3. M. U. H. Joardder, C. Kumar, M. A. Karim and R. J. Brown (2013)
Fractal dimension of dried foods: a correlation between microstructure and
porosity. In Food Structures, Digestion and Health International
Conference, 21–24 October 2013, Bayview Eden Hotel, Melbourne, VIC.

viii Modelling Intermittent Microwave Convective Drying (IMCD) of Food Materials
4. M. U. H. Joardder, C. Kumar, M. A. Karim, and R. J. Brown (2014)
Effect of cell wall bound water on pore formation and food quality during
drying, In Research Showcase: Opportunities with ACIAR and the Rural
Research and Development Corporations, 21 February 2014, QUT,
Australia.

Modelling Intermittent Microwave Convective Drying (IMCD) of Food Materials ix
Table of Contents
Keywords .................................................................................................................................................i
Abstract ................................................................................................................................................. iii
List of Publications ................................................................................................................................iv
Table of Contents ...................................................................................................................................ix
List of Figures ...................................................................................................................................... xii
List of Tables ........................................................................................................................................ xv
List of Abbreviations ............................................................................................................................ xvi
Nomenclature ..................................................................................................................................... xvii
Statement of Original Authorship ........................................................................................................ xix
Acknowledgements ............................................................................................................................... xx
INTRODUCTION ....................................................................................................... 1 CHAPTER 1:
1.1 Background and motivation ......................................................................................................... 1
1.2 Research problems ....................................................................................................................... 2
1.3 Aims and objectives ..................................................................................................................... 3
1.4 Significance and scope ................................................................................................................. 3
1.5 Thesis outline ............................................................................................................................... 4
LITERATURE REVIEW ........................................................................................... 7 CHAPTER 2:
2.1 Food drying .................................................................................................................................. 9
2.2 Microwave assisted drying......................................................................................................... 11
2.3 Microwave Convective Drying (MCD) ..................................................................................... 13
2.4 Intermittent Microwave Convective Drying (IMCD) ................................................................ 15
2.5 Modelling of drying and challenges ........................................................................................... 17 Empirical models ............................................................................................................ 18 2.5.1
Diffusion based (single phase) models ........................................................................... 18 2.5.2
Multiphase models .......................................................................................................... 19 2.5.3
MCD and IMCD model .................................................................................................. 20 2.5.4
2.6 Summary of literature and research gaps ................................................................................... 21
SINGLE PHASE MODEL FOR CONVECTION DRYING ................................. 23 CHAPTER 3:
3.1 Abstract ...................................................................................................................................... 25
3.2 Introduction ................................................................................................................................ 25
3.3 Model development ................................................................................................................... 28 Governing equations ....................................................................................................... 29 3.3.1
Initial and boundary conditions ...................................................................................... 29 3.3.2
Input parameters ............................................................................................................. 30 3.3.3
3.4 Simulation methodology ............................................................................................................ 33
3.5 Drying experiments .................................................................................................................... 34
3.6 Results and discussion ............................................................................................................... 36
3.7 Conclusions ................................................................................................................................ 43
3.8 Acknowledgements .................................................................................................................... 44
x Modelling Intermittent Microwave Convective Drying (IMCD) of Food Materials
3.9 Funding ...................................................................................................................................... 44
SINGLE PHASE MODEL FOR IMCD USING LAMBERT’S LAW .................. 45 CHAPTER 4:
4.1 Abstract ...................................................................................................................................... 46
4.2 Introduction................................................................................................................................ 46
4.3 Mathematical modelling ............................................................................................................ 48 Governing equations ....................................................................................................... 49 4.3.1
Initial and boundary conditions ...................................................................................... 50 4.3.2
Modelling of microwave power absorption using Lamberts Law .................................. 50 4.3.3
Input parameters ............................................................................................................. 51 4.3.4
4.4 Materials and methods ............................................................................................................... 55
4.5 Simulation procedure ................................................................................................................. 57
4.6 Results and discussion ............................................................................................................... 58 Incident power absorption by experiments ..................................................................... 58 4.6.1
Average moisture curve .................................................................................................. 59 4.6.2
Temperature .................................................................................................................... 60 4.6.3
Moisture and temperature distribution ............................................................................ 63 4.6.4
Equilibrium vapour pressure .......................................................................................... 64 4.6.5
Absorbed power distribution .......................................................................................... 65 4.6.6
4.7 Conclusions................................................................................................................................ 66
MULTIPHASE MODEL FOR CONVECTION DRYING OF FOOD ................. 68 CHAPTER 5:
5.1 Abstract ...................................................................................................................................... 69
5.2 Introduction................................................................................................................................ 69
5.3 Mathematical model .................................................................................................................. 71 Problem description and assumptions ............................................................................ 72 5.3.1
Governing equations ....................................................................................................... 73 5.3.2
Mass balance equations .................................................................................................. 73 5.3.3
Continuity equation to solve for pressure ....................................................................... 76 5.3.4
Energy equation .............................................................................................................. 76 5.3.5
Evaporation rate .............................................................................................................. 77 5.3.6
Initial conditions ............................................................................................................. 79 5.3.7
Boundary conditions ....................................................................................................... 79 5.3.8
Input parameters ............................................................................................................. 80 5.3.9
5.4 Experiments ............................................................................................................................... 86
5.5 Numerical solution and simulation methodology ...................................................................... 86
5.6 Results and discussion ............................................................................................................... 87 Moisture content ............................................................................................................. 87 5.6.1
Distribution and evolution of water and vapour ............................................................. 88 5.6.2
Temperature curve .......................................................................................................... 89 5.6.3
Vapour pressure, equilibrium vapour pressure, and saturated pressure .......................... 90 5.6.4
Evaporation rate .............................................................................................................. 91 5.6.5
Vapour and water fluxes ................................................................................................. 92 5.6.6
5.7 Conclusions................................................................................................................................ 96
MULTIPHASE MODEL FOR IMCD USING LAMBERT’S LAW .................... 97 CHAPTER 6:
6.1 Abstract ...................................................................................................................................... 98
6.2 Introduction................................................................................................................................ 98
6.3 Mathematical model ................................................................................................................ 100 Problem description and assumptions .......................................................................... 101 6.3.1
Governing equations ..................................................................................................... 101 6.3.2
Evaporation rate ............................................................................................................ 104 6.3.3
Initial conditions ........................................................................................................... 105 6.3.4

Modelling Intermittent Microwave Convective Drying (IMCD) of Food Materials xi
Boundary conditions ..................................................................................................... 106 6.3.5
Input parameters ........................................................................................................... 106 6.3.6
Microwave power absorption ....................................................................................... 109 6.3.7
Dielectric constant ........................................................................................................ 110 6.3.8
6.4 Materials and methods ............................................................................................................. 111
6.5 Numerical solution ................................................................................................................... 112
6.6 Results and discussion ............................................................................................................. 112 Moisture content and temperature ................................................................................ 113 6.6.1
Distribution and evolution of water and vapour ........................................................... 114 6.6.2
Temperature curve ........................................................................................................ 115 6.6.3
Gas pressure .................................................................................................................. 116 6.6.4
Vapour pressure, equilibrium vapour pressure, and saturated pressure ........................ 117 6.6.5
Evaporation ................................................................................................................... 118 6.6.6
Vapour pressure distribution ......................................................................................... 119 6.6.7
Vapour and water fluxes ............................................................................................... 120 6.6.8
Limitation of Lambert’s Law ........................................................................................ 123 6.6.9
6.7 Conclusions .............................................................................................................................. 123
MULTIPHASE MODEL FOR IMCD USING MAXWELL’S EQUATIONS ... 125 CHAPTER 7:
7.1 Abstract .................................................................................................................................... 127
7.2 Introduction .............................................................................................................................. 127
7.3 Model development ................................................................................................................. 129 Geometry and problem description ............................................................................... 129 7.3.1
Maxwell’s equation for electromagnetics and heat generation ..................................... 131 7.3.2
Dielectric properties...................................................................................................... 132 7.3.3
Multiphase porous media transport model .................................................................... 132 7.3.4
Initial conditions ........................................................................................................... 136 7.3.5
Boundary conditions ..................................................................................................... 137 7.3.6
Input parameters ........................................................................................................... 137 7.3.7
Numerical solution........................................................................................................ 140 7.3.8
7.4 Materials and methods ............................................................................................................. 141
7.5 Results and discussion ............................................................................................................. 143 Experimental validation of temperature and moisture content ..................................... 143 7.5.1
Internal temperature distribution .................................................................................. 146 7.5.2
Moisture distribution .................................................................................................... 147 7.5.3
Vapour concentration distribution ................................................................................ 148 7.5.4
Pressure ......................................................................................................................... 149 7.5.5
Vapour pressure distribution ......................................................................................... 150 7.5.6
Water and vapour fluxes ............................................................................................... 150 7.5.7
7.6 Conclusions .............................................................................................................................. 154
CONCLUSION AND FUTURE RECOMMENDATION .................................... 157 CHAPTER 8:
8.1 Overall summary ...................................................................................................................... 157
8.2 Conclusions .............................................................................................................................. 158
8.3 Contribution to knowledge and significance ............................................................................ 160
8.4 Limitations ............................................................................................................................... 161
8.5 Future direction ........................................................................................................................ 162
BIBLIOGRAPHY ............................................................................................................................. 165
APPENDICES ................................................................................................................................... 177 Appendix A Implementation of the model in mathematical interface of COMSOL .............. 177 Appendix B The conversions of moisture content ................................................................... 178
xii Modelling Intermittent Microwave Convective Drying (IMCD) of Food Materials
List of Figures
Figure 1-1. Organization of the dissertation ........................................................................................... 5
Figure 2-1.Typical drying rate curve (Okos et al., 2006) ....................................................................... 9
Figure 2-2. Schematic diagram depicting the dipolar and ionic loss mechanisms and their
contributions to the dielectric properties as a function of frequency (Metaxas,
1996b). ................................................................................................................................. 11
Figure 2-3. Drying curves of whole mushrooms under different drying methods (Orsat et al.,
2007) .................................................................................................................................... 12
Figure 2-4. General classification of drying models in literature ......................................................... 17
Figure 2-5. Modelling approach of heat generation due to microwave ................................................ 20
Figure 3-1. (a) Actual geometry of the sample slice and (b) Simplified 2D axisymmetric model
domain. ................................................................................................................................. 28
Figure 3-2. Simulation strategy in COMSOL multiphysics ................................................................. 33
Figure 3-3. Moisture evolution obtained for experimental and simulation with shrinkage-
dependent, temperature-dependent and average effective diffusivities ................................ 37
Figure 3-4. Temperature evolution obtained for experimental and simulation with shrinkage-
dependent, temperature-dependent and average effective diffusivities ................................ 38
Figure 3-5. Temperature curve for shrinkage dependent diffusivity .................................................... 39
Figure 3-6. Evolution of inward (convective), outward (evaporative) and total
(convective+evaporative) heat flux ...................................................................................... 40
Figure 3-7. (a) Moisture and (b) temperature distribution in the food after 400 minutes of
drying ................................................................................................................................... 41
Figure 3-8. Moisture content for different air temperature for velocity 0.7m/s .................................... 42
Figure 3-9. Moisture content for different air velocity at 600C ............................................................ 43
Figure 4-1. 3D apple slice and 2D an axisymmetric domain showing symmetry boundary and
transfer boundary (arrow) .................................................................................................... 49
Figure 4-2. Intermittency function ........................................................................................................ 57
Figure 4-3. Flow chart showing the modelling strategy in COMSOL Multiphysics ............................ 58
Figure 4-4. Microwave power absorption for different loading volume............................................... 59
Figure 4-5. Drying curve for IMCD (experiments and model) and convective drying ........................ 60
Figure 4-6. Temperature curve obtained from the model ..................................................................... 61
Figure 4-7. Thermal images of top surface at selected times ................................................................ 62
Figure 4-8. Moisture distribution inside the sample ............................................................................. 63
Figure 4-9. Temperature distribution inside the sample ....................................................................... 64
Figure 4-10. Evolutions of equilibrium vapour pressure at the surface of the sample .......................... 65
Figure 4-11. Absorption of microwave power along the length of the sample at 75mins .................... 66
Figure 5-1. Schematic showing 3D sample, 2D axisymmetric domain and Representative
Elementary Volume (REV) with the transport mechanism of different phases ................... 72
Figure 5-2. Gas (kr,g) and water (kr,w) relative permeabilities of apple tissues as a function of
saturation. ............................................................................................................................. 83
Figure 5-3. Typical variation of capillary force as a function of liquid saturation in porous
media (Bear, 1972) ............................................................................................................... 84

Modelling Intermittent Microwave Convective Drying (IMCD) of Food Materials xiii
Figure 5-4. Mesh for the simulation. .................................................................................................... 86
Figure 5-5. Comparison between predicted and experimental values of average moisture
content during drying ........................................................................................................... 87
Figure 5-6. Spatial distribution of water saturation with times ............................................................. 88
Figure 5-7. Spatial distribution of vapour with different time .............................................................. 89
Figure 5-8. Surface and centre temperature obtained from model ........................................................ 90
Figure 5-9. Vapour pressure, equilibrium vapour pressure and saturation pressure at surface ............. 91
Figure 5-10. Spatial distribution of evaporation rate at different drying times ..................................... 92
Figure 5-11. Water flux due to capillary diffusion ............................................................................... 93
Figure 5-12. Water flux due to gas pressure ......................................................................................... 94
Figure 5-13. Vapour flux due to binary diffusion ................................................................................. 95
Figure 5-14. Vapour flux due to gas pressure ....................................................................................... 95
Figure 6-1 . Schematic showing 3D sample, 2D axisymmetric domain and Representative
Elementary Volume (REV) with the transport mechanism of different phases ................. 101
Figure 6-2. Mesh for the simulation ................................................................................................... 112
Figure 6-3. Comparison between predicted and experimental values of average moisture
content during drying ......................................................................................................... 113
Figure 6-4. Spatial distribution of water saturation with times ........................................................... 114
Figure 6-5. Spatial distribution of vapour with different times ........................................................... 115
Figure 6-6. Comparison of surface temperature between experimental and model ............................ 116
Figure 6-7. spatial distribution of total pressure across the half thickness the sample in different
times ................................................................................................................................... 117
Figure 6-8. Vapour pressure, equilibrium vapour pressure and saturation pressure at surface ........... 118
Figure 6-9. Spatial distribution of evaporation rate at different drying times ..................................... 119
Figure 6-10. Spatial distribution of evaporation rate at different drying times ................................... 120
Figure 6-11. Water flux due to capillary at different drying times ..................................................... 121
Figure 6-12. Water flux due to gas pressure at different drying times ................................................ 121
Figure 6-13. Vapour flux due to binary diffusion at different drying times ....................................... 122
Figure 6-14. Vapour flux due to gas pressure at different drying times ............................................. 122
Figure 7-1. a) The computational domain for the IMCD drying simulation, b) Food sample and
representative elementary volume (REV) showing transport mechanism involved in
the simulation ..................................................................................................................... 130
Figure 7-2. Flow chart showing the modelling strategy in COMSOL Multiphysics .......................... 141
Figure 7-3. Intermittency of microwave power considered in the simulation and experiment ........... 142
Figure 7-4. Average moisture content obtained from experiments and simulation ............................ 143
Figure 7-5. Temperature distribution obtained from experiment and simulations .............................. 145
Figure 7-6. Temperature profile along horizontal centreline of the sample at different times ............ 146
Figure 7-7. Saturation profile along horizontal centreline of the sample for different times .............. 147
Figure 7-8. Vapour density profile along horizontal centreline of the sample at different times ........ 148
Figure 7-9. Pressure profile along horizontal centreline of the sample for different times ................. 149
Figure 7-10. Vapour pressure along the horizontal centreline of the sample ...................................... 150
Figure 7-11. Water capillary flux along horizontal centreline of the sample at different times.......... 151

xiv Modelling Intermittent Microwave Convective Drying (IMCD) of Food Materials
Figure 7-12. Water flux due to gas pressure along horizontal centreline of the sample for
different times .................................................................................................................... 152
Figure 7-13. Vapour flux due to gas pressure along horizontal centreline of the sample for
different times .................................................................................................................... 153
Figure 7-14. Vapour flux due to gas pressure along horizontal centreline of the sample for
different times .................................................................................................................... 153

Modelling Intermittent Microwave Convective Drying (IMCD) of Food Materials xv
List of Tables
Table 2-1. Summery of microwave assisted convective heating and drying of food material ............... 14
Table 2-2. Summary of intermittent microwave assisted convective heating and drying of food
material ................................................................................................................................ 16
Table 3-1. Input parameters for the model ............................................................................................ 30
Table 4-1. Input properties of the model ............................................................................................... 52
Table 4-2. Power absorption ratio for microwave power (100W, 200W and 300W) for different
sample volume ...................................................................................................................... 58
Table 4-3: Centre temperature of apple surface from experiment and model ....................................... 61
Table 5-1. Input properties for the model ............................................................................................. 80
Table 6-1. Input properties for the model ........................................................................................... 107
Table 6-2. Comparison of experimental and model temperature at centre of top surface at
different times ..................................................................................................................... 114
Table 7-1. Input parameters for the model .......................................................................................... 137
xvi Modelling Intermittent Microwave Convective Drying (IMCD) of Food Materials
List of Abbreviations
IMCD Intermittent Microwave Convective Drying
CMCD continuous Microwave Convective Drying
MW Microwave
PL Power Level (microwave power level)
PR Pulse Ratio (microwave intermittency)
RH Relative humidity (%)
db Dry basis
wb Wet basis

Modelling Intermittent Microwave Convective Drying (IMCD) of Food Materials xvii
Nomenclature
wc Mass concentrations of water (kg/m3)
vc Mass concentrations of vapour (kg/m3)
ac Mass concentrations of air (kg/m3)
effpc Effective specific heat (J/kg/K)
pwc Specific heat capacity of water (J/kg/K)
pgc Specific heat capacity of gas (J/kg/K)
psc Specific heat capacity of solid (J/kg/K)
cD Capillary diffusivity (m2/s)
TD Thermal diffusivity (m2/s)
geffD , Effective binary diffusivity of vapour and air (m2/s)
vaD Binary diffusivity of vapour and air (m2/s)
H Sample thickness (m)
gh Enthalpy of gas (J)
wh Enthalpy of water (J)
fgh Latent heat of evaporation (J/kg)
mvh Mass transfer coefficient (m/s)
Th Heat transfer coefficient (W/m2/K)
Kevap Evaporation constant
wk Intrinsic permeability of water (m2)
wrk , Relative permeability of water (m2)
gk Intrinsic permeability of gas (m2)
grk , Relative permeability of gas (m2)
effk Effective thermal conductivity (W/m/K)
gthk , Thermal conductivity of gas (W/m/K)
wthk , Thermal conductivity of water (W/m/K)
sthk , Thermal conductivity of solid (W/m/K)
dbM Moisture content dry basis
wbM Moisture content wet basis
gM Molecular weight of gas (kg/mol)
vM Molecular weight of vapour (kg/mol)
wn
Water mass flux (kg/m2s)
vn
Vapour mass flux (kg/m2s)
gn
Gas mass flux (kg/m2s)
totalvn ,
Total vapour flux at the surface (kg/m
2s)
P Total gas pressure (Pa)

xviii Modelling Intermittent Microwave Convective Drying (IMCD) of Food Materials
0P Incident microwave power (W)
vp Partial pressure of vapour (Pa)
ap Partial pressure of air (Pa)
cp Capillary pressure (Pa)
eqvp , Equilibrium vapour pressure (Pa)
satvP , Saturation vapour pressure (Pa)
airvp , Vapour pressure of ambient air (Pa)
ambP Ambient pressure (Pa)
R Universal gas constant (J/mol/K)
evapR Evaporation rate of liquid water to water vapour (kg/m3s)
wS Saturation of water
gS Saturation of gas
0wS Initial water saturation
0vS Initial saturation of vapour
0gS Initial gas saturation
T Temperature of product (0C)
airT Drying air temperature (0C)
V Drying air velocity (m/s)
Z Distance from vertical axis from origin (m)
V Representative elementary volume (m3)
gV Volume of gas (m3)
wV Volume of water (m3)
sV Volume of solid (m3)
eqt Equilibration time (1/s)
Apparent porosity
0 Initial equivalent porosity,
w Viscosity of water (Pa.s)
g Viscosity of gas (Pa.s)
v Mass fraction of vapour
a Mass fraction of air
s Solid density (kg/m3)
w Density of water (kg/m3)
g Density of gas (kg/m3)
g Density of gas phase (kg/m3)
eff Effective density (kg/m3)

QUT Verified Signature

xx Modelling Intermittent Microwave Convective Drying (IMCD) of Food Materials
Acknowledgements
First I would like to thank God for giving me the opportunity, strengths and
blessing in completing this thesis. Then, I would like to thank my principle
supervisor, Dr Azharul Karim, for his supervision and effort. I also pay my complete
gratitude to him for all his great support to initiate my higher studies in QUT. Thank
you very much for your invaluable advice, encouragement and patience throughout
this research. I also appreciate the excellent support, helpful comments, guidance and
advice given by my co-supervisor, Professor Graeme Millar.
I would also like to express my love and gratitude to my beloved family
members, for their understanding and endless love. In particular, my father for his
patience and for his encouragement to completion of this thesis although being
constantly sick since I left Bangladesh. I am really proud of my younger brother,
Ronzan Kumar Roy, for taking care of parents during this time. Special thanks to my
wife, Dipika Roy, for bearing with me all during this study.
Furthermore, I would like to thank all my colleagues and friends for
motivation, advice and help rendered: special thanks to M.U.H. Joardder for his
continued support during my candidature especially with experiments and idea
development. Thanks to Dr Camila Augusto Perrusello for being party to initial
modelling works. Thanks to all undergraduate students who were involved in
different parts of the project. I would like to thanks Dr Suvash Saha, Prof. Ian
Turner, A/Prof. Troy Farrell, Dr Wijitha Senadeera, Dr Zakaria Amin, and Dr
Hussain Nyeem for their fruitful discussion at different stage of my PhD journey.
I gratefully acknowledge financial support from the Australian Postgraduate
Award (APA) scholarship and the International Postgraduate Research Scholarship
(IPRS), funded by the Australian government. I would like to acknowledge the
research facilities and software provided by QUT. Thanks to QUT IT helpdesk and
High Performance Computing (HPC) for helping with running the computation and
CARF for their experimental facilities. Last, but by no means the least, I would like
to thank the government of the People’s Republic of Bangladesh for providing me
high quality education from primary school to university for almost free.

Modelling Intermittent Microwave Convective Drying (IMCD) of Food Materials xxi


Chapter 1: Introduction 1
Introduction Chapter 1:
This chapter outlines the background and motivation of the research, research
problems and objectives. It also describes the significance and scope, followed by an
outline of the contributing chapters.
1.1 BACKGROUND AND MOTIVATION
Currently, one-third of produced foods are wasted annually due to a lack of
proper processing and preservation technique (Gustavsson et al., 2011; UN, 2007).
This loss is even greater in the developing countries, amounting to 30–40% of
seasonal fruit and vegetables (Karim & Hawlader, 2005b). On the other hand,
according to the UN food agency, everyday 18,000 children die of hunger and
malnutrition and 850 million people go to bed every night with empty stomachs (UN,
2007). The World Food Programme (WFP) identifies hunger as the number one
health risk and it kills more people every year than AIDS, malaria and tuberculosis
combined (World Food Programme, 2012). Therefore, proper food processing must
be emphasized to reduce this massive loss, promote food security and combat
hunger.
Drying is one of the easiest and oldest methods of food processing and
preservation, which prevents food from microbial spoilage. It increases shelf life,
reduces weight and volume thus minimizing packing, storage, and transportation cost
and enables storage of food under an ambient environment (Kumar et al., 2015).
However, it is probably the most energy intensive technique of the major industrial
processes (Kudra, 2004) and accounts for up to 15% of all industrial energy usage
(Chua et al., 2001a). Moreover, drying causes changes in the food qualities including
discolouration, aroma loss, textural changes, nutritional degradation, and changes in
physical appearance and shape (Quirijns, 2006). Researchers have been striving to
improve energy efficiency and product quality in food drying for many years.
Intermittent Microwave Convective Drying (IMCD) is one approach to increases
both energy efficiency and product quality (Kumar et al., 2014).
Although there are some experimental investigations of IMCD, modelling
studies of this process remain under-developed. The modelling of IMCD is essential

2 Chapter 1: Introduction
to understanding the physical mechanism of heat and mass transfer and finally to
optimize the process. Therefore, this research aims to develop a comprehensive
model for IMCD.
1.2 RESEARCH PROBLEMS
Although there have been some studies highlighting the advantages of
intermittent microwave convective drying (IMCD) of food materials, all of these are
experimental. There have been no studies that have undertaken mathematical
modelling or which have led to a physical understanding of the heat and mass
transfer phenomenon occurring within the material during IMCD drying of food
material. Proper understanding of the internal heat and mass transfer mechanism
involved is essential for optimization of the drying process. Experimental study of
IMCD showed that the IMCD is much faster compared to convective drying;
however, the mechanism behind this scenario is not well understood. This is because
the water and vapour fluxes due to the various mechanisms in IMCD and their
comparison with convection drying, has not been investigated. A comprehensive
mathematical model for IMCD representing the physics behind the process can
enhance the understanding of the transport mechanism of heat and mass, and fluxes
inside the food. However, such a model is yet to be developed for IMCD. This
research investigation will contribute to knowledge providing better insight of heat
and mass transfer process involved in IMCD.
The microwave power level and intermittency during IMCD are the two main
factors that control the heating and drying rates. The intermittency of microwave
energy during IMCD allows the temperature to drop, and thus, prevents overheating.
Therefore, the investigation of temperature rise during microwave heating period and
fall during tempering period is essential in IMCD. Currently, there is no such study
that investigated this either experimentally or by modelling. In this study, the
temperature fluctuations will be investigated during IMCD both experimentally and
mathematical modelling.
Mathematical modelling of moisture transport inside food can be developed by
two approaches: (1) a single phase model which considers only water is present in
the food material, and (2) a multiphase porous media model which considers
transport of liquid water, vapour, air insider the food materials. The multiphase

Chapter 2: Introduction 3
models are more comprehensive and provide better insight into the transport
mechanisms. These models are divided into two groups: equilibrium and non-
equilibrium. Most of the multiphase models of food drying consider equilibrium.
However, equilibrium condition may not be valid at the surface of food where
moisture content is lower. Therefore, the non-equilibrium approach is a more
realistic representation of the physical situation during drying (J. Zhang & Datta,
2004). In this study, non-equilibrium multiphase porous media models were
developed for food drying.
1.3 AIMS AND OBJECTIVES
The primary aim of this work is to understand the mechanisms involved in heat
and mass transfer process during IMCD by means of a comprehensive mathematical
model. Since convection-drying modelling is a prerequisite for developing an IMCD
model, a convection-drying model is initially developed and then followed by IMCD
models. These models were gradually improved by incorporating more realistic
physical phenomena that takes place during drying. In order to achieve the primary
aim, the specific objectives of this work were to:
develop single phase mathematical models for convection drying and then
for IMCD
validate the single phase models using experimental data
develop multiphase porous media models for both convection drying and
IMCD
validate the multiphase models with experimental data
investigate the heat and mass transport mechanism of different phases
during IMCD
investigate the temperature distribution and re-distribution during IMCD
1.4 SIGNIFICANCE AND SCOPE
This research has developed a novel and the first comprehensive mathematical
model of IMCD for food, which enables an understanding of heat and mass transport
during IMCD. The model considers 3D electromagnetics for microwave heating and
multiphase multicomponent transport of heat and mass. The model was used to
investigate the water fluxes due to gas pressure and capillary pressure, vapour fluxes
4 Chapter 1: Introduction
due to binary diffusion and gas pressure, and temperature redistribution during the
process. The temperature distribution and its fluctuations have also been investigated
using the model. Since the temperature distribution and fluctuation during IMCD is
the key to avoid overheating of the product, the model in this work can contribute
significantly to improve food product quality. The challenges of developing an
IMCD model have been identified and discussed. Both Lambert’s Law and
Maxwell’s equations were considered to model microwave heat generation during
IMCD with their respective advantages and disadvantages.
The multiphase model, which is an advanced approach to modelling the drying
process, enables investigation of temporal and spatial profiles of temperature, liquid
water, water vapour, and air inside the food material. The model was used to
illustrate all modes of transport inside the food including capillary diffusion,
convection, and evaporation, which is not possible to investigate through
experiments or using other simpler models. Moreover, the non-equilibrium
formulation of evaporation in the model has been taken into consideration to
calculate vapour phase separately. Consideration of non-equilibrium evaporation of
the model allows a direct solution to the system of equations and easy
implementation of the model in commercial software.
The insights of physical phenomena acquired from the models in this thesis
will make a great contribution to the field of drying. The mathematical models used
in this research are fundamental; therefore, they can be easily modified and adapted
to any food material without considerable effort. Furthermore, the models developed
in this research will also be useful to future researchers to develop more
comprehensive models for other food processing applications and optimization of
those processes. Successful implementation of these theoretical models in the food
industry can lead to a significant improvement in food quality, energy efficiency, and
optimization.
1.5 THESIS OUTLINE
This thesis is organized into a total of eight chapters. Chapter 1 and Chapter 2
present the introduction and literature review. Chapter 3 to Chapter 7 presents the
gradual development of comprehensive IMCD models and those chapters contribute
to individual publications.

Chapter 2: Introduction 5
The thesis progresses from simple diffusion based models (Chapter 3 and 4) to
comprehensive multiphase porous media models (Chapter 5 to 7). An overview of
the dissertation is also illustrated in Figure 1-1 and chapter-wise brief discussion is
given below.
Figure 1-1. Organization of the dissertation
In Chapter 1 (this chapter), background and motivation, research problems,
objectives, significant and outline of the thesis are all provided.
In Chapter 2, a review of contemporary literature is presented. This chapter
begins with the background of food drying to identify critical factors and then
reviews microwave-assisted drying. Then it provided an extensive review of
microwave convective drying, intermittent microwave convective drying and their
modelling. Finally, the key research problems and gaps are identified and presented.
In Chapter 3, a single phase convection drying model is developed considering
three different effective diffusivities, namely, moisture dependent, temperature
dependent and an average of those two. This model will provide the basis for
choosing effective diffusivity for single-phase diffusion-based model. Evaporative
cooling phenomena during the process were also observed and explained.
In Chapter 4, a single phase IMCD model was developed by adding the
convection drying model and intermittent microwave heating. This model considered

6 Chapter 1: Introduction
Lambert’s Law for microwave heat generation, and drawbacks and advantages of
this model were identified and analysed.
In Chapter 5, a multiphase porous media model is implemented for convection
drying. This chapter presents fundamental formulations of heat, mass, and
momentum transfer along with input parameters and variables for the model.
Transport of different phases due to pressure driven, capillary diffusion, and binary
diffusion are investigated. Moreover, the model is validated with experimental
temperature and moisture data.
In Chapter 6, a multiphase porous media IMCD model is developed
considering Lambert’s Law for microwave heat generation. The enhancements of
moisture and vapour fluxes due to incorporating microwave heat generation is
illustrated and discussed.
In Chapter 7, a three-dimensional electromagnetics heat generation using
Maxwell’s equation are coupled with a multiphase porous media model to develop
the first and most comprehensive IMCD model. From this model, non-uniform
temperature distribution data are presented as are the main advantages of using
Maxwell’s equation instead of Lamberts Law. The model is validated with
experimental temperature and moisture data. Comprehensive transport mechanisms
of different phases in IMCD were investigated.
In Chapter 8, the major conclusions, contribution to knowledge, limitations,
and recommendations of this research were presented.

Chapter 2: Literature Review 7
Literature Review Chapter 2:
This Chapter will inform our approach towards the main research topic starting
with a detail background of the subject, and a comprehensive and most relevant
literature will be presented to identify research gaps. Part of this chapter has been
published in the following review paper:
C. Kumar, M. A. Karim, and M. U. H. Joardder (2014) Intermittent
Drying of Food Products: A Critical Review. Journal of Food
Engineering, 121, 48–57 (Impact Factor 2.27).
doi: http://dx.doi.org/10.1016/j.jfoodeng.2013.08.014
The signed statement of contribution page in QUT’s format is attached on the
next page.
This chapter, firstly, will discuss the mechanism of food drying and highlights
the crucial factors involved in the food drying process (Section 2.1). The following
sections (Section 2.2 and 2.3) will discuss microwave assisted drying and microwave
convective drying (MCD). Section 2.4 will present a review of the IMCD drying
literature to identify research gaps and their significance. Finally, in Section 2.5, the
key findings of the literature review and research gaps will be presented.

8 Chapter 2: Literature Review

Chapter 2: Literature Review 9
2.1 FOOD DRYING
The main purpose of food drying is to remove moisture from food material up
to a certain limit in order to hinder the growth and reproduction of microorganisms.
The process of drying commonly involves simultaneous heat and mass transfer
(Karim & Hawlader, 2005b). Figure 2-1 shows a typical drying rate curve of food
materials. The first stage shown in the figure (A-B) is called the “initial period”
where the wet surface of the material initially reaches equilibrium with the drying
environment. In this stage, the drying rate increases and mostly free water is
removed. The second stage (B-C) is termed the “constant rate period” where the
drying rate remains constant because the amount the water migrating from the
interior to the surface is equal to moisture removal to surroundings from the surface.
Figure 2-1.Typical drying rate curve (Okos et al., 2006)
In the next step (C-E), (the third stage of drying known as the falling rate
period), the drying rate reduces due to a decrease in moisture migration from the
interior to the surface resulting in a longer drying time. By increasing the drying air
temperature in this stage, we can accelerate the drying rate. But a higher temperature
usually damages the surface of the product, resulting in case hardening (Zeki, 2009).
This case hardening limits the heat and mass transfer, and cause deterioration in food
quality (Botha et al., 2012). This prolonged drying time results in higher energy
consumption. Thus, drying becomes the most energy intensive technique of the
10 Chapter 2: Literature Review
major industrial process (Kudra, 2004) and accounts for up to 15% of all industrial
energy usage (Chua et al., 2001a).
The quality of dried food is another important issue in food drying. The drying
causes changes in colour, aroma, texture, nutritive value, physical appearance and
shape etc. of the food product. These change impact consumer buying behaviour
(Quirijns, 2006). Consumer demand for healthy dried food with higher product
qualities challenges researchers to develop new or improved drying techniques for
food products (Nijhuis et al., 1996). Therefore, energy efficiency and food quality
are the two most crucial factors in food drying.
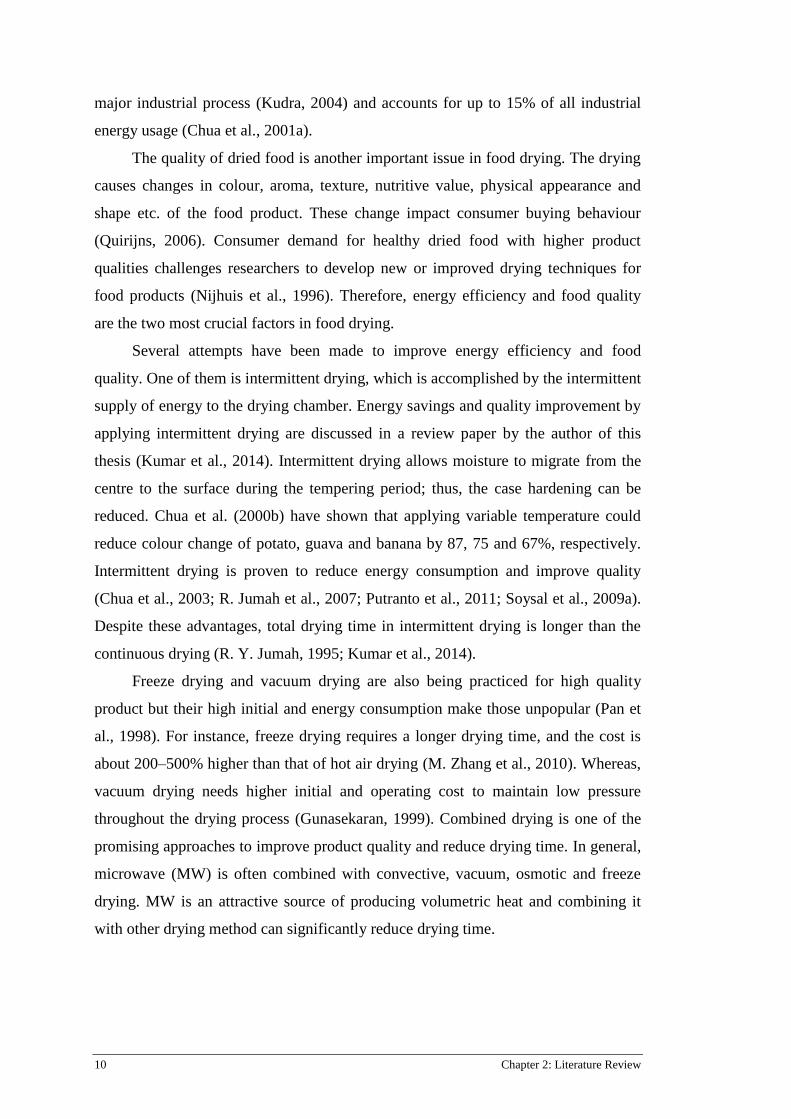
Several attempts have been made to improve energy efficiency and food
quality. One of them is intermittent drying, which is accomplished by the intermittent
supply of energy to the drying chamber. Energy savings and quality improvement by
applying intermittent drying are discussed in a review paper by the author of this
thesis (Kumar et al., 2014). Intermittent drying allows moisture to migrate from the
centre to the surface during the tempering period; thus, the case hardening can be
reduced. Chua et al. (2000b) have shown that applying variable temperature could
reduce colour change of potato, guava and banana by 87, 75 and 67%, respectively.
Intermittent drying is proven to reduce energy consumption and improve quality
(Chua et al., 2003; R. Jumah et al., 2007; Putranto et al., 2011; Soysal et al., 2009a).
Despite these advantages, total drying time in intermittent drying is longer than the
continuous drying (R. Y. Jumah, 1995; Kumar et al., 2014).
Freeze drying and vacuum drying are also being practiced for high quality
product but their high initial and energy consumption make those unpopular (Pan et
al., 1998). For instance, freeze drying requires a longer drying time, and the cost is
about 200–500% higher than that of hot air drying (M. Zhang et al., 2010). Whereas,
vacuum drying needs higher initial and operating cost to maintain low pressure
throughout the drying process (Gunasekaran, 1999). Combined drying is one of the
promising approaches to improve product quality and reduce drying time. In general,
microwave (MW) is often combined with convective, vacuum, osmotic and freeze
drying. MW is an attractive source of producing volumetric heat and combining it
with other drying method can significantly reduce drying time.

Chapter 2: Literature Review 11
2.2 MICROWAVE ASSISTED DRYING
Microwave refers to electromagnetic radiation in the frequency range of
300MHz–300GHz with a wavelength 1mm–1m. It is propagation of electromagnetic
energy through space by means of time-varying electric and magnetic fields (Hao
Feng et al., 2012). Microwave penetrates the material until moisture is located and
heats up the material volumetrically thus facilitating a higher diffusion rate and
pressure gradient to drive off the moisture from inside of the material (I. W. Turner
& Jolly, 1991). There are two main mechanisms of microwave heating; dipolar re-
orientation and ionic conduction. Water molecules are dipolar in nature and try to
follow the electric field which alternates at very high frequency. For a commonly
used microwave frequency of 2.45 GHz, the electric field changes direction 2.45
billion times a second, making the dipoles move with it (A. Datta & Rakesh, 2009).
Such rotation of molecules produces friction and generates heat inside the food
material (M. Zhang et al., 2010). Ionic conduction is a second major mechanism of
microwave heating which is caused by ions, such as those present in salty food,
which migrate under the influence of the electric field. Figure 2-2 shows the main
heating mechanisms in the different frequency regions used in industry for heating
and drying.
Figure 2-2. Schematic diagram depicting the dipolar and ionic loss mechanisms and their
contributions to the dielectric properties as a function of frequency (Metaxas, 1996b).

12 Chapter 2: Literature Review
Due to its volumetric heating capability, application of microwaves with other
drying methods can significantly increase the drying rate. The main advantages of
microwave assisted drying are:
(a) Volumetric heating: Microwave energy interacts with water molecules
within the food leading to volumetric heating and increased moisture diffusion rates
(I. W. Turner et al., 1998). This can thereby significantly reduce drying times
(Mujumdar, 2004; M. Zhang et al., 2006);
(b) Quality improvement: The quality of the dried product can be improved
by combining microwave heating with other drying methods (Dev et al., 2011);
(c) Controlled heating: The fidelity of heating can be controlled using
microwave energy as it can be applied intermittently by varying the pulse ratio and
the power level of the microwave. (Gunasekaran, 1999).
(d) Selective heating: Preferential heating of wetter areas is possible with
microwave heating and also bound water molecules can be excited by microwaves
(Gunasekaran, 1999; I. W. Turner et al., 1998). For these reasons, microwave related
drying is referred to as innovative and fourth generation drying technology.
Drying time reduction in microwave assisted drying can be illustrated in Figure
2-3. It is clear from the Figure 2-3 that microwave vacuum (MWV) and microwave
convection (MWC) drying shows remarkably lower drying time than hot air (HA)
drying (Orsat et al., 2007; Wojdyło et al., 2014; M. Zhang et al., 2010).
Figure 2-3. Drying curves of whole mushrooms under different drying methods (Orsat et al., 2007)
Chapter 2: Literature Review 13
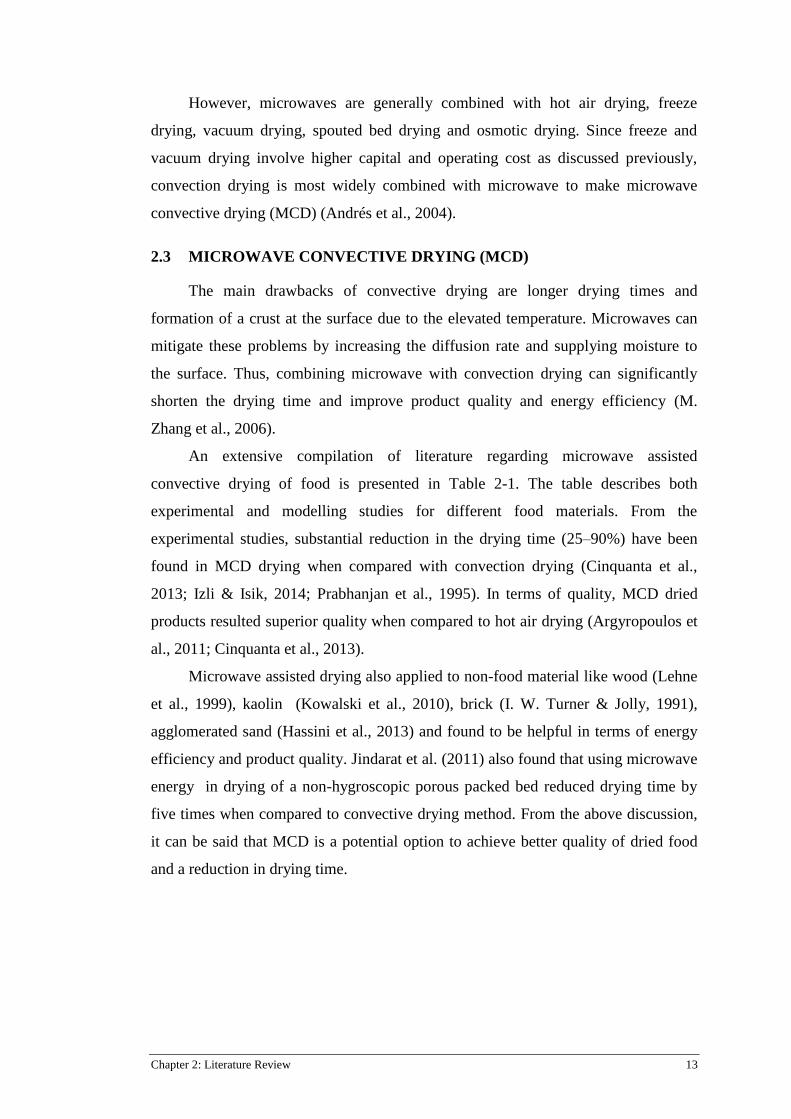
However, microwaves are generally combined with hot air drying, freeze
drying, vacuum drying, spouted bed drying and osmotic drying. Since freeze and
vacuum drying involve higher capital and operating cost as discussed previously,
convection drying is most widely combined with microwave to make microwave
convective drying (MCD) (Andrés et al., 2004).
2.3 MICROWAVE CONVECTIVE DRYING (MCD)
The main drawbacks of convective drying are longer drying times and
formation of a crust at the surface due to the elevated temperature. Microwaves can
mitigate these problems by increasing the diffusion rate and supplying moisture to
the surface. Thus, combining microwave with convection drying can significantly
shorten the drying time and improve product quality and energy efficiency (M.
Zhang et al., 2006).
An extensive compilation of literature regarding microwave assisted
convective drying of food is presented in Table 2-1. The table describes both
experimental and modelling studies for different food materials. From the
experimental studies, substantial reduction in the drying time (25–90%) have been
found in MCD drying when compared with convection drying (Cinquanta et al.,
2013; Izli & Isik, 2014; Prabhanjan et al., 1995). In terms of quality, MCD dried
products resulted superior quality when compared to hot air drying (Argyropoulos et
al., 2011; Cinquanta et al., 2013).
Microwave assisted drying also applied to non-food material like wood (Lehne
et al., 1999), kaolin (Kowalski et al., 2010), brick (I. W. Turner & Jolly, 1991),
agglomerated sand (Hassini et al., 2013) and found to be helpful in terms of energy
efficiency and product quality. Jindarat et al. (2011) also found that using microwave
energy in drying of a non-hygroscopic porous packed bed reduced drying time by
five times when compared to convective drying method. From the above discussion,
it can be said that MCD is a potential option to achieve better quality of dried food
and a reduction in drying time.

14 Chapter 2: Literature Review
Table 2-1. Summery of microwave assisted convective heating and drying of food material
Material Modelling of power
distribution
Reference
Apple N/A (Marzec et al., 2010)
Apple cylinders N/A (Andrés et al., 2004)
Beetroot N/A (Figiel, 2010)
Carrot Lamberts law (Sanga et al., 2002)
Carrot cubes N/A (Prabhanjan et al., 1995)
Chinese jujube N/A (Fang et al., 2011)
Clipfish N/A (Bantle et al., 2013)
Cooked soybeans N/A (Gowen et al., 2008)
Cranberries N/A (Sunjka et al., 2004)
Garlic Lambert’s law (Abbasi Souraki & Mowla, 2008)
Garlic cloves N/A (Sharma et al., 2009)
Gel Maxwell* (Pitchai et al., 2012)
Green peeper Empirical (H. Darvishi et al., 2013b)
Green pepper Empirical (H. Darvishi et al., 2013a)
Lemon slice Empirical (Sadeghi et al., 2013)
Mashed potato Maxwell* (Chen et al., 2014)
Minced beef Lambert’s Law* (Campañone & Zaritzky, 2005)
Moringa oleifera
pods (Drumsticks)
N/A (Dev et al., 2011)
Mushrooms N/A (Argyropoulos et al., 2011)
Pineapple N/A (Botha et al., 2011)
Pistachios Empirical (Kouchakzadeh & Shafeei, 2010)
Potato Maxwell’s Equation (Malafronte et al., 2012)
Potato Lamberts law (McMinn et al., 2003)
Pumpkin slices N/A (Ilknur, 2007)
Swede, potato,
bread, and concrete
N/A (Holtz et al., 2010)
Tomato N/A (Swain et al., 2013)
Chapter 2: Literature Review 15
Material Modelling of power
distribution
Reference
Tomato slice Empirical (Workneh & Oke, 2013)
Two-percent agar
gel
Lambert’s law and Maxwell’s*
equations
(Yang & Gunasekaran, 2004)
Wheat seeds Lambert’s Law (Mohamed Hemis et al., 2012)
*-heating only (no mass transfer); N/A-Not available
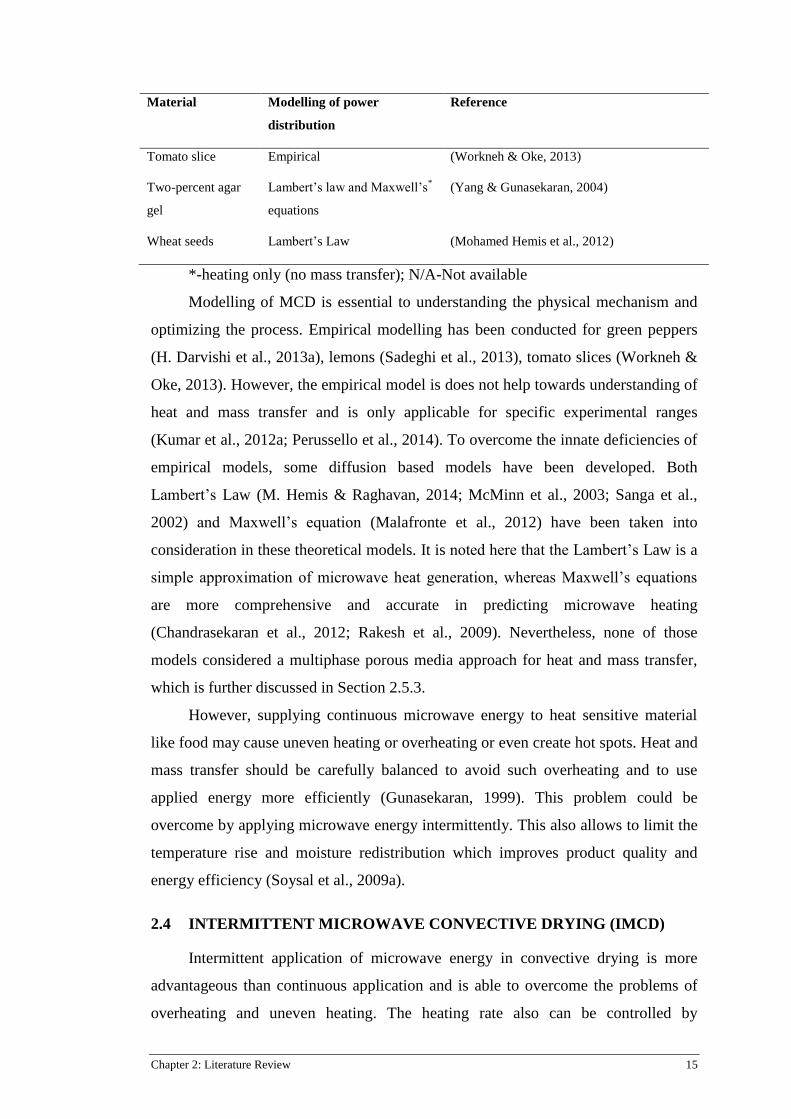
Modelling of MCD is essential to understanding the physical mechanism and
optimizing the process. Empirical modelling has been conducted for green peppers
(H. Darvishi et al., 2013a), lemons (Sadeghi et al., 2013), tomato slices (Workneh &
Oke, 2013). However, the empirical model is does not help towards understanding of
heat and mass transfer and is only applicable for specific experimental ranges
(Kumar et al., 2012a; Perussello et al., 2014). To overcome the innate deficiencies of
empirical models, some diffusion based models have been developed. Both
Lambert’s Law (M. Hemis & Raghavan, 2014; McMinn et al., 2003; Sanga et al.,
2002) and Maxwell’s equation (Malafronte et al., 2012) have been taken into
consideration in these theoretical models. It is noted here that the Lambert’s Law is a
simple approximation of microwave heat generation, whereas Maxwell’s equations
are more comprehensive and accurate in predicting microwave heating
(Chandrasekaran et al., 2012; Rakesh et al., 2009). Nevertheless, none of those
models considered a multiphase porous media approach for heat and mass transfer,
which is further discussed in Section 2.5.3.
However, supplying continuous microwave energy to heat sensitive material
like food may cause uneven heating or overheating or even create hot spots. Heat and
mass transfer should be carefully balanced to avoid such overheating and to use
applied energy more efficiently (Gunasekaran, 1999). This problem could be
overcome by applying microwave energy intermittently. This also allows to limit the
temperature rise and moisture redistribution which improves product quality and
energy efficiency (Soysal et al., 2009a).
2.4 INTERMITTENT MICROWAVE CONVECTIVE DRYING (IMCD)
Intermittent application of microwave energy in convective drying is more
advantageous than continuous application and is able to overcome the problems of
overheating and uneven heating. The heating rate also can be controlled by

16 Chapter 2: Literature Review
regulating the intermittency. The advantages of IMCD in terms of energy efficiency
and dried product quality have been reported in literature as shown in Table 2.2. For
instance, Soysal et al. (2009a) reported that IMCD of red pepper produced better
sensory attributes, appearance, colour, texture and overall liking, than MCD and
commercial drying. Soysal et al. (2009b) compared IMCD and convective drying for
oregano and found that the IMCD was 4.7–11.2 times more energy efficient
compared to convective drying and was able to provide better quality dried food.
Table 2-2. Summary of intermittent microwave assisted convective heating and drying of food
material
Material Modelling of power
distribution Reference
Bananas N/A (Ahrné et al., 2007)
Carrots, mushrooms N/A (Orsat et al., 2007)
2% agar gel Lambert’s Law* (Yang & Gunasekaran, 2001)
Dill leaves Empirical (Esturk & Soysal, 2010)
2% agar gel N/A* (Gunasekaran & Yang, 2007a)
Mashed potato Maxwell’s*
(Gunasekaran & Yang, 2007b)
Oregano N/A (Soysal et al., 2009b)
Pineapple N/A (Botha et al., 2012)
Red pepper N/A (Soysal et al., 2009a)
Sage(Salvia officinalis)
Leaves N/A (Esturk, 2012; Esturk et al., 2011)
*-heating only; N/A-not available
Advantages of IMCD in terms of improving energy efficiency and product
quality, and significantly reducing drying time have been found in many other
products such as Oregano (Soysal et al., 2009b), Pineapple (Botha et al., 2012), Red
Pepper (Soysal et al., 2009a), Sage Leaves (Esturk, 2012; Esturk et al., 2011),
Bananas (Ahrné et al., 2007), and Carrots and Mushrooms (Orsat et al., 2007).
However, all the above studies reported on IMCD drying were conducted
experimentally without considering the physics behind the heat and mass transfer
involved in the process. Thus there is a lack of understating of the physical
phenomena involving heat and mass transfer in IMCD. Moreover, limiting the
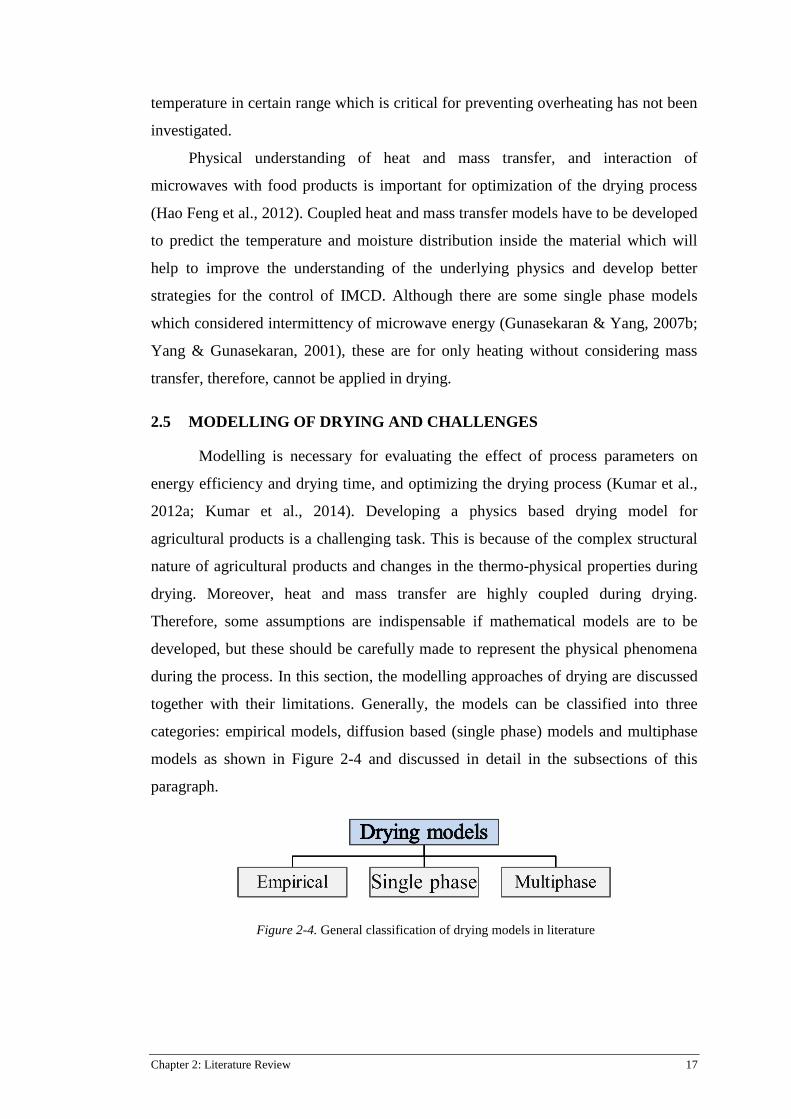
Chapter 2: Literature Review 17
temperature in certain range which is critical for preventing overheating has not been
investigated.
Physical understanding of heat and mass transfer, and interaction of
microwaves with food products is important for optimization of the drying process
(Hao Feng et al., 2012). Coupled heat and mass transfer models have to be developed
to predict the temperature and moisture distribution inside the material which will
help to improve the understanding of the underlying physics and develop better
strategies for the control of IMCD. Although there are some single phase models
which considered intermittency of microwave energy (Gunasekaran & Yang, 2007b;
Yang & Gunasekaran, 2001), these are for only heating without considering mass
transfer, therefore, cannot be applied in drying.
2.5 MODELLING OF DRYING AND CHALLENGES
Modelling is necessary for evaluating the effect of process parameters on
energy efficiency and drying time, and optimizing the drying process (Kumar et al.,
2012a; Kumar et al., 2014). Developing a physics based drying model for
agricultural products is a challenging task. This is because of the complex structural
nature of agricultural products and changes in the thermo-physical properties during
drying. Moreover, heat and mass transfer are highly coupled during drying.
Therefore, some assumptions are indispensable if mathematical models are to be
developed, but these should be carefully made to represent the physical phenomena
during the process. In this section, the modelling approaches of drying are discussed
together with their limitations. Generally, the models can be classified into three
categories: empirical models, diffusion based (single phase) models and multiphase
models as shown in Figure 2-4 and discussed in detail in the subsections of this
paragraph.
Figure 2-4. General classification of drying models in literature

18 Chapter 2: Literature Review
Empirical models 2.5.1
The empirical or observation based models can be rapidly developed based on
experimental data. These models are generally derived from Newton’s law of cooling
and Fick’s law of diffusions (Erbay & Icier, 2010). These are simpler to apply and
often used to describe the drying curve. Despite these advantages, they do not
provide physical insight into process. In addition, these models are only valid for
specific process condition and material. In contrast to empirical models, the physics-
based models can capture the inherent drying mechanism better (Chou et al., 2000;
Chua et al., 2003; Ho et al., 2002).
Diffusion based (single phase) models 2.5.2
The diffusion-based models are very popular because of their simplicity and
good predictive capability (Javier R. Arballo et al., 2010; Kumar et al., 2012b;
Perussello et al., 2014). These models assume conductive heat transfer for energy
and diffusive transport for moisture. These models need an effective diffusivity
(phenomenological coefficient) value, which has to be experimentally determined.
The effective diffusivity calculation is crucial for drying models because it is the
main parameter that controls the process with a higher diffusion coefficient implying
increased drying rate. This effective diffusion coefficient changes during drying due
to the effects of sample temperature and moisture content (Batista et al., 2007).
Some authors considered effective diffusivity as a function of shrinkage or moisture
content (Karim & Hawlader, 2005a), whereas, others postulated it as temperature
dependent (Chandra Mohan & Talukdar, 2010). Even though there are several
modelling studies of food drying, there are limited studies that compare the impacts
of temperature dependent and moisture dependent effective diffusivities. In general,
the thermo-physical properties (thermal conductivity, specific heat, density etc.) of
food, change as drying progresses. Some diffusion models consider them as constant
which is very unrealistic. Although this model can provide a good match with
experimental results, it cannot provide an understanding of other transport
mechanisms such as pressure driven flow and evaporation. The drawbacks of these
kinds of models are discussed in detail in the work of Zhang and Datta (2004).
Lumping all the water transport as diffusion cannot be justified under all situations.
Therefore, multiphase models considering transport of liquid water, vapour, air
insider the food materials are more realistic.

Chapter 2: Literature Review 19
Multiphase models 2.5.3
The multiphase models incorporate the transition from the individual phase at
the ‘microscopic’ level to representative average volume at the ‘macroscopic’ level,
which provides a fundamental and convincing basis of heat and mass transport (A. K.
Datta, 2007b; Whitaker, 1977). Multiphase models can be categorised into two
groups: equilibrium and non-equilibrium approach of vapour pressure. In equilibrium
formulations, the vapour pressure, vp , is assumed to be equal with equilibrium
vapour pressure, eqvp , , and vice versa. There are some multiphase models
considering equilibrium approach applied in vacuum drying of wood (Ian W. Turner
& Perré, 2004) and convection drying of wood and clay (Stanish et al., 1986)
(Chemkhi et al., 2009), microwave spouted bed drying of apple (H. Feng et al., 2001)
and large bagasse stockpiles (Farrell et al., 2012). Some multiphase porous media
models combine the liquid water and vapour equations together to eliminate the
evaporation rate term (Farrell et al., 2012; Ratanadecho et al., 2001; Suwannapum &
Rattanadecho, 2011). By doing this, the concentrations of liquid water and vapour
cannot be determined.
However, equilibrium condition may be valid at surface with lower moisture
content because equilibrium condition may not be achieved due to lower moisture
content at the surface during drying. Therefore, the non-equilibrium approach is a
more realistic representation of the physical situation during drying (J. Zhang &
Datta, 2004). Moreover, the non-equilibrium formulation for evaporation can be used
to express explicit formulation of evaporation, thus allowing calculation of each
phase separately. Furthermore, non-equilibrium multiphase models are
computationally effective and applied to wide range of food processing such as
frying (Bansal et al., 2014; H. Ni & Datta, 1999), microwave heating (Chen et al.,
2014; Rakesh et al., 2010), puffing (Rakesh & Datta, 2013) baking (J. Zhang et al.,
2005), meat cooking (Dhall & Datta, 2011) etc. However, application of these non-
equilibrium models in drying of food materials is very limited. To the authors’ best
knowledge, there is no IMCD model considering non-equilibrium multiphase porous
media.
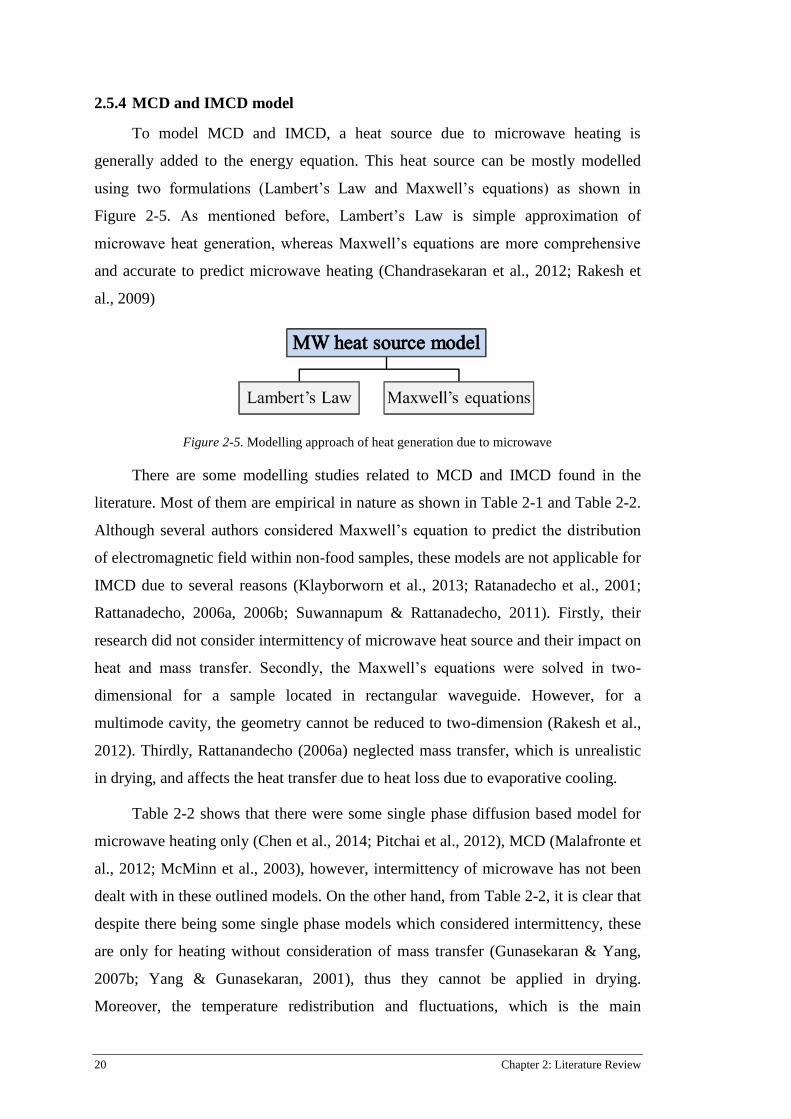
20 Chapter 2: Literature Review
MCD and IMCD model 2.5.4
To model MCD and IMCD, a heat source due to microwave heating is
generally added to the energy equation. This heat source can be mostly modelled
using two formulations (Lambert’s Law and Maxwell’s equations) as shown in
Figure 2-5. As mentioned before, Lambert’s Law is simple approximation of
microwave heat generation, whereas Maxwell’s equations are more comprehensive
and accurate to predict microwave heating (Chandrasekaran et al., 2012; Rakesh et
al., 2009)
Figure 2-5. Modelling approach of heat generation due to microwave
There are some modelling studies related to MCD and IMCD found in the
literature. Most of them are empirical in nature as shown in Table 2-1 and Table 2-2.
Although several authors considered Maxwell’s equation to predict the distribution
of electromagnetic field within non-food samples, these models are not applicable for
IMCD due to several reasons (Klayborworn et al., 2013; Ratanadecho et al., 2001;
Rattanadecho, 2006a, 2006b; Suwannapum & Rattanadecho, 2011). Firstly, their
research did not consider intermittency of microwave heat source and their impact on
heat and mass transfer. Secondly, the Maxwell’s equations were solved in two-
dimensional for a sample located in rectangular waveguide. However, for a
multimode cavity, the geometry cannot be reduced to two-dimension (Rakesh et al.,
2012). Thirdly, Rattanandecho (2006a) neglected mass transfer, which is unrealistic
in drying, and affects the heat transfer due to heat loss due to evaporative cooling.
Table 2-2 shows that there were some single phase diffusion based model for
microwave heating only (Chen et al., 2014; Pitchai et al., 2012), MCD (Malafronte et
al., 2012; McMinn et al., 2003), however, intermittency of microwave has not been
dealt with in these outlined models. On the other hand, from Table 2-2, it is clear that
despite there being some single phase models which considered intermittency, these
are only for heating without consideration of mass transfer (Gunasekaran & Yang,
2007b; Yang & Gunasekaran, 2001), thus they cannot be applied in drying.
Moreover, the temperature redistribution and fluctuations, which is the main

Chapter 2: Literature Review 21
advantage of intermittency, has been overlooked in those studies. In light of the
above literature review, it is clear that there is no model that is completely dedicated
to IMCD, and therefore, the transport processes in IMCD are still poorly understood.
Not only is there no satisfactory multiphase model, there is not even a
comprehensive single-phase model for IMCD.
2.6 SUMMARY OF LITERATURE AND RESEARCH GAPS
Based on the above literature review, we can conclude the following:
Energy efficiency and food quality are the two most crucial factors in food
drying.
Microwave assisted drying technology can significantly reduce drying
time and improve product quality. However, supplying continuous
microwave energy to heat-sensitive materials, like food, may cause
overheating and uneven heating, creating cold and hot spots inside the
food and eventually degrading the quality of food.
IMCD allows redistribution of temperature and moisture, and can limit the
temperature to a certain range; consequently, reducing the problems of
overheating.
Modelling is necessary for evaluating the effect of process parameters on
drying kinetics, understanding the transport mechanism and optimizing the
drying process.
Single-phase models are simple; but, require an effective diffusion
coefficient which needs to be experimentally determined and which varies
with process conditions. In addition, effective diffusivity lumps all
moisture flux together and therefore cannot provide an understanding of
individual transport mechanisms such as pressure-driven flow and
evaporation.
Multiphase models are available in food drying; but, most of them
considered equilibrium conditions ( eqvv pp , ), which may not be valid in
drying, especially, near the surface of the product where moisture content
is low.

22 Chapter 2: Literature Review
Non-equilibrium multiphase models are most comprehensive and
computationally effective, the non-equilibrium formulation for evaporation
can be used to express an explicit formulation of evaporation, thus
allowing calculation of each phase separately. However, there are limited
studies of non-equilibrium models in food drying.
Despite numerous experimental studies available for IMCD, there is no
complete multiphase model and not even an accurate single-phase model
for IMCD.
Physical mechanisms of heat and mass transfer in IMCD are not properly
understood.
Moisture and vapour fluxes due to different mechanisms, such as, capillary
flow, binary diffusions, pressure driven and temperature fluctuations
during IMCD have not been investigated.
From these arguments, it is clear that a comprehensive multiphase porous
media model considering non-equilibrium vapour pressure for IMCD model is
necessary which is not available in literature. Such a model will be developed to
investigate the transport mechanism for IMCD in this research.
Chapter 3: Single Phase Model for Convection Drying 23
Single Phase Model for Chapter 3:
Convection Drying
This Chapter presents a single-phase diffusion-based model for convection
drying, which was used as a basis for developing the IMCD model outlined in the
next chapter. The model was validated with experimental data; a parametric analysis
was conducted.
This Chapter has been published as:
C. Kumar, G. J. Millar, and M. A. Karim (2015) Effective Diffusivity and
Evaporative Cooling in Convective Drying of Food Material. Drying
Technology, 33, (2), 227–237.
The author helped to develop an osmo-convective drying model based on this
chapter’s work, which was also published as:
C. A. Perussello, C. Kumar, F. Castilhosc, and M. A. Karim (2014) Heat
and mass transfer modelling of the osmo-convective drying of Yacon roots
(Smallanthus sonchifolius). Applied Thermal Engineering, 63(1) 23–32
(Impact Factor 2.12).

24 Chapter 3: Single Phase Model for Convection Drying
The signed statements of contributions for the above mentioned paper are
given below:

Chapter 3: Single Phase Model for Convection Drying 25
3.1 ABSTRACT
This article presents mathematical equations to simulate coupled heat and mass
transfer during the convective drying of food materials using three different effective
diffusivities: shrinkage dependent, temperature dependent, and the average of those
two. Engineering simulation software COMSOL Multiphysics was utilized to
simulate the model in 2D and 3D. The simulation results were compared with
experimental data. It is found that the temperature-dependent effective diffusivity
model predicts the moisture content more accurately at the initial stage of the drying,
whereas, the shrinkage-dependent effective diffusivity model is better for the final
stage of the drying. The model with shrinkage-dependent effective diffusivity shows
evaporative cooling phenomena at the initial stage of drying. This phenomenon was
investigated and explained. Three-dimensional temperature and moisture profiles
show that even when the surface is dry, the inside of the sample may still contain a
large amount of moisture. Therefore, the drying process should be carefully dealt
with; otherwise, microbial spoilage may start from the centre of the dried food. A
parametric investigation was conducted after the validation of the model.
3.2 INTRODUCTION
Food drying is a process that involves removing moisture in order to preserve
fruits by preventing microbial spoilage. It also reduces packaging and transport cost
by reducing weight and volume. Compared to other food preservation methods,
dried food has the advantage that it can be stored at ambient conditions. However,
drying is an energy intensive process and accounts for up to 15% of all industrial
energy usage and the quality of food may degrade during the drying process (Chua et
al., 2001a; Rami Jumah & Mujumdar, 2005; Kumar et al., 2014) . The objective of
food drying is not only to remove moisture by supplying heat energy but also to
produce quality food (Mujumdar, 2004). To reduce this energy consumption and
improve product quality, a physical understanding of the drying process is essential.
Mathematical models have been proven useful to understand the physical
mechanism, optimize energy efficiency and improve product quality (Kumar et al.,
2012a). Mathematical models can be either empirical or fundamental models.
Empirical expressions are common and relatively easy to use (Kumar et al., 2014).
Many empirical models for drying have been developed and applied for different
products, for instance, banana (Wilton Pereira Silva, Silva, et al., 2014), apple (Z.
26 Chapter 3: Single Phase Model for Convection Drying
Wang et al., 2007), rice (Cihan et al., 2007), carrot (Cui et al., 2004), cocoa (Hii et
al., 2009) etc. Erbay and Icier (2010) reviewed empirical models for drying, and
found that the best-fitted model is different for different products. However, these
empirical models are only applicable in the range used to collect the experimental
parameters (Kumar et al., 2012b). In addition, typically they are not able to describe
the physics of drying. In contrast to empirical relationships, fundamental models can
satisfactorily capture the physics during drying (Chou et al., 2000; Chua et al., 2003;
Ho et al., 2002). Fundamental mathematical modelling is applicable for a wide range
of applications and optimization scenarios (Kumar et al., 2012b).
Several fundamental mathematical models have been developed for food
drying. For example, Barati and Esfahani (2011) developed a food drying model
wherein they considered the material properties to be constant. However, in reality
during the drying process physical properties such as diffusion coefficients and
dimensional changes occur as the extent of drying progresses (Joardder, Kumar, et
al., 2013). Consequently, if these latter issues are not considered, the model
predictions may be erroneous in terms of estimating temperature and moisture
content (N. Wang & Brennan, 1995). In particular, the diffusion coefficient can have
a significant effect on the drying kinetics.
Calculation of the effective diffusivity is crucial for drying models because it
is the main parameter that controls the process with a higher diffusion coefficient
implying increased drying rate. The diffusion coefficient changes during drying due
to the effects of sample temperature and moisture content (Batista et al., 2007).
Alternatively, some authors considered effective diffusivity as a function of
shrinkage or moisture content (Karim & Hawlader, 2005a); whereas, others
postulated it as temperature dependent (Chandra Mohan & Talukdar, 2010). In the
case of a temperature dependent effective diffusivity value, the diffusivity increases
as drying progresses. On the other hand, effective diffusivity decreases with time in
the case of shrinkage or moisture dependency. This latter behaviour is ascribed to the
diffusion rate decreasing as moisture gradient drops. However, Baini and Langrish
(2007) mentioned that shrinkage also tends to reduce the path length for diffusion
which results in increased diffusivity. Consequently, there are two opposite effects of
shrinkage on effective diffusivity which theoretically may cancel each other.

Chapter 3: Single Phase Model for Convection Drying 27
Silva et al.(2011) analysed the effect of considering constant and variable
effective diffusivities in banana drying. They found that the variable effective
diffusivity (moisture dependent) is more accurate than the constant effective
diffusivity in predicting the drying curve. Some authors (Karim & Hawlader, 2005a)
considered effective diffusivity as a function of moisture content whereas others
(Wilton Pereira Silva et al., 2013) considered it as a function of temperature.
However, there are limited studies comparing the influence of temperature dependent
and moisture dependent effective diffusivity. Recently, Silva et al. (2014) considered
effective diffusivity as a function of both temperature and moisture together (i.e.
D=f(T, M)), not temperature or moisture dependent diffusivities separately. Therefore,
it was not possible to compare the impact of considering temperature and moisture
dependent effective diffusivities. Moreover, they did not report the impact of variable
diffusivities on material temperature. A comparison of drying kinetics for both
temperature and moisture dependent effective diffusivities can play a vital role in
choosing the correct effective diffusivity for modelling purposes. Though there are
several modelling studies of food drying, there are limited studies that compare the
impacts of temperature dependent and moisture dependent effective diffusivities.
Understanding the exact temperature and moisture distribution in food samples
is important in food drying. Joardder et al. (2013) showed that temperature
distribution plays a critical role in determining the quality of dried food. Similarly,
moisture distribution plays a critical role in food safety and quality. Vadivambal and
Jayas (2010) showed that despite the fact that the average moisture content was
lower than what was considered a safe value, spoilage started from the higher
moisture content area. Therefore, it is crucial to know the moisture distribution in the
sample. Unfortunately, it is difficult to measure temperature and moisture
distribution inside the sample experimentally, which means that appropriate
modelling approaches are required to determine the moisture distribution. Mujumdar
and Zhonghua (2007) argued that technical innovation can be intensified by
mathematical modelling which can provide better understanding of the drying
process. Karim and Hawlader (2005a) developed a mathematical model to determine
temperature and moisture changes with time but it did not provide temperature and
moisture distribution within the sample. The moisture distribution is a key parameter
for evaporation because evaporation depends on surface moisture content.

28 Chapter 3: Single Phase Model for Convection Drying
Evaporation plays an important role during drying in terms of heat and mass
transfer, with higher evaporation resulting in enhanced drying rates. During the
initial stage of drying, the surface is almost saturated, which induces both higher
evaporation and moisture removal rates. Due to this higher evaporation rate, the
temperature drops at this stage for a short period of time (I. W. Turner & Jolly, 1991;
W. Zhang & Mujumdar, 1992). Recently Golestani et al.(2013) also observed
reduced temperature in the initial drying phase and they attributed this phenomenon
to high enthalpy of water evaporation. The temperature evolution depends upon the
heat flux. During drying, two reverse heat fluxes take place; inward convective heat
flux and outward evaporative heat flux. Again, there are limited studies that have
investigated the temperature variation during the initial stage of convection drying
based on heat flux.
In this context, the aims of this paper are threefold; to (1) develop three drying
models based on three effective diffusivities: namely, moisture dependent,
temperature dependent, and average effective diffusivities; (2) investigate the
evaporative cooling phenomena in terms of heat flux; (3) conduct a parametric study
with validated models.
3.3 MODEL DEVELOPMENT
The model developed in this research considered the cylindrical geometry of
the food product as shown in Figure 3-1.
Figure 3-1. (a) Actual geometry of the sample slice and (b) Simplified 2D axisymmetric model
domain.
Chapter 3: Single Phase Model for Convection Drying 29
Governing equations 3.3.1
It was assumed that the mass flux is only due to diffusion; therefore, the Fick’s
diffusion law is valid for mass transfer of moisture given by:
RcDt
c
eff 3-1
where, c is the moisture concentration (mol/m3), t is time, effD is the effective
diffusion coefficient (m2/s), R is the production or consumption of moisture (kg/m
3s)
which is zero here.
The heat transfer is considered by Fourier law, given by,
ep )( QTkt
Tc
3-2
where, T is the temperature of the sample (0C), is the density of sample (kg/m
3),
pc is the specific heat (J/kg/K), and k is the thermal conductivity (W/m/K), eQ is the
internal heat source or sink. The heat source term is zero for convection drying but
when electromagnetic heating such as microwave is involved then it should be non-
zero term and added to the heat transfer equation.
Initial and boundary conditions 3.3.2
Initial moisture content, 𝑀𝑑𝑏 = 4 kg/kg (db)
Initial temperature, 𝑇0 = 380𝐶
Heat transfer boundary conditions: Both convection and evaporation were
considered at the transport boundaries (Figure 3-1). Thus the heat transfer boundary
condition at the transport boundaries was defined by equation 3-3.
𝒏. (𝑘𝛻𝑇) = ℎ𝑇(𝑇𝑎𝑖𝑟 − 𝑇) − ℎ𝑚𝜌(𝑀 − 𝑀𝑒)ℎ𝑓𝑔, 3-3
where, ℎ𝑇 is heat transfer coefficient (W/m2/K), ℎ𝑚 is mass transfer coefficient
(m/s), 𝑇𝑎𝑖𝑟 is drying air temperature (0C), Me is equilibrium moisture content (kg/kg)
dry basis and ℎ𝑓𝑔 is latent heat of evaporation (J/kg).
The heat transfer boundary condition at the symmetry boundary is given by,
𝒏. (𝑘𝛻𝑇) = 0. 3-4

30 Chapter 3: Single Phase Model for Convection Drying
Mass transfer boundary conditions:
The mass transfer boundary condition at the transport boundaries are given by,
𝒏. (𝐷𝛻𝑐) = ℎm(𝑐b − 𝑐), 3-5
where, 𝑐𝑏 is bulk moisture concentration (mol/m3).
The mass transfer boundary condition at the symmetry boundary is given by
𝒏. (𝐷𝛻𝑐) = 0. 3-6
Input parameters 3.3.3
Physical properties of banana and other input parameters used in the simulation
programme are listed in Table 3-1.
Table 3-1. Input parameters for the model
Properties Value Reference
Density of Banana, 𝜌 980 (
𝑘𝑔
𝑚3)
(Karim & Hawlader, 2005a)
Initial Moisture Content (dry basis), 𝑀 4 (
𝑘𝑔
𝑘𝑔)
Measured
Latent heat of Evaporation, ℎ𝑓𝑔 2358600 (
𝐽
𝑘𝑔)
(Cengel, 2002)
Thermal Conductivity of air at 600C, 𝑘𝑎𝑖𝑟
0.0287 (𝑊
𝑚𝐾)
(Cengel, 2002)
Density of Water at 600C, 𝜌𝑤
994.59 (𝑘𝑔
𝑚3)
(Cengel, 2002)
Dynamic viscosity of air at 600C, 𝜇𝑎𝑖𝑟 1.78𝑥10−4 (𝑃𝑎. 𝑠) (Cengel, 2002)
Specific heat of air at 600C, 𝐶𝑝𝑎𝑖𝑟
1005.04 (𝐽
𝑘𝑔𝐾)
(Cengel, 2002)
Density of air at 600C, 𝜌𝑎𝑖𝑟
1.073(𝑘𝑔
𝑚3)
(Cengel, 2002)
Equilibrium moisture content, 𝑀𝑒 0.29 (
𝑘𝑔
𝑘𝑔)
(Karim & Hawlader, 2005b)
Reference diffusion coefficient, Dref 2.41𝑥10−10 (
𝑚2
𝑠)
(Karim & Hawlader, 2005a)

Chapter 3: Single Phase Model for Convection Drying 31
Variable thermos-physical properties
In food processing, thermos-physical properties play an important role in heat
and mass transfer simulation (Perussello et al., 2013). In this simulation, specific
heat and thermal conductivity were considered as function of moisture content (Mwb)
by the following equations (Bart-Plange et al., 2012).
Specific heat, 174224751.812
wbwbp MMC 3-7
Thermal conductivity, 120.06.0 wbMk 3-8
Effective Diffusivity Calculation
In this study, three simulations were performed with three different effective
diffusivities. The effective diffusivity formulations are discussed below:
Moisture- or shrinkage dependent effective diffusivity, MD
Karim & Hawlader (2005a) presented effective diffusion coefficient as a
function of moisture content for product undergoing shrinkage during drying. In this
study the following equation was used to incorporate the shrinkage dependent
diffusivity:
2
0
b
b
D
D
M
ref, 3-9
where refD is reference effective diffusivity (m2/s) which is constant and calculated
from experimental value, b0 and b are the half thickness of the material (m) at time 0
and t, respectively. Thickness ratio obtained by the following equation:
sw
swbw
M
Mbb
0
0 3-10
where, w is the density of water (kg/m3), s is the density of the sample (kg/m
3).
Temperature dependent effective diffusivity, TD
Temperature dependent diffusivity, TD , was obtained from an Arrhenius type
relationship to the temperature with the following equation (Islam et al., 2012; N.
Wang & Brennan, 1995):
TR
E
Tg
a
eDD
0 3-11

32 Chapter 3: Single Phase Model for Convection Drying
where aE is activation energy (kJ/mol), Rg is the universal gas constant (kJ/mol/K),
and D0 is integration constant (m2/s).
Average effective diffusivity, effD
The third model considered the average effective diffusivity, effD , which is
average of the temperature-and moisture dependent effective diffusivities given by
2
2
00
b
bDeD
D
ref
TR
E
eff
g
a
.
3-12
Heat and mass transfer coefficient calculation
The heat and mass transfer coefficients are calculated from well-established
correlations of Nusselt and Sherwood number for laminar and turbulent flow over
flat plates as shown in equations 3-13 to 3-16. These relationships have been used in
drying by many other researchers (Golestani et al., 2013; Karim & Hawlader, 2005a;
Montanuci et al., 2014; Perussello et al., 2014) and hence the use of these
relationships is justified.
The average heat transfer coefficient was calculated from Nusselt number (Nu)
by using equations 3-13 and 3-14 for laminar and turbulent flow, respectively (Mills,
1995).
33.05.0T PrRe664.0h
k
LNu 3-13
33.05.0T PrRe0296.0h
k
LNu
3-14
where L is characteristics length (m), Re is the Reynolds number, and Pr is the
Prandtl number.
Because Fourier’s law and Fick’s law were similar in mathematical form the
analogy was used to find the mass transfer coefficient. Nusselt and Prandtl numbers
were replaced by the Sherwood number (Sh) and the Schmidt number (Sc),
respectively, as in the following relationships:
33.05.0m Re332.0h
ScD
LSh
va
3-15

Chapter 3: Single Phase Model for Convection Drying 33
33.08.0m Re0296.0h
ScD
LSh
va
. 3-16
Here vaD is the binary diffusivity of vapour and air (m2/s).
The values of Re, Sc and Pr were calculated by
𝑅𝑒 =𝜌𝑎𝑣𝐿
𝜇𝑎,
3-17
𝑆𝑐 =𝜇𝑎
𝜌𝑎𝐷𝑣𝑎,
3-18
and 𝑃𝑟 =𝐶𝑝𝜇𝑎
𝑘𝑎,
3-19
respectively. Here, 𝜌𝑎 is density of air (𝑘𝑔
𝑚3), 𝜇𝑎 is dynamic viscosity of air(𝑃𝑎. 𝑠), 𝑣
is drying air velocity (m/s), 𝑘𝑎 is thermal conductivity of air (𝑊
𝑚𝐾).
3.4 SIMULATION METHODOLOGY
Simulation was performed by using COMSOL Multyphysics, a finite element
based engineering simulation software rpogram. The software facilitated all steps in
the modelling process, including defining geometry, meshing, specifying physics,
solving, and then visualising the results. COMSOL multiphysics can handle the
variable properties, which are a function of the independent variables. Therefore, this
software was very useful in drying simulation where material properties changed
with temperature and moisture content. The simulation methodology and
implementation strategy followed in this project is shown in
Figure 3-2. Banana was taken as a sample for this study.
Figure 3-2. Simulation strategy in COMSOL multiphysics

34 Chapter 3: Single Phase Model for Convection Drying
3.5 DRYING EXPERIMENTS
Drying tests were performed based on the American Society of Agricultural
and Biological Engineers (ASABE S448.1) Standard. The procedures for ASABE
standard are as follows:
Tests should be conducted after drying equipment has reached steady-state
conditions. Steady state is achieved when the approaching air stream
temperature variation about the set point is less than or equal to 10C.
The sample should be clean and representative in particle size. It should be
free from broken, cracked, weathered, and immature particles and other
materials that are not inherently part of the product. The sample should be
a fresh one having its natural moisture content.
The particles in the thin layer should be exposed fully to the airstream.
Air velocity approaching the product should be 0.3 m/s or more.
Nearly continuous recording of the sample mass loss during drying is
required. The corresponding recording of material temperature (surface or
internal) is optional but preferred.
The experiment should continue until the moisture ratio, MR, equals 0.05.
Me should be determined experimentally or numerically from established
equations.
A tunnel-type drying chamber was used in this experiment. The dryer was
equipped with a heater, blower fan, and two dampers. The two dampers were used to
facilitate the air recirculation and fresh air intake. Both closed-loop and open-loop
tests were possible by adjusting the dampers. A temperature controller and blower
speed controller was used to maintain constant drying air temperature and air
velocity.
The weight of the sample was measured using a load cell, which was calibrated
using standard weights. Air velocity has a considerable effect on the load cell reading
and different calibration curves were prepared for different flow velocities through
the dryer. The load cell was calibrated after installation in the dryer. The air flow rate
was calculated by measuring the air velocity at the entrance of the dying section. A
calibrated hot wire anemometer measured the air velocity. A T-type thermocouple

Chapter 3: Single Phase Model for Convection Drying 35
and humidity transmitter were used to measure the temperature and relative
humidity. All of the sensors were connected to a data logger to store the information.
For experimental investigation, ripe bananas (Musa acuminate) of
approximately the same size were used for drying. First, the bananas were peeled and
then sliced 4mm thick with a diameter of about 36 mm. Initial moisture content was
about 4.0 kg/kg (db) and the final moisture content was between 0.22 to 0.25 kg/kg
(db); that is, moisture ratio was 0.055 to 0.062. Then the slices were put on trays
made of plastic net. Plastic net was used to reduce conduction heat transfer because
this effect was neglected in the model. The plastic tray was put into the dryer after
reaching a steady state condition. Each run included approximately 600 g of material.
Following each drying test, the sample was heated at 1000C for at least 24 h to obtain
the bone-dry mass.
Uncertainty Analysis
Uncertainty analysis of the experiments was done according to Moffat (1988).
If the result R of an experiment is calculated from a set of independent variables so
that, N321 .,..........,, XXXXRR , then the overall uncertainty can be calculated
using the following expression:
2/1
1
2
i
i
.
N
i
XX
RR
3-20
and the relative uncertainty can be expressed as follows:
2/1
1
2
i
i
..1
N
i
XX
R
RR
Re
.
3-21
Uncertainty analysis of temperature:
The temperature was directly obtained from the calibrated thermocouple and
the accuracy was within the American Society of Heating, Refrigerating and Air
Conditioning Engineers’ recommended range, which is ±0.50C. Therefore, the
uncertainty of the temperature would be
5.0measured TT 3-22

36 Chapter 3: Single Phase Model for Convection Drying
Uncertainty analysis of moisture content:
The dry basis moisture content ratio of the weight of moisture, mW , to that of
bone-dry weight, dW , of the sample was calculated from the following equation:
d
d
d
m
W
WW
W
WM
3-23
Therefore,
2
d
d
d
d
d
...
W
WW
W
WW
W
MW
W
MM
3-24
and dd
d
d .
.
WWW
WW
WW
W
M
M
. 3-25
Now the relative uncertainty associated with the measurement of moisture
content of sample can be expressed as:
2/12
dd
d
2
d
m.
.
WWW
WW
WW
We
3-26
The present work considers the following value of the banana sample to be
dried in the drying chamber: gW 600 and gW 120d . Because these two values
are obtained using the same load cell, and as per manufacturer’s specification, the
percentage error of the load cell is %1.0 ; therefore, 0001.0d WW .
Substituting all the values in equation 3-26, the relative uncertainty for moisture
content, me , is obtained, and the value is found to be %06.1 .
3.6 RESULTS AND DISCUSSION
Validation of the model was done by comparing the moisture and temperature
evolutions obtained from experiment and simulation. Figure 3-3 represents a
comparison of the moisture evolutions obtained by experiments and models
considering three different effective diffusivities for drying air temperature 600C and
air velocity of 0.7m/s. Results show that simulated moisture content with temperature
dependent diffusivity closely agreed with the experimental moisture data in the initial
stage of the drying process. On the other hand, the shrinkage dependent diffusivity
model exhibited a faster drying rate in the initial stage but followed experimental
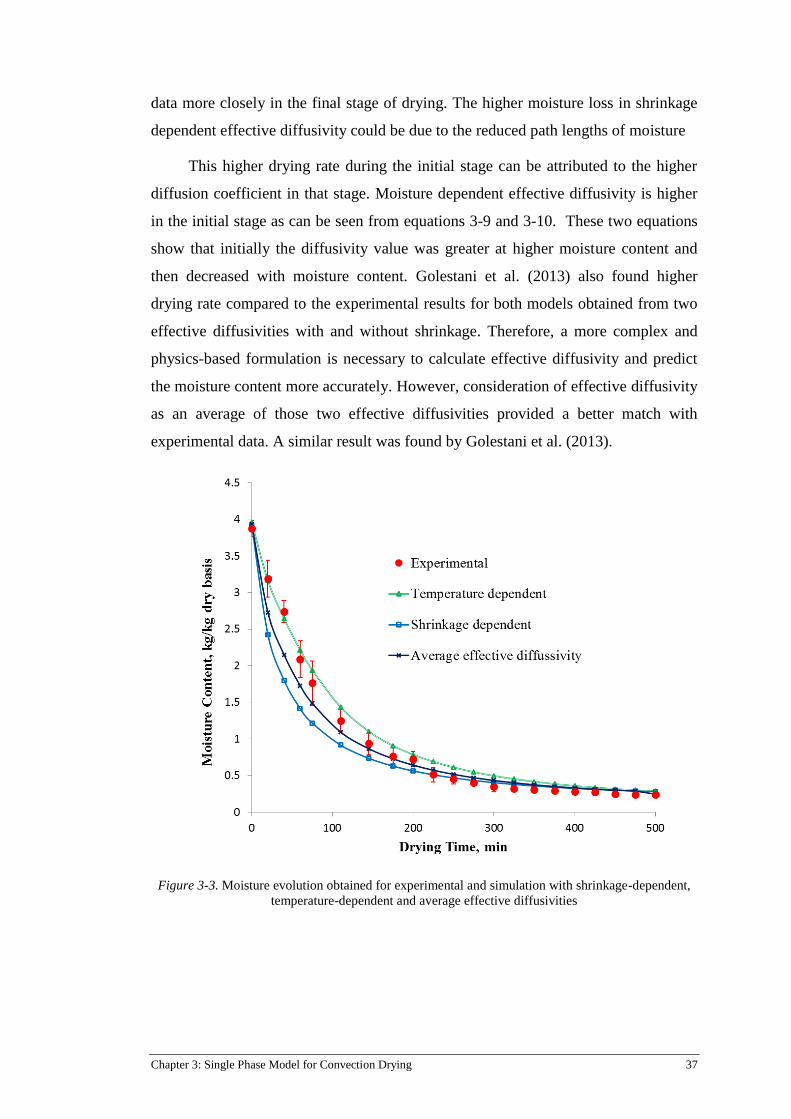
Chapter 3: Single Phase Model for Convection Drying 37
data more closely in the final stage of drying. The higher moisture loss in shrinkage
dependent effective diffusivity could be due to the reduced path lengths of moisture
This higher drying rate during the initial stage can be attributed to the higher
diffusion coefficient in that stage. Moisture dependent effective diffusivity is higher
in the initial stage as can be seen from equations 3-9 and 3-10. These two equations
show that initially the diffusivity value was greater at higher moisture content and
then decreased with moisture content. Golestani et al. (2013) also found higher
drying rate compared to the experimental results for both models obtained from two
effective diffusivities with and without shrinkage. Therefore, a more complex and
physics-based formulation is necessary to calculate effective diffusivity and predict
the moisture content more accurately. However, consideration of effective diffusivity
as an average of those two effective diffusivities provided a better match with
experimental data. A similar result was found by Golestani et al. (2013).
Figure 3-3. Moisture evolution obtained for experimental and simulation with shrinkage-dependent,
temperature-dependent and average effective diffusivities
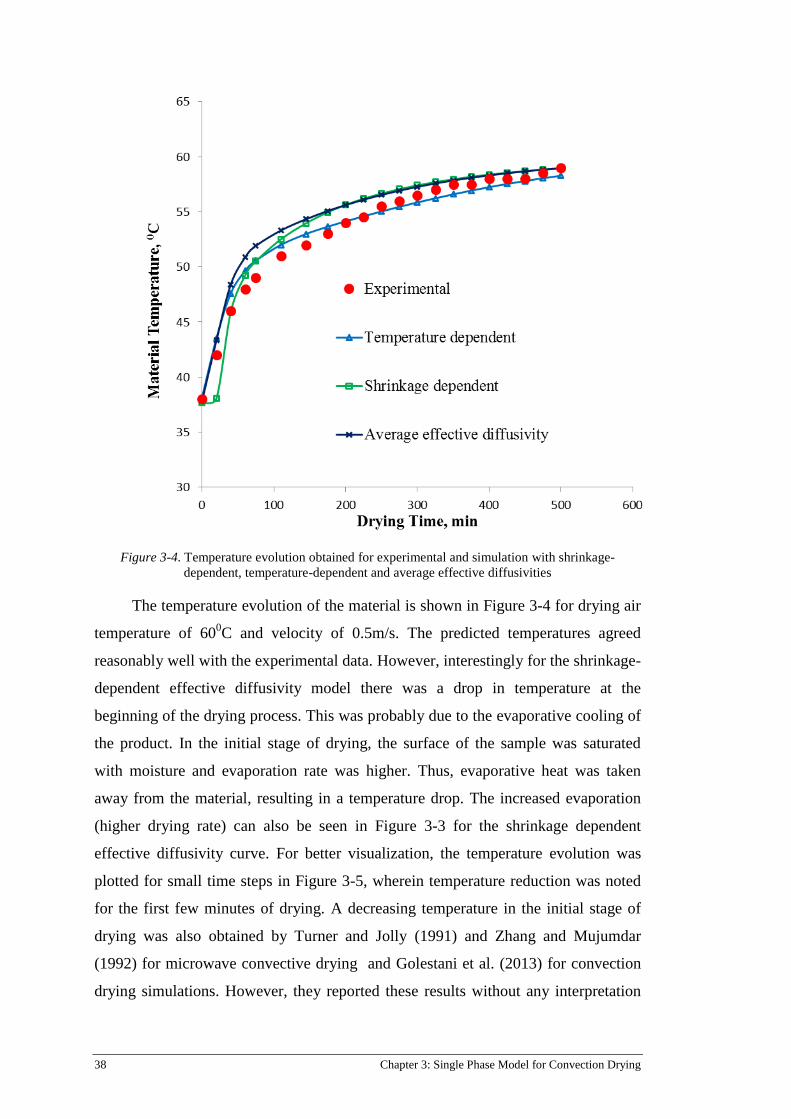
38 Chapter 3: Single Phase Model for Convection Drying
Figure 3-4. Temperature evolution obtained for experimental and simulation with shrinkage-
dependent, temperature-dependent and average effective diffusivities
The temperature evolution of the material is shown in Figure 3-4 for drying air
temperature of 600C and velocity of 0.5m/s. The predicted temperatures agreed
reasonably well with the experimental data. However, interestingly for the shrinkage-
dependent effective diffusivity model there was a drop in temperature at the
beginning of the drying process. This was probably due to the evaporative cooling of
the product. In the initial stage of drying, the surface of the sample was saturated
with moisture and evaporation rate was higher. Thus, evaporative heat was taken
away from the material, resulting in a temperature drop. The increased evaporation
(higher drying rate) can also be seen in Figure 3-3 for the shrinkage dependent
effective diffusivity curve. For better visualization, the temperature evolution was
plotted for small time steps in Figure 3-5, wherein temperature reduction was noted
for the first few minutes of drying. A decreasing temperature in the initial stage of
drying was also obtained by Turner and Jolly (1991) and Zhang and Mujumdar
(1992) for microwave convective drying and Golestani et al. (2013) for convection
drying simulations. However, they reported these results without any interpretation

Chapter 3: Single Phase Model for Convection Drying 39
for this event. To investigate this observation further, the inward heat flux, outward
heat flux, and total heat flux were plotted in a single graph as shown in Figure 3-6.
The inward heat flux was due to convection (from air to material) and outward heat
flux was due to evaporation (from material to air). Figure 3-6 shows that for the first
15 minutes of drying the total heat flux was negative due to evaporation, which
caused a temperature drop in the product. This phenomenon is important in food
drying where an increase in temperature can cause quality degradation. If this
mechanism of cooling could be sustained longer, then the quality of dried food may
be improved. Sometimes intermittent drying can be executed to get more
evaporation when drying resumes after each tempering period. More experimentation
with continuous temperature measurement should be undertaken to further validate
this phenomenon.
Figure 3-5. Temperature curve for shrinkage dependent diffusivity

40 Chapter 3: Single Phase Model for Convection Drying
Figure 3-6. Evolution of inward (convective), outward (evaporative) and total
(convective+evaporative) heat flux
As outlined above, temperature and moisture distribution in the food at any
instance is important because spoilage can start from the higher moisture content
region. Sometimes the centre may have higher moisture content though the surface is
already dried. Consequently, investigating the temperate and moisture distribution is
critical in the case of food drying. The modelling and simulation study was helpful in
this regard, because it was difficult to measure the moisture distribution
experimentally. Figure 3-7 shows three dimensional temperature and moisture
distribution after 400 minutes of drying for drying air temperature 600C and air
velocity of 0.7m/s. It is interesting that, although the surface moisture content
ultimately became 0.2 kg/kg (db), the centre contained 0.6 kg/kg (db) moisture
(Figure 3-7a). Similar moisture profiles were obtained by Perussello et al. (2014).
Though, the drying process may appear to be visually complete, spoilage or
microbial growth could still initiate from the moist central region. Therefore, the
difficulty in removing moisture from the product centre is a major disadvantage of
convective drying.

Chapter 3: Single Phase Model for Convection Drying 41
In regard to temperature distribution, Figure 3-7b indicated that the
temperature gradient was not significant inside the material because the thickness of
the material was very small in the simulation.
Figure 3-7. (a) Moisture and (b) temperature distribution in the food after 400 minutes of drying
Parametric study
Parametric study was important in order to examine the effect of various
process parameters on drying kinetics. After the validation of the model, a parametric
analysis was conducted in COMSOL Multiphysics. Figure 3-8 illustrates the effect of
drying air temperature on drying curve at constant air velocity of 0.7m/s. It is clear
from Figure 3-8 that the increase in drying air temperature greatly increased the
drying rate. For example, it took 500, 300 and 200 minutes to reach a moisture
content value of 0.75kg/kg (db) at drying air temperature of 40, 50 and 600C,
respectively. However, the elevated drying air temperature can decrease the product
quality (e.g. nutrients). Therefore, the drying process has to be optimized and product
quality should be investigated along with drying kinetics.

42 Chapter 3: Single Phase Model for Convection Drying
Figure 3-8. Moisture content for different air temperature for velocity 0.7m/s
Figure 3-9 shows the drying curve for different air velocities at drying air
temperature 600C. It is evident that increasing the drying air velocity increased the
drying rate but the effect was not as significant as the effect of temperature. This is
because, in convective drying, drying is dominated by internal diffusion. Because the
drying rate is very high in the beginning, no constant drying rate period is evident.
The surface becomes dry quickly and the increasing velocity has not affected the
evaporation because sufficient moisture has not accumulated on the surface.
Therefore, the velocity increase has no effect on the drying rate. These finding
conforms with the drying rate curves presented by Karim and Hawlader (2005a)
showing that the drying rate is significantly different for temperature difference
whereas it is almost same for velocity changes.
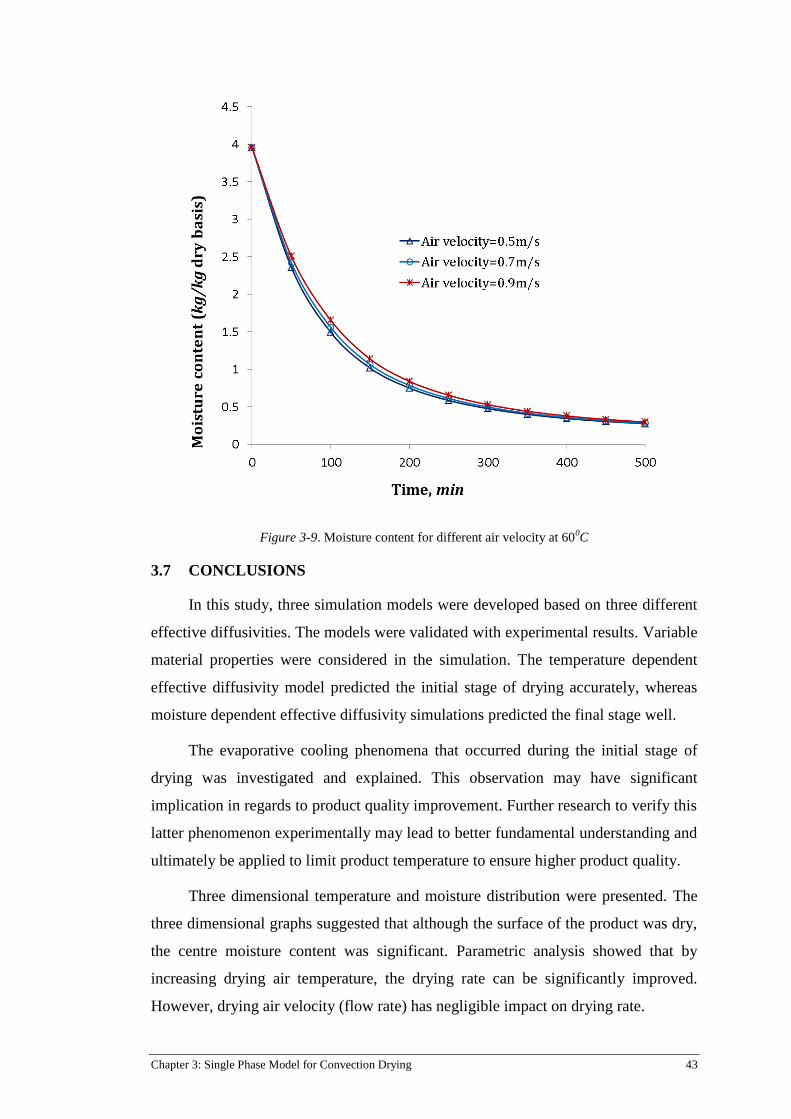
Chapter 3: Single Phase Model for Convection Drying 43
Figure 3-9. Moisture content for different air velocity at 600C
3.7 CONCLUSIONS
In this study, three simulation models were developed based on three different
effective diffusivities. The models were validated with experimental results. Variable
material properties were considered in the simulation. The temperature dependent
effective diffusivity model predicted the initial stage of drying accurately, whereas
moisture dependent effective diffusivity simulations predicted the final stage well.
The evaporative cooling phenomena that occurred during the initial stage of
drying was investigated and explained. This observation may have significant
implication in regards to product quality improvement. Further research to verify this
latter phenomenon experimentally may lead to better fundamental understanding and
ultimately be applied to limit product temperature to ensure higher product quality.
Three dimensional temperature and moisture distribution were presented. The
three dimensional graphs suggested that although the surface of the product was dry,
the centre moisture content was significant. Parametric analysis showed that by
increasing drying air temperature, the drying rate can be significantly improved.
However, drying air velocity (flow rate) has negligible impact on drying rate.

44 Chapter 3: Single Phase Model for Convection Drying
3.8 ACKNOWLEDGEMENTS
The authors acknowledge the contribution of Dr Zakaria Amin and M.U.H.
Joardder for their support in checking the manuscript.
3.9 FUNDING
The author acknowledges the financial support from International Postgraduate
Research Award (IPRS) and Australian Postgraduate Award (APA) to carry out this
research.

Chapter 4: Single Phase Model for IMCD Using Lambert’s Law 45
Single Phase Model for IMCD Chapter 4:
Using Lambert’s Law
This chapter aims to develop an IMCD model considering single-phase mass
transport. The model uses Lamberts Law for microwave power absorption and the
transport model from the previous Chapter.
The chapter feature the following publication:
C. Kumar, M. U. H. Joardder, T.W. Farrell, G.J. Millar and M. A. Karim
(2015) Modelling of Intermittent Microwave Convective Drying (IMCD)
of Apple. Drying Technology, (To be submitted).
The signed statement of contribution page is inserted below:

46 Chapter 4: Single Phase Model for IMCD Using Lambert’s Law
4.1 ABSTRACT
Intermittent microwave convective drying (IMCD) is an advanced technology
which improves both energy efficiency and food quality in drying. Modelling of
IMCD is essential in order to optimize the microwave power level and intermittency
during the process. However, there is still lack of modelling studies dedicated to
IMCD. In this study, a mathematical model for IMCD is developed and validated
with experimental data. The microwave power absorption is calculated and other
inputs parameters for microwave modelling are presented in this study. The model
developed for the full drying period and the challenges in developing the model are
discussed.
4.2 INTRODUCTION
Currently, 1.3 billion tonnes of foodstuffs are lost annually due to a lack of
proper processing and preservation (Gustavsson et al., 2011). Drying is a method of
removing moisture for the purpose of preserving food from microbial spoilage.
Conventional convective drying is a very lengthy and energy intensive process
(Karim & Hawlader, 2005b). Higher drying temperatures reduce the drying times,
however under such conditions food quality and nutritional value is reduced and
higher temperatures require higher energy usage. To overcome these problems,
convective drying is combined with microwave drying. Microwaves interact with
water molecules inside the food and heats up samples volumetrically thus increases
the moisture diffusion rate which can significantly reduce the drying time and
improve energy efficiency (Kumar et al., 2014). There is a problem, however, with
the continuous application of microwaves in the drying process as this can result in
high product temperatures and uneven heating (Kumar et al., 2014). As noted above,
high drying temperatures can cause quality degradation in heat sensitive materials
such as fruits and vegetables (Joardder, Karim, et al., 2013; Joardder, Karim, et al.,
2014). This can be overcome by applying microwave power intermittently. Research
has shown that intermittent microwave convective drying increases both energy
efficiency and product quality (Kumar et al., 2014).
The main advantages of interment microwave assisted drying are: (1)
Volumetric heating: Microwave energy interacts with water molecules within the
food leading to volumetric heating and increased moisture diffusion rates heats up

Chapter 4: Single Phase Model for IMCD Using Lambert’s Law 47
volumetrically and pumps moisture to surface (I. W. Turner et al., 1998). This can
thereby significantly reduce drying times (Mujumdar, 2004; M. Zhang et al., 2006);
(2) Quality improvement: The quality of the dried product can be improved by
combining intermittent microwave heating with other drying (Dev et al., 2011); (3)
Controlled heating: The fidelity of heating can be controlled using microwave energy
as it can be applied in a pulsed manner (Gunasekaran, 1999).
Soysal et al.(2009b) investigated intermittent microwave-convective drying
(IMCD), and the results were compared with continuous microwave-convective
drying (CMCD) and traditional convective drying for oregano. They observed that
the IMCD was 4.7–11.2 times more energy efficient when compared to convective
drying. Furthermore, the drying time of the convective drying was about 4.7–17.3
times longer when compared with the IMCD drying. Ahrné et al. (2007) compared
CMCD and IMCD for banana as a heat sensitive food product. They reported drying
at variable microwave power as a more suitable drying process. They report that
IMCD produces better outcomes in that it reduced the charring of the product. Esturk
(2012) studied IMCD of sage leaves and compared the result with convective air-
drying and CMCD. Although CMCD provided the fastest drying rate, it yielded the
lowest quality (in terms of oil content). Esturk (2012) also noted that in IMCD, the
intermittency and the microwave power level significantly impacted the energy
consumption and the quality of dried product (Esturk, 2012). Therefore, the
microwave power level and pulse ratio should be carefully chosen to achieve the best
outcomes.
Mathematical modelling can help us to understand the heat and mass transfer
involved in IMCD and thereby be used to determine the optimum pulse ratio and
power levels for drying (Kumar et al., 2014). Previously mentioned work related to
IMCD has only been limited to experimental analysis. To date, relatively few studies
have presented theoretical models of the IMCD of food.
Recently, Bhattacharya et al. (2013) and Esturk (2012) have developed purely
empirical model for CMCD (not IMCD) of oyster mushroom (pleurotus ostreatus)
and sage respectively. However, these empirical models do not provide physical
insight into the process and are only applicable to a specific experimental range
(Kumar et al., 2012a; Perussello et al., 2014). Some diffusion-based single phase
models exist for CMCD (J. R. Arballo et al., 2012; Mohamed Hemis et al., 2012),

48 Chapter 4: Single Phase Model for IMCD Using Lambert’s Law
however, none of them considered intermittency of the microwave energy applied.
For this reason, they cannot be applied to IMCD, and are not capable of investigating
the temperature redistribution due to intermittency. However, there are some
simulation models considering intermittency of microwave power (Gunasekaran,
1999; Gunasekaran & Yang, 2007a, 2007b; Yang & Gunasekaran, 2004); mass
transfer was neglected in those models.
Some models of intermittent heating use constant dielectric properties (Yang &
Gunasekaran, 2001). However, dielectric properties vary with moisture content, in
particular, for fruits and vegetables because they contain large amount of moisture.
Moisture content has a significant effect on dielectric properties of fruits and
vegetables (H Feng et al., 2002). Therefore, constant dielectric properties cannot be
considered in case of drying of fruits and vegetables.
Taken together, it can be concluded that, although extensive research has been
carried out on microwave convective heating, there is very limited study dealing with
modelling the IMCD of food which considers the whole drying period, as well as
variable material properties. Furthermore, the temperature redistribution due to
intermittency of the microwave, which is crucial in IMCD for quality improvement,
is not properly investigated.
In the current study, we present a model of IMCD of food that accounts for
intermittency of the microwave power, variable thermos-physical and dielectric
properties of the material. COMSOL Multiphysics 4.4, a finite element based
engineering simulation software, is used to model coupled heat and mass transfer
model equations. The outcomes of the model are presented and discussed and they
are validated with experimental data.
4.3 MATHEMATICAL MODELLING
We consider a 2D axisymmetric geometry of a cylindrical slice apple presented
in Figure 4-1. The following assumptions are applied when developing the
mathematical model:
A homogeneous domain having a single temperature are considered;
The initial temperature and moisture distribution within the slice are
uniform;

Chapter 4: Single Phase Model for IMCD Using Lambert’s Law 49
The thermo-physical and dielectric properties vary with moisture content
of the sample;
Only single-phase water is present in the domain. This characterizes the
moisture concentration of the apple. Furthermore, moisture is transported
by diffusion towards the surface.
Figure 4-1. 3D apple slice and 2D an axisymmetric domain showing symmetry boundary and transfer
boundary (arrow)
Governing equations 4.3.1
Heat transfer:
The energy balance is characterized by a Fourier flux and such that a heat
generation term due to microwave heating, micQ (W/m3).
)()( tfQTkt
Tc micp
4-1
where, T is the temperature (0K), is the density of sample (kg/m
3), pc is the specific
heat (J/kg/K), f(t) is an intermittency function discussed in section 4.5, and k is the
thermal conductivity (W/m/K). This heat generation, micQ (W/m3), is calculated using
Lamberts Law (Abbasi Souraki & Mowla, 2008; J. R. Arballo et al., 2012; Mohamed
Hemis et al., 2012; Mihoubi & Bellagi, 2009) as discussed in section 4.3.3.
Mass transfer:
We assume that the mass flux of moisture is due to Fickian diffusion; therefore,
0
c-D
t
ceff
4-2

50 Chapter 4: Single Phase Model for IMCD Using Lambert’s Law
where, c is the moisture concentration (mol/m3), effD is the effective diffusion
coefficient (m2/s) discussed further in section 4.3.4.
Initial and boundary conditions 4.3.2
The initial conditions for heat and mass transfer are given by,
CT t
0
)0( 20 , 4-3
and 0)0( cc tw , 4-4
respectively. Here 0c is the initial moisture concentration of the apple (mol/m3).
The boundary conditions for the heat and mass transfer equations at the
transport boundaries (as shown in Figure 4-1) are given by,
fg
airveqv
mairT hRT
-pphTThTk
,)()( , 4-5
and
RT
-pphc-D airveqv
meff
, , 4-6
respectively. Here, Th is the heat transfer coefficient (W/m2/K) and airT is the drying
air temperature (0C), airvp , vapour pressure of ambient air (Pa), eqvp , is the
equilibrium vapour pressure (Pa), fgh is the latent heat of evaporation (J/kg) , R is
the universal gas constant (J/mol/K), and mh is the mass transfer coefficient (m/s).
The boundary condition for heat and mass transfer of the symmetry boundary
(as shown in Figure 4-1) are given by
0)( Tk , 4-7
and 0c-Deff . 4-8
Modelling of microwave power absorption using Lamberts Law 4.3.3
Budd & Hill (2011) compared power absorption modelled by Lamberts Law
and Maxwell’s equation and showed that for thicker material the power absorption
according to both approaches is similar.
Many researchers used Lamberts Law for microwave energy distribution in
food products during drying (Abbasi Souraki & Mowla, 2008; J. R. Arballo et al.,

Chapter 4: Single Phase Model for IMCD Using Lambert’s Law 51
2012; Mohamed Hemis et al., 2012; Khraisheh et al., 1997; Mihoubi & Bellagi,
2009; Salagnac et al., 2004; Zhou et al., 1995). Therefore, in this study, Lamberts
Law has been used to calculate microwave energy absorption inside the food
samples. It considers exponential attenuation of microwave absorption within the
product, namely,
h-zα-
mic=PP 2
0 exp . 4-9
Here, 𝑃0 the incident power at the surface (W), α is he attenuation constant
(1/m), and h is the thickness of the sample (m) and (h-z) represents the distance from
surface (m). The measurement of 0P via experiments is presented in section 0.
The attenuation constant, α is given by
2
1'
''1
'2
2
, 4-10
where is the wavelength of microwave in free space ( cm24.12 at 2450MHz
and air temperature 200C) and ε' and ε" are the dielectric constant and dielectric loss,
respectively.
The volumetric heat generation, micQ (W/m3) in equation 4-1 is then calculated
by:
V
PQ mic
mic , 4-11
where, V is the volume of apple sample (m3).
Input parameters 4.3.4
The input parameters of the model are listed in Table 4-1 and some of these
values are further discussed in this section.

52 Chapter 4: Single Phase Model for IMCD Using Lambert’s Law
Table 4-1. Input properties of the model
Parameters Value[Unit] Reference
Initial moisture content (db), 0M 6.14[kg/kg] This work
Initial temperature, iT 20[°C] This work
Molecular weight of water, wM 18[g/mol] (Çengel & Boles, 2006)
Latent heat of evaporation, fgh 2358600[J/kg] (Çengel & Boles, 2006)
Drying air temperature, airT 60°C This work
Vapour pressure of ambient air, airvp 2.7[kPa] Calculated
Diameter of the sample 40[mm] This work
Thickness of the sample 10[mm] This work
Reference diffusivity, refD 3.24e-9 [m2/s] Calculated
Heat transfer coefficient, Th 16.746 [W/(m2·K)] (Kumar et al., 2015)
Mass transfer coefficient, mh 0.067904 [m/s] (Kumar et al., 2015)
Microwave incident power absorption
The incident power at the surface, 0P , can be determined by calculating the heat
absorbed by distilled water of same volume with the sample placed in microwave
oven (Chandrasekaran et al., 2012; Mohamed Hemis et al., 2012; Lin et al.,
1995).This is one of the most difficult aspects of microwave heating (Ashim, 2001).
Arballo et al. (2012) determined 0P via the application of the formula,
t
TCmP pww
0 ,
4-12
where, wm is the mass of water (kg), pwC is he specific heat of water (J/kg/K), T is
the temperature rise of water (0C) and T is the heating time (s).
A major drawback of equation (4-12) is that it does not account for the
evaporation heat loss. The evaporation of water is not negligible at higher microwave
power. This evaporative heat loss was also taken into account in some studies
(Abbasi Souraki & Mowla, 2008). Then the absorbed power considering evaporative
heat loss can be calculated by
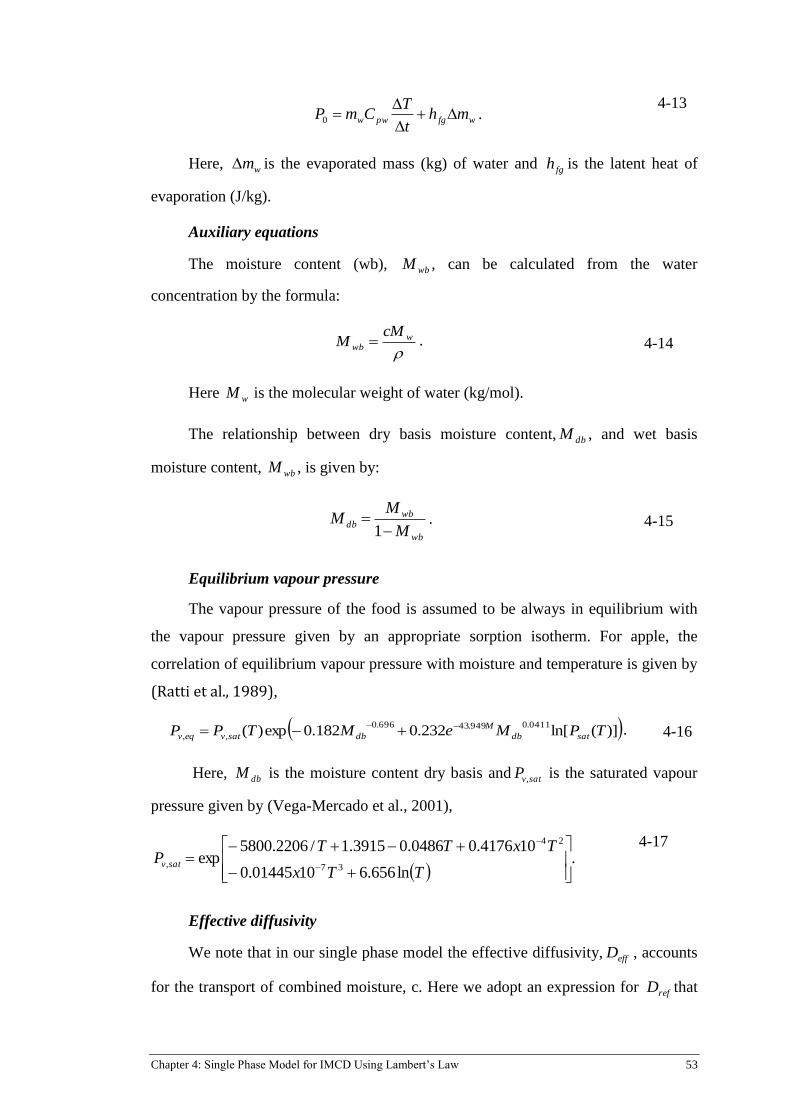
Chapter 4: Single Phase Model for IMCD Using Lambert’s Law 53
wfgpww mht
TCmP
0 .
4-13
Here, wm is the evaporated mass (kg) of water and fgh is the latent heat of
evaporation (J/kg).
Auxiliary equations
The moisture content (wb), wbM , can be calculated from the water
concentration by the formula:
w
wb
cMM . 4-14
Here wM is the molecular weight of water (kg/mol).
The relationship between dry basis moisture content, dbM , and wet basis
moisture content, wbM , is given by:
wb
wbdb
M
MM
1. 4-15
Equilibrium vapour pressure
The vapour pressure of the food is assumed to be always in equilibrium with
the vapour pressure given by an appropriate sorption isotherm. For apple, the
correlation of equilibrium vapour pressure with moisture and temperature is given by
(Ratti et al., 1989),
)](ln[232.0182.0exp)(0411.0949.43696.0
,, TPMeMTPP satdb
M
dbsatveqv
. 4-16
Here, dbM is the moisture content dry basis and satvP , is the saturated vapour
pressure given by (Vega-Mercado et al., 2001),
.
ln656.61001445.0
104176.00486.03915.1/2206.5800exp
37
24
,
TTx
TxTTP satv
4-17
Effective diffusivity
We note that in our single phase model the effective diffusivity, effD , accounts
for the transport of combined moisture, c. Here we adopt an expression for refD that

54 Chapter 4: Single Phase Model for IMCD Using Lambert’s Law
was developed in the previous work (Kumar et al., 2015) that is a function of both
temperature and moisture, namely,
2
2
00
b
bDeD
D
refRT
E
eff
a
. 4-18
Here refD is reference diffusivity (m2/s), aE is activation energy of diffusion of
water (J/mol), b is the half thickness of the material (m), b0 is the initial thickness
(m), and D0 is a integration constant and is usually referred to as a frequency factor
when discussing Arrhenius equation (m2/sec). The activation energy was calculated
from the slope of a ln( refD ) versus (1/T) graph resulting in the values D0 =0.09 and
aE = 50 KJ/mol.
The thickness ratio obtained by the following equation:
00 M
M
b
b
w
wbw 4-19
where w is density of water (kg/m3), is density of sample(kg/m
3), wbM is moisture
content wet basis and 0M is initial moisture content kg/kg (wb).
Thermo-physical properties of apple
Thermal conductivity and specific heat of apple can be expressed as a functions
of moisture content (Sweat, 1974), namely,
wbMk 00493.0148.0 4-20
and wbp Mc 22.34.11000 , 4-21
respectively.
Moreover, the density of apple, 𝜌, during drying changes with moisture
content, wbM . In this study, we measured the density change with moisture content
of apple by a solid displacement method (Joardder et al., 2015; Yan et al., 2008)
using a cylindrical vial and 57 µm glass beads. The relationship between 𝜌 and wbM
determined to be,
94.41501.569 wbM . 4-22

Chapter 4: Single Phase Model for IMCD Using Lambert’s Law 55
Dielectric properties of apple
The dielectric properties of the material are the most important parameters in
microwave heating and drying applications because these properties define how
materials interact with electromagnetic energy (Sosa-Morales et al., 2010). The
evaluation of dielectric properties is critical in modelling and product and process
development (Ikediala et al., 2000). Dielectric properties of a materials define how
much microwave energy will be converted to heat (Chandrasekaran et al., 2013).
Here we use the data of Martín-Esparza et al. (2006) in a quadratic regression
analysis in which the intercept of the ' and versus wbM graph was set to 0.1 in
order to avoid numerical singularity in ' and when wbM is zero. The resulting
quadratic expression are found to be:
1.0289.30638.36'2
wbwb MM 4-23
and 1.0.8150.26543.132
wbwb MM . 4-24
Heat and mass transfer coefficient
The heat and mass transfer coefficients were calculated based on the empirical
relationship discussed in previous paper (Kumar et al., 2015) and found to be Th
=16.746 W/(m2·K) and mh =0.067904 m/s, respectively.
4.4 MATERIALS AND METHODS
Sample preparation
Fresh granny smith apples used for the intermittent microwave drying
experiments were obtained from local supermarkets. The samples were stored at
5±10C to keep them as fresh as possible before they were used in the experiments.
The apples taken from the storage unit were washed and put aside for one hour to
allow their temperature to elevate to room temperature prior to each drying
experiment. The samples were cut to a thickness of 10mm and a diameter of
approximately 40mm. The initial moisture content of the apple slices was
approximately 0.868 kg/kg (wet basis).

56 Chapter 4: Single Phase Model for IMCD Using Lambert’s Law
IMCD and convection drying
The IMCD drying was achieved by heating the sample in microwave for 60s
and then drying for 120s in the convection dryer. The experiments were conducted
with a Panasonic Microwave Oven having inverter technology with cavity dimension
355mm (W) x251mm (H) x365mm (D). The inverter technology enables accurate
and continuous power supply at lower power settings. Whereas, with conventional
oven supply the lower power is achieved by turning the microwave on and off at
maximum power (Panasonic, 2013). The microwave oven is able to supply 10
accurate power levels with a maximum of 1100W at 2.45GHz frequency. The apple
slices were placed in the centre of the microwave cavity, for an even absorption of
microwave energy. The moisture loss was recorded at regular intervals at the end of
power-off times by placing the apple slices on a digital balance (specification: 0.001g
accuracy).
The convection drying was conducted to compare the results with IMCD. For
convection drying, the same samples were placed in household convection dryer and
temperature was set to 600C. The moisture loss was recorded at regular intervals of
10 mins with the digital balance (specification: 0.001g accuracy). All experiments
were done triplicate and standard deviation was calculated.
Thermal imaging
A Flir i7 thermal imaging camera was used to measure the temperature
distribution on the surface. Accurate measurement of temperature by thermal
imaging cameras depend on the emissivity values. The emissivity value for apple
was found in the range between 0.94 and 0.97 (Hellebrand et al., 2001) and set in the
camera before taking images.
Determination of incident power (P0) for Lambert’s Law
The Panasonic inverter microwave oven was used in the experiments to
determine the power absorption. The tests were conducted at three power levels,
namely; 100W, 200W and 300W with a water sample. The volume of water sample
was taken as the same volume of apple to obtain accurate power absorption. Water
was heated for 60s and thermal images were taken by the thermal imaging camera
(Flir i7) before and after heating. The water was properly agitated to measure the

Chapter 4: Single Phase Model for IMCD Using Lambert’s Law 57
average rise of temperature. The absorbed power, 0P , can be calculated by equation
4-13 for various load volume and applied microwave power.
4.5 SIMULATION PROCEDURE
COMSOL Multiphysics, advance software for modelling and simulation, was
used to implement the numerical solution of the model introduced in section 4.3. A
combination of a rectangular function and an analytic function in COMSOL
Multiphysics were used to develop an intermittency function as shown in Figure 4-2.
Then it was multiplied with the heat generation term in the energy equations to
implement intermittency of the microwave heat source.
Figure 4-2. Intermittency function
The Figure 4-3 below shows the flow chart of the simulation procedure. It
shows that the moisture dependent material properties, microwave source term, and
input properties are updated at the beginning of each iteration.

58 Chapter 4: Single Phase Model for IMCD Using Lambert’s Law
Figure 4-3. Flow chart showing the modelling strategy in COMSOL Multiphysics
4.6 RESULTS AND DISCUSSION
Incident power absorption by experiments 4.6.1
The incident power absorbed by the sample calculated for three different power
levels for various loads was calculated by equation 4-13 and then converted to power
absorption ratio defined as the ratio of absorbed power by sample and microwave set
power. Table 4-2 shows the power absorption ratio obtained for microwave set three
different microwave set power, namely, 100W, 200W and 300W.
Table 4-2. Power absorption ratio for microwave power (100W, 200W and 300W) for different
sample volume
Sample
volume (cc)
Power absorption ratio Standard
deviation 100W 200W 300W Average
15 25 25.3 26 25.43333 0.51316
35 38 43 41 40.66667 2.516611
55 59 66 59 61.33333 4.041452
It is interesting to note that the power absorption ratios are same for a certain
volume of sample irrespective of the microwave power. Therefore, the average
power absorption ratios are plotted against the sample volume in Figure 4-4 with the
error bar showing standard deviations.

Chapter 4: Single Phase Model for IMCD Using Lambert’s Law 59
Figure 4-4. Microwave power absorption for different loading volume
The above results correlate well with those of Mudgett (1986) who also
investigated the power absorption ratio and found a similar trend.
Average moisture curve 4.6.2
The comparison of moisture content obtained from experiments and simulation
is shown in the Figure 4-5. A Pearson correlation coefficients, R2, was used to
determine the goodness of fit of the model. We see that a high correlation is obtained
between the model and experimental values with R2=0.997623. This good agreement
between experimental data and model calculations suggests the suitability of the
model to describe the drying kinetics and moisture content obtained during the
IMCD drying process.
To demonstrate the advantage of IMCD drying over convection drying, the
drying curves for both are plotted in Figure 4-5. It was found that, in 75 minutes of
drying, convection drying reduced the moisture content to 3 kg/kg db, whereas by
using IMCD reduced the moisture content to 0.4 kg/kg db.
Thus, IMCD significantly reduces the drying time. To reduce the moisture
content to 0.4 kg/kg db by convection drying took around 300min, which is 4 times
longer than the IMCD with intermittency 60s on and 120s off.
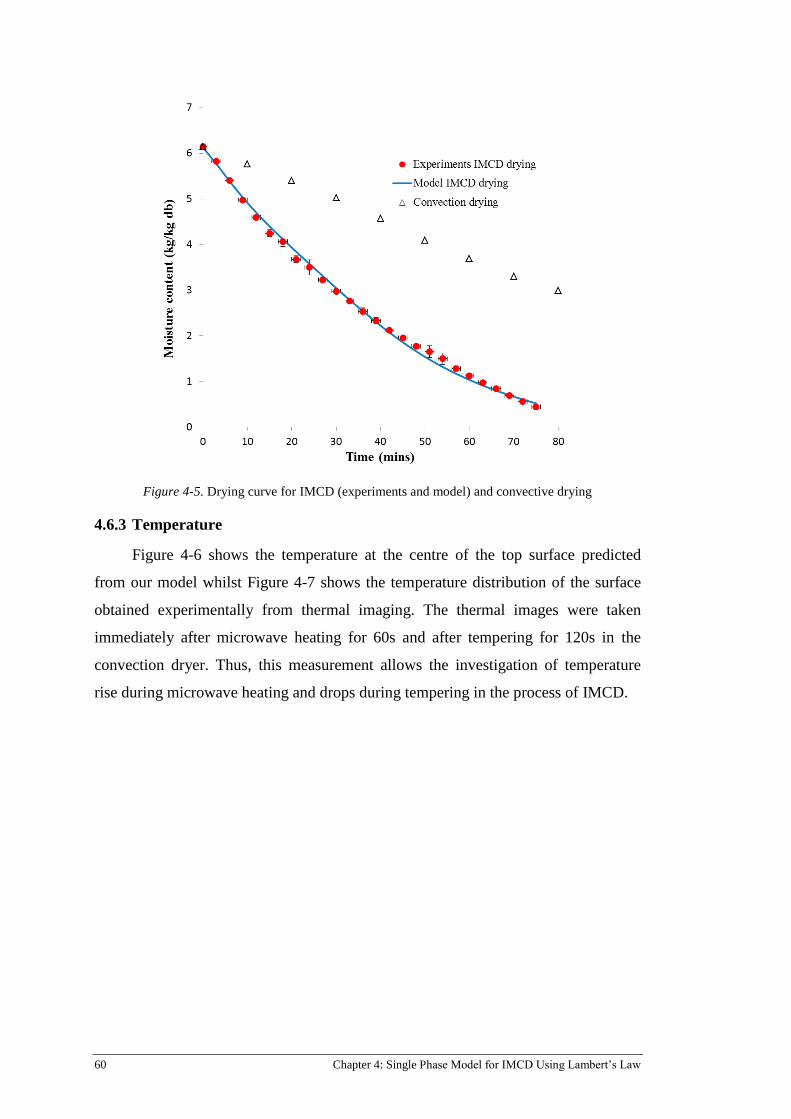
60 Chapter 4: Single Phase Model for IMCD Using Lambert’s Law
Figure 4-5. Drying curve for IMCD (experiments and model) and convective drying
Temperature 4.6.3
Figure 4-6 shows the temperature at the centre of the top surface predicted
from our model whilst Figure 4-7 shows the temperature distribution of the surface
obtained experimentally from thermal imaging. The thermal images were taken
immediately after microwave heating for 60s and after tempering for 120s in the
convection dryer. Thus, this measurement allows the investigation of temperature
rise during microwave heating and drops during tempering in the process of IMCD.
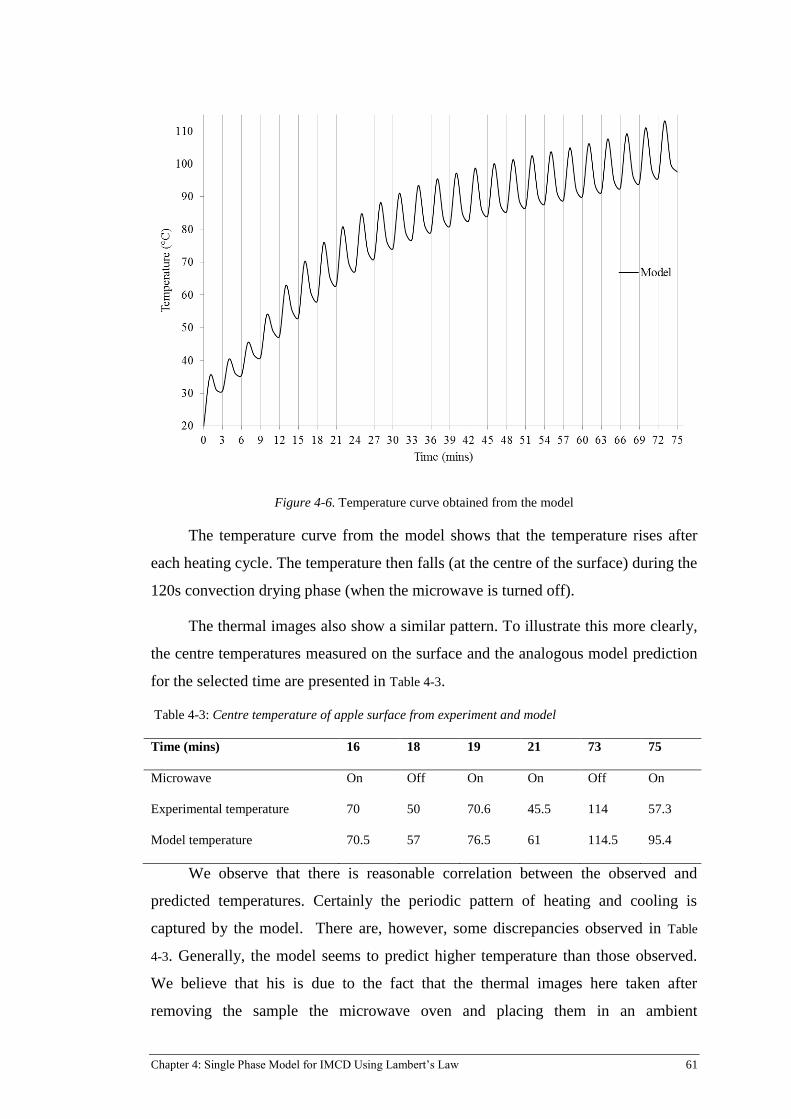
Chapter 4: Single Phase Model for IMCD Using Lambert’s Law 61
Figure 4-6. Temperature curve obtained from the model
The temperature curve from the model shows that the temperature rises after
each heating cycle. The temperature then falls (at the centre of the surface) during the
120s convection drying phase (when the microwave is turned off).
The thermal images also show a similar pattern. To illustrate this more clearly,
the centre temperatures measured on the surface and the analogous model prediction
for the selected time are presented in Table 4-3.
Table 4-3: Centre temperature of apple surface from experiment and model
Time (mins) 16 18 19 21 73 75
Microwave On Off On On Off On
Experimental temperature 70 50 70.6 45.5 114 57.3
Model temperature 70.5 57 76.5 61 114.5 95.4
We observe that there is reasonable correlation between the observed and
predicted temperatures. Certainly the periodic pattern of heating and cooling is
captured by the model. There are, however, some discrepancies observed in Table
4-3. Generally, the model seems to predict higher temperature than those observed.
We believe that his is due to the fact that the thermal images here taken after
removing the sample the microwave oven and placing them in an ambient

62 Chapter 4: Single Phase Model for IMCD Using Lambert’s Law
environment (~200C) for a short time. A further source of discrepancy could be due
to the fact that our single phase diffusion model does not account for the latent heat
losses that are associated with evaporation.
.
Figure 4-7. Thermal images of top surface at selected times
It can be seen from the above figures (Figure 4-6 and Figure 4-7) that the
temperature reaches as high as 114°C at the end of the drying. This is because the
temperature continues to rise after each cycle while it fluctuates. We note that a
similar rise in temperature with cycled microwave heating was found by Rakesh et
al. (2010) and Yang et al. (2001).

Chapter 4: Single Phase Model for IMCD Using Lambert’s Law 63
In light of these findings, it can be said that the temperature of the sample
should be controlled, particularly, at the last stage of drying. Since the higher
temperature may reduce the food quality or even burn the product, the microwave
power should be reduced or the tempering period increased to avoid burning at the
final stage of drying.
Although the above results are taken at a single point in the sample, it is
reasonable to assume that heat energy is being dissipated during tempering via
conduction (at least in part) as opposed to purely convective cooling. This
redistribution of temperature could significantly contribute improving product
quality during IMCD by selecting an optimum tempering time.
Moisture and temperature distribution 4.6.4
Moisture distribution inside the sample is shown in Figure 4-8. We observe
that the moisture content of the surface reduces to nearly zero at about 20mins of
drying, whereas at that time the moisture content at the centre is still at its maximum.
Figure 4-8. Moisture distribution inside the sample
Another observation to note from the figure is that the moisture content is
always higher in the inner part of the sample and decreases as drying progress.
64 Chapter 4: Single Phase Model for IMCD Using Lambert’s Law
These results are consistent with the idea that the surface of the sample dries first and
then the moisture from centre is removed.
Figure 4-9 shows the simulated temperature evolutions at the surface, centre
and 8mm beneath the surface. It shows that the temperature is always higher in the
interior of the apple than the surface, despite the fact that microwave power
absorption is higher at the surface, according to Lamberts Law. This is due to the
internal heating characteristics of the microwave. Although the heating is higher near
the surface, the convection and evaporative cooling reduce the temperature of the
surface. A similar pattern (higher centre temperature) has been observed in the
microwave heating (A.K. Datta, 2002; Rakesh et al., 2010). The temperature
difference between surface and centre increase as drying progress, this is because the
thermal conductivity is considered to be a function of moisture content, and it
decrease with moisture content.
Figure 4-9. Temperature distribution inside the sample
Equilibrium vapour pressure 4.6.5
Equilibrium vapour pressure, eqvP , , is an important parameter for surface
evaporation and thus moisture loss. The equilibrium vapour pressure at the surface as

Chapter 4: Single Phase Model for IMCD Using Lambert’s Law 65
determined from equation 4-16 is plotted in Figure 4-10. We observe that eqvP ,
initially increases rapidly because of increase in temperature and the higher moisture
content. However, when the material becomes drier, near the end of the drying, the
equilibrium vapour pressure decreases. This indicates that initially the moisture loss
is higher and that the drying rate starts to decrease when the equilibrium vapour
pressure starts reducing at about 15 mins. From the moisture distribution curve
(Figure 4-8), it can be seen that the surface moisture content becomes close to zero
after 15 mins of drying, therefore, after that time the vapour pressure did not rise.
However, due to diffusion the vapour pressure is still higher than the ambient vapour
pressure, airvP , , and evaporation occurs.
Figure 4-10. Evolutions of equilibrium vapour pressure at the surface of the sample
Absorbed power distribution 4.6.6
Absorbed power along the depth of the sample at the end of drying is shown in
Figure 4-11. According to Lamberts Law, the power absorbed is the maximum at the
surface and decreases exponentially inside the sample. The absorption at the top
surface is 25 W which was also calculated in Table 4-2 and it decrease to 10W at the

66 Chapter 4: Single Phase Model for IMCD Using Lambert’s Law
bottom of the surface. A similar trend of theoretical power absorption was found by
Budd et al. (2011) and they also showed that the power absorption is higher at the
surface and decays exponentially with depth in the sample. Although microwave
power absorption is higher near surface, the convection and evaporative cooling
leads to a reduction of the temperature of the surface.
Figure 4-11. Absorption of microwave power along the length of the sample at 75mins
4.7 CONCLUSIONS
In this study, a novel model of IMCD has been developed and compared with
experimental data collected from a sample of apple. The predicted moisture content
showed good agreement with experimental data. The IMCD (with microwave 60s on
and 120s off) was four times faster as compared to convection drying. The
intermittency of microwaves in IMCD allows the temperature to re-distribute and
drop, thus, IMCD helps to limit the temperature and can improve product quality.
Unlike convection drying, the temperature at the centre of the sample is higher in
IMCD. The moisture distribution from the model showed that the moisture content is
always higher in the inner part of the sample and decrease as drying progress.
Limitations of the present model have been identified and suggestions for future
improvement in IMCD modelling have been presented.
Acknowledgement:
The author acknowledges the International Postgraduate Research Award
(IPRS) and Australian Postgraduate Award (APA).

Chapter 4: Single Phase Model for IMCD Using Lambert’s Law 67

Chapter 5: Multiphase Model for Convection Drying of Food 68
Multiphase Model for Chapter 5:
Convection Drying of Food
This Chapter presents a multiphase porous media model for convection drying,
which is a more advanced model compared to the single-phase models. The transport
model in this Chapter will be used in the following Chapters (Chapters 6 and 7) to
develop IMCD models.
This Chapter features the following submitted publication:
C. Kumar, M. U. H. Joardder, T.W. Farrell, M. A. Karim, and G.J. Millar
(2015) Non-equilibrium multiphase porous media model for heat and mass
transfer during food drying. International Journal of Multiphase Flow, (To
be submitted).
The signed statement of contribution page is inserted below:

Chapter 5: Multiphase Model for Convection Drying of Food 69
5.1 ABSTRACT
A multiphase porous media model has been developed to predict the transport
of liquid water, vapour, air and energy during the convection drying of food. The
model considered the transport of liquid water by capillary diffusion and gas
pressure, and the transport of vapour with binary diffusion and gas pressure. A non-
equilibrium formulation was used to calculate the evaporation rate, which enabled
the separate illustration of the transport of vapour and liquid water. The equations
were solved by Finite Element Method (FEM) using physics-based modelling and
simulation platform called COMSOL multiphysics. The model predictions were
validated using experimental data and good agreement was found. Spatial
distribution of liquid water and vapour saturation curves showed that the saturation
levels were lower on and near the surface compared to the centre of the food
material. The convective and diffusive fluxes of liquid water and vapour were
presented, and this data suggested that the fluxes were higher on and near the surface
of the sample.
5.2 INTRODUCTION
Modelling of food processing is very complex problem due to issues such as
the intricate physical structure of materials of interest. Many modelling efforts have
been reported in the literature for different food preparation processes such as drying
(Barati & Esfahani, 2011; Diamante et al., 2010; Karim & Hawlader, 2005a, 2005b;
Kumar et al., 2012; Kumar et al., 2015), frying (H. Ni & Datta, 1999), microwave
heating (H. Ni et al., 1999; Rakesh et al., 2010), thawing (Chamchong & Datta,
1999a), baking (J. Zhang et al., 2005), and puffing (Rakesh & Datta, 2013) etc. All
of these models can be classified into two broad categories; empirical models and
theoretical models (Kumar et al., 2014). The empirical or observation based models
can be developed rapidly and are quite effective. However, they do not provide a
physical insight into the process and exhibit limited predictive capability. In contrast,
physics based models are preferred as predictive models not only in food drying but
also in areas outside of the food industry. Among these theoretical approaches,
diffusion based models are very popular because of their simplicity and as such have
been used by many researchers (Chandra Mohan & Talukdar, 2010; Kumar et al.,
2015; Perussello et al., 2014; Perussello et al., 2012). These latter models assume
conductive heat transfer for energy, and diffusive transport for moisture. These

70 Chapter 5: Multiphase Model for Convection Drying of Food
models need diffusivity values which have to be experimentally determined.
Although these latter models can provide a good match with experimental results,
they cannot provide a detailed understanding of other transport mechanisms such as
pressure driven flow. Lumping all the water transport processes as diffusion cannot
be justified under all situations. The drawback of these kind of models has been
discussed in detail in the work of Zhang and Datta (2004).
The next group of models with improved formulation compared to diffusion
models assumes a sharp moving boundary between dry and wet regions. This type of
model has been applied in relation to deep fat frying (Farkas et al., 1996) and are
characterized as analogues to freezing and thawing models of a pure substance
(Mascarenhas et al., 1997). Recently, distributed evaporation models, in contrast to
sharp boundary models, have become popular. Datta (2007a) termed these
distributed evaporation models as mechanistic models because these models
considered heat and mass transfer equations for each phase (solid, liquid, gas plus
vapour) in porous media. Therefore, they are termed multiphase porous media
models. These latter models rigorously study the transition from the individual phase
at the ‘microscopic’ level to representative average volume at the ‘macroscopic’
level (A. K. Datta, 2007b). Furthermore, they are computationally effective and
consequently have been applied to a wide range of food processing applications such
as frying (Bansal et al., 2014; H. Ni & Datta, 1999), microwave heating (Chen et al.,
2014; Rakesh et al., 2010), puffing (Rakesh & Datta, 2013) baking (J. Zhang et al.,
2005), meat cooking (Dhall & Datta, 2011) etc. However, application of these
models to the drying processes has been very limited.
There are some multiphase models which have been applied in: (a) vacuum
drying (Ian W. Turner & Perré, 2004); (b) convection drying (Stanish et al., 1986) of
wood and clay (Chemkhi et al., 2009); (c) microwave spouted bed drying of apples
(H. Feng et al., 2001); and (d) large bagasse stockpiles (Farrell et al., 2012). A
common issue integral to those latter models is the assumption that the vapour and
water phases are in equilibrium. However, equilibrium conditions may only be valid
for lower moisture content of the sample during drying; thus, equilibrium conditions
may never be achieved at the surface since transport rates are relatively high there.
Therefore, a non-equilibrium approach appears to be a more realistic representation
of the physical situation during drying (J. Zhang & Datta, 2004). Using equilibrium
Chapter 5: Multiphase Model for Convection Drying of Food 71
vapour pressure in a drying model is likely to overestimate the drying rate, because
equilibrium may not be achieved instantaneously at the surface due to low moisture
content. Then the non-equilibrium approach for evaporation can be used to express
evaporation, thus allowing the calculation of each phase separately. The equations
resulting from non-equilibrium models provide a better description of the physics
involved and facilitate calculation of evaporation behaviour. Recently, Zhang et al.
(2012) applied a multiphase model to a non-equilibrium formulation for evaporation.
Nevertheless, they only used this latter model for vacuum drying of corn and the
simulation results were not compared with any experimental data. This study was
aimed at development of a multiphase porous media model using non-equilibrium
evaporation rates considering all transport mechanisms such as capillary diffusion,
and pressure driven flow evaporation of all phases (water, vapour, and air). Such a
model can provide an insight into the relative contribution of each transport
mechanism. The objectives of this study were to:
Development of a multiphase porous media model using non-equilibrium
formulations for transport of liquid water, vapour, and energy during
drying of food;
Calculation of spatial and temporal profiles for liquid water, vapour and
temperature;
Comparison of the spatial and temporal profiles for capillary and
convective fluxes of liquid water, and diffusive and convective fluxes for
vapour;
Discussion of the distribution of evaporation rate, vapour pressure,
equilibrium vapour pressure and saturation vapour pressure at the surface
in relation to drying rate.
5.3 MATHEMATICAL MODEL
In this section, the model equations for multiphase porous media are developed
describing heat, mass and momentum transfer within an apple slice (food material)
during convection drying. The equations also represent the transport mechanism,
assumptions and input parameters for the model.
The mathematical formulation developed here was based on the formulations
introduced by Datta (2007a). The model developed in this research considered

72 Chapter 5: Multiphase Model for Convection Drying of Food
transport of liquid water, vapour, and air inside food materials. The mass and energy
conservation equations included convection, diffusion, and evaporation. The non-
equilibrium formulation for evaporation has been used to describe the evaporation,
which allows implementation of the model in commercial software. Momentum
conservation was developed from Darcy’s equations. Evaporation was considered as
being distributed throughout the domain and a non-equilibrium evaporation
formulation was used for evaporation condensation-condensation phenomena.
Problem description and assumptions 5.3.1
A schematic of the problem is presented in Figure 5-1. A 2-D axisymmetic
geometry of a 3-D apple slice was considered for simulation. Heat and mass transfer
took place at all boundaries except the symmetry boundary. The apple slice was
considered as a porous medium and the pores were filled with three transportable
phases, namely liquid water, air and water vapour as shown in Figure 5-1.
Figure 5-1. Schematic showing 3D sample, 2D axisymmetric domain and Representative Elementary
Volume (REV) with the transport mechanism of different phases
All phases (solid, liquid, and gases) were continuous and local thermal
equilibrium is valid, which means that the temperatures in all three phases are equal.

Chapter 5: Multiphase Model for Convection Drying of Food 73
Liquid water transport occurred due to convective flow resulting from gas pressure
gradient, capillary flow and evaporation. Vapour and air transport arose from gas
pressure gradients and binary diffusion.
Governing equations 5.3.2
The mathematical model consisted of conservation equations for all
transportable phases and transport mechanisms discussed above.
Mass balance equations 5.3.3
The representative elementary volume V (m3) is the sum of the volume of
three phases, namely, gas, water, and solid, namely,
swg VVVV . 5-1
where, gV is the volume of gas (m3), wV is the volume of water (m
3), and sV was
the volume of solid (m3).
The apparent porosity, , is defined as the volume fraction occupied by gas and
water. Thus,
V
VV wg
. 5-2
The water, wS , and gas, gS , Saturation are defined as the fraction of pore
volume occupied by that particular phase, namely,
V
V
VV
VS w
gw
ww
, 5-3
and w
g
gw
g
g SV
V
VV
VS
1
, 5-4
respectively.
The mass concentrations of water, wc (kg/m3), vapour, vc (kg/m
3),and air , ac
(kg/m3), are given by,
www Sc , 5-5
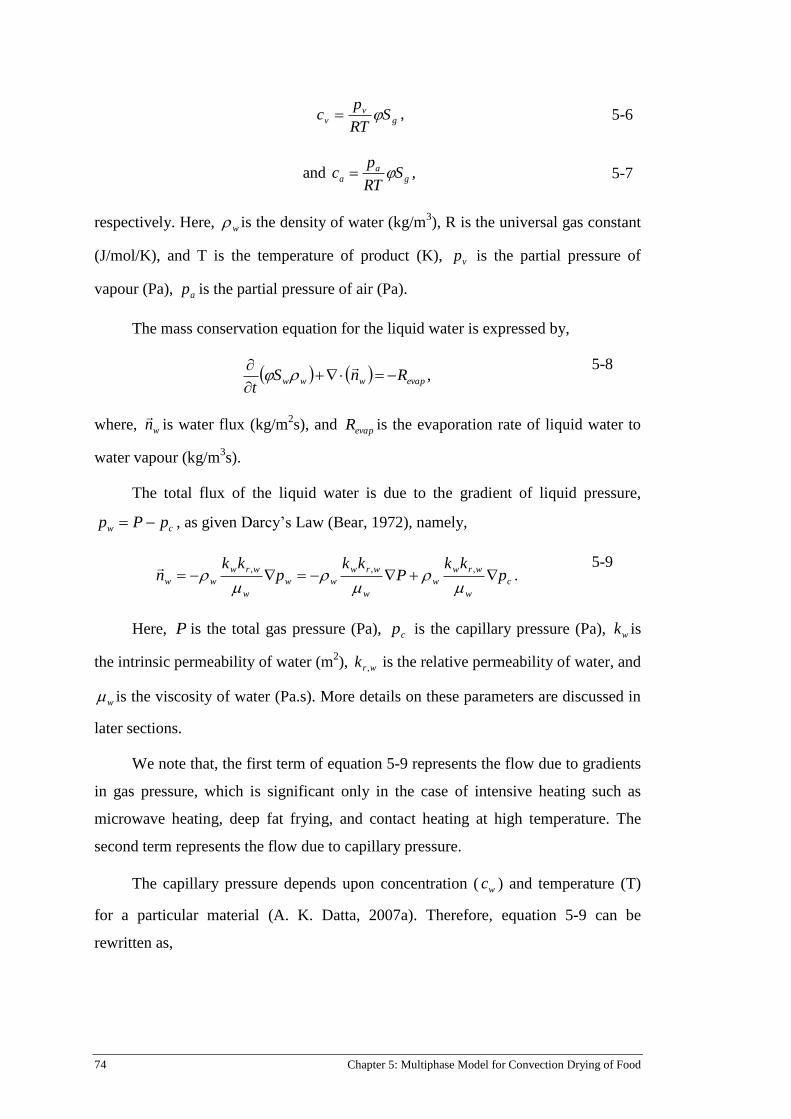
74 Chapter 5: Multiphase Model for Convection Drying of Food
gv
v SRT
pc , 5-6
and ga
a SRT
pc , 5-7
respectively. Here, w is the density of water (kg/m3), R is the universal gas constant
(J/mol/K), and T is the temperature of product (K), vp is the partial pressure of
vapour (Pa), ap is the partial pressure of air (Pa).
The mass conservation equation for the liquid water is expressed by,
evapwww RnSt
,
5-8
where, wn
is water flux (kg/m2s), and evapR is the evaporation rate of liquid water to
water vapour (kg/m3s).
The total flux of the liquid water is due to the gradient of liquid pressure,
cw pPp , as given Darcy’s Law (Bear, 1972), namely,
c
w
wrw
w
w
wrw
ww
w
wrw
ww pkk
Pkk
pkk
n
,,,
. 5-9
Here, P is the total gas pressure (Pa), cp is the capillary pressure (Pa), wk is
the intrinsic permeability of water (m2), wrk , is the relative permeability of water, and
w is the viscosity of water (Pa.s). More details on these parameters are discussed in
later sections.
We note that, the first term of equation 5-9 represents the flow due to gradients
in gas pressure, which is significant only in the case of intensive heating such as
microwave heating, deep fat frying, and contact heating at high temperature. The
second term represents the flow due to capillary pressure.
The capillary pressure depends upon concentration ( wc ) and temperature (T)
for a particular material (A. K. Datta, 2007a). Therefore, equation 5-9 can be
rewritten as,

Chapter 5: Multiphase Model for Convection Drying of Food 75
TT
pkkc
c
pkkP
kkn c
w
wrw
ww
w
c
w
wrw
w
w
wrw
ww
,,,
. 5-10
In turn, the second and third terms of equation 5-10 can be rewritten in terms of
capillary diffusivity, cD (m2/s), and thermal diffusivity, TD (m
2/s), given by,
w
c
w
wrw
wcc
pkkD
,
, 5-11
and T
pkkD c
w
wrw
wT
,
, 5-12
respectively.
The capillary diffusivity due to the temperature gradient, T (K), is known as
the Soret effect and is often less significant than the diffusivity due to concentration
gradients (A. K. Datta, 2007a), and will thus be neglected in this work.
Substituting the above into equation 5-8 the concentration of liquid water can
be written as,
evapwc
w
wrw
www RcDPkk
St
, 5-13
The conservation of water vapour can be written in terms of the mass fraction,
v , as
evapvvgg RnSt
, 5-14
where, g is the density of gas (kg/m3), v is the mass fraction of vapour and vn
is
the vapour mass flux (kg/m2s).
For a binary mixture vn
can be written as (Bird et al., 2007),
vgeffgg
v
grg
vgv DSPkk
n
,
,, 5-15
where, gk is the intrinsic permeability of gas (m2), grk , is the relative permeability of
gas (m2), and g is the viscosity of gasr (Pa.s) and geffD , is the binary diffusivity of
vapour and air (m2/s).

76 Chapter 5: Multiphase Model for Convection Drying of Food
The gas phase is a mixture of vapour and air. After calculating the mass
fraction of vapour, v , from the above equations, the mass fraction of air, a , can be
calculated from
va 1 . 5-16
Continuity equation to solve for pressure 5.3.4
The gas phase is assumed to consist of an ideal mixture of water vapour and
air. The gas pressure, P, may be determined via a total mass balance for the gas
phase, namely,
evapgg RnS
t
g , 5-17
where, the gas flux, gn
, is given by,
Pkk
ni
grg
gg
,
. 5-18
Here g is the density of gas phase, given by,
RT
PM gg , 5-19
where, gM is the molecular weight of gas (kg/mol).
Energy equation 5.3.5
We assume that the each of the phases are in thermal equilibrium with each
other and thus the energy balance equation can be written as,
evapfgeffwwggeffpeff RhTkhnhn
t
Tc
).(
. 5-20
Here, T is the temperature (K) of each phases, gh is the enthalpy of gas (J), wh
is the enthalpy of water (J), fgh is the latent heat of evaporation (J/kg), eff is the
effective density (kg/m3),
effpc is the effective specific heat (J/kg/K), and effk is the
effective thermal conductivity (W/m/K). Equation 5-20 considers energy transport
due to conduction and convection and energy sources/sinks due to
evaporation/condensation.

Chapter 5: Multiphase Model for Convection Drying of Food 77
The thermo-physical properties of the mixture are obtained by the volume-
weighted average of the different phases by the following equations,
swwggeff SS 1 , 5-21
pspwwpggeffp ccScSc 1 , 5-22
and sthwthwgthgeff kkSkSk ,,, 1 . 5-23
Here s is the solid density (kg/m3); pgc , pwc , and psc are the specific heat
capacity of gas, water, and solid (J/kg/K), respectively; gthk , , wthk , , and sthk , are the
thermal conductivity of gas, water, and solid, (W/m/K) respectively.
Evaporation rate 5.3.6
A non-equilibrium formulation as described in Ni et al. (1999) is considered to
calculate the evaporation rate, namely,
veqvv
evapevap ppRT
MKR , . 5-24
Here, vM is the molecular weight of vapour (kg/mol), eqvp , is the equilibrium
vapour pressure (Pa), vp is the vapour pressure (Pa), and Kevap is the evaporation
constant (s-1
) that is material and process-dependent and given by the reciprocal of
equilibration time, teq, and discussed later in this section.
The equilibrium vapour pressure can be obtained from the sorption isotherm
for different materials. Ratti et al. (1989) developed a correlation of sorption
isotherms for different materials at a particular temperature and moisture content.
The equilibrium vapour pressure, eqvp , , for apple is given by,
)](ln[232.0182.0exp)(0411.0949.43696.0
,, TPMeMTPp satdb
M
dbsatveqv
. 5-25
Here, satvP , is the saturated vapour pressure of water (Pa) and dbM is the
moisture content (dry basis), which can be related to wS via,
s
wwdb
SM
1. 5-26

78 Chapter 5: Multiphase Model for Convection Drying of Food
The saturated vapour pressure of water, satvP , , is a function of temperature and
is given by Vega-Mercado et al. (2001) as,
.
ln656.61001445.0
104176.00486.03915.1/2206.5800exp
37
24
,
TTx
TxTTP satv
5-27
The vapour pressure, vp , is obtained from partial pressure relations given by,
Pp vv , 5-28
where, v is the mole fraction of vapour and P is the total pressure (Pa).
The mole fraction of vapour, v , can be calculated from the mass fractions and
molecular weight of vapour and air as,
vaav
avv
MM
M
, 5-29
where, aM is the molecular mass of air (kg/mol) and vM is the molecular mass of
vapour (kg/mol).
As noted above, Kevap , is given by the reciprocal of the equilibration time teq.
The value of teq depends on the ratio of the gas phase volume in the pores in which
vapour has to diffuse, and the surface area available for evaporation (Amit Halder et
al., 2010). This ratio scales as the radius of the pore in the case of simple cylindrical
pores. Ward and Fang (1999) showed that the time taken for a molecule to make the
transition from liquid water to water vapour is s1410. Using this latter condition and
assuming pure diffusion of vapour from the evaporating surface, the time to
equilibrium at one mean free path m1 away from the liquid surface was less than
s610, and that of m25 away was around s510
(Ward & Fang, 1999). The time
scale analysis presented in Halder et al. (2010) showed that all the transport time
scales are greater than the equilibration time scale for food materials with a
maximum pore size smaller than m25 (e.g., potato, meat, etc.). Experiments
showed that the pore size of the apple sample studied was approximately m50
(Joardder, Kumar, et al., 2014a). Therefore, the time equilibration time, teq, is
considered as s310and thus the value of evaporation constant to be
1310 s .

Chapter 5: Multiphase Model for Convection Drying of Food 79
Initial conditions 5.3.7
The initial conditions for equations 5-13, 5-15, 5-17, and 5-20 are given by,
0)0( wwtw Sc , 5-30
0262.0)0( tvw , 5-31
ambt PP )0( , 5-32
and KT t 303)0( , 5-33
respectively.
Boundary conditions 5.3.8
Total vapour flux, totalvn ,
, from a hypothetical surface with only gas phase can
be written as,
RT
-pphn airvv
mvtotalv ,
,
5-34
where, totalvn ,
is the total vapour flux at the surface (kg/m
2s), airvp , vapour pressure of
ambient air (Pa) and mvh is the mass transfer coefficient (m/s).
However, in a multiphase problem, the vapour flux on the surface will be a
contribution from evaporation from liquid water, and water vapour already present at
the surface. Therefore, assuming the volume fraction is equal to the surface area
fraction, the boundary conditions for water and vapour phase can be written as,
RT
-ppShn airvv
wmvw
, 5-35
RT
-ppShn airvv
gmvv
, 5-36
respectively.
In most of the food processes, the pressure at the boundary (exposed to
environment) is equal to the ambient pressure, ambP . Hence, the boundary condition
for continuity equations 5-17 can be expressed as,
ambPP . 5-37

80 Chapter 5: Multiphase Model for Convection Drying of Food
For the energy equation (equation 5-20), the energy can transfer by convective
heat transfer and heat can be lost due to evaporation at the surface, given by,
fg
airvv
wmvairTsurf hRT
-ppShTThq )( . 5-38
Here, Th is the heat transfer coefficient (W/m2/K) and airT is the drying air
temperature (K).
Input parameters 5.3.9
The input parameters of the model are listed in Table 5-1. The rest of the
parameters that are not listed in Table 5-1, are derived and discussed in the latter sub-
sections.
Table 5-1. Input properties for the model
Parameter Value Reference
Sample diameter, Dias 40 mm This work
Sample thickness, Ths 10 mm This work
Equivalent porosity, initial, 0.922 (Haitao Ni, 1997; Rahman,
2008).
Water saturation, initial, 0.794 (Haitao Ni, 1997; Rahman,
2008).
Initial saturation of vapour, 0.15 (Haitao Ni, 1997; Rahman,
2008).
Gas saturation, initial, 0.19 (Haitao Ni, 1997; Rahman,
2008).
Initial temperature, T0 303K
Vapour mass fraction, 0.026 Calculated
Constants
Evaporation constant, Kevap 1000 This work
Drying air temperature, Tair 333K This work
Universal gas constant, Rg 8.314 J mol-1
K-1
(Çengel & Boles, 2006)
Molecular weight of water, 𝑀𝑤 18.016 g mol-1
(Çengel & Boles, 2006)
0
0wS
0vS
vw

Chapter 5: Multiphase Model for Convection Drying of Food 81
Parameter Value Reference
Molecular weight of vapour, 𝑀𝑣 18.016 g mol-1
(Çengel & Boles, 2006)
Molecular weight of gas (air), 𝑀𝑎 28.966 g mol-1
(Çengel & Boles, 2006)
Latent heat of evaporation, ℎ𝑓𝑔 2.26e6 J kg-1
(Çengel & Boles, 2006)
Ambient pressure, 𝑃𝑎𝑚𝑏 101325 Pa
Thermo-physical properties
Specific heats
Apple solid, 𝐶𝑝𝑠 3734 J kg-1
K-1
Measured
Water, 𝐶𝑝𝑤 4183 J kg-1
K-1
(Carr et al., 2013)
Vapour, 𝐶𝑝𝑣 1900 J kg-1
K-1
(Carr et al., 2013)
Air, 𝐶𝑝𝑎 1005.68 J kg-1
K-1
(Carr et al., 2013)
Thermal conductivity
Apple solid, 0.46 W m-1
K-1
(Choi & Okos, 1986)
Gas, 0.026 W m-1
K-1
(Rakesh et al., 2012)
Water, 0.644 W m-1
K-1
(Rakesh et al., 2012)
Density
Apple solid, 𝜌𝑠 1419 kg m-3
This study
Vapour, Ideal gas law, kg m-3
Air, Ideal gas law, kg m-3
Water, 1000, kg m-3
Permeability
Permeability is an important factor in relation to describing the water transport
due to pressure gradient in unsaturated porous media. The value of the permeability
determines the extent of pressure generation inside the material. The smaller the
permeability, the lower the moisture transport and the higher the internal pressure,
and vice versa.
sthk ,
gthk ,
wthk ,
v
v
w

82 Chapter 5: Multiphase Model for Convection Drying of Food
The permeability of a material to a fluid, k ,is a product of intrinsic
permeability, ik , of the material and relative permeability, rik , , of the fluid to that
material (Bear, 1972), namely,
riikkk , . 5-39
Measurement of permeability values for deformable hygroscopic materials
such as food is difficult (Haitao Ni, 1997). Therefore, some reasonable
approximation has been made to calculate permeability. The intrinsic permeability
depends on the pore structure of the material and is given as a function of porosity by
Kozeny-Carman model (H. Feng et al., 2004) as,
77.039.0
110578.5
2
312
wk . 5-40
The gas intrinsic permeability kg was 21212 102.1104.7 m and
21313 104.2105.6 m at moisture level of 36.0% (db) of 60.0% (db)
respectively. In this study, we used an average of212100.4 m (H. Feng et al., 2004).
Relative permeabilities are generally expressed as functions of liquid
saturation. There are numerous studies which have developed such functions (Plumb,
1991). In this study, the relative permeablities of water, wrk , , and gas, grk , , for apple
were obtained from the measurement of Feng et al. (2004), namely,
3
, wwr Sk , 5-41
and wS
gr ek86.10
, 01.1
, 5-42
respectively.
The relative permeabilities using the above equation are plotted in Figure 5-2
for better illustration.
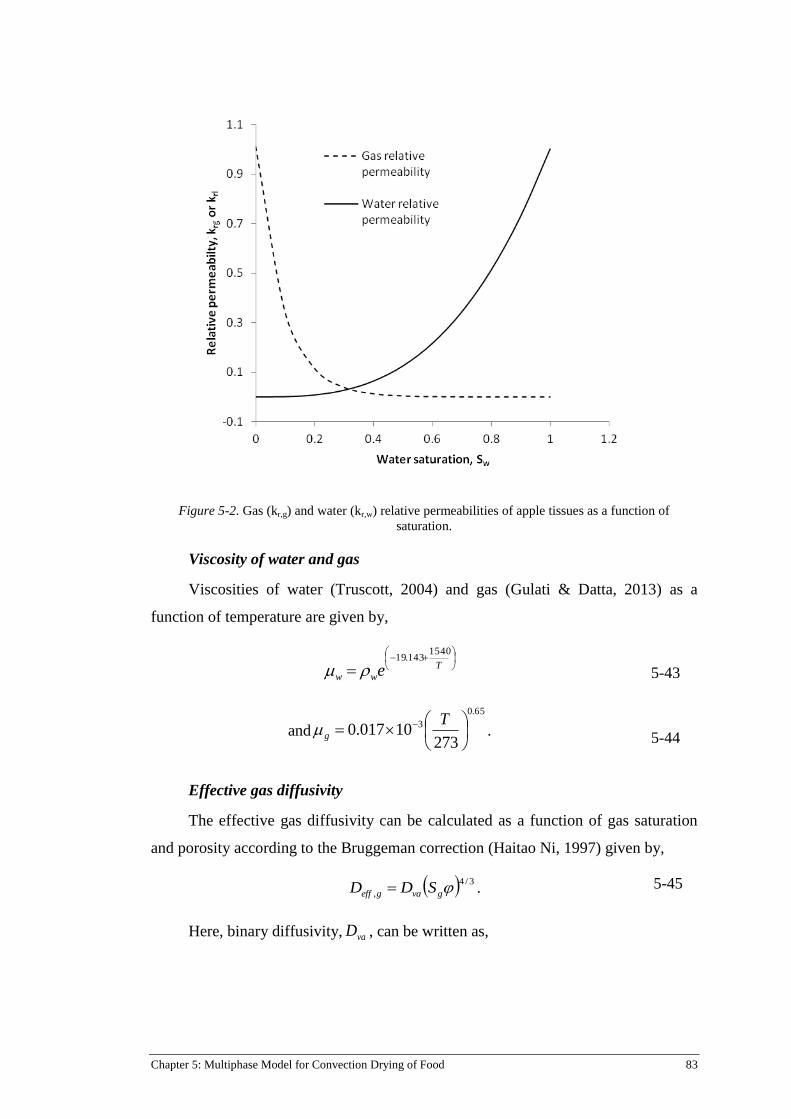
Chapter 5: Multiphase Model for Convection Drying of Food 83
Figure 5-2. Gas (kr,g) and water (kr,w) relative permeabilities of apple tissues as a function of
saturation.
Viscosity of water and gas
Viscosities of water (Truscott, 2004) and gas (Gulati & Datta, 2013) as a
function of temperature are given by,
T
ww e
1540143.19
5-43
and
65.0
3
27310017.0
T
g .
5-44
Effective gas diffusivity
The effective gas diffusivity can be calculated as a function of gas saturation
and porosity according to the Bruggeman correction (Haitao Ni, 1997) given by,
3/4
, gvageff SDD . 5-45
Here, binary diffusivity, vaD , can be written as,

84 Chapter 5: Multiphase Model for Convection Drying of Food
81.1
0
05103.2
T
T
P
PDva ,
5-46
where 𝑇0 = 256𝐾 and 𝑃0 = 1 𝑎𝑡𝑚. For simplicity, In this study effective gas
diffusivity was considered as 2.6 × 10⁻⁶ 𝑚2
𝑠 (A. K. Datta, 2007b).
Capillary diffusivity of liquid water
Capillary diffusivity of liquid water is very important for both convection and
microwave drying. Capillary force is the main driving force of liquid water in
convective drying if there is no pressure gradient developed (Haitao Ni, 1997).
Although there is a large amount of effective moisture diffusivity data for apples
available in the literature, these were obtained by fitting diffusion models to
experimental drying curves, and are not equal to capillary diffusivity.
It is clear that in our formulation (Equations 5-11) the capillary diffusivity, cD ,
is proportional to w
c
S
p
, and is a function of capillary pressure. The typical
relationship between capillary pressure and water saturation is shown in Figure 5-3
(Bear, 1972).
Figure 5-3. Typical variation of capillary force as a function of liquid saturation in porous media
(Bear, 1972)

Chapter 5: Multiphase Model for Convection Drying of Food 85
It can be seen that the capillary pressure increases significantly at lower
saturation levels and when it reaches irreducible saturation the value becomes
infinity. Therefore, that part is neglected to avoid numerical instability. From the
Figure 5-3 we can see that near 1wS , w
c
S
p
is almost infinity, therefore the cD
becomes very large. The underlying physics is that as wS approaches 1, more water
becomes free and the resistance of the solid matrix to the flow of free water is almost
zero. Therefore, cD is very large at high moisture content; as a result, the
concentration gradient is concomitantly small (Haitao Ni, 1997). As an outcome, the
capillary diffusivity can be very close to effective moisture diffusivity for very wet
material when vapour diffusion is insignificant. However, it can be quite different in
the lower moisture region. Ni (1997) used equation 5-47 for capillary diffusivity of
potato for low to high moisture content where it assumed that the capillary diffusivity
is only moisture dependent:
dbc MD 28.2exp10 8 . 5-47
In this study, a similar function was developed for apple by analysing the value
of different effective diffusivity values presented in the literature (Esturk, 2012; H.
Feng et al., 2001; H. Feng et al., 2000; Golestani et al., 2013). Considering that the
highest value corresponds to the highest saturation of water, a similar relationship
between capillary diffusivity and moisture as given by Ni (1997) is used in this
study, namely,
wbc MD 888.6exp10 8 . 5-48
Partial pressure of vapour in ambient condition
The partial pressure of vapour in an ambient condition is product of relative
humidity (RH) and saturation vapour pressure satvP , given by, satairv pRHp , . For
RH=70% and 300C, the specific humidity (moisture ratio) is 0.0188 kg/kg (dry air).
During drying, the temperature was elevated to 600C at a specific humidity of 0.0188
kg/kg (da), where the relative humidity becomes only 15%. Therefore, the partial
vapour pressure for drying air, Pap airv 29921994715.0, .
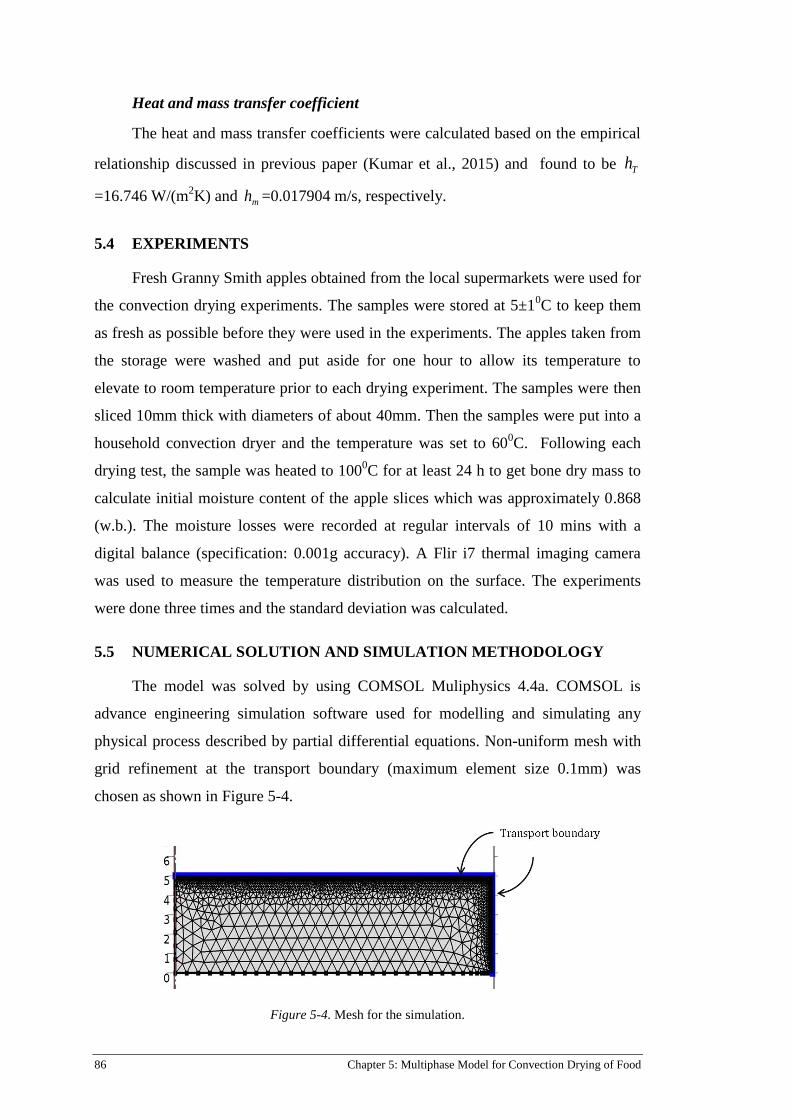
86 Chapter 5: Multiphase Model for Convection Drying of Food
Heat and mass transfer coefficient
The heat and mass transfer coefficients were calculated based on the empirical
relationship discussed in previous paper (Kumar et al., 2015) and found to be Th
=16.746 W/(m2K) and mh =0.017904 m/s, respectively.
5.4 EXPERIMENTS
Fresh Granny Smith apples obtained from the local supermarkets were used for
the convection drying experiments. The samples were stored at 5±10C to keep them
as fresh as possible before they were used in the experiments. The apples taken from
the storage were washed and put aside for one hour to allow its temperature to
elevate to room temperature prior to each drying experiment. The samples were then
sliced 10mm thick with diameters of about 40mm. Then the samples were put into a
household convection dryer and the temperature was set to 600C. Following each
drying test, the sample was heated to 1000C for at least 24 h to get bone dry mass to
calculate initial moisture content of the apple slices which was approximately 0.868
(w.b.). The moisture losses were recorded at regular intervals of 10 mins with a
digital balance (specification: 0.001g accuracy). A Flir i7 thermal imaging camera
was used to measure the temperature distribution on the surface. The experiments
were done three times and the standard deviation was calculated.
5.5 NUMERICAL SOLUTION AND SIMULATION METHODOLOGY
The model was solved by using COMSOL Muliphysics 4.4a. COMSOL is
advance engineering simulation software used for modelling and simulating any
physical process described by partial differential equations. Non-uniform mesh with
grid refinement at the transport boundary (maximum element size 0.1mm) was
chosen as shown in Figure 5-4.
Figure 5-4. Mesh for the simulation.

Chapter 5: Multiphase Model for Convection Drying of Food 87
To ensure that the results were grid-independent, several grid sensitivity tests
were conducted. The time stepping period was chosen as one second (1s) to solve the
equations. The simulation was performed using Windows 7 with Intel Core i7 CPU,
3.4GHz processor and 24GB of RAM and it took about 10 minutes to run the model.
5.6 RESULTS AND DISCUSSION
In this section, profiles of moisture, temperature, pressure, fluxes and
evaporation rate are presented and discussed. Validation is also conducted by
comparing moisture content and temperature from experiments.
Moisture content 5.6.1
The evolution of average moisture content obtained from the model and
experiments are compared in Figure 5-5. It can be seen that the model provides a
satisfactory result. The drying curve presented here has a similar characteristics to
those found in the literature for apple drying (Golestani et al., 2013; Yan Bai et al.,
2002). It was found that that moisture content (dry basis) of apple slice dropped
from its initial value of 6.6 kg/kg to 2.9 kg/kg after 150 min of drying.
Figure 5-5. Comparison between predicted and experimental values of average moisture content
during drying

88 Chapter 5: Multiphase Model for Convection Drying of Food
Distribution and evolution of water and vapour 5.6.2
The distribution of water saturation and vapour saturation along the half
thickness of the material at different times is shown in Figure 5-6 and Figure 5-7,
respectively.
Figure 5-6. Spatial distribution of water saturation with times
As expected, the graphs show that during drying the water and vapour
saturation near the surface was lower than in the centre region. The water saturation
decreases with drying time at each point within the sample. Similar moisture
distributions were found by Chemkhi et al. (2009), namely, that the surface contained
lower moisture content compared to the core region.

Chapter 5: Multiphase Model for Convection Drying of Food 89
Figure 5-7. Spatial distribution of vapour with different time
Unlike the moisture distribution, vapour saturation was found to increase with
drying time within the sample (as shown in Figure 5-7). However, the vapour
saturation at and near the surface was lower than the centre, because the vapour
coming into the surface was immediately convected away by the drying air.
Temperature curve 5.6.3
Figure 5-8 shows the temperature evolution at the surface and centre of the
material. The surface temperature rose sharply at the beginning of the drying process
(approximately 0–15 min); this was due to the sudden exposure of the material to
higher temperature. Chemkhi et al. (2009) described this phase as the transient
period, where the material was heated until wet bulb temperature value was reached.
Then, the temperature rose at a slower rate until it reached the drying air temperature.
A similar trend of temperature at the surface during convection drying of porous
media was found by Chemki et al. (2009). They observed that, it took about 330 min
to raise the temperature to maximum (drying air temperature).
The surface temperature was always higher than the centre temperature
throughout the drying period. The difference between the surface and centre

90 Chapter 5: Multiphase Model for Convection Drying of Food
temperature increased as drying progressed. The reason behind this was presumably
related to a decrease in the thermal conductivity with moisture content.
Figure 5-8. Surface and centre temperature obtained from model
Vapour pressure, equilibrium vapour pressure, and saturated pressure 5.6.4
Figure 5-9 represents the comparison between vapour pressure, equilibrium
vapour pressure and saturation vapour pressure at the surface. These three vapour
pressures are very important in relations to drying kinetics. The saturation vapour
pressure varied with temperature (equation 5-25) and data was available from many
sources (Çengel & Boles, 2006). This data was compared with simulated saturation
data and found to be consistent. The equilibrium vapour pressure data was calculated
from the sorption isotherm of apple (equation 5-27) and, as expected, was found to
be lower than the saturation vapour pressure. Figure 5-9 shows that the difference
between vapour pressure and equilibrium vapour pressure is higher during the initial
stage of drying resulting in higher evaporation according to equation 5-24. However,
after the initial stage of drying (approximately 18 min), these two pressures overlap
each other or sometimes vapour pressure becomes lower than equilibrium vapour
pressure. Therefore, the evaporation becomes zero or negative at the surface after
that time, which can be seen in Figure 5-10. The evaporation is explained in the next
section to confirm that the simulation captures the physical phenomena well.

Chapter 5: Multiphase Model for Convection Drying of Food 91
Figure 5-9. Vapour pressure, equilibrium vapour pressure and saturation pressure at surface
Evaporation rate 5.6.5
One of the advantages of non-equilibrium approaches over other methods in
the modelling of drying is the ability to calculate evaporation. Figure 5-10 shows that
a higher evaporation rate occurred near the surface. In addition to this behaviour, the
evaporation rate was distributed over a narrow zone near the surface. It showed a
significant amount of evaporation occurred at the beginning of the drying process (0-
30 min). Halder et al. (2007b) also found similar phenomena in frying, where
production of excess amounts vapour at the beginning caused vapour to move
towards the centre.
The non-equilibrium formulation of evaporation was higher when the
difference between vapour pressure and equilibrium vapour pressure was higher.
Near the surface, this difference was higher; therefore, the evaporation was higher
near the surface. Similar higher evaporation near the surface was also found in meat
cooking by Dhall et al. (2012).

92 Chapter 5: Multiphase Model for Convection Drying of Food
Figure 5-10. Spatial distribution of evaporation rate at different drying times
Another interesting pattern emerged from the graph in Figure 5-10, wherein
evaporation started at the inner side of the material and the rate decreased as drying
progressed. It shows that the evaporation was very high at 30 min (amounting to 1.1
kg/m3/s) and as drying progresses the peak of evaporation moves towards the centre.
The reason behind this behaviour could be that the liquid water saturation becomes
lower (drier) near the surface as drying progressed, and the difference between
vapour pressure and equilibrium vapour pressure essentially became zero as
discussed previously. Another possible explanation could be that the gradual
penetration of heat increased the kinetic energy of water molecules which moves
towards the centre. Thus the peak evaporation gradually moved towards the centre.
In addition to this observation, the decreasing evaporation rate near the surface could
be due to the possibility that there were relatively less number of water molecules
available due to lower moisture content.
Vapour and water fluxes 5.6.6
The major advantage of a multiphase porous media model is that the relative
contribution of vapour and water fluxes due to diffusion and gas pressure gradient
can be illustrated. Moisture fluxes due to capillary pressure and gas pressure
gradients are plotted in Figure 5-11 and Figure 5-12, respectively. It can be seen that
the capillary flux is higher at about 0.5–1.0mm beneath the surface and this peak is

Chapter 5: Multiphase Model for Convection Drying of Food 93
moving towards the core. The explanation for this could be that the capillary flux (
wc cD ) is proportional to moisture gradient ( wc ). The gradient is higher initially
near that region and the peak of gradient moves towards the core with time. At and
near the surface, the water flux decreased, which could be due to the decrease in
capillary diffusivity due to lower moisture content.
Figure 5-11. Water flux due to capillary diffusion
The water flux due to gas pressure gradient (Figure 5-12) showed a similar
pattern of flux distribution, albeit with lower magnitude. The convective water flux
increased from zero (at the centre) to a peak at approximately 1mm beneath the
surface. This could be due to the higher pressure gradient near the surface resulting
higher convective flow. However, in convection drying, the gradient of pressure is
needed a closer inspection, because there may not be enough pressure development
inside the sample. Although the pressure gradient was higher at and near the surface
(0–1mm beneath the surface), the flux due to gas pressure started reducing in these
regions. This could be due to the reduction of relative permeability of water which
tends to zero at lower moisture saturation, resulting the convective term
P
kk
w
wrw
w
, near zero.
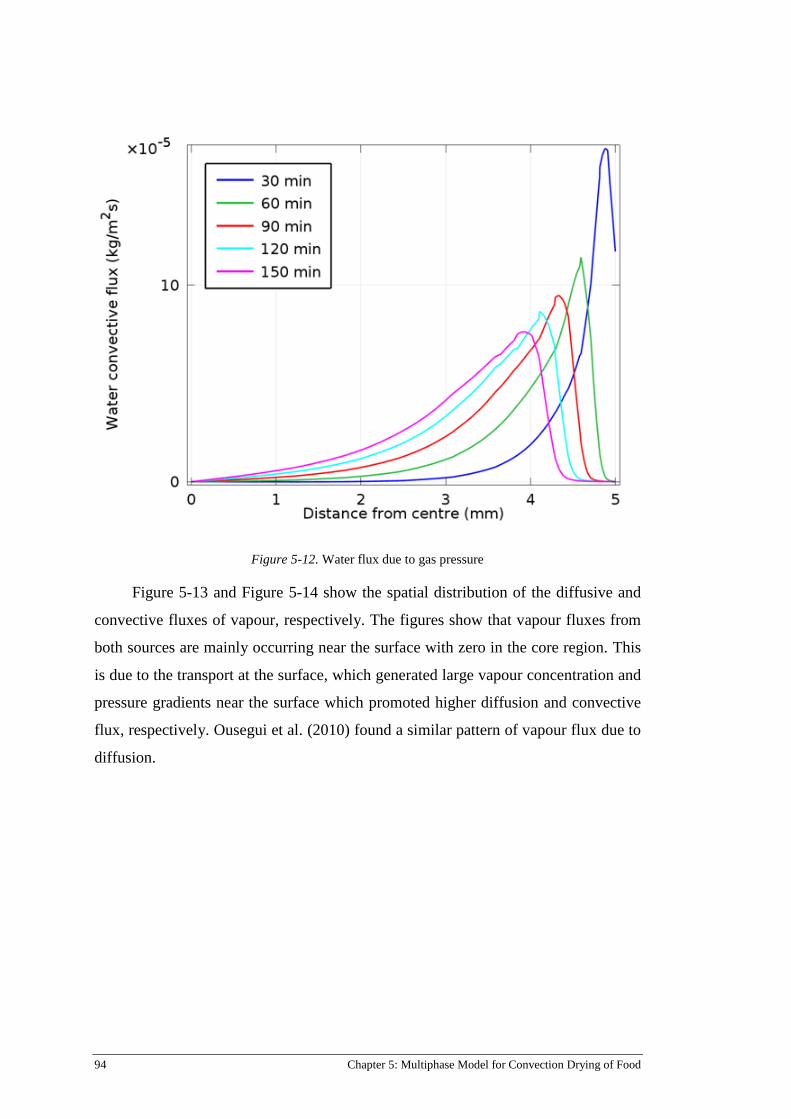
94 Chapter 5: Multiphase Model for Convection Drying of Food
Figure 5-12. Water flux due to gas pressure
Figure 5-13 and Figure 5-14 show the spatial distribution of the diffusive and
convective fluxes of vapour, respectively. The figures show that vapour fluxes from
both sources are mainly occurring near the surface with zero in the core region. This
is due to the transport at the surface, which generated large vapour concentration and
pressure gradients near the surface which promoted higher diffusion and convective
flux, respectively. Ousegui et al. (2010) found a similar pattern of vapour flux due to
diffusion.

Chapter 5: Multiphase Model for Convection Drying of Food 95
Figure 5-13. Vapour flux due to binary diffusion
Figure 5-14. Vapour flux due to gas pressure
Generally, the vapour and water fluxes caused by all sources showed that the
fluxes were minimal at the centre and gradually increase towards the surface.

96 Chapter 5: Multiphase Model for Convection Drying of Food
Therefore, the surface contains higher moisture saturation, even though the surface
became dried.
5.7 CONCLUSIONS
A non-equilibrium multiphase porous media model, which was a significant
advancement relative to existing approaches, has been developed for the convection
drying of food. The model was validated by comparing experimental moisture and
temperature data and it was demonstrated that good agreement existed. The results of
this study supported the idea that the surface dried first, and then the moisture from
inside moved due to both capillary and gas pressure. The model in this paper was
used to elucidate the relative contribution of various modes of transport and phase
change, which cannot be investigated with a single phase model. For example,
parameters such as capillary diffusion, gas pressure and evaporation in overall
moisture transport were evaluated, which is not possible through experiments or by
using simpler models. The fundamental basis of the model enabled a deeper
understanding of drying kinetics and, thus, it can be an important tool in making
safety, quality and product design related predictions.
Chapter 6: Multiphase Model for IMCD Using Lambert’s Law 97
Multiphase Model for IMCD Chapter 6:
Using Lambert’s Law
This Chapter presents a multiphase porous media model for IMCD, which is
the first attempt at developing the IMCD model considering a multiphase porous
media approach. For mass transport of water, vapour, and air, the model considers
similar formulation to Chapter 5. However, the energy equation in this model
considers an additional heat generation term due to microwave energy which is
calculated by using Lambert’s Law.
This Chapter features the following publication:
C. Kumar, M. U. H. Joardder, T.W. Farrell and M. A. Karim, (2015)
Multiphase porous media model for Intermittent microwave convective
drying (IMCD) of food: Model formulation and validation. Journal of
Thermal Science, (To be submitted)
The signed “statement of contribution” for the above paper is given below:

98 Chapter 6: Multiphase Model for IMCD Using Lambert’s Law
6.1 ABSTRACT
Intermittent microwave convective (IMCD) drying is an advanced drying
technology that improves both energy efficiency and food quality during the drying
of food materials. Despite numerous experimental studies available for IMCD, there
is no complete multiphase porous media model available to describe the process. A
multiphase porous media model considering liquid water, gases and the solid matrix
inside the food during drying can provide in depth understanding of IMCD. In this
article, firstly a multiphase porous media model was developed for IMCD. Then the
model is validated against experimental data by comparing moisture content and
temperature distributions after each heating and tempering periods. The profile of
vapour pressures and evaporation during IMCD are presented and discussed. The
relative contribution of water and vapour fluxes due to gas pressure and diffusion
demonstrated that the fluxes due are relatively higher in IMCD compared to
convection drying and this makes the IMCD faster.
6.2 INTRODUCTION
Combined microwave convection drying can significantly shorten the drying
time and improve the product quality and energy efficiency (M. Zhang et al., 2006).
However, continuous application of microwave energy may overheat the product
(Gunasekaran, 1999). To overcome this problem, Intermittent Microwave
Convective Drying (IMCD) is practiced where the heating rate can be controlled by
choosing the intermittency (Gunasekaran, 1999; I. W. Turner et al., 1998). Thus,
IMCD can improve both energy efficiency and product quality during drying. Many
experimental investigations have highlighted the advantages of IMCD showing
drying time reduction and quality improvement for different food products, such as,
oregano (Soysal et al., 2009b), sage leaves (Esturk, 2012), banana (Ahrné et al.,
2007), and pineapple (Botha et al., 2012). Being a relatively new technique in food
drying, modelling studies of IMCD are very limited. In order to describe the heat and
mass transfer process during IMCD, an appropriate model has to be developed to
obtain a better strategy for applying microwaves and optimizing the process (Kumar
et al., 2014).
Researchers have attempted to develop models for continuous microwave
convective drying without considering intermittency. Those are only either empirical

Chapter 6: Multiphase Model for IMCD Using Lambert’s Law 99
models (Bhattacharya et al., 2013; Esturk, 2012), or single-phase diffusion based
models (J. R. Arballo et al., 2012; Mohamed Hemis et al., 2012). Since these models
did not account for the intermittency of microwave power, they do not provide any
understanding of the IMCD process.
There are a some empirical models available in the literature for IMCD
(Esturk & Soysal, 2010), however, the empirical models do not help towards
optimization and are only applicable for specific experimental conditions (Kumar et
al., 2012a; Perussello et al., 2014). Apart from empirical modelling, there are some
diffusion based theoretical models that consider intermittency of microwave power
(Gunasekaran, 1999; Gunasekaran & Yang, 2007a, 2007b; Yang & Gunasekaran,
2004), however, mass transfer was neglected in these models. Moreover, none of
these intermittent heating models investigated the temperature distribution and
redistribution due to intermittent microwave power, which is critical for avoiding
overheating of food. Therefore, it can be concluded that currently there is no
modelling work that can illustrate the mechanism of heat and mass transfer during
IMCD.
The theoretical models of food drying can broadly be categorized into two
groups: (1) single phase (diffusion based), (2) multiphase modes. The single-phase
models consider only diffusion inside the food product and are unable to provide an
understanding of other transport mechanism such as pressure driven flow and
evaporation. Describing all the water transport as diffusion cannot be justified under
all situations (J. Zhang & Datta, 2004). Therefore, multiphase models considering
transport of liquid water, water vapour and air insider the food materials are more
realistic. Although the final equations of multiphase models seem to be simple
conservation equations it still provides the more fundamental and convincing basis of
transport than single-phase models (A. K. Datta, 2007b; Whitaker, 1977). Multiphase
models can be categorised into two groups viz. equilibrium and non-equilibrium
approach of vapour pressure. In equilibrium formulations, the vapour pressure, vp , is
assumed to be equal with equilibrium vapour pressure, eqvp , , and vice versa (J.
Zhang & Datta, 2004). There are some multiphase models considering the
equilibrium approach applied in vacuum drying of wood (Ian W. Turner & Perré,
2004) and convection drying of wood and clay (Stanish et al., 1986) (Chemkhi et al.,

100 Chapter 6: Multiphase Model for IMCD Using Lambert’s Law
2009), microwave spouted bed drying of apple (H. Feng et al., 2001) and large
bagasse stockpiles (Farrell et al., 2012).
However, equilibrium conditions may not be achieved due to lower moisture
content at the surface during drying. Therefore, non-equilibrium multiphase models
are computationally effective and applied to a wide range of food processing such as
frying (Bansal et al., 2014; H. Ni & Datta, 1999), microwave heating (Chen et al.,
2014; Rakesh et al., 2010), puffing (Rakesh & Datta, 2013), baking (J. Zhang et al.,
2005), meat cooking (Dhall & Datta, 2011) etc. However, application of these non-
equilibrium models in drying of food materials is very limited. To the authors’ best
knowledge, not only is there no satisfactory multiphase model, there is not even a
comprehensive single-phase model for IMCD.
The objectives of this study are to: 1) develop a multiphase porous media
model for IMCD drying of food materials considering transport of liquid water,
vapour and air, 2) validate the model for IMCD of apple slice with experimental
moisture and temperature data, 3) investigate the temperature distribution and
redistribution due to intermittency of microwave, and 4) investigate the transport
mechanisms, such as, pressure driven, binary diffusion and capillary driven flow in
IMCD.
6.3 MATHEMATICAL MODEL
In this section, the equations for multiphase porous media are developed
describing heat, mass and momentum transfer for IMCD. It also presents the
transport mechanism involved in drying, assumptions and input parameters for the
model. Apple has been considered as the sample food material for this study.
The transport model presented here is based on the mathematical model section
of Chapter 5 with additional formulations for microwave heat generation using
Lambert’s Law. The model developed in this research considers transport of liquid
water, vapour and air inside food materials. The mass and energy conservation
equations include convection, diffusion and evaporation of water and vapour.
Momentum conservation is developed from Darcy’s equations. Evaporation is
considered as distributed throughout the domain and a non-equilibrium evaporation
formulation is used for evaporation condensation-condensation phenomena.

Chapter 6: Multiphase Model for IMCD Using Lambert’s Law 101
Problem description and assumptions 6.3.1
A schematic of the sample together with transport mechanisms involved in
drying is presented in Figure 6-1. A 2D axisymmetic geometry of a 3D apple slice is
considered for simulation. Heat and mass transfer takes place at all boundaries except
the symmetry boundary. The apple slice is considered as porous media and the pores
are filled with three transportable phases, namely liquid water, air and water vapour
as shown in Figure 6-1. All phases (solid, liquid, and gases) are continuous and local
thermal equilibrium is valid, which means that the temperatures in all three phases
are equal. Liquid water transport takes place due to convective flow resulting from
gas pressure gradient, capillary flow, and evaporation. Vapour and air transport
arises from gas pressure gradients and binary diffusion.
Figure 6-1 . Schematic showing 3D sample, 2D axisymmetric domain and Representative Elementary
Volume (REV) with the transport mechanism of different phases
Governing equations 6.3.2
The mathematical formulation, initial condition, boundary conditions, and
input parameters are similar to those that have been presented in Chapter 5. The only
difference is that a heat generation term, micQ (W/m3), is added in the energy equation
102 Chapter 6: Multiphase Model for IMCD Using Lambert’s Law
(equation 6-13). However, the transport equations are briefly presented here along
with the additional for the heat generation term.
Mass and momentum balance equations
The representative elementary volume V (m3) is the sum of the volume of
three phases, namely, gas, water, and solid, namely,
swg VVVV 6-1
where, gV is the volume of gas (m3), wV is the volume of water (m
3), and sV was
the volume of solid (m3).
The apparent porosity, , is defined as the volume fraction occupied by gas and
water. Thus,
V
VV wg
. 6-2
The water, wS , and gas, gS , Saturation are defined as the fraction of pore
volume occupied by that particular phase, namely,
V
V
VV
VS w
gw
ww
, 6-3
and w
g
gw
g
g SV
V
VV
VS
1
, 6-4
respectively.
The mass concentrations of water, wc (kg/m3), vapour, vc (kg/m
3),and air, ac
(kg/m3), are given by,
www Sc , 6-5
gv
v SRT
pc , 6-6
and ga
a SRT
pc , 6-7

Chapter 6: Multiphase Model for IMCD Using Lambert’s Law 103
respectively. Here, w is the density of water (kg/m3), R is the universal gas constant
(J/mol/K), and T is the temperature of product (K), vp is the partial pressure of
vapour (Pa), ap is the partial pressure of air (Pa).
The mass conservation equation for liquid water considers gas pressure driven
flow, capillary diffusion, and evaporation of liquid water to vapour. The detail
derivations of these were presented in Chapter 5. The final equations for mass
concentration of liquid water can be written as,
evapwc
w
wrw
www RcDPkk
St
,,
6-8
where, wk is the intrinsic permeability of water (m2), wrk , is the relative permeability
of water, and w is the viscosity of water (Pa.s), cD is the capillary diffusivity (m2/s)
and evapR is the evaporation rate of liquid water to water vapour (kg/m3s).
The mass balance equation for the vapour component of gas phase include bulk
flow, binary diffusion, and phase change (Bird et al., 2007); namely,
evapvgeffgg
v
grg
vgvgg RDSPkk
St
,
,, 6-9
where, g is the density of gas (kg/m3), v is the mass fraction of vapour, gk is the
intrinsic permeability of gas (m2), grk , is the relative permeability of gas (m
2), and
g is the viscosity of gas (Pa.s) and geffD , is the binary diffusivity of vapour and air
(m2/s).
The gas phase is a mixture of vapour and air. After calculating the mass
fraction of vapour, v , from the above equations, the mass fraction of air, a , can be
calculated from
va 1 . 6-10
Mass balance equations for gas phase
The total gas pressure, P, is calculated by solving the overcall mass balance for
the gas phase, namely,

104 Chapter 6: Multiphase Model for IMCD Using Lambert’s Law
evap
i
grg
gg RPkk
St
,
g , 6-11
where g is the density of gas phase, given by,
RT
PM gg , 6-12
where, gM is the molecular weight of gas (kg/mol).
Energy balance equation
Since thermal equilibrium is assumed to exist between all phases the energy
balance equation can be written as,
)().( tfQRhTkhnhnt
Tc mevapfgeffwwggeffpeff
. 6-13
Here, T is the temperature (K) of each phases, gh is the enthalpy of gas (J), wh
is the enthalpy of water (J), fgh is the latent heat of evaporation (J/kg), eff is the
effective density (kg/m3),
effpc is the effective specific heat (J/kg/K), effk is the
effective thermal conductivity (W/m/K) and f(t) is an intermittency function as
discussed in section 4.5.
The thermo-physical properties of the mixture are obtained by the volume
weighted average of the different phases by the following equations,
swwggeff SS 1 , 6-14
pspwwpggeffp ccScSc 1 , 6-15
and sthwthwgthgeff kkSkSk ,,, 1 . 6-16
Here s is the solid density (kg/m3); pgc , pwc , and psc are the specific heat
capacities of gas, water, and solid (J/kg/K), respectively; gthk , , wthk , , and sthk , are the
thermal conductivities of gas, water, and solid, (W/m/K) respectively.
Evaporation rate 6.3.3
A non-equilibrium formulation as described in Ni et al. (1999) is considered to
calculate the evaporation rate, namely,
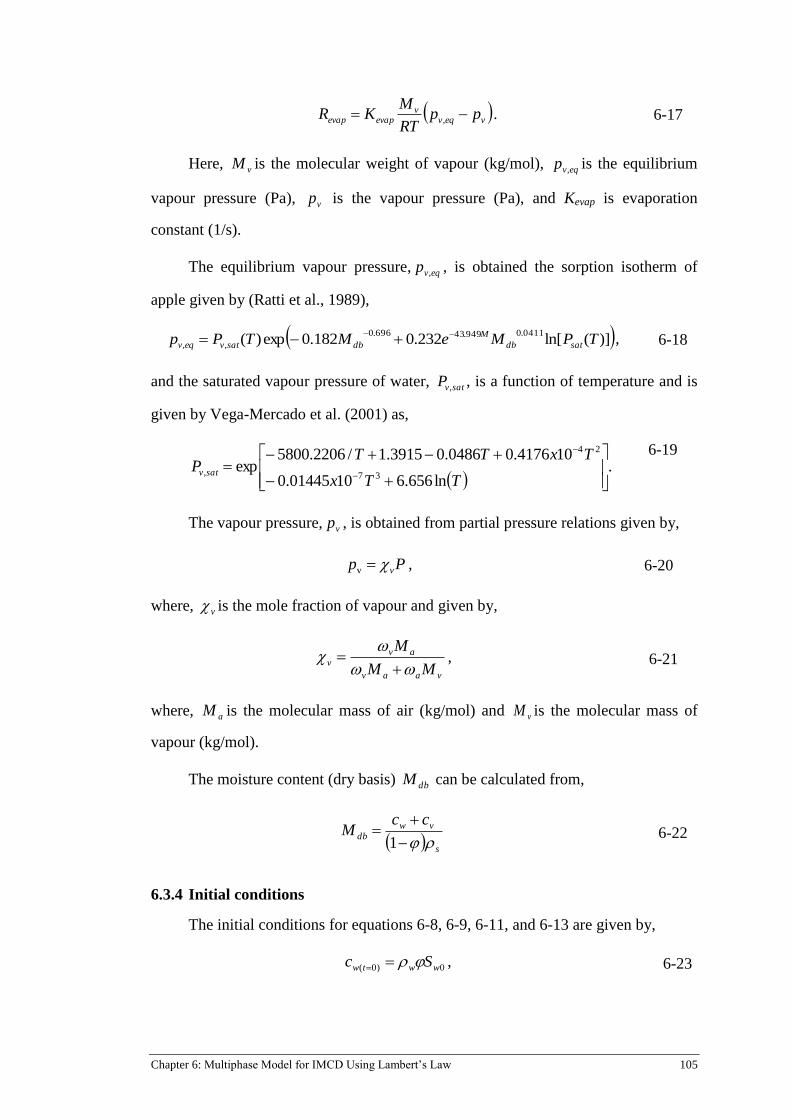
Chapter 6: Multiphase Model for IMCD Using Lambert’s Law 105
veqvv
evapevap ppRT
MKR , . 6-17
Here, vM is the molecular weight of vapour (kg/mol), eqvp , is the equilibrium
vapour pressure (Pa), vp is the vapour pressure (Pa), and Kevap is evaporation
constant (1/s).
The equilibrium vapour pressure, eqvp , , is obtained the sorption isotherm of
apple given by (Ratti et al., 1989),
)](ln[232.0182.0exp)(0411.0949.43696.0
,, TPMeMTPp satdb
M
dbsatveqv
, 6-18
and the saturated vapour pressure of water, satvP , , is a function of temperature and is
given by Vega-Mercado et al. (2001) as,
.
ln656.61001445.0
104176.00486.03915.1/2206.5800exp
37
24
,
TTx
TxTTP satv
6-19
The vapour pressure, vp , is obtained from partial pressure relations given by,
Pp vv , 6-20
where, v is the mole fraction of vapour and given by,
vaav
avv
MM
M
, 6-21
where, aM is the molecular mass of air (kg/mol) and vM is the molecular mass of
vapour (kg/mol).
The moisture content (dry basis) dbM can be calculated from,
s
vwdb
ccM
1 6-22
Initial conditions 6.3.4
The initial conditions for equations 6-8, 6-9, 6-11, and 6-13 are given by,
0)0( wwtw Sc , 6-23

106 Chapter 6: Multiphase Model for IMCD Using Lambert’s Law
0262.0)0( tvw , 6-24
ambt PP )0( , 6-25
and KT t 303)0( , 6-26
respectively.
Boundary conditions 6.3.5
The heat and mass transfer takes place at the transport boundaries as shown in
Figure 6-1. The boundary conditions for equations 6-8 and 6-9 can be written as,
RT
-ppShn airvv
wmvw
, 6-27
RT
-ppShn airvv
gmvv
, 6-28
respectively, Here where, airvp , vapour pressure of ambient air (Pa) and mvh is the
mass transfer coefficient (m/s).
The boundary condition for continuity equations 6-11 can be expressed as,
ambPP , 6-29
where ambP is the ambient pressure (Pa).
For the energy equation (equation 6-13), the boundary condition is given by,
fg
airvv
wmvairTsurf hRT
-ppShTThq )( . 6-30
Here, Th is the heat transfer coefficient (W/m2/K) and airT is the drying air
temperature (K).
Input parameters 6.3.6
The input parameters of the model are listed in Table 6-1 and some of them are
derived and discussed in the latter of this section.

Chapter 6: Multiphase Model for IMCD Using Lambert’s Law 107
Table 6-1. Input properties for the model
Parameter Value Reference
Sample diameter, Dias 40 mm This work
Sample thickness, Ths 10 mm This work
Equivalent porosity, initial, 0.922 (Haitao Ni, 1997; Rahman,
2008).
Water saturation, initial, 0.794 (Haitao Ni, 1997; Rahman,
2008).
Initial saturation of vapour, 0.15 (Haitao Ni, 1997; Rahman,
2008).
Gas saturation, initial, 0.19 (Haitao Ni, 1997; Rahman,
2008).
Initial temperature, T0 303K
Vapour mass fraction, 0.026 Calculated
Constants
Evaporation constant, Kevap 1000 This work
Drying air temperature, Tair 333K This work
Universal gas constant, Rg 8.314 J mol-1
K-1
(Çengel & Boles, 2006)
Molecular weight of water, 𝑀𝑤 18.016 g mol-1
(Çengel & Boles, 2006)
Molecular weight of vapour, 𝑀𝑣 18.016 g mol-1
(Çengel & Boles, 2006)
Molecular weight of gas (air), 𝑀𝑎 28.966 g mol-1
(Çengel & Boles, 2006)
Latent heat of evaporation, ℎ𝑓𝑔 2.26e6 J kg-1
(Çengel & Boles, 2006)
Ambient pressure, 𝑃𝑎𝑚𝑏 101325 Pa (Çengel & Boles, 2006)
Gas intricsic permeability, kg (H. Feng et al., 2004).
Binary diffusivity, (A. K. Datta, 2007b).
Ambient vapour pressure, Calculated
Heat transfer coefficient, 16.746 W/(m2K) Calculated
Mass transfer coefficient, 0.017904 m/s Calculated
Thermo-physical properties
Specific heat
0
0wS
0vS
vw
212100.4 m
vaD sm /106.2 26
airvp ,Pa2992
Th
mh

108 Chapter 6: Multiphase Model for IMCD Using Lambert’s Law
Parameter Value Reference
Apple solid, 𝐶𝑝𝑠 3734 J kg-1
K-1
Measured
Water, 𝐶𝑝𝑤 4183 J kg-1
K-1
(Carr et al., 2013)
Vapour, 𝐶𝑝𝑣 1900 J kg-1
K-1
(Carr et al., 2013)
Air, 𝐶𝑝𝑎 1005.68 J kg-1
K-1
(Carr et al., 2013)
Thermal conductivity
Apple solid, 0.46 W m-1
K-1
(Choi & Okos, 1986)
Gas, 0.026 W m-1
K-1
(Rakesh et al., 2012)
Water, 0.644 W m-1
K-1
(Rakesh et al., 2012)
Density
Apple solid, 𝜌𝑠 1419 kg m-3
This study
Vapour, Ideal gas law, kg m-3
Air, Ideal gas law, kg m-3
Water, 1000, kg m-3
Permeability
The intrinsic permeability of water is considered as a function of porosity by
Kozeny-Carman model (H. Feng et al., 2004) as,
77.039.0
110578.5
2
312
wk . 6-31
The gas intrinsic premeabilityis considered to be constant and is given by,
(H. Feng et al., 2004).
212100.4 mkw
6-32
In this study, the relative permeablities were considered as a function of water
sarutaion given by (H. Feng et al., 2004),
3
, wwr Sk , 6-33
and
sthk ,
gthk ,
wthk ,
v
v
w

Chapter 6: Multiphase Model for IMCD Using Lambert’s Law 109
wS
gr ek86.10
, 01.1
, 6-34
respectively.
Viscosity of water and gas
Viscosities of water (Truscott, 2004) and gas (Gulati & Datta, 2013) as a
function of temperature are given by,
T
ww e
1540143.19
6-35
and
65.0
3
27310017.0
T
g . 6-36
Effective gas diffusivity
The effective gas diffusivity can be calculated as a function of gas saturation
and porosity according to Bruggeman correction (Haitao Ni, 1997) given by,
3/4
, gvageff SDD . 6-37
Here, vaD is binary diffusivity between air and water vapour (m2/s).
Capillary diffusivity of liquid water
Capillary diffusivity of liquid water used in the model is a function of moisture
content as discussed in Chapter 5 and given by,
wbc MD 888.6exp10 8 . 6-38
The relationship between dry basis moisture content, dbM , and wet basis
moisture content, wbM , is given by,
wb
wbdb
M
MM
1. 6-39
Microwave power absorption 6.3.7
Lamberts Law has been widely used for developing microwave heating models
in literature (Abbasi Souraki & Mowla, 2008; J. R. Arballo et al., 2012; Mohamed
Hemis et al., 2012; Khraisheh et al., 1997; Mihoubi & Bellagi, 2009; Salagnac et al.,
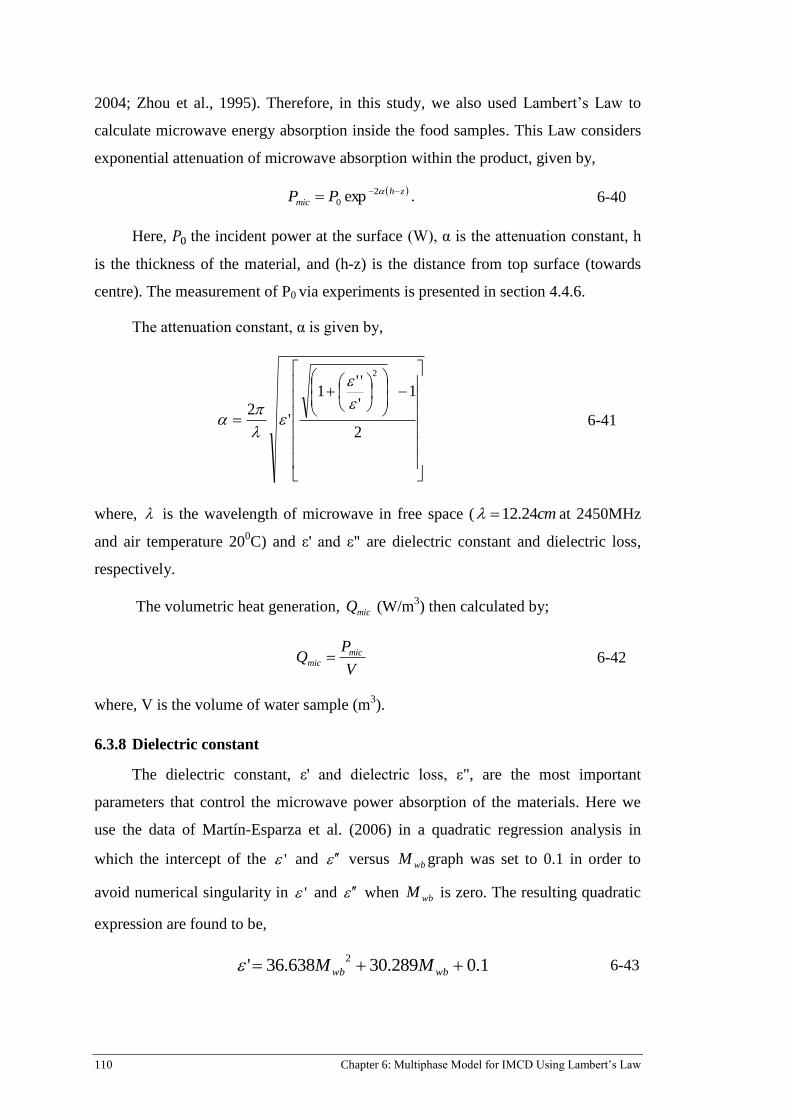
110 Chapter 6: Multiphase Model for IMCD Using Lambert’s Law
2004; Zhou et al., 1995). Therefore, in this study, we also used Lambert’s Law to
calculate microwave energy absorption inside the food samples. This Law considers
exponential attenuation of microwave absorption within the product, given by,
zh
mic PP 2
0 exp . 6-40
Here, 𝑃0 the incident power at the surface (W), α is the attenuation constant, h
is the thickness of the material, and (h-z) is the distance from top surface (towards
centre). The measurement of P0 via experiments is presented in section 4.4.6.
The attenuation constant, α is given by,
2
1'
''1
'2
2
6-41
where, is the wavelength of microwave in free space ( cm24.12 at 2450MHz
and air temperature 200C) and ε' and ε" are dielectric constant and dielectric loss,
respectively.
The volumetric heat generation, micQ (W/m3) then calculated by;
V
PQ mic
mic 6-42
where, V is the volume of water sample (m3).
Dielectric constant 6.3.8
The dielectric constant, ε' and dielectric loss, ε", are the most important
parameters that control the microwave power absorption of the materials. Here we
use the data of Martín-Esparza et al. (2006) in a quadratic regression analysis in
which the intercept of the ' and versus wbM graph was set to 0.1 in order to
avoid numerical singularity in ' and when wbM is zero. The resulting quadratic
expression are found to be,
1.0289.30638.36'2
wbwb MM 6-43

Chapter 6: Multiphase Model for IMCD Using Lambert’s Law 111
and 1.0.8150.26543.132
wbwb MM . 6-44
6.4 MATERIALS AND METHODS
In this section, we discuss the experimental IMCD procedures, sample
preparation, and data acquisition method.
IMCD
The IMCD was achieved by placing a sample in a microwave oven for 20s
followed by convection drying, for 80s, in the convection dryer. The experiments
were conducted with a Panasonic Microwave Oven (Model NNST663W) having
inverter technology with internal cavity dimension 352mm (W) x230mm (H)
x347mm (D). The inverter technology enables accurate and continuous power supply
at lower power settings (Panasonic, 2013). The microwave oven is able to supply 10
accurate power levels with a maximum of 1100W at 2.45GHz frequency. The apple
slices were placed in the centre of the microwave cavity, in order to achieve an even
absorption of microwave energy. The moisture loss was recorded at regular intervals
at the end of each tempering period with a digital balance (specification: 0.001g
accuracy).
Sample preparation
Fresh Granny Smith apples obtained from the local Australian supermarkets
were used for the intermittent microwave drying experiments. The samples were
stored at 5±10C to keep them as fresh as possible before they were used in the
experiments. The apples taken from the storage unit were washed and put aside for
one hour to allow their temperature to equilibrate to room temperature prior to each
drying experiment. The sample were cut into disks with a thickness of 10mm and
diameter of approximately 40mm.The initial moisture content of the apple slices was
approximately 0.868 kg/kg (wet basis.) or 6.61 kg/kg (dry basis).
Temperature measurement
A Flir i7 thermal imaging camera was used to measure the temperature
distribution on the surface. Accurate measurement of temperature by thermal
imaging camera depends on the emissivity values. The emissivity value for apple
was found in the range between 0.94 and 0.97 (Hellebrand et al., 2001) and set at
0.95 in the camera before taking images.

112 Chapter 6: Multiphase Model for IMCD Using Lambert’s Law
6.5 NUMERICAL SOLUTION
Engineering simulation software COMSOL Multiphysics 4.4 was used to solve
the equations. COMSOL is an advanced software tool used for modelling and
simulating any physical process described by partial derivative equations.
Since heat and mass transport phenomena is happening at the transport
boundaries as shown in Figure 6-1, a finer mesh (maximum element size 0.1mm)
was chosen at those boundaries to capture this phenomena more accurately. Figure
6-2 shows the mesh chosen for the model.
Figure 6-2. Mesh for the simulation
To ensure that the results are grid-independent, several grid sensitivity tests
were conducted. The time stepping was set to be 1s.The simulations were performed
using a Windows 7 computer with Intel Core i7 CPU, 3.4GHz processor and 24GB
of RAM.
6.6 RESULTS AND DISCUSSION
In this section, the results of the theoretical and experimental investigations are
given. Experimental data was also used to validate the model developed.
Specifically, moisture content and temperature obtained from experiments were
compared with that of the model. Moreover, spatial and temporal profile of moisture,
temperature, evaporation rate, pressure and fluxes are also discussed.

Chapter 6: Multiphase Model for IMCD Using Lambert’s Law 113
Moisture content and temperature 6.6.1
The average moisture content with time obtained from simulation and
experiments are presented in Figure 6-3. The model provided a quite satisfactory
match with the experimental result (with R2=0.99359). It can be seen from Figure
6-3 that moisture content (dry basis) of apple slice dropped from its initial of 6.6
kg/kg to 4.5 kg/kg after 1200s of IMCD.
Figure 6-3. Comparison between predicted and experimental values of average moisture content
during drying
The temperature at the centre of the top surface obtained from experiments and
simulation at selected times are compared in Table 6-2. The model shows good
agreement with experimental with the presented values. However, at the beginning of
drying, the predicted temperature was lower. This could be due to the limitation of
Lambert’s Law as discussed later in section 6.6.9. The table shows that the
temperature reached about and above 600C after each heating cycles (320s, 420s etc)
and then drops to about 500C after each tempering periods (400s, 500s etc).
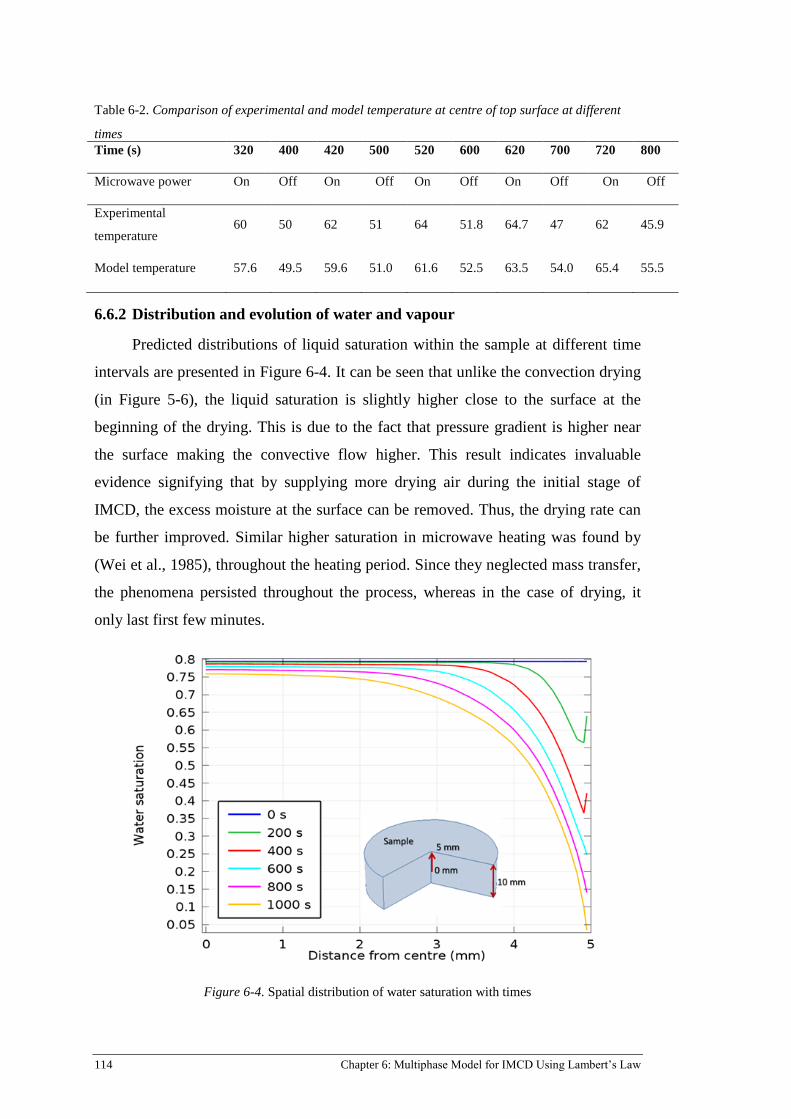
114 Chapter 6: Multiphase Model for IMCD Using Lambert’s Law
Table 6-2. Comparison of experimental and model temperature at centre of top surface at different
times
Time (s) 320 400 420 500 520 600 620 700 720 800
Microwave power On Off On Off On Off On Off On Off
Experimental
temperature 60 50 62 51 64 51.8 64.7 47 62 45.9
Model temperature 57.6 49.5 59.6 51.0 61.6 52.5 63.5 54.0 65.4 55.5
Distribution and evolution of water and vapour 6.6.2
Predicted distributions of liquid saturation within the sample at different time
intervals are presented in Figure 6-4. It can be seen that unlike the convection drying
(in Figure 5-6), the liquid saturation is slightly higher close to the surface at the
beginning of the drying. This is due to the fact that pressure gradient is higher near
the surface making the convective flow higher. This result indicates invaluable
evidence signifying that by supplying more drying air during the initial stage of
IMCD, the excess moisture at the surface can be removed. Thus, the drying rate can
be further improved. Similar higher saturation in microwave heating was found by
(Wei et al., 1985), throughout the heating period. Since they neglected mass transfer,
the phenomena persisted throughout the process, whereas in the case of drying, it
only last first few minutes.
Figure 6-4. Spatial distribution of water saturation with times
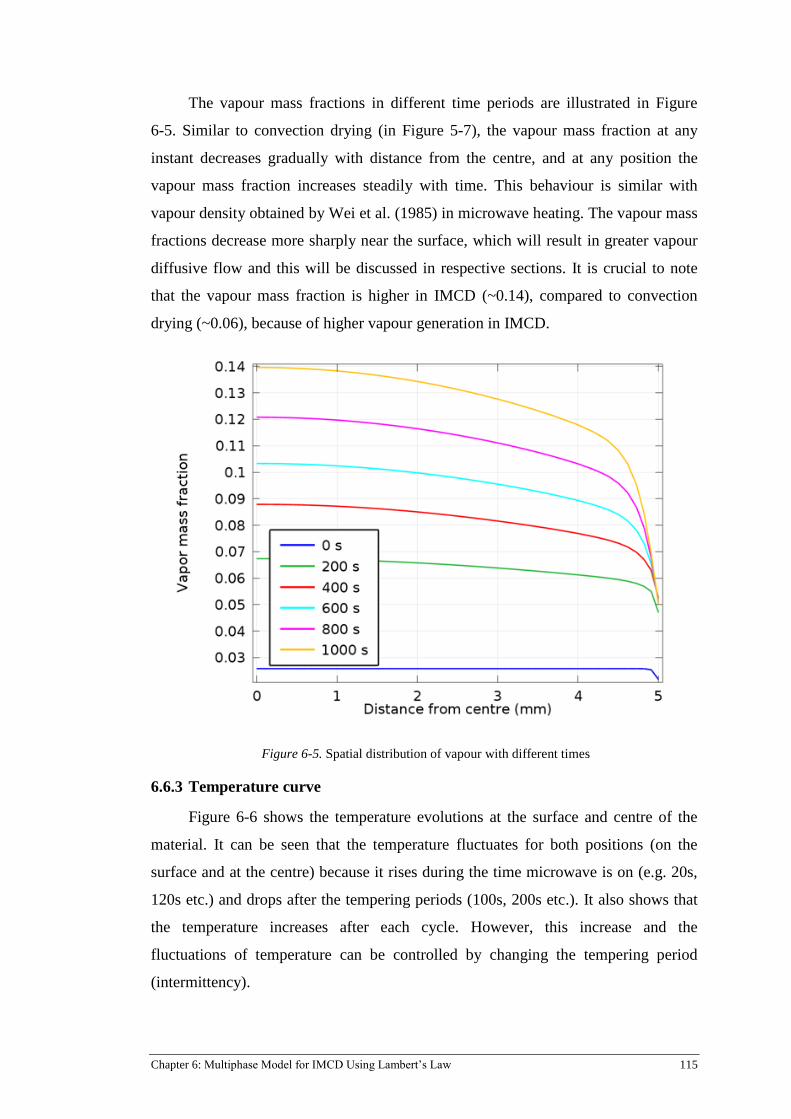
Chapter 6: Multiphase Model for IMCD Using Lambert’s Law 115
The vapour mass fractions in different time periods are illustrated in Figure
6-5. Similar to convection drying (in Figure 5-7), the vapour mass fraction at any
instant decreases gradually with distance from the centre, and at any position the
vapour mass fraction increases steadily with time. This behaviour is similar with
vapour density obtained by Wei et al. (1985) in microwave heating. The vapour mass
fractions decrease more sharply near the surface, which will result in greater vapour
diffusive flow and this will be discussed in respective sections. It is crucial to note
that the vapour mass fraction is higher in IMCD (~0.14), compared to convection
drying (~0.06), because of higher vapour generation in IMCD.
Figure 6-5. Spatial distribution of vapour with different times
Temperature curve 6.6.3
Figure 6-6 shows the temperature evolutions at the surface and centre of the
material. It can be seen that the temperature fluctuates for both positions (on the
surface and at the centre) because it rises during the time microwave is on (e.g. 20s,
120s etc.) and drops after the tempering periods (100s, 200s etc.). It also shows that
the temperature increases after each cycle. However, this increase and the
fluctuations of temperature can be controlled by changing the tempering period
(intermittency).
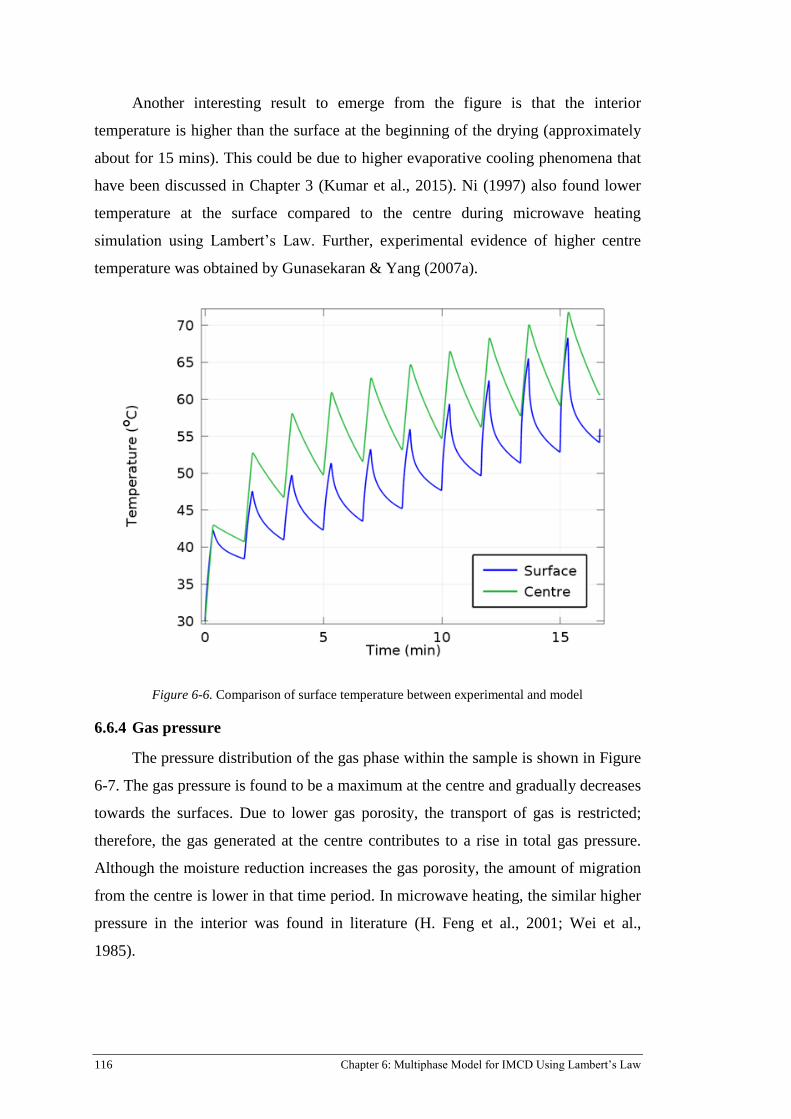
116 Chapter 6: Multiphase Model for IMCD Using Lambert’s Law
Another interesting result to emerge from the figure is that the interior
temperature is higher than the surface at the beginning of the drying (approximately
about for 15 mins). This could be due to higher evaporative cooling phenomena that
have been discussed in Chapter 3 (Kumar et al., 2015). Ni (1997) also found lower
temperature at the surface compared to the centre during microwave heating
simulation using Lambert’s Law. Further, experimental evidence of higher centre
temperature was obtained by Gunasekaran & Yang (2007a).
Figure 6-6. Comparison of surface temperature between experimental and model
Gas pressure 6.6.4
The pressure distribution of the gas phase within the sample is shown in Figure
6-7. The gas pressure is found to be a maximum at the centre and gradually decreases
towards the surfaces. Due to lower gas porosity, the transport of gas is restricted;
therefore, the gas generated at the centre contributes to a rise in total gas pressure.
Although the moisture reduction increases the gas porosity, the amount of migration
from the centre is lower in that time period. In microwave heating, the similar higher
pressure in the interior was found in literature (H. Feng et al., 2001; Wei et al.,
1985).
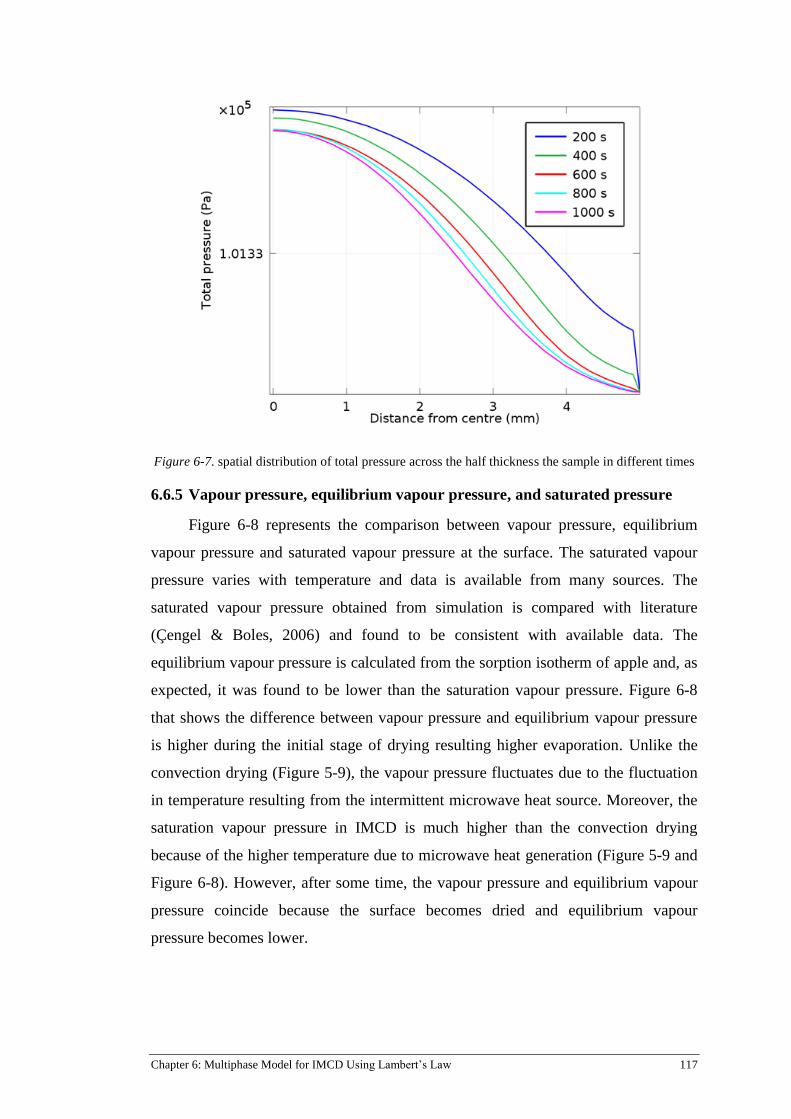
Chapter 6: Multiphase Model for IMCD Using Lambert’s Law 117
Figure 6-7. spatial distribution of total pressure across the half thickness the sample in different times
Vapour pressure, equilibrium vapour pressure, and saturated pressure 6.6.5
Figure 6-8 represents the comparison between vapour pressure, equilibrium
vapour pressure and saturated vapour pressure at the surface. The saturated vapour
pressure varies with temperature and data is available from many sources. The
saturated vapour pressure obtained from simulation is compared with literature
(Çengel & Boles, 2006) and found to be consistent with available data. The
equilibrium vapour pressure is calculated from the sorption isotherm of apple and, as
expected, it was found to be lower than the saturation vapour pressure. Figure 6-8
that shows the difference between vapour pressure and equilibrium vapour pressure
is higher during the initial stage of drying resulting higher evaporation. Unlike the
convection drying (Figure 5-9), the vapour pressure fluctuates due to the fluctuation
in temperature resulting from the intermittent microwave heat source. Moreover, the
saturation vapour pressure in IMCD is much higher than the convection drying
because of the higher temperature due to microwave heat generation (Figure 5-9 and
Figure 6-8). However, after some time, the vapour pressure and equilibrium vapour
pressure coincide because the surface becomes dried and equilibrium vapour
pressure becomes lower.
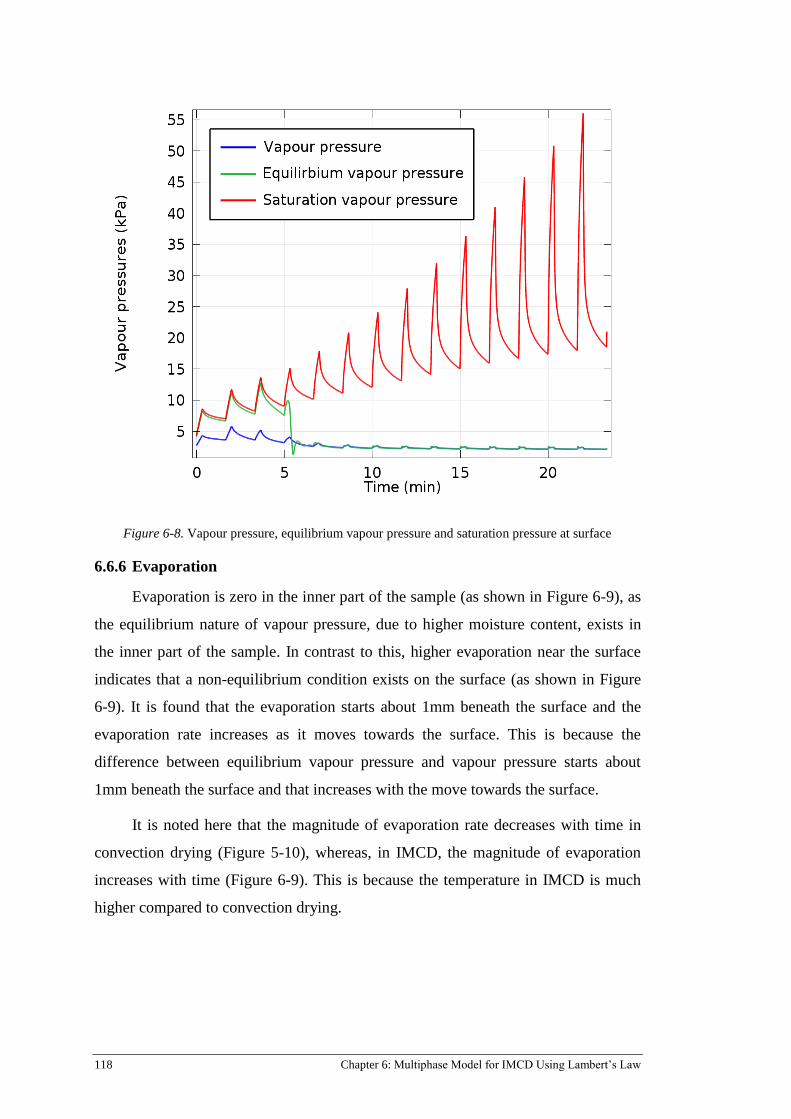
118 Chapter 6: Multiphase Model for IMCD Using Lambert’s Law
Figure 6-8. Vapour pressure, equilibrium vapour pressure and saturation pressure at surface
Evaporation 6.6.6
Evaporation is zero in the inner part of the sample (as shown in Figure 6-9), as
the equilibrium nature of vapour pressure, due to higher moisture content, exists in
the inner part of the sample. In contrast to this, higher evaporation near the surface
indicates that a non-equilibrium condition exists on the surface (as shown in Figure
6-9). It is found that the evaporation starts about 1mm beneath the surface and the
evaporation rate increases as it moves towards the surface. This is because the
difference between equilibrium vapour pressure and vapour pressure starts about
1mm beneath the surface and that increases with the move towards the surface.
It is noted here that the magnitude of evaporation rate decreases with time in
convection drying (Figure 5-10), whereas, in IMCD, the magnitude of evaporation
increases with time (Figure 6-9). This is because the temperature in IMCD is much
higher compared to convection drying.
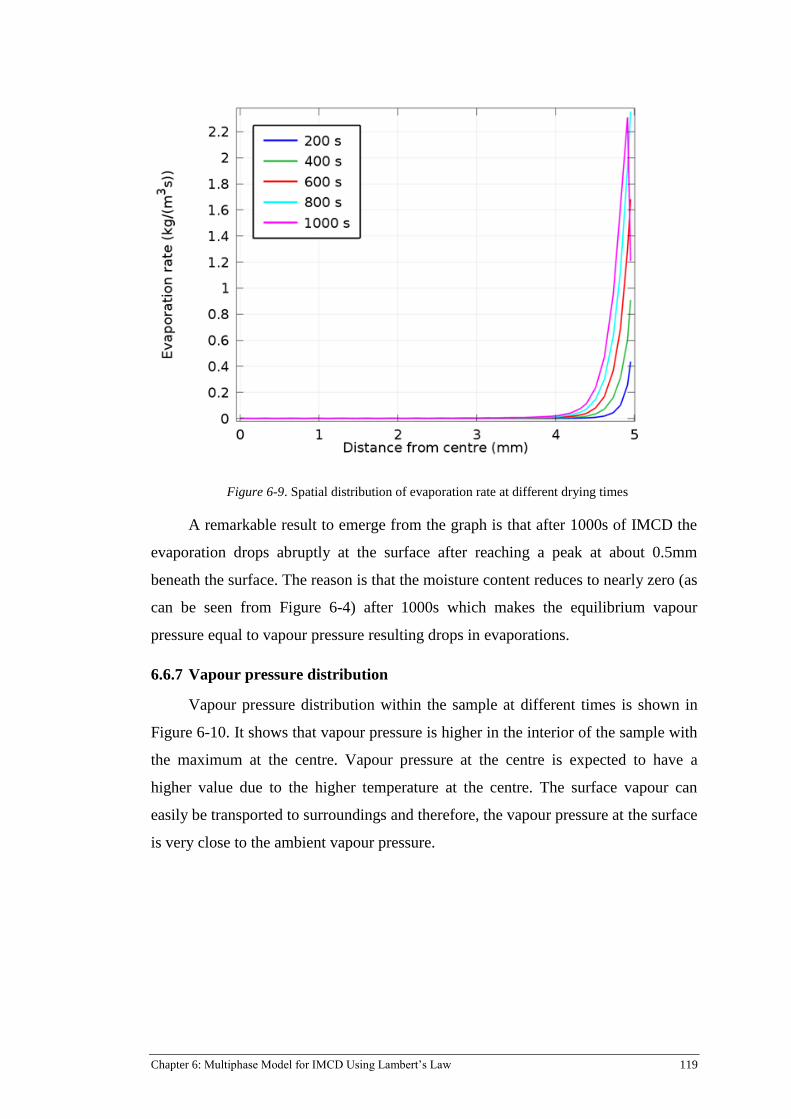
Chapter 6: Multiphase Model for IMCD Using Lambert’s Law 119
Figure 6-9. Spatial distribution of evaporation rate at different drying times
A remarkable result to emerge from the graph is that after 1000s of IMCD the
evaporation drops abruptly at the surface after reaching a peak at about 0.5mm
beneath the surface. The reason is that the moisture content reduces to nearly zero (as
can be seen from Figure 6-4) after 1000s which makes the equilibrium vapour
pressure equal to vapour pressure resulting drops in evaporations.
Vapour pressure distribution 6.6.7
Vapour pressure distribution within the sample at different times is shown in
Figure 6-10. It shows that vapour pressure is higher in the interior of the sample with
the maximum at the centre. Vapour pressure at the centre is expected to have a
higher value due to the higher temperature at the centre. The surface vapour can
easily be transported to surroundings and therefore, the vapour pressure at the surface
is very close to the ambient vapour pressure.

120 Chapter 6: Multiphase Model for IMCD Using Lambert’s Law
Figure 6-10. Spatial distribution of evaporation rate at different drying times
Vapour and water fluxes 6.6.8
Moisture fluxes due to capillary diffusion and gas pressure gradient are
presented in Figure 6-11 and Figure 6-12, respectively. It can be seen that the
moisture flux due to capillary diffusion is approximately double that when compared
to convection drying (Figure 5-11 and Figure 6-11). This is mainly due to the
increase in concentration gradient resulted from the faster drying rate in IMCD as
compared to convection drying.
The most striking feature from the result is that the water flux due to gas
pressure in IMCD (Figure 6-12) is approximately 20 times higher than that in
convection drying (Figure 5-12). This higher transport of the moisture to the surface
is eventually being evaporated at the surface, which is the main reason behind the
significant reduction in drying time during IMCD.

Chapter 6: Multiphase Model for IMCD Using Lambert’s Law 121
Figure 6-11. Water flux due to capillary at different drying times
Figure 6-12. Water flux due to gas pressure at different drying times
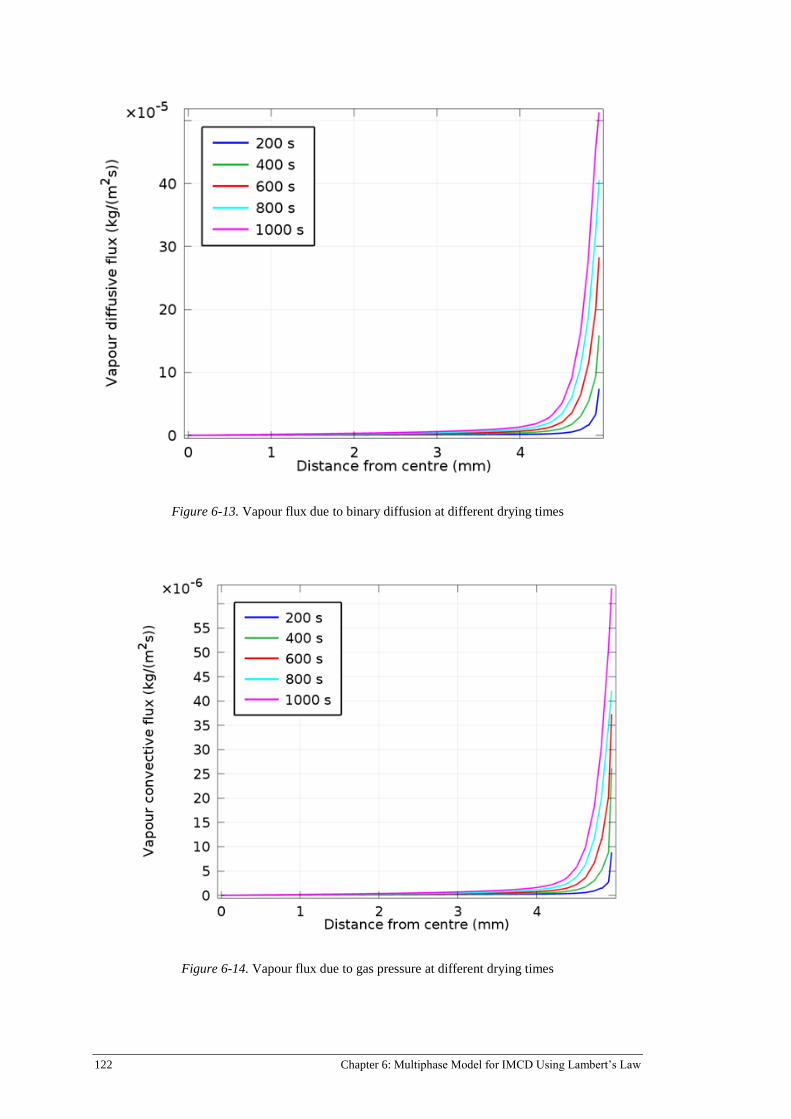
122 Chapter 6: Multiphase Model for IMCD Using Lambert’s Law
Figure 6-13. Vapour flux due to binary diffusion at different drying times
Figure 6-14. Vapour flux due to gas pressure at different drying times

Chapter 6: Multiphase Model for IMCD Using Lambert’s Law 123
Figure 6-13 and Figure 6-14 show the spatial distribution of diffusive and
convective fluxes of vapour, respectively. The figures show that the vapour fluxes
from both sources (diffusion and convection) are higher near the surface with zero in
the core region. This can be interpreted from Figure 6-5, as it shows that the gradient
of vapour is very high near the surface thus causing higher diffusive flux. Wei et al.
(1985) also found higher vapour flux near the surface of the sample during
microwave heating. Moreover, the vapour flux due to binary diffusion and pressure
gradient are about 5 times higher when compared to convention drying.
Limitation of Lambert’s Law 6.6.9
Since this study is the first attempt of using multiphase porous media to model
for IMCD, it considered Lamberts Law for microwave power absorption. However,
some limitations of using Lambert’s Law have been observed during the simulations.
Lambert’s law for power absorption due to microwave energy cannot capture the
uneven distribution, as it considers power absorption on the surface or on any other
horizontal plane is uniform, which is not the actual case. This study revealed another
limitation of Lambert’s Law, which was not mentioned before in the literature;
namely, the power absorption at the surface is always the maximum regardless of the
moisture content. It is well known that moisture or dipolar materials are mainly
responsible for microwave absorption (Joardder, Kumar, et al., 2014b) . Therefore,
when the surface becomes dry, the microwave absorption should be less. Lamberts
law fails to take this into account, giving always highest power at the surface,
irrespective of moisture content. Using Maxwell’s equations of electromagnetic field
and power absorption provide better and accurate heat generation due to microwaves.
6.7 CONCLUSIONS
A non-equilibrium multiphase porous media model has been developed for
IMCD for food. This model is first of its kind as a multiphase model has not been
implemented before for IMCD. The model was validated by comparing experimental
moisture and temperature data, which demonstrated good agreement except for some
discrepancy in temperature at the beginning. This discrepancy in temperature
prediction could be due Lambert’s Law approximation. The IMCD drying is much
faster than the convection drying, and the reason behind this was investigated by
analysing the relative contribution of various modes of transport. It showed that the

124 Chapter 6: Multiphase Model for IMCD Using Lambert’s Law
water flux due to capillary is three times higher and due to gas pressure gradient is
ten times higher when compared to convection drying. On the other hand, the vapour
fluxes due to diffusion and gas pressure is about ten times higher than for convection
drying. The fundamental basis of the model enables us to enhance the understanding
of drying kinetics and transport of heat and mass of IMCD.

Chapter 7: Multiphase Model for IMCD Using Maxwell’s Equations 125
Multiphase Model for IMCD Chapter 7:
Using Maxwell’s Equations
In the previous IMCD model described in Chapters 4 and 6, heat generation
due to microwave energy was calculated using Lambert’s Law. Since the Lambert’s
Law models showed some discrepancy in temperature prediction and failed to
capture the uneven temperature distribution of the sample, this Chapter therefore,
aims to overcome those problems. Unlike Lambert’s Law for heat generation
outlined previously, this chapter calculates heat generation due to microwaves from
the actual electromagnetic field calculated by Maxwell’s equations. Thus, this
Chapter presents the most comprehensive model for IMCD, which solves a three-
dimensional electromagnetic field using Maxwell’s equation to obtained microwave
heat generation, and multiphase porous media for heat and mass transfer.
This Chapter features the following publication:
C. Kumar, M. U. H. Joardder, M. A. Karim, and T.W. Farrell (2015) A
3D coupled electromagnetic and multiphase porous media model for
IMCD of food material. Food and Bioprocess Technology, (To be
submitted, IF 3.1)
Preliminary work of this chapter was published as:
C. Kumar, M. U. H. Joardder, M. A. Karim, G. J. Millar, and Z.M. Amin
(2014) Temperature redistribution modelling during intermittent
microwave convective heating. Procedia Engineering, 90(0), 544-549.
doi: http://dx.doi.org/10.1016/j.proeng.2014.11.770

126 Chapter 7: Multiphase Model for IMCD Using Maxwell’s Equations
The signed “statement of contribution” form for the above papers are given
below:

Chapter 7: Multiphase Model for IMCD Using Maxwell’s Equations 127
7.1 ABSTRACT
Intermittent Microwave Convective Drying (IMCD) improves energy
efficiency and the product quality during drying of food. However, the physical
mechanism of heat and mass transfer involved in IMCD is poorly understood due to
lack of a comprehensive mathematical model of this process. A multiphase porous
media model considering coupled electromagnetics and multiphase porous media can
potentially provide fundamental details of underlying mechanism of IMCD. An
accurate model is also necessary for optimization of the process. In this study, a
mathematical model considering electromagnetics using Maxwell’s equations
coupled with multiphase porous media in 3D is developed. The multiphase porous
media model for heat and mass transport processes includes different phases, namely,
solid, liquid water, and gas and incorporates pressure driven flow, capillary flow, and
evaporation in the material. The result shows the temperature is uneven in the
materials with hot spots and cold spots after each heating period and then
temperature re-distributed during the tempering period to level off. The water and
vapour fluxes showed asymmetric profile along the diameter of the sample due to
non-uniformity of the microwave heating pattern. The detail understanding of these
transport mechanism in IMCD, in turn, will lead to a significant improvement in food
quality, energy efficiency, increased ability to automation and optimization during
IMCD process.
7.2 INTRODUCTION
IMCD significantly reduces drying time and improves product quality
compared to convection drying, and overcome the problem of overheating in
continuous microwave convective drying (CMCD). The advantages of IMCD in
terms of energy efficiency and dried product quality have been reported in the
literature. For instance, Soysal et al.(2009a) reported that IMCD of red pepper
produced better sensory attributes, appearance, colour, texture and overall liking,
than CMCD and convection drying. Soysal et al. (2009b) compared IMCD and
convective drying for oregano and found that the IMCD were 4.7–11.2 times more
energy efficient compared to convective drying and able to provide better quality
dried food. Advantages of IMCD in terms of improving energy efficiency and
product quality, and significantly reducing drying times have been found in many
other products such as Oregano (Soysal et al., 2009b), Pineapple (Botha et al., 2012),

128 Chapter 7: Multiphase Model for IMCD Using Maxwell’s Equations
Red pepper (Soysal et al., 2009a), Sage (Salvia officinalis) Leaves (Esturk, 2012;
Esturk et al., 2011), Bananas (Ahrné et al., 2007), Carrots and mushrooms (Orsat et
al., 2007). However, all the above studies regarding IMCD were conducted
experimentally, without considering the physics behind the heat and mass transfer
involved in the process. Therefore, the heat and mass transport mechanism in IMCD
is not well understood.
Physical understanding of heat and mass transfer, and interaction of
microwaves with food products is crucial for optimization of the drying process (Hao
Feng et al., 2012). A coupled heat and mass transfer model has to be developed to
predict the temperature and moisture distribution inside the material that will help to
improve the understanding of the underlying physics and develop better control of
IMCD.
There are some modelling studies related to continuous microwave convective
drying (CMCD) found in the literature. Most of them are empirical in nature or
consider only single-phase transport (diffusion based) (Chen et al., 2014; Malafronte
et al., 2012; Pitchai et al., 2012). Moreover, intermittency of microwave has not been
dealt with in those models. Therefore, they are unable to provide a proper
understanding of the transport process during IMCD. On the other hand, despite
there being some single phase models which consider the intermittency of
microwave heat source (Gunasekaran & Yang, 2007b; Yang & Gunasekaran, 2001),
these are only for heating without considering mass transfer, and thus cannot be
applied in drying. Moreover, the temperature redistribution during tempering period,
which is the main advantages of IMCD, has been overlooked in those studies. Taken
together, all the above modelling approaches consider only single phase for mass
transport.
Compared to single phase models, the multiphase models are more
comprehensive and are fundamental to proper understanding of the process (A. K.
Datta, 2007b; Whitaker, 1977). Furthermore, multiphase models are computationally
effective and applied to wide range of food processing such as frying (Bansal et al.,
2014; H. Ni & Datta, 1999), microwave heating (Chen et al., 2014; Rakesh et al.,
2010), puffing (Rakesh & Datta, 2013), baking (J. Zhang et al., 2005), meat cooking
(Dhall & Datta, 2011) etc. However, application of these non-equilibrium models in

Chapter 7: Multiphase Model for IMCD Using Maxwell’s Equations 129
drying of food materials is very limited. In particular, for IMCD there is no
multiphase model to investigate the transport mechanism during the process.
Moreover, the above mentioned model for CMCD and intermittent microwave
heating models considered Lambert’s Law for microwave heat generation. However,
this theory considers exponential attenuation of microwave absorption within the
product which does not accurately represent food-heating situations in a multimode
cavity such as a microwave oven where the electric field varies in three directions
(Chandrasekaran et al., 2012; Rakesh et al., 2009). The limitations of Lambert’s Law
in IMCD have been discussed in Chapter 6 (section 6.6.9). Chandrasekaran et al.
(2012) reported that Maxwell’s equation provided a more accurate solution for
microwave propagation in samples. Therefore, Maxwell’s equation needs to be
implemented for the accurate calculation of microwave heat generation. In the light
of the above literature review, it is clear that a comprehensive mathematical model
considering multiphase transport of heat and mass and Maxwell’s equation for IMCD
is not available, which is essential for a comprehensive understanding of heat and
mass transfer phenomena involved.
Therefore, in this study, first a 3D coupled electromagnetics with multiphase
porous media transport model for IMCD was developed; then, the model was
validated with experimental data. Subsequently, the model is used to investigate the
different transport mechanism of vapour and water.
7.3 MODEL DEVELOPMENT
In this study, the electromagnetic field is solved in all domains including the
oven cavity, waveguide, glass tray and the sample. (as shown in Figure 7-1). The
transport of mass and energy is solved only in the food sample. Unlike the previous
IMCD models (Chapters 4 and 6), the heat generation due to microwaves in this
chapter is calculated from the actual electric field distribution obtained by Maxwell’s
equation. However, the multiphase heat and mass transfer here is also based on the
formulations developed in Chapter 5.
Geometry and problem description 7.3.1
The schematic of the computational domain along with the different transport
mechanisms involved in food is shown in Figure 7-1.

130 Chapter 7: Multiphase Model for IMCD Using Maxwell’s Equations
Figure 7-1. a) The computational domain for the IMCD drying simulation, b) Food sample and
representative elementary volume (REV) showing transport mechanism involved in the simulation

Chapter 7: Multiphase Model for IMCD Using Maxwell’s Equations 131
Figure 7-1a shows the geometric model which includes oven cavity,
waveguide, food sample, and glass tray. The microwaves are transmitted into the
cavity through the rectangular waveguide on the right side of the cavity. The food
product is placed at the centre of the turntable. The apple slice is considered as a
porous media and the pores are filled with three transportable phases, namely liquid
water, air, and water vapour as shown in Figure 7-1b. All phases (solid, liquid, and
gases) are continuous and local thermal equilibrium is valid, which means that the
temperatures in all three phases are equal. Liquid water transport takes place due to
convective flow due to gas pressure gradient, capillary flow and evaporation. Vapour
and air transport occur due to convective flow arises from gas pressure gradient and
binary diffusion.
Maxwell’s equation for electromagnetics and heat generation 7.3.2
Maxwell’s equations provide the electromagnetic field at any point in the
computational domain. In frequency domain, the Maxwell’s equation can be written
as (Chen et al., 2014; COMSOL, 2014)
0''')2(1 2
Ei
c
fE
7-1
where E
is the electric field strength (V/m), f is the microwave frequency (Hz), c is
the speed of light (m/s), ' , '' , are the dielectric constant, dielectric loss factor,
and electromagnetic permeability of the material, respectively.
The heat generation due to microwave, mQ (W/m3), given by (COMSOL,
2012),
mlrhm QQQ . 7-2
Here, rhQ is the resistive loss (W/m3) and mlQ is the magnetic loss (W/m
3). For
food products the magnetic losses are negligible, i.e. 0mlQ (Chen et al., 2014).
The resistive loss can be calculated as (Chen et al., 2014; Wentworth, 2004)
*5.0 EJQrh
7-3

132 Chapter 7: Multiphase Model for IMCD Using Maxwell’s Equations
where *E
is the conjugate of E
and the electric current density J
(A/m2) is given
by,
EfEJ
02 , 7-4
where, is the electrical conductivity (S/m), is the dielectric loss factor and 0 is
permittivity in free space.
Substituting the above into equation 7-2, the microwave heat generation due to
can be written as,
2
0 EfQm 7-5
which conforms with the heat generations equation derived by Metaxas (1996a).
Dielectric properties 7.3.3
The dielectric properties of a material defines how much microwave energy
will be converted to heat and thus is very important in microwave heating
(Chandrasekaran et al., 2013). Granny Smith apple was used as a sample in this study
and the dielectric properties for Granny Smith apple with moisture change are
reported by Martín et al. (2006). Here we use the data of Martín-Esparza et al. (2006)
in a quadratic regression analysis in which the intercept of the ' and versus wbM
graph was set to 0.1 in order to avoid numerical singularity in ' and when wbM
is zero. The resulting quadratic expression are found to be,
1.0289.30638.36'2
wbwb MM 7-6
and 1.0.8150.26543.132
wbwb MM . 7-7
Here, wbM is the moisture content (wet basis).
Multiphase porous media transport model 7.3.4
The multiphase heat and mass transport model in this chapter is also similar to
that in Chapter 5 with an additional heat generation term calculated from
electromagnetic field distribution as discussed above.

Chapter 7: Multiphase Model for IMCD Using Maxwell’s Equations 133
Mass conservation equations
The representative elementary volume, V (m3), is the sum of the volume
occupied by gas gV (m3), water wV (m
3), and solid sV (m
3), given by,
swg VVVV 7-8
The apparent porosity, , is defined as the volume fraction occupied by gas and
water.
V
VV wg
7-9
Saturation of water, wS , and gas, gS is defined as the fraction of pore volume
occupied by that particular phase, namely,
V
V
VV
VS w
gw
ww
7-10
and w
g
gw
g
g SV
V
VV
VS
1
7-11
respectively.
The mass concentrations of water, wc (kg/m3), vapour, vc (kg/m
3), and air, ac
(kg/m3), are given by equations 7-12, 7-13, and 7-14, respectively:
www Sc 7-12
gv
v SRT
pc 7-13
ga
a SRT
pc
7-14
where, w is the density of water (kg/m3), R is the universal gas constant (J/mol/K),
and T is the temperature of product (0K), vp is the partial pressure of vapour (Pa),
ap is the partial pressure of air (Pa).
The conservation equation for the liquid water, vapour and air in the porous
medium is given by,

134 Chapter 7: Multiphase Model for IMCD Using Maxwell’s Equations
evapwww RnSt
,
7-15
evapvvgg RnSt
,
7-16
and va 1 7-17
respectively.
Here, wn
is water flux (kg/m2s), vn
is the vapour mass flux (kg/m
2s), evapR is
the evaporation rate of liquid water to water vapour (kg/m3s), v is the mass fraction
of vapour, and a the mass fraction of air.
The flux values for water and vapour component are defined as:
wc
w
wrw
ww cDPkk
n
, 7-18
and vgeffgg
v
grg
vgv DSPkk
n
,
, 7-19
respectively. Here, wk is the intrinsic permeability of water (m2), wrk , is the relative
permeability of water, and w is the viscosity of water (Pa.s), cD is the capillary
diffusivity (m2/s), P total gas pressure (Pa), gk is the intrinsic permeability of gas
(m2), grk , is the relative permeability of gas (m
2), and g is the viscosity of gas (Pa.s)
and geffD , is the binary diffusivity of vapour and air (m2/s).
Continuity equation to solve for gas pressure
The gas phase consists of an ideal mixture of water vapour and air. The gas
pressure, P, may be determined via a total mass balance for the gas phase, namely,
evapgg RnS
t
g 7-20
Where, the gas flux, gn
, is given by,
Pkk
ni
grg
gg
,
7-21

Chapter 7: Multiphase Model for IMCD Using Maxwell’s Equations 135
and the density of gas phase, g , is given by,
RT
PM gg 7-22
where, gM is the molecular weight of gas (kg/mol).
Energy equation
Since the thermal equilibrium is assumed across all phases, the energy balance
equation can be written as,
)(tfQRhTkhnhnt
Tc mevapfgeffwwggeffpeff
7-23
where, T is the temperature (0C), gh is the enthalpy of gas (J), wh is the enthalpy of
water (J), fgh is the latent heat of evaporation (J/kg), eff is the effective density
(kg/m3),
effpc is the effective specific heat (J/kg/K), effk is the effective thermal
conductivity (W/m/K), f(t) is an intermittency function which was discussed in
section 4.5. Equation 5-20 considers energy transport due to conduction and
convection and energy sources/sinks due to evaporation/condensation.
The thermo physical properties of the mixture are obtained by the volume
weighted average of the different phases by the following equations,
swwggeff SS 1 7-24
pspwwpggeffp ccScSc 1 7-25
and sthwthwgthgeff kkSkSk ,,, 1 7-26
where s is the solid density (kg/m3); pgc , pwc , and psc are the specific heat
capacities of gas, water, and solid (J/kg/K), respectively; gthk , , wthk , , and sthk , are the
thermal conductivities of gas, water, and solid, (W/m/K) respectively.
Evaporation or condensation
The porous media model incorporates the change of phase between liquid
water and vapour (evaporation or condensation) through the following expression (A.
Halder et al., 2007a)

136 Chapter 7: Multiphase Model for IMCD Using Maxwell’s Equations
veqvv
evapevap ppRT
MKR , 7-27
where, vM is the molecular weight of vapour, eqvp , is the equilibrium vapour pressure
(Pa), vp is the vapour pressure (Pa), and Kevap is a constant, which is material and
process-dependent signifying the rate constant of evaporation (Gulati & Datta, 2013)
and is the reciprocal of equilibration time, Δt (1/s).
The equilibrium vapour pressure, eqvp , , for apple is given by (Ratti et al.,
1989),
)](ln[232.0182.0exp)(0411.0949.43696.0
,, TPMeMTPp satdb
M
dbsatveqv
7-28
where, satvP , is the saturation vapour pressure (Pa) and M is the moisture content (dry
basis), which can be calculated by water and vapour concentration:
s
vwdb
ccM
1 7-29
The saturated vapour pressure, satvP , , is calculated by (Vega-Mercado et al.,
2001),
))ln(656.61001445.0
104176.00486.03915.1/2206.5800exp(
37
24
,
TTx
TxTTP satv
7-30
The vapour pressure vp is obtained from Ideal Gas Law.
Initial conditions 7.3.5
The initial conditions for equations 7-1, 7-15, 7-16, 7-20, and 7-23 are given
by,
0)0( tE
, 7-31
0)0( wwtw Sc , 7-32
0262.0)0( tvw , 7-33
ambt PP )0( , 7-34
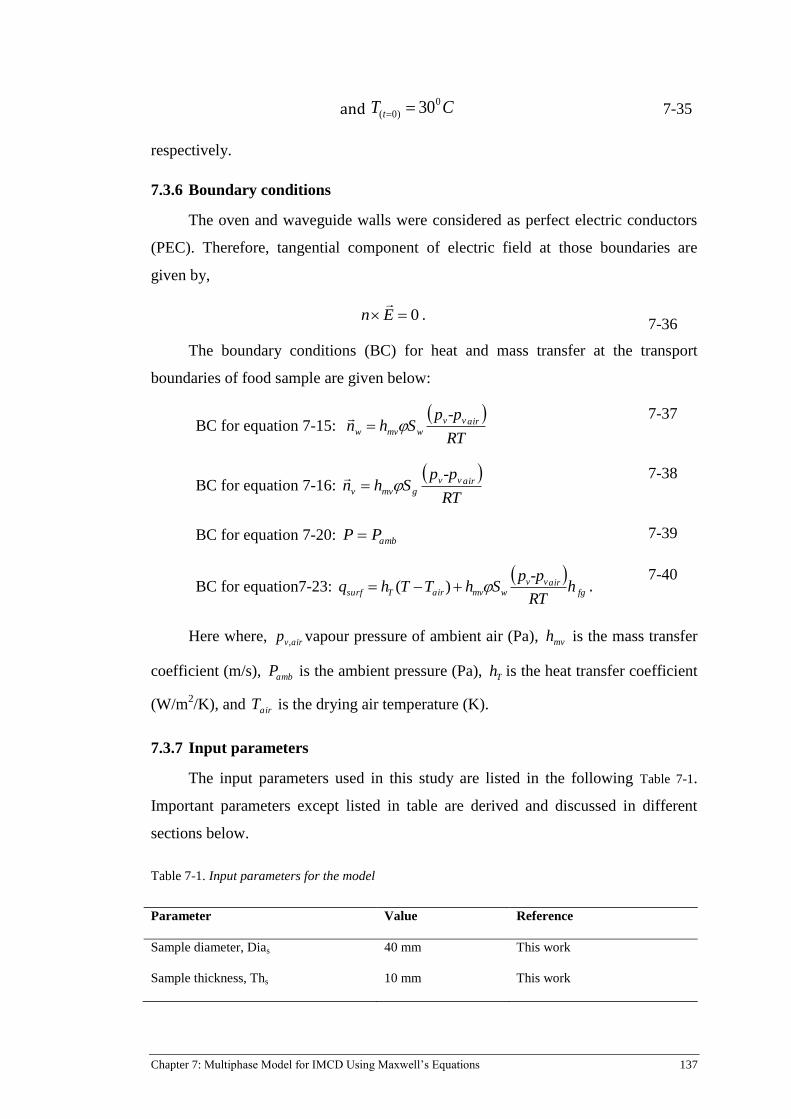
Chapter 7: Multiphase Model for IMCD Using Maxwell’s Equations 137
and CT t
0
)0( 30 7-35
respectively.
Boundary conditions 7.3.6
The oven and waveguide walls were considered as perfect electric conductors
(PEC). Therefore, tangential component of electric field at those boundaries are
given by,
0En
. 7-36
The boundary conditions (BC) for heat and mass transfer at the transport
boundaries of food sample are given below:
BC for equation 7-15:
RT
-ppShn airvv
wmvw
7-37
BC for equation 7-16:
RT
-ppShn airvv
gmvv
7-38
BC for equation 7-20: ambPP 7-39
BC for equation7-23:
fgairvv
wmvairTsurf hRT
-ppShTThq )( .
7-40
Here where, airvp , vapour pressure of ambient air (Pa), mvh is the mass transfer
coefficient (m/s), ambP is the ambient pressure (Pa), Th is the heat transfer coefficient
(W/m2/K), and airT is the drying air temperature (K).
Input parameters 7.3.7
The input parameters used in this study are listed in the following Table 7-1.
Important parameters except listed in table are derived and discussed in different
sections below.
Table 7-1. Input parameters for the model
Parameter Value Reference
Sample diameter, Dias 40 mm This work
Sample thickness, Ths 10 mm This work

138 Chapter 7: Multiphase Model for IMCD Using Maxwell’s Equations
Parameter Value Reference
Equivalent porosity, initial, 0.922 (Haitao Ni, 1997; Rahman,
2008).
Water saturation, initial, 0.794 (Haitao Ni, 1997; Rahman,
2008).
Initial saturation of vapour, 0.15 (Haitao Ni, 1997; Rahman,
2008).
Gas saturation, initial, 0.19 (Haitao Ni, 1997; Rahman,
2008).
Initial temperature, T0 303K
Vapour mass fraction, 0.026 Calculated
Constants
Evaporation constant, Kevap 1000 This work
Drying air temperature, Tair 333K This work
Universal gas constant, Rg 8.314 J mol-1
K-1
(Çengel & Boles, 2006)
Molecular weight of water, 𝑀𝑤 18.016 g mol-1
(Çengel & Boles, 2006)
Molecular weight of vapour, 𝑀𝑣 18.016 g mol-1
(Çengel & Boles, 2006)
Molecular weight of gas (air), 𝑀𝑎 28.966 g mol-1
(Çengel & Boles, 2006)
Latent heat of evaporation, ℎ𝑓𝑔 2.26e6 J kg-1
(Çengel & Boles, 2006)
Ambient pressure, 𝑃𝑎𝑚𝑏 101325 Pa (Çengel & Boles, 2006)
Gas intricsic permeability, kg (H. Feng et al., 2004).
Binary diffusivity, (A. K. Datta, 2007b).
Ambient vapour pressure, Calculated
Heat transfer coefficient, 16.746 W/(m2K) Calculated
Mass transfer coefficient, 0.017904 m/s Calculated
Thermo-physical properties
Specific heat
Apple solid, 𝐶𝑝𝑠 3734 J kg-1
K-1
Measured
Water, 𝐶𝑝𝑤 4183 J kg-1
K-1
(Carr et al., 2013)
Vapour, 𝐶𝑝𝑣 1900 J kg-1
K-1
(Carr et al., 2013)
0
0wS
0vS
vw
212100.4 m
vaD sm /106.2 26
airvp ,Pa2992
Th
mh
Chapter 7: Multiphase Model for IMCD Using Maxwell’s Equations 139
Parameter Value Reference
Air, 𝐶𝑝𝑎 1005.68 J kg-1
K-1
(Carr et al., 2013)
Thermal conductivity
Apple solid, 0.46 W m-1
K-1
(Choi & Okos, 1986)
Gas, 0.026 W m-1
K-1
(Rakesh et al., 2012)
Water, 0.644 W m-1
K-1
(Rakesh et al., 2012)
Density
Apple solid, 𝜌𝑠 1419 kg m-3
This study
Vapour, Ideal gas law, kg m-3
Air, Ideal gas law, kg m-3
Water, 1000, kg m-3
Permeability
The intrinsic permeability of water is considered as a function of porosity by
Kozeny-Carman model (H. Feng et al., 2004) as,
77.039.0
110578.5
2
312
wk . 7-41
The gas intrinsic for apple is considered as 212100.4 m (H. Feng et al., 2004).
In this study, the relative permeablities were considered as a function of water
sarutaion given by (H. Feng et al., 2004),
3
, wwr Sk , 7-42
and wS
gr ek86.10
, 01.1
, 7-43
respectively.
Viscosity of water and gas
Viscosities of water (Truscott, 2004) and gas (Gulati & Datta, 2013) as a
function of temperature are given by,
T
ww e
1540143.19
7-44
sthk ,
gthk ,
wthk ,
v
v
w
140 Chapter 7: Multiphase Model for IMCD Using Maxwell’s Equations
and65.0
3
27310017.0
T
g . 7-45
Effective gas diffusivity
The effective gas diffusivity can be calculated as a function of gas saturation
and porosity according to Bruggeman correction (Haitao Ni, 1997) given by,
3/4
, gvageff SDD . 7-46
Here, vaD is binary diffusivity between air and water vapour (m2/s).
Capillary diffusivity of liquid water
Capillary diffusivity of liquid water assumed to be dependent on the saturation
only, as given by:
wbc MD 888.6exp101 8 . 7-47
Details of the formulation of water capillary diffusivity for apple are given in
Chapter 5.
The relationship between dry basis moisture content, dbM , and wet basis
moisture content, wbM , is given by,
wb
wbdb
M
MM
1. 7-48
Numerical solution 7.3.8
Engineering simulation software COMSOL multiphysics 4.4 was used to solve
these equations. Because of being the most complex model in this thesis, the
simulation procedure using COMSOL Multiphysics for this model is shown in
Figure 7-2.

Chapter 7: Multiphase Model for IMCD Using Maxwell’s Equations 141
Figure 7-2. Flow chart showing the modelling strategy in COMSOL Multiphysics
To ensure that the results are grid-independent, several grid sensitivity tests
were conducted. It was found that the current simulation results are independent of
the grid chosen in this study. The time stepping was chosen as 1s to solve the
equations. For the food sample, finer mesh with a maximum element size 3mm was
chosen. For the rest of the domains, physics controlled mesh was chosen to solve the
electromagnetics. The simulation was performed using a Windows 7 with Intel Core
i7 CPU, 3.4GHz processor and 24GB of RAM.
7.4 MATERIALS AND METHODS
In this section the experimental procedure, sample preparation, and
intermittency of input microwave power is discussed. The experiments were
conducted without rotating the turntable to identify the uneven temperature
distribution of the sample.
IMCD drying
The IMCD drying was achieved by heating the sample in the microwave oven
for 20s then drying for 80s in the convection dryer. The experiments were conducted
with a Panasonic Microwave Oven (Model NNST663W) having inverter technology
with cavity dimension 352mm (W) x230mm (H) x347mm (D). The inverter
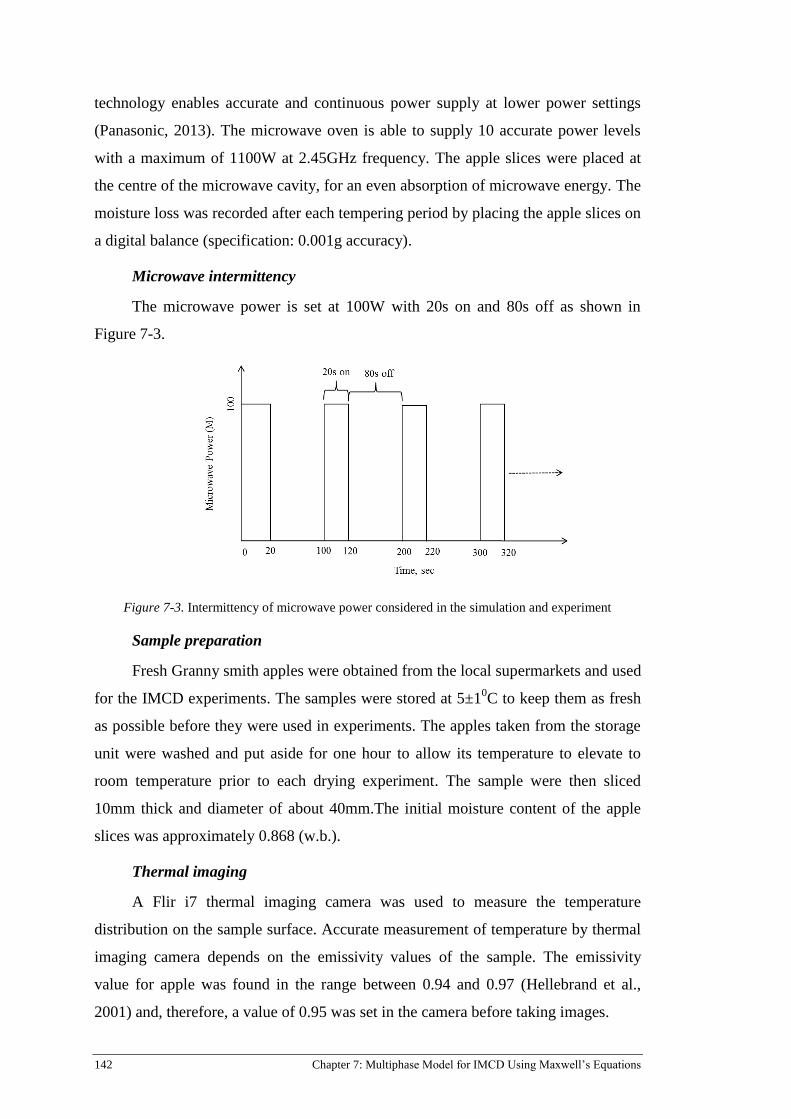
142 Chapter 7: Multiphase Model for IMCD Using Maxwell’s Equations
technology enables accurate and continuous power supply at lower power settings
(Panasonic, 2013). The microwave oven is able to supply 10 accurate power levels
with a maximum of 1100W at 2.45GHz frequency. The apple slices were placed at
the centre of the microwave cavity, for an even absorption of microwave energy. The
moisture loss was recorded after each tempering period by placing the apple slices on
a digital balance (specification: 0.001g accuracy).
Microwave intermittency
The microwave power is set at 100W with 20s on and 80s off as shown in
Figure 7-3.
Figure 7-3. Intermittency of microwave power considered in the simulation and experiment
Sample preparation
Fresh Granny smith apples were obtained from the local supermarkets and used
for the IMCD experiments. The samples were stored at 5±10C to keep them as fresh
as possible before they were used in experiments. The apples taken from the storage
unit were washed and put aside for one hour to allow its temperature to elevate to
room temperature prior to each drying experiment. The sample were then sliced
10mm thick and diameter of about 40mm.The initial moisture content of the apple
slices was approximately 0.868 (w.b.).
Thermal imaging
A Flir i7 thermal imaging camera was used to measure the temperature
distribution on the sample surface. Accurate measurement of temperature by thermal
imaging camera depends on the emissivity values of the sample. The emissivity
value for apple was found in the range between 0.94 and 0.97 (Hellebrand et al.,
2001) and, therefore, a value of 0.95 was set in the camera before taking images.

Chapter 7: Multiphase Model for IMCD Using Maxwell’s Equations 143
7.5 RESULTS AND DISCUSSION
In this section, experimental results are presented and validation of the model
is discussed, followed by description of temperature redistribution, moisture and
pressure distribution in the sample. To comprehensively understand the process, the
water and vapour fluxes due to different mechanism are also investigated using the
model.
Experimental validation of temperature and moisture content 7.5.1
Experimental validation is critical for the developed IMCD model considering
the complexity involved. Validation of the model was conducted by comparing the
average moisture content of the sample and temperature distribution and re-
distribution obtained from the thermal imaging camera. The temperature
distributions were compared for both after heating and tempering periods to clarify
the effect of intermittency of microwave heating pattern.
Average moisture content
Figure 7-4 compares the average moisture content obtained from experiments
and simulation. The model shows good agreement with the experimental data. Both
experiment and model show that the moisture content of the sample after 1000s
drops from 6.6 kg/kg dry basis to about 4.5 kg/kg dry basis.
Figure 7-4. Average moisture content obtained from experiments and simulation

144 Chapter 7: Multiphase Model for IMCD Using Maxwell’s Equations
Temperature redistribution
Temperature redistribution is very crucial for IMCD because this determines
the optimum microwave power level and intermittency. According to the best of
author’s knowledge, this is the first time that temperature redistribution due to
intermittent application of microwave is being investigated.
Spatial temperature distribution on the top of the surface of the sample
obtained from experiment and simulation is shown in Figure 7-5. The image presents
the temperature distribution after each heating cycle (20s, 120s etc.) followed by
temperature distribution after each tempering period (100s, 200s etc.). It can be seen
that the temperature rises after each heating period and then decreases near to the
drying air temperature (500C) during the tempering period; this occurs both in
modelling and experimentation. The model also captures the dispersion of the
concentrated hot spot (after heating) during the tempering period. Thus, the result
offers vital evidence of the temperature redistribution after each tempering period,
which helps to limit the temperature in next heating cycle. Consequently, it improves
the drying rate and prevents the material from overheating. Moreover, a desired
temperature or uniformity can be achieved by controlling the intermittency of the
microwave for IMCD.

Chapter 7: Multiphase Model for IMCD Using Maxwell’s Equations 145
Figure 7-5. Temperature distribution obtained from experiment and simulations
The dispersion pattern of heat energy during intermittency is also captured by
the model. However, there are some discrepancies in the location of the hot spot
predicted by the model (i.e. shifting to right). The discrepancy could be due to the
difficulties in modelling actual geometry of the microwave oven. The microwave
oven had some internal dents and a curved surface which was not considered in the
actual geometry of the model, which could be sources for discrepancies. Moreover,
positioning of the sample was done manually which also could introduce some error
in the location of the sample. However, it is very likely that if the geometry is
accurately modelled, the error would be reduced. Nonetheless, the magnitude of the
temperature rise and fall, dispersion of the hot spot during tempering is well captured
by the models which provide valuable information for understanding IMCD and
product quality.

146 Chapter 7: Multiphase Model for IMCD Using Maxwell’s Equations
Internal temperature distribution 7.5.2
As can be seen from the previous figure (Figure 7-5), the temperature
distribution is uneven across the diameter of the sample in IMCD, therefore, on order
to investigate the temperature distribution closely, the temperature profile along the
horizontal centreline of the sample at different times is shown in Figure 7-6.
Moreover, since the temperature along the thickness of the sample is almost the
same, the average temperature (or point temperature or temperature across thickness)
cannot provide a genuine investigation of IMCD. For this reason all the later results
from simulation are presented along the diameter of the sample.
Figure 7-6. Temperature profile along horizontal centreline of the sample at different times
In Figure 7-6 the temperature is plotted for a number of heating periods (20s,
120s etc.) and tempering periods (100s, 200s etc.). This allows investigating the
temperature distribution and redistribution inside the sample. It can be seen that the
temperature profile is asymmetric with hotter on the right hand side of the sample
demonstrating uneven heating due to the microwaves, whereas, the temperature
profiles were symmetric for convection drying (Chapter 5) and the IMCD model
with Lambert’s Law (Chapter 4 and 6). In contrast to those studies, the IMCD model
that considers Maxwell’s equation can capture the asymmetric temperature profile
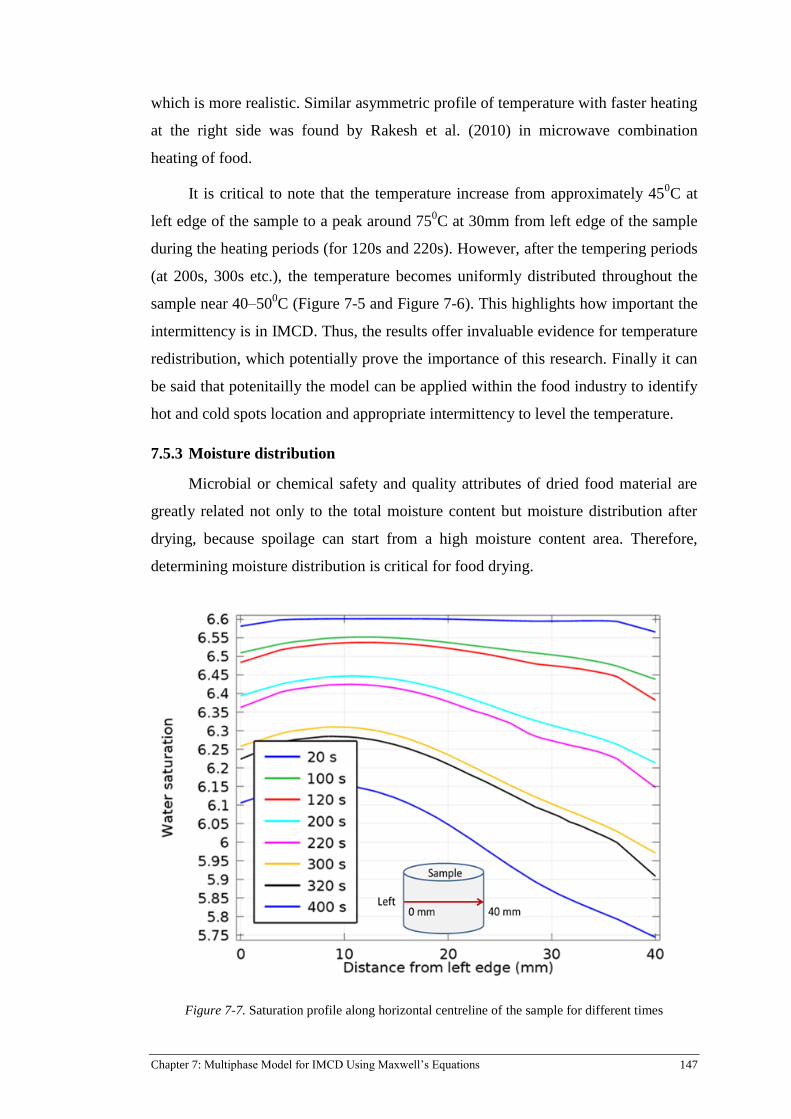
Chapter 7: Multiphase Model for IMCD Using Maxwell’s Equations 147
which is more realistic. Similar asymmetric profile of temperature with faster heating
at the right side was found by Rakesh et al. (2010) in microwave combination
heating of food.
It is critical to note that the temperature increase from approximately 450C at
left edge of the sample to a peak around 750C at 30mm from left edge of the sample
during the heating periods (for 120s and 220s). However, after the tempering periods
(at 200s, 300s etc.), the temperature becomes uniformly distributed throughout the
sample near 40–500C (Figure 7-5 and Figure 7-6). This highlights how important the
intermittency is in IMCD. Thus, the results offer invaluable evidence for temperature
redistribution, which potentially prove the importance of this research. Finally it can
be said that potenitailly the model can be applied within the food industry to identify
hot and cold spots location and appropriate intermittency to level the temperature.
Moisture distribution 7.5.3
Microbial or chemical safety and quality attributes of dried food material are
greatly related not only to the total moisture content but moisture distribution after
drying, because spoilage can start from a high moisture content area. Therefore,
determining moisture distribution is critical for food drying.
Figure 7-7. Saturation profile along horizontal centreline of the sample for different times

148 Chapter 7: Multiphase Model for IMCD Using Maxwell’s Equations
The spatial liquid saturation profiles of the sample along the horizontal
centreline at different time are plotted in Figure 7-7. The figure shows asymmetric
profile saturation with lower water saturation on the right had side. The water
saturation is highest about 1mm depth from the left edge. The asymmetric behaviour
is due to the higher temperature on the right side of the sample. The higher
temperature results higher vapour pressure on the right side of the sample,
consequently, higher moisture loss. Therefore, the liquid saturation is lower on the
right side of the sample compared to the left. However, experimental verification of
this phenomenon would be valuable and assist researchers to optimize the process.
Vapour concentration distribution 7.5.4
Vapour density profile along the centreline of the sample is shown in Figure
7-8. The vapour concentration is lower on the surfaces and peaks at 30mm from the
left edge where the temperature is higher (as shown in Figure 7-6). This nature of
vapour density correlates with the temperature distribution. For this reason, the
higher density of vapour is found exactly at the point where the maximum
temperature is to be found at any particular time of drying. The lower vapour density
at the surface is because of the transport of moisture to the ambient air.
Figure 7-8. Vapour density profile along horizontal centreline of the sample at different times

Chapter 7: Multiphase Model for IMCD Using Maxwell’s Equations 149
Pressure 7.5.5
Pressure distribution (Figure 7-9) shows that the pressure is higher inside the
sample. The pressure also peaks at 30mm from the left edge where the temperature is
higher. However, at both surfaces (left and right) the pressure remains at ambient
pressure. The pressure profile is asymmetric and Turner (1991) found the similar
trend of pressure in CMCD of wood. Similar higher temperatures in the inner parts
and ambient temperature at the surface was found in microwave heating by Wei et al
(1985).
Figure 7-9. Pressure profile along horizontal centreline of the sample for different times
Another important observation in Figure 7-9 is that the pressure reaches its
peaks after heating period (120s, 220s) as the pressure varies with temperature and
drops back near atmospheric pressure (101325Pa) after the tempering period.
One important point is to note that the asymmetric profiles temperature, vapour
concentration, and pressure presented here cannot be captured by any simple model
that considers only a single-phase model or Lamberts Law.

150 Chapter 7: Multiphase Model for IMCD Using Maxwell’s Equations
Vapour pressure distribution 7.5.6
The distribution of vapour pressure within selected time period is shown in
Figure 7-10. The vapour pressures are higher near the higher temperature regions (as
can be seen from Figure 7-6 and Figure 7-10). Figure 7-10 shows that the vapour
pressure increases after each heating cycle (20s, 120s etc.), and then decreases during
the tempering periods (100s, 200s etc.). However, for all times, it is lower on the left
side of the sample because of the lower temperature in that region and remains
almost steady for about 0–10mm from left edge. It is crucial to note that the
fluctuations in vapour pressure levels are dampened during the tempering periods
therefore causing less moisture loss during those periods. Moreover, the location
moisture loss also can be explained form this graph. Since the higher vapour pressure
causes more moisture loss, the drying rate is faster on the right side of the sample.
Figure 7-10. Vapour pressure along the horizontal centreline of the sample
Water and vapour fluxes 7.5.7
Moisture fluxes due to capillary diffusion and gas pressure gradient along the
horizontal centreline of the sample are plotted in Figure 7-11 and Figure 7-12,
respectively. It shows that the flux due to capillary diffusion is positive from the
distance of 10mm from left edge and negative for less than 10mm distance from left

Chapter 7: Multiphase Model for IMCD Using Maxwell’s Equations 151
surface. This indicates the water flux is moving towards right edge from 10mm and
onwards, whereas, for less that 10mm from left edge of the sample the directions of
water flux towards the left edge. It is interesting to note that, the moisture flux
increase near the surface; this could be due to the higher moisture gradient near the
surface. The right hand side of the sample contains lower moisture content, and
therefore, the concentration gradient is higher and thus causing higher capillary flux.
The abrupt increase in water diffusive flux near surface was also found higher in
meat cooking by Dhall at al. (2012).
Figure 7-11. Water capillary flux along horizontal centreline of the sample at different times
The water flux due to gas pressure (Figure 7-12) shows that the after the
tempering periods (200s, 300s etc.), the flux due to pressure gradient is negligible
compared to that of after heating periods (120s, 220s etc.). It can be seen that the
moisture flux due to gas pressure is six times higher compared to convection drying
(Figure 5-12), which makes the IMCD faster. Moreover, the magnitudes of flux
increases with time in IMCD whereas in convection drying it decreases with time.
This could be due the higher pressure generation due to volumetric microwave
heating during the IMCD than in convective drying.

152 Chapter 7: Multiphase Model for IMCD Using Maxwell’s Equations
Figure 7-12. Water flux due to gas pressure along horizontal centreline of the sample for different
times
Figure 7-13 and Figure 7-14 shows the spatial distribution of vapour fluxes due
to binary diffusion and gas pressure gradient, respectively. The figures shows that
vapour fluxes from both sources are positive on the right edge of the sample (starting
from about 30mm) and negative for 15mm to 28mm. This can be explained from the
vapour density (Figure 7-8) and pressure (Figure 7-9) profiles, respectively. The
vapour concentration curve (Figure 7-8) shows that the vapour concentration is the
highest near 30mm from the left edge and gradually decreases with distance in both
direction. Therefore, the vapour concentration gradient is positive from 30mm
onwards indicating positive flux and flow towards the right edge of the sample and
vice versa. However, at the far left edge (0mm to 10mm), where vapour gradient is
almost zero, the vapour flux is also minimum.
Similarly, the vapour flux due to gas pressure is positive for the right side
(30mm onwards) of the sample due to positive pressure gradient and negative on the
left of 30mm, due to negative pressure gradient. In general, the fluxes of vapour from
both sources are higher during the heating periods and lower in the tempering periods
which indicating higher moisture migrations during the heating periods.

Chapter 7: Multiphase Model for IMCD Using Maxwell’s Equations 153
Figure 7-13. Vapour flux due to gas pressure along horizontal centreline of the sample for different
times
Figure 7-14. Vapour flux due to gas pressure along horizontal centreline of the sample for different
times
154 Chapter 7: Multiphase Model for IMCD Using Maxwell’s Equations
It is noted that, all the fluxes are negligible near the left edge of the sample
except for water flux due to capillary diffusion. Therefore, the transport of moisture
to the left edge is only due to capillary diffusion, whereas all other fluxes including
capillary diffusion are higher near the right edge causing more moisture loss. This
also justifies the lower water saturation on the right side of the sample. This
information provides an important implication for IMCD if a specific part of the
sample needs drying.
7.6 CONCLUSIONS
In this study, a novel IMCD model is developed which considers complex
coupling between electromagnetics using Maxwell’s equations in 3D and multiphase
porous media for transport. Therefore, this model provided more realistic and uneven
temperature distribution, showing hot spots and cold spots due to microwave heating,
which was not possible to investigate from the previous models. Moreover, this
model provided asymmetric distribution of pressure, vapour mas fractions, moisture
and vapour fluxes, in contrast to models based on Lambert’s Law which considered
symmetry. Although the coupling of different physics present unmatched difficulties,
the application of such models is required for better insight and prediction of critical
parameters such as microwave energy deposition, temperature and moisture
distribution, evaporation and fluxes due to different mechanisms. Understanding of
these factors can, in turn, lead to a significant improvement in food quality, energy
efficiency, increased ability to automation and optimization.
The major conclusions from the work can be summarized as follows:
1) Multiphase porous media models for IMCD considering Maxwell’s equation
for electromagnetics were developed and the model’s predicted values agrees with
experimental data reasonably well.
2) IMCD produces uneven temperature distribution during the heating periods
and the temperature redistributes during the tempering period creating more uniform
distribution. The model captures these phenomena which are very useful for
understanding and optimizing the process and which cannot be done by simpler
model.

Chapter 7: Multiphase Model for IMCD Using Maxwell’s Equations 155
3) Intermittency of microwave in IMCD can help to control the material
temperature, thus the model can be used to find the optimum value for both the
microwave power level and the intermittency for better product quality.
4) The moisture fluxes due to capillary diffusion and gas pressure gradient, and
the vapour flux due to binary diffusion and gas pressure gradient were asymmetric
and higher than those obtained through convection drying. The fluxes due to the gas
pressure gradient are also higher in magnitude during the heating period than the
tempering period which indicating higher convective flow during heating.

Chapter 7: Multiphase Model for IMCD Using Maxwell’s Equations 156

Chapter 8: Conclusion and Future Recommendation 157
Conclusion and Future Chapter 8:
Recommendation
8.1 OVERALL SUMMARY
IMCD is an advanced drying technology that can significantly reduce drying
times and improve product quality during drying. Mathematical modelling is
essential for understanding and optimizing it. Particularly, understanding the physical
mechanism of heat and mass transfer during IMCD is a key element for optimizing
and achieving better insight into the process. The aim of the current research was to
develop a comprehensive mathematical model that to enhance the understating of
transport of moisture and energy during IMCD, which was a significant research gap
in the arena of food drying. The outcome of the models and related innovations lead
to eight peer reviewed journal papers.
The study was initiated with a single phase convection drying model to identify
the best way of defining an effective diffusion coefficient (Chapter 3). Then the
model was used to develop first an IMCD model which calculates the microwave
power generation using Lambert’s Law (Chapter 4). The IMCD model was validated
with experimental data and then was used to investigate the temperature
redistribution during IMCD. However, these models (Chapter 3 and 4) were single
phase and considered an overall moisture flux by an effective diffusivity term
obtained from the experiments. Therefore, the subsequent three chapters (Chapter 5
to 7) endeavour to develop a multiphase porous media model, which are more
comprehensive and advanced models for transport of energy and mass inside the
porous media.
In Chapter 5, a multiphase porous media model for the convection drying of
food has been developed. Following this, two IMCD models considering Lambert’s
Law and Maxwell’s equations in Chapter 6 and 7, respectively, were developed. The
relative advantages and disadvantages of these models have been identified and
discussed. The multiphase models provide more comprehensive insight about
transport mechanisms of different phases inside food materials such as liquid water,
water vapour and air. Moreover, it enables the investigation of the evaporation rate

158 Chapter 8: Conclusion and Future Recommendation
and pressure generations inside the material. Furthermore, the fluxes of water due to
capillary diffusion and pressure driven, as well as the fluxes of vapour due to binary
diffusion and pressure driven also has been investigated in the IMCD process.
Moreover, the IMCD model considering Maxwell’s equation (Chapter 7) provides
further details of spatial temperature and moisture distribution compared to the
model that considered Lamberts Law (Chapter 6).
The overall outcome of the thesis was the better understanding of the heat and
mass transfer involved in IMCD including temperature redistribution, and moisture
and vapour fluxes due to different mechanisms achieved by mathematical modelling
and associated experimentation. The final model for IMCD which coupled non-
equilibrium multiphase porous media with 3D electromagnetic heat generation using
Maxwell’s equations has successfully fulfilled the main aim of this research. The
modelling enhances the understanding of IMCD and will help to optimize the
process for better energy efficiency and product quality. The sequential
developments of the models were presented in Chapter 3 to Chapter 7.
This is the first time a study has systematically investigated the complex drying
problem. We started with a very basic diffusion based single-phase model and
gradually improved our modelling to evolve into a comprehensive multiphase IMCD
model. An advantage of this systematic development is that the limitations and
challenges of each model, and associated assumptions are clearly identified and
demonstrated. The section below (Section 8.2) presents the major conclusion from all
the models.
8.2 CONCLUSIONS
The study investigated the heat and mass transfer process in both convection
drying and IMCD through mathematical modelling which were validated by
experimentation. The major conclusions are:
Effective diffusivity as a function of both temperature and moisture needs
to be considered for better description of drying process in single phase
drying model (Chapter 3)(Kumar et al., 2015).
The diffusion model for convection drying shows evaporative cooling
phenomena which can be used to control surface temperature and improve
product quality (Chapter 3) (Kumar et al., 2015).

Chapter 8: Conclusion and Future Recommendation 159
The single phase model of IMCD with Lambert’s Law can predict the
overall moisture content but fails to capture the actual uneven distribution
of temperature and moisture in the sample (Chapter 4 and 6).
The single phase models lump all water fluxes with an effective diffusion
coefficient, but this assumption cannot be justified under all situations
(Chapter 3). One such situation is IMCD, where pressure driven flow and
evaporation is involved. Therefore, to investigate IMCD accurately
multiphase models need to be developed and considered (Chapter 4).
The non-equilibrium multiphase porous media model developed was able
to determine the relative contributions of various modes of transport and
phase changes such as capillary pressure, gas pressure and evaporation,
which is not possible through experiments and/or single phase models
(Chapter 5).
Multiphase porous media models for IMCD showed that the higher fluxes
of vapour and water due to gas pressure make the IMCD faster (Chapter 6
and Chapter 7). This is a significant finding as these cannot be determined
by the single-phase model.
The temperature drops during the tempering period helps limit the
maximum sample temperature, which is the main advantage of IMCD
(Chapter 6 and Chapter 7).
However, Lamberts law for microwave heat generation consideration
cannot capture the actual distribution of temperature and moisture of the
sample (Chapter 6).
The multiphase porous media IMCD model with Maxwell’s equation
provides far better insight including uneven temperature and moisture
distribution and redistribution in comparison to Lamberts law (Chapter 7).
Determination of this uneven distribution of temperature and moisture in
microwave drying establishes the necessity of intermittency in microwave
drying. Uneven temperature and moisture distribution has significant
effect on quality of the product. Once actual (uneven) distribution is
known (which is not possible with other models), necessary measures can
be taken to overcome this problem. One of the ways to deal with that is the
application of the correct microwave power level and intermittency.

160 Chapter 8: Conclusion and Future Recommendation
The intermittency of microwaves helps to level off temperature, and
reduce the temperature differential between hot spots and cold spots, thus
it can provide better a option to control the product temperature and finally
improve the food quality (Chapter 7).
The final IMCD model was used to investigate the transport of each phase
due to various mechanisms (pressure driven, capillary driven, binary
diffusion, evaporation) and it also demonstrated the asymmetric profile
moisture, temperature and fluxes (Chapter 6 and Chapter 7).
The final multiphase IMCD models provide a very in-depth understanding of
IMCD drying mechanism enabling investigation of moisture distribution,
temperature distribution and redistribution, evaporation, and fluxes due to different
mechanisms. These understanding of IMCD are essential to understand the effect of
process parameters on food quality and drying kinetics; and eventually to optimize
the process.
8.3 CONTRIBUTION TO KNOWLEDGE AND SIGNIFICANCE
Fundamental physics-based mathematical models of IMCD and convection
drying in synergy with relevant experimentations in this thesis provide some useful
contribution to knowledge. The contributions and significance of this research are
listed below:
Compared to the numerous single phase (diffusion based) drying models,
the single-phase model developed in this research (in Chapter 3)
demonstrated better performance. The considerations of the effective
diffusion coefficient as a function of material properties and process
parameters; and material properties as a function of moisture content rather
than assuming a constant make the model more realistic.
In addition to this, the model investigated evaporative cooling phenomena
and its application in quality improvement. This has never been
investigated before.
The governing equations, input parameters and variables for implementing
a multiphase porous media model for apple is presented which will serve
the as a basis for modelling multiphase porous media modelling in food
drying (Chapter 5).

Chapter 8: Conclusion and Future Recommendation 161
Due to the advanced general multiphase porous media approach, the model
is flexible to implement in different areas of the food process industry, for
example, frying, heating, cooking, and baking. In addition to this, this
model can also be implemented in other applications where transport in
porous media is involved, for example, coal drying, groundwater flow, soil
science, soil mechanics and some biological tissues etc.
The models can easily adapt the solid mechanics to incorporate shrinkage,
which would be more advanced and accurate for lower moisture content.
A fully coupled mathematical model considering 3D electromagnetics and
a multiphase porous media model for IMCD was used to investigate
different phenomena such as pressure driven flow, capillary flow, binary
diffusion, pressure development and evaporation. Such a model for IMCD
has not been implemented earlier (Chapter 7).
This research developed the very first IMCD model that investigates the
temperature redistribution and its effect on the transports (Chapter 4, 6 and
7).
The 3D model for couple electromagnetics and heat and mass transfer
developed in this thesis can be used in the food industry to identify hot and
cold spots, in microwave product development and in producing better
cooking instruction. Moreover, the model can play a significant role in
microwave cavity design to achieve more uniform electric field
distribution and thus improve heating.
Food researchers and scientists will experience a number of benefits from
the models, particularly simulating and understanding the transport
mechanism of heat and mass under different process conditions and
different materials (IMCD and convection).
The industry can be enormously benefited by the IMCD models which
have great potential to choose the appropriate microwave power and its
intermittency to maintain suitable temperature. Thus, it allows avoiding
overheating that improves the quality of the product.
8.4 LIMITATIONS
Though this study developed comprehensive mathematical models for food
drying application, there are still several limitation that need to be clarified.

162 Chapter 8: Conclusion and Future Recommendation
Due to lack to time and appropriate experimental facilities, further
validations of spatial temperature and moisture distribution inside the
product were not possible in this study.
The capillary flow was assumed with a function of moisture content rather
than calculated from capillary pressure because the variation of capillary
pressure in apple tissue was not found in literature.
In this study, all the water is assumed to be free to transport i.e. the bound
water which could be bound to the cell wall have different mechanism of
transport is neglected.
The shrinkage of the sample is neglected in this study.
The uneven interior surface of the microwave cavity and actual waveguide
geometry was difficult to measure and model. A simpler geometry
(ignoring the dents and curves) was modelled.
8.5 FUTURE DIRECTION
To overcome the above-mentioned limitations and to advance the knowledge
of IMCD, the following suggestions and recommendations are proposed.
Magnetic Resonance Imaging (MRI) or other suitable method can be used
to determine the spatial moisture and temperature profile.
Two phases of liquid water; namely, bound water and free water can be
considered separately in the model. However, further justification of
considering bound water needs to be provided for doing that.
A multi-scale model which considers both porous medium (macro-scale)
with an underlying pore structure (micro-scale) would be very interesting
to see.
Incorporating shrinkage of the sample in the model could provide more
advanced and accurate results.
To study the process more comprehensively, a conjugate problems can be
solved which simulates the air flow inside the oven to determine actual
heat and mass transfer coefficients and multiphase porous media model
along with electromagnetics model of microwave heating.
Implementation of the model to determine optimum operating condition
would be beneficial for industry.

Chapter 8: Conclusion and Future Recommendation 163

Bibliography 165
Bibliography
Abbasi Souraki, B., & Mowla, D. (2008). Experimental and theoretical investigation
of drying behaviour of garlic in an inert medium fluidized bed assisted by
microwave. Journal of Food Engineering, 88(4), 438-449.
Ahrné, L. M., Pereira, N. R., Staack, N., & Floberg, P. (2007). Microwave
Convective Drying of Plant Foods at Constant and Variable Microwave
Power. Drying Technology, 25(7-8), 1149-1153.
Andrés, A., Bilbao, C., & Fito, P. (2004). Drying kinetics of apple cylinders under
combined hot air–microwave dehydration. Journal of Food Engineering,
63(1), 71-78.
Arballo, J. R., Campanone, L. A., & Mascheroni, R. H. (2012). Modeling of
Microwave Drying of Fruits. Part II: Effect of Osmotic Pretreatment on the
Microwave Dehydration Process. Drying Technology, 30(4), 404-415.
Arballo, J. R., Campañone, L. A., & Mascheroni, R. H. (2010). Modeling of
Microwave Drying of Fruits. Drying Technology, 28(10), 1178-1184.
Argyropoulos, D., Heindl, A., & Müller, J. (2011). Assessment of convection, hot-air
combined with microwave-vacuum and freeze-drying methods for
mushrooms with regard to product quality. International Journal of Food
Science & Technology, 46(2), 333-342.
Ashim, D. (2001). Methematical Modeling of Microwave Processing of Foods Food
Processing Operations Modeling: CRC Press.
Baini, R., & Langrish, T. A. G. (2007). Choosing an appropriate drying model for
intermittent and continuous drying of bananas. Journal of Food Engineering,
79(1), 330-343.
Bansal, H. S., Takhar, P. S., & Maneerote, J. (2014). Modeling multiscale transport
mechanisms, phase changes and thermomechanics during frying. Food
Research International, 62, 709-717.
Bantle, M., Käfer, T., & Eikevik, T. M. (2013). Model and process simulation of
microwave assisted convective drying of clipfish. Applied Thermal
Engineering, 59(1–2), 675-682.
Barati, E., & Esfahani, J. A. (2011). Mathematical modeling of convective drying:
Lumped temperature and spatially distributed moisture in slab. Energy, 36(4),
2294-2301.
Bart-Plange, A., Addo, A., Ofori, H., & Asare, V. (2012). Thermal properties of gros
michel banana grown in Ghana. ARPN Journal of Engineering and Applied
Sciences, 7(4), 478-484.
Batista, L. M., da Rosa, C. A., & Pinto, L. A. A. (2007). Diffusive model with
variable effective diffusivity considering shrinkage in thin layer drying of
chitosan. Journal of Food Engineering, 81(1), 127-132.
Bear, J. (1972). Dynamics of fluids in porous media: American Elsevier Pub. Co.
Bhattacharya, M., Srivastav, P., & Mishra, H. (2013). Thin-layer modeling of
convective and microwave-convective drying of oyster mushroom (Pleurotus
ostreatus). Journal of Food Science and Technology, 1-10.
Bird, R. B., Stewart, E. W., & Lightfoot, N. E. (2007). Transport Phenomena: John
Wiley & Sons.
166 Bibliography
Botha, G. E., Oliveira, J. C., & Ahrné, L. (2011). Quality optimisation of combined
osmotic dehydration and microwave assisted air drying of pineapple using
constant power emission. Food and Bioproducts Processing, 90(2), 171-179.
Botha, G. E., Oliveira, J. C., & Ahrné, L. (2012). Microwave assisted air drying of
osmotically treated pineapple with variable power programmes. Journal of
Food Engineering, 108(2), 304-311.
Budd, C. J., & Hill, A. D. C. (2011). A comparison of models and methods for
simulating the microwave heating of moist foodstuffs. International Journal
of Heat and Mass Transfer, 54(4), 807-817.
Campañone, L. A., & Zaritzky, N. E. (2005). Mathematical analysis of microwave
heating process. Journal of Food Engineering, 69(3), 359-368.
Carr, E., Turner, I., & Perré, P. (2013). A Dual-Scale Modeling Approach for Drying
Hygroscopic Porous Media. Multiscale Modeling & Simulation, 11(1), 362-
384.
Cengel, Y. A. (2002). Heat transfer A practival approach (Second Edition ed.).
Boston: McGraw-Hill.
Çengel, Y. A., & Boles, M. A. (2006). Thermodynamics: an engineering approach:
McGraw-Hill Higher Education.
Chamchong, M., & Datta, A. K. (1999a). Thawing of foods in a microwave oven: II.
Effect of load geometry and dielectric properties. Journal of Microwave
Power and Electromagnetic Energy, 34(1), 22-32.
Chandra Mohan, V. P., & Talukdar, P. (2010). Three dimensional numerical
modeling of simultaneous heat and moisture transfer in a moist object
subjected to convective drying. International Journal of Heat and Mass
Transfer, 53(21-22), 4638-4650.
Chandrasekaran, S., Ramanathan, S., & Basak, T. (2012). Microwave material
processing-a review. AIChE Journal, 58(2), 330-363.
Chandrasekaran, S., Ramanathan, S., & Basak, T. (2013). Microwave food
processing—A review. Food Research International, 52(1), 243-261.
Chemkhi, S., Jomaa, W., & Zagrouba, F. (2009). Application of a Coupled Thermo-
Hydro-Mechanical Model to Simulate the Drying of Nonsaturated Porous
Media. Drying Technology, 27(7-8), 842-850.
Chen, J., Pitchai, K., Birla, S., Negahban, M., Jones, D., & Subbiah, J. (2014). Heat
and Mass Transport during Microwave Heating of Mashed Potato in
Domestic Oven—Model Development, Validation, and Sensitivity Analysis.
Journal of Food Science, 79(10), E1991-E2004.
Choi, Y., & Okos, M. (1986). Thermal properties of liquid foods: review. MI:
American soceity of agricultural engineers.
Chou, S. K., Chua, K. J., Mujumdar, A. S., Hawlader, M. N. A., & Ho, J. C. (2000).
On the Intermittent Drying of an Agricultural Product. Food and Bioproducts
Processing, 78(4), 193-203.
Chua, K. J., Mujumdar, A. S., & Chou, S. K. (2003). Intermittent drying of
bioproducts––an overview. Bioresource Technology, 90(3), 285-295.
Chua, K. J., Mujumdar, A. S., Chou, S. K., Hawlader, M. N. A., & Ho, J. C. (2000b).
Convective drying of banana, guava and potato pieces : effect of cyclical
variations of air temperature on drying kinetics and color change. Drying
Technology, 18(4-5), 907-936.
Chua, K. J., Mujumdar, A. S., Hawlader, M. N. A., Chou, S. K., & Ho, J. C. (2001a).
Convective drying of agricultural products. effect of continuous and stepwise
change in drying air temperature. Drying Technology, 19(8), 1949-1960.

Bibliography 167
Cihan, A., Kahveci, K., & Hacıhafızoğlu, O. (2007). Modelling of intermittent
drying of thin layer rough rice. Journal of Food Engineering, 79(1), 293-298.
Cinquanta, L., Albanese, D., Fratianni, A., La Fianza, G., & Di Matteo, M. (2013).
Antioxidant activity and sensory attributes of tomatoes dehydrated by
combination of microwave and convective heating. Agro Food Industry Hi-
Tech, 24(6), 35-38.
COMSOL. (2012). RF Module User’s Guide.
COMSOL. (2014). COMSOL multiphysics users' guide.
Cui, Z., Xu, S., & Sun, D. (2004). Microwave–vacuum drying kinetics of carrot
slices. Journal of Food Engineering, 65(2), 157-164.
Darvishi, H., Khoshtaghaza, M. H., Najafi, G., & Nargesi, F. (2013a). Mathematical
Modeling of Green Pepper Drying in Microwave-convective Dryer. Journal
of agricultural science and technology, 15(3), 457-465.
Darvishi, H., Khoshtaghaza, M. H., Najafi, G., & Nargesi, F. (2013b). Mathematical
modeling of green Pepper Drying in microwave-convective dryer. Journal of
agricultural science and technology, 15(3), 457.
Datta, A., & Rakesh, V. (2009). An introduction to modeling of transport processes:
applications to biomedical systems: Cambridge University Press.
Datta, A. K. (2002). Mathematical modeling of microwave processing of foods: An
overview. New York: Marcel Dekker, Inc.
Datta, A. K. (2007a). Porous media approaches to studying simultaneous heat and
mass transfer in food processes. I: Problem formulations. Journal of Food
Engineering, 80(1), 80-95.
Datta, A. K. (2007b). Porous media approaches to studying simultaneous heat and
mass transfer in food processes. II: Property data and representative results.
Journal of Food Engineering, 80(1), 96-110.
Dev, S. R. S., Geetha, P., Orsat, V., Gariépy, Y., & Raghavan, G. S. V. (2011).
Effects of Microwave-Assisted Hot Air Drying and Conventional Hot Air
Drying on the Drying Kinetics, Color, Rehydration, and Volatiles of Moringa
oleifera. Drying Technology, 29(12), 1452-1458.
Dhall, A., & Datta, A. K. (2011). Transport in deformable food materials: A
poromechanics approach. Chemical Engineering Science, 66(24), 6482-6497.
Dhall, A., Halder, A., & Datta, A. K. (2012). Multiphase and multicomponent
transport with phase change during meat cooking. Journal of Food
Engineering, 113(2), 299-309.
Diamante, L. M., Ihns, R., Savage, G. P., & Vanhanen, L. (2010). Short
communication: A new mathematical model for thin layer drying of fruits.
International Journal of Food Science & Technology, 45(9), 1956-1962.
Erbay, Z., & Icier, F. (2010). A Review of Thin Layer Drying of Foods: Theory,
Modeling, and Experimental Results. Critical Reviews in Food Science and
Nutrition, 50(5), 441-464.
Esturk, O. (2012). Intermittent and Continuous Microwave-Convective Air-Drying
Characteristics of Sage (Salvia officinalis) Leaves. Food and Bioprocess
Technology, 5(5), 1664-1673.
Esturk, O., Arslan, M., Soysal, Y., Uremis, I., & Ayhan, Z. (2011). Drying of sage
(Salvia officinalis L.) inflorescences by intermittent and continuous
microwave-convective air combination. Research on Crops, 12(2), 607-615.
Esturk, O., & Soysal, Y. (2010). Drying Properties and Quality Parameters of Dill
Dried with Intermittent and Continuous Microwave-convective Air

168 Bibliography
Treatments. Tarim Bilimleri Dergisi-Journal of Agricultural Sciences, 16(1),
26-36.
Fang, S., Wang, Z., Hu, X., Chen, F., Zhao, G., Liao, X., . . . Zhang, Y. A. N. (2011).
Energy requirement and quality aspects of chinese jujube (zizyphus jujuba
miller) in hot air drying followed by microwave drying. Journal of Food
Process Engineering, 34(2), 491-510.
Farkas, B. E., Singh, R. P., & Rumsey, T. R. (1996). Modeling heat and mass
transfer in immersion frying. I, model development. Journal of Food
Engineering, 29(2), 211-226.
Farrell, T. W., Knight, J. H., Moroney, T. J., Hobson, P. A., Turner, I. W., & Fulford,
G. R. (2012). The mathematical modelling of large-scale bagasse stockpiles.
Feng, H., Tang, J., & Cavalieri, R. P. (2002). Dielectric properties of dehydrated
apples as affected by moisture and temperature. T. ASAE, 45, 129-135.
Feng, H., Tang, J., Cavalieri, R. P., & Plumb, O. A. (2001). Heat and mass transport
in microwave drying of porous materials in a spouted bed. AIChE Journal,
47(7), 1499-1512.
Feng, H., Tang, J., & John Dixon-Warren, S. (2000). Determination of Moisture
Diffusivity of Red Delicious Apple Tissues by Thermogravimetric Analysis.
Drying Technology, 18(6), 1183-1199.
Feng, H., Tang, J., Plumb, O. A., & Cavalieri, R. P. (2004). Intrinsic and relative
permeability for flow of humid air in unsaturated apple tissues. Journal of
Food Engineering, 62(2), 185-192.
Feng, H., Yin, Y., & Tang, J. (2012). Microwave Drying of Food and Agricultural
Materials: Basics and Heat and Mass Transfer Modeling. Food Engineering
Reviews, 4(2), 89-106.
Figiel, A. (2010). Drying kinetics and quality of beetroots dehydrated by
combination of convective and vacuum-microwave methods. Journal of Food
Engineering, 98(4), 461-470.
Golestani, R., Raisi, A., & Aroujalian, A. (2013). Mathematical modeling on air
drying of apples considering shrinkage and variable diffusion coefficient
Drying Technology, 31(1), 40-51.
Gowen, A. A., Abu-Ghannam, N., Frias, J., & Oliveira, J. (2008). Modeling
dehydration and rehydration of cooked soybeans subjected to combined
microwave–hot-air drying. Innovative Food Science & Emerging
Technologies, 9(1), 129-137.
Gulati, T., & Datta, A. K. (2013). Enabling computer-aided food process
engineering: Property estimation equations for transport phenomena-based
models. Journal of Food Engineering, 116(2), 483-504.
Gunasekaran, S. (1999). Pulsed microwave-vacuum drying of food materials. Drying
Technology, 17(3), 395-412.
Gunasekaran, S., & Yang, H.-W. (2007a). Effect of experimental parameters on
temperature distribution during continuous and pulsed microwave heating.
Journal of Food Engineering, 78(4), 1452-1456.
Gunasekaran, S., & Yang, H.-W. (2007b). Optimization of pulsed microwave
heating. Journal of Food Engineering, 78(4), 1457-1462.
Gustavsson, J., Cederberg, C., Sonesson, U., Otterdijk, R. v., & Meybeck, A. (2011).
Global food losses and food waste. Retrieved 2 October 2012, from
http://www.fao.org/ag/ags/ags-division/publications/publication/en/c/74045/

Bibliography 169
Halder, A., Dhall, A., & Datta, A. K. (2007a). An Improved, Easily Implementable,
Porous Media Based Model for Deep-Fat Frying: Part I: Model Development
and Input Parameters. Food and Bioproducts Processing, 85(3), 209-219.
Halder, A., Dhall, A., & Datta, A. K. (2007b). An Improved, Easily Implementable,
Porous Media Based Model for Deep-Fat Frying: Part II: Results, Validation
and Sensitivity Analysis. Food and Bioproducts Processing, 85(3), 220-230.
Halder, A., Dhall, A., & Datta, A. K. (2010). Modeling Transport in Porous Media
With Phase Change: Applications to Food Processing. Journal of heat
transfer, 133(3), 031010-031010.
Hassini, L., Peczalski, R., & Gelet, J.-L. (2013). Combined Convective and
Microwave Drying of Agglomerated Sand: Internal Transfer Modeling with
the Gas Pressure Effect. Drying Technology, 31(8), 898-904.
Hellebrand, H. J., Beuche, H., & Linke, M. (2001). Determination of thermal
emissivity and surface temperature distribution of horticultural products.
Paper presented at the Sixth International Symposium on Fruit, Nut and
Vegetable Production Engineering, Potsdam, Germany.
Hemis, M., Choudhary, R., & Watson, D. G. (2012). A coupled mathematical model
for simultaneous microwave and convective drying of wheat seeds.
Biosystems Engineering, 112(3), 202-209.
Hemis, M., & Raghavan, G. S. V. (2014). Effect of Convective Air Attributes with
Microwave Drying of Soybean: Model Prediction and Experimental
Validation. Drying Technology, 32(5), 543-549.
Hii, C. L., Law, C. L., & Cloke, M. (2009). Modeling using a new thin layer drying
model and product quality of cocoa. Journal of Food Engineering, 90(2),
191-198.
Ho, J. C., Chou, S. K., Chua, K. J., Mujumdar, A. S., & Hawlader, M. N. A. (2002).
Analytical study of cyclic temperature drying: effect on drying kinetics and
product quality. Journal of Food Engineering, 51(1), 65-75.
Holtz, E., Ahrné, L., Rittenauer, M., & Rasmuson, A. (2010). Influence of dielectric
and sorption properties on drying behaviour and energy efficiency during
microwave convective drying of selected food and non-food inorganic
materials. Journal of Food Engineering, 97(2), 144-153.
Ikediala, J., Tang, J., Drake, S., & Neven, L. (2000). Dielectric properties of apple
cultivars and codling moth larvae. Transactions of the ASAE-American
Society of Agricultural Engineers, 43(5), 1175-1184.
Ilknur, A. (2007). Microwave, air and combined microwave–air-drying parameters of
pumpkin slices. LWT - Food Science and Technology, 40(8), 1445-1451.
Islam, M. S., Haque, M. A., & Islam, M. N. (2012). Effects of Drying Parameters on
Dehydration of Green Banana (Musa sepientum) and its Use in Potato
(Solanum tuberosum) Chips Formulation. The Agriculturists, 10(1), 87-97.
Izli, N., & Isik, E. (2014). Color and Microstructure Properties of Tomatoes Dried by
Microwave, Convective, and Microwave-Convective Methods. International
Journal of Food Properties, 18(2), 241-249.
Jindarat, W., Rattanadecho, P., Vongpradubchai, S., & Pianroj, Y. (2011). Analysis
of Energy Consumption in Drying Process of Non-Hygroscopic Porous
Packed Bed Using a Combined Multi-Feed Microwave-Convective Air and
Continuous Belt System (CMCB). Drying Technology, 29(8), 926-938.
Joardder, M. U. H., Karim, A., & Kumar, C. (2013). Effect of temperature
distribution on predicting quality of microwave dehydrated food. Journal of
Mechanical Engineering and Sciences, 5, 562-568.
170 Bibliography
Joardder, M. U. H., Karim, A., Kumar, C., & Brown, R. J. (2014). Effect of cell wall
properties on porosity and shrinkage during drying of Apple. International
Journal of Food Properties, Accepted.
Joardder, M. U. H., Kumar, C., Brown, R. J., & Karim, A. (2015). A micro-level
investigation of the solid displacement method for porosity determination of
dried food. Journal of Food Engineering, Under review.
Joardder, M. U. H., Kumar, C., & Karim, A. (2013, June 24-26). Effect of moisture
and temperature distribution on dried food microstucture and porosity. Paper
presented at the Proceedings of From Model Foods to Food Models: The
DREAM Project International Conference, Nantes, France.
Joardder, M. U. H., Kumar, C., & Karim, A. (2014a). Food Microstructure: The
bridging factor between process parameter and food quality. Critical Reviews
in Food Science and Nutrition, In press.
Joardder, M. U. H., Kumar, C., & Karim, A. (2014b). Food Structure: Its Formation
and Relationships with Other Properties. Critical Reviews in Food Science
and Nutrition, In press.
Jumah, R., Al-Kteimat, E., Al-Hamad, A., & Telfah, E. (2007). Constant and
Intermittent Drying Characteristics of Olive Cake. Drying Technology, 25(9),
1421-1426.
Jumah, R., & Mujumdar, A. S. (2005). Modeling Intermittent Drying Using an
Adaptive Neuro-Fuzzy Inference System. Drying Technology, 23(5), 1075-
1092.
Jumah, R. Y. (1995). Flow and drying characteristics of a rotating jet spouted bed.
(Ph.D. NN08118), McGill University (Canada), CanadaProQuest
Dissertations & Theses (PQDT) database.
Karim, M. A., & Hawlader, M. N. A. (2005a). Mathematical modelling and
experimental investigation of tropical fruits drying. International Journal of
Heat and Mass Transfer, 48(23-24), 4914-4925.
Karim, M. A., & Hawlader, M. N. A. (2005b). Drying characteristics of banana:
theoretical modelling and experimental validation. Journal of Food
Engineering, 70(1), 35-45.
Khraisheh, M. A. M., Cooper, T. J. R., & Magee, T. R. A. (1997). Microwave and air
drying I. Fundamental considerations and assumptions for the simplified
thermal calculations of volumetric power absorption. Journal of Food
Engineering, 33(1–2), 207-219.
Klayborworn, S., Pakdee, W., Rattanadecho, P., & Vongpradubchai, S. (2013).
Effects of material properties on heating processes in two-layered porous
media subjected to microwave energy. International Journal of Heat and
Mass Transfer, 61(0), 397-408.
Kouchakzadeh, A., & Shafeei, S. (2010). Modeling of microwave-convective drying
of pistachios. Energy Conversion and Management, 51(10), 2012-2015.
Kowalski, S. J., Musielak, G., & Banaszak, J. (2010). Heat and mass transfer during
microwave-convective drying. AIChE Journal, 56(1), 24-35.
Kudra, T. (2004). Energy Aspects in Drying. Drying Technology, 22(5), 917-932.
Kumar, C., Karim, A., Joardder, M. U. H., & Miller, G. (2012). Modeling heat and
mass transfer process during convection drying of fruit. Paper presented at
the The 4th International Conference on Computational Methods Gold Coast,
Australia.
Kumar, C., Karim, A., Joardder, M. U. H., & Miller, G. J. (2012a, November 25-28).
Modeling Heat and Mass Transfer Process during Convection Drying of

Bibliography 171
Fruit. Paper presented at the The 4th International Conference on
Computational Methods, Gold Coast, Australia.
Kumar, C., Karim, A., Saha, S. C., Joardder, M. U. H., Brown, R. J., & Biswas, D.
(2012b, December 28-29,). Multiphysics modelling of convective drying of
food materials. Paper presented at the Proceedings of the Global Engineering,
Science and Technology Conference, Dhaka, Bangladesh.
Kumar, C., Karim, M. A., & Joardder, M. U. H. (2014). Intermittent drying of food
products: A critical review. Journal of Food Engineering, 121(0), 48-57.
Kumar, C., Millar, G. J., & Karim, M. A. (2015). Effective Diffusivity and
Evaporative Cooling in Convective Drying of Food Material. Drying
Technology, 33(2), 227-237.
Lehne, M., Barton, G. W., & Langrish, T. A. G. (1999). Comparison of experimental
and modelling studies for the microwave drying of Ironbark timber. Drying
Technology, 17(10), 2219-2235.
Lin, Y. E., Anantheswaran, R. C., & Puri, V. M. (1995). Finite element analysis of
microwave heating of solid foods. Journal of Food Engineering, 25(1), 85-
112.
Malafronte, L., Lamberti, G., Barba, A. A., Raaholt, B., Holtz, E., & Ahrné, L.
(2012). Combined convective and microwave assisted drying: Experiments
and modeling. Journal of Food Engineering, 112(4), 304-312.
Martín-Esparza, M. E., Martínez-Navarrete, N., Chiralt, A., & Fito, P. (2006).
Dielectric behavior of apple (var. Granny Smith) at different moisture
contents. Journal of Food Engineering, 77(1), 51-56.
Marzec, A., Kowalska, H., & ZadroŻNa, M. (2010). Analysis of instrumental and
sensory texture attributes of microwave–convective dried apples. Journal of
Texture Studies, 41(4), 417-439.
Mascarenhas, W. J., Akay, H. U., & Pikal, M. J. (1997). A computational model for
finite element analysis of the freeze-drying process. Computer Methods in
Applied Mechanics and Engineering, 148(1–2), 105-124.
McMinn, W. A. M., Khraisheh, M. A. M., & Magee, T. R. A. (2003). Modelling the
mass transfer during convective, microwave and combined microwave-
convective drying of solid slabs and cylinders. Food Research International,
36(9-10), 977-983.
Metaxas, A. C. (1996a). Foundation and Electroheat: A Unified Approach: John
Wiley & Sons.
Metaxas, A. C. (1996b). Foundations of Electroheat. Chichester, U.K.: John Wiley
and Sons.
Mihoubi, D., & Bellagi, A. (2009). Drying-Induced Stresses during Convective and
Combined Microwave and Convective Drying of Saturated Porous Media.
Drying Technology, 27(7-8), 851-856.
Mills, A. F. (1995). Basic Heat and Mass Transfer. Massachusetts: Irwin.
Moffat, R. J. (1988). Describing the uncertainties in experimental results.
Experimental Thermal and Fluid Science, 1(1), 3-17.
Montanuci, F. D., Perussello, C. A., de Matos Jorge, L. M., & Jorge, R. M. M.
(2014). Experimental analysis and finite element simulation of the hydration
process of barley grains. Journal of Food Engineering, 131, 44-49.
Mudgett, R. E. (1986). Microwave properties and heating characteristics of foods.
Food Technology, 40(6), 84-93.
Mujumdar, A. S. (2004). Research and Development in Drying: Recent Trends and
Future Prospects. Drying Technology, 22(1-2), 1-26.

172 Bibliography
Mujumdar, A. S., & Zhonghua, W. (2007). Thermal Drying Technologies—Cost-
Effective Innovation Aided by Mathematical Modeling Approach. Drying
Technology, 26(1), 145-153.
Ni, H. (1997). Multiphase moisture transport in porous media under intensive
microwave heating. (PhD), Cornell University, Ithaca, New York, United
States, Ithaca, New York, United States
Ni, H., & Datta, A. K. (1999). Moisture, Oil and Energy Transport During Deep-Fat
Frying of Food Materials. Food and Bioproducts Processing, 77(3), 194-204.
Ni, H., Datta, A. K., & Torrance, K. E. (1999). Moisture transport in intensive
microwave heating of biomaterials: a multiphase porous media model.
International Journal of Heat and Mass Transfer, 42(8), 1501-1512.
Nijhuis, H. H., Torringa, E., Luyten, H., René, F., Jones, P., Funebo, T., & Ohlsson,
T. (1996). Research needs and opportunities in the dry conservation of fruits
and vegetables. Drying Technology, 14(6), 1429-1457.
Okos, M. R., Campanella, O., Narsimhan, G., Singh, R., & Weitnauer, A. C. (2006).
Food Dehydration Handbook of Food Engineering (pp. 601-744): CRC Press.
Orsat, V., Yang, W., Changrue, V., & Raghavan, G. S. V. (2007). Microwave-
Assisted Drying of Biomaterials. Food and Bioproducts Processing, 85(3),
255-263.
Ousegui, A., Moresoli, C., Dostie, M., & Marcos, B. (2010). Porous multiphase
approach for baking process – Explicit formulation of evaporation rate.
Journal of Food Engineering, 100(3), 535-544.
Pan, Y. K., Zhao, L. J., & Hu, W. B. (1998). The effect of tempering-intermittent
drying on quality and energy of plant materials. Drying Technology, 17(9),
1795-1812.
Panasonic. (2013). Linear outpur for even cooking. Retrieved 12 September 2013,
from http://shop.panasonic.com/learn/microwaves/microwave-
inverter/?sc_mc=vanity_inverter_01172012
Perussello, C. A., Kumar, C., de Castilhos, F., & Karim, M. A. (2014). Heat and
mass transfer modeling of the osmo-convective drying of yacon roots
(Smallanthus sonchifolius). Applied Thermal Engineering, 63(1), 23-32.
Perussello, C. A., Mariani, V. C., & Amarante, Á. C. C. d. (2013). Thermophysical
Properties of Okara During Drying. International Journal of Food Properties,
17(4), 891-907.
Perussello, C. A., Mariani, V. C., & do Amarante, Á. C. C. (2012). Numerical and
experimental analysis of the heat and mass transfer during okara drying.
Applied Thermal Engineering(0).
Pitchai, K., Birla, S. L., Subbiah, J., Jones, D., & Thippareddi, H. (2012). Coupled
electromagnetic and heat transfer model for microwave heating in domestic
ovens. Journal of Food Engineering, 112(1–2), 100-111.
Plumb, O. A. (1991). Heat Transfer During Unsaturated Flow in Porous Media. In S.
Kakaç, B. Kilkiş, F. Kulacki & F. Arinç (Eds.), Convective Heat and Mass
Transfer in Porous Media (Vol. 196, pp. 435-464): Springer Netherlands.
Prabhanjan, D. G., Ramaswamy, H. S., & Raghavan, G. S. V. (1995). Microwave-
assisted convective air drying of thin layer carrots. Journal of Food
Engineering, 25(2), 283-293.
Putranto, A., Chen, X. D., Devahastin, S., Xiao, Z., & Webley, P. A. (2011).
Application of the reaction engineering approach (REA) for modeling
intermittent drying under time-varying humidity and temperature. Chemical
Engineering Science, 66(10), 2149-2156.

Bibliography 173
Quirijns, E. J. (2006). Modelling and dynamic optimisation of quality indicator
profiles during drying. (PhD), Wageningen University, Nederlands
Rahman, M. S. (2008). Food properties handbook: CRC press.
Rakesh, V., & Datta, A. K. (2013). Transport in deformable hygroscopic porous
media during microwave puffing. AIChE Journal, 59(1), 33-45.
Rakesh, V., Datta, A. K., Amin, M. H. G., & Hall, L. D. (2009). Heating uniformity
and rates in a domestic microwave combination oven. Journal of Food
Process Engineering, 32(3), 398-424.
Rakesh, V., Datta, A. K., Walton, J. H., McCarthy, K. L., & McCarthy, M. J. (2012).
Microwave combination heating: Coupled electromagnetics- multiphase
porous media modeling and MRI experimentation. AIChE Journal, 58(4),
1262-1278.
Rakesh, V., Seo, Y., Datta, A. K., McCarthy, K. L., & McCarthy, M. J. (2010). Heat
transfer during microwave combination heating: Computational modeling and
MRI experiments. AIChE Journal, 56(9), 2468-2478.
Ratanadecho, P., Aoki, K., & Akahori, M. (2001). Experimental and numerical study
of microwave drying in unsaturated porous material. International
Communications in Heat and Mass Transfer, 28(5), 605-616.
Rattanadecho, P. (2006a). The simulation of microwave heating of wood using a
rectangular wave guide: Influence of frequency and sample size. Chemical
Engineering Science, 61(14), 4798-4811.
Rattanadecho, P. (2006b). The simulation of microwave heating of wood using a
rectangular wave guide: Influence of frequency and sample size. Chemical
Engineering Science, 61(14), 4798-4811.
Ratti, C., Crapiste, G. H., & Rotstein, E. (1989). A New Water Sorption Equilibrium
Expression for Solid Foods based on Thermodynamic Considerations.
Journal of Food Science, 54(3), 738-742.
Sadeghi, M., Mirzabeigi Kesbi, O., & Mireei, S. A. (2013). Mass transfer
characteristics during convective, microwave and combined microwave–
convective drying of lemon slices. Journal of the Science of Food and
Agriculture, 93(3), 471-478.
Salagnac, P., Glouannec, P., & Lecharpentier, D. (2004). Numerical modeling of
heat and mass transfer in porous medium during combined hot air, infrared
and microwaves drying. International Journal of Heat and Mass Transfer,
47(19-20), 4479-4489.
Sanga, E. C. M., Mujumdar, A. S., & Raghavan, G. S. V. (2002). Simulation of
convection-microwave drying for a shrinking material. Chemical Engineering
and Processing: Process Intensification, 41(6), 487-499.
Sharma, G. P., Prasad, S., & Chahar, V. K. (2009). Moisture transport in garlic
cloves undergoing microwave-convective drying. Food and Bioproducts
Processing, 87(1), 11-16.
Silva, W. P., Hamawand, I., & Silva, C. M. D. P. S. (2014). A liquid diffusion model
to describe drying of whole bananas using boundary-fitted coordinates.
Journal of Food Engineering, 137(0), 32-38.
Silva, W. P., Silva, C. M. D. P. S., Farias, V. S. O., & Gomes, J. P. (2011). Diffusion
Models to Describe the Drying Process of Peeled Bananas: Optimization and
Simulation. Drying Technology, 30(2), 164-174.
Silva, W. P., Silva, C. M. D. P. S., Gama, F. J. A., & Gomes, J. P. (2014).
Mathematical models to describe thin-layer drying and to determine drying

174 Bibliography
rate of whole bananas. Journal of the Saudi Society of Agricultural Sciences,
13(1), 67-74.
Silva, W. P., Silva, C. M. D. P. S., & Gomes, J. P. (2013). Drying description of
cylindrical pieces of bananas in different temperatures using diffusion
models. Journal of Food Engineering, 117(3), 417-424.
Sosa-Morales, M. E., Valerio-Junco, L., López-Malo, A., & García, H. S. (2010).
Dielectric properties of foods: Reported data in the 21st Century and their
potential applications. LWT - Food Science and Technology, 43(8), 1169-
1179.
Soysal, Y., Arslan, M., & Keskin, M. (2009b). Intermittent Microwave-convective
Air Drying of Oregano. Food Science and Technology International, 15(4),
397-406.
Soysal, Y., Ayhan, Z., Eştürk, O., & Arıkan, M. F. (2009a). Intermittent microwave–
convective drying of red pepper: Drying kinetics, physical (colour and
texture) and sensory quality. Biosystems Engineering, 103(4), 455-463.
Stanish, M. A., Schajer, G. S., & Kayihan, F. (1986). A mathematical model of
drying for hygroscopic porous media. AIChE Journal, 32(8), 1301-1311.
Sunjka, P. S., Rennie, T. J., Beaudry, C., & Raghavan, G. S. V. (2004). Microwave-
Convective and Microwave-Vacuum Drying of Cranberries: A Comparative
Study. Drying Technology, 22(5), 1217-1231.
Suwannapum, N., & Rattanadecho, P. (2011). Analysis of Heat–Mass Transport and
Pressure Buildup Induced inside Unsaturated Porous Media Subjected to
Microwave Energy Using a Single (TE10) Mode Cavity. Drying Technology,
29(9), 1010-1024.
Swain, S., Samuel, D. V. K., Bal, L. M., & Kar, A. (2013). Thermal Kinetics of
Colour Degradation of Yellow Sweet Pepper (Capsicum Annum L.)
Undergoing Microwave Assisted Convective Drying. International Journal
of Food Properties, 17(9), 1946-1964.
Sweat, V. E. (1974). Experimental values of thermal conductivity of selected fruits
and vegetables. Journal of Food Science, 39(6), 1080-1083.
Truscott, S. (2004). A heterogenous three-dimensional computational model for
wood drying. (PhD), Queensland University of Technology
Turner, I. W., & Jolly, P. C. (1991). Combined microwave and convective drying of
a porous material. Drying Technology, 9(5), 1209-1269.
Turner, I. W., & Perré, P. (2004). Vacuum drying of wood with radiative heating: II.
Comparison between theory and experiment. AIChE Journal, 50(1), 108-118.
Turner, I. W., Puiggali, J. R., & Jomaa, W. (1998). A Numerical Investigation of
Combined Microwave and Convective Drying of a Hygroscopic Porous
Material: A Study Based on Pine Wood. Chemical Engineering Research and
Design, 76(2), 193-209.
UN. (2007). 18,000 children die every day of hunger, U.N. says.
http://www.usatoday.com/news/world/2007-02-17-un-hunger_x.htm
Vadivambal, R., & Jayas, D. (2010). Non-uniform Temperature Distribution During
Microwave Heating of Food Materials—A Review. Food and Bioprocess
Technology, 3(2), 161-171.
Vega-Mercado, H., Marcela Góngora-Nieto, M., & Barbosa-Cánovas, G. V. (2001).
Advances in dehydration of foods. Journal of Food Engineering, 49(4), 271-
289.
Bibliography 175
Wang, N., & Brennan, J. G. (1995). A mathematical model of simultaneous heat and
moisture transfer during drying of potato. Journal of Food Engineering,
24(1), 47-60.
Wang, Z., Sun, J., Liao, X., Chen, F., Zhao, G., Wu, J., & Hu, X. (2007).
Mathematical modeling on hot air drying of thin layer apple pomace. Food
Research International, 40(1), 39-46.
Ward, C. A., & Fang, G. (1999). Expression for predicting liquid evaporation flux:
Statistical rate theory approach. Physical Review E, 59(1), 429-440.
Wei, C. K., Davis, H. T., Davis, E. A., & Gordon, J. (1985). Heat and mass transfer
in water-laden sandstone: Microwave heating. AIChE Journal, 31(5), 842-
848.
Wentworth, S. M. (2004). Fundamentals of Electromagnetics with Engineering
Applications: John Wiley.
Whitaker, S. (1977). Simultaneous Heat, Mass, and Momentum Transfer in Porous
Media: A Theory of Drying. In P. H. James & F. I. Thomas (Eds.), Advances
in Heat Transfer (Vol. Volume 13, pp. 119-203): Elsevier.
Wojdyło, A., Figiel, A., Lech, K., Nowicka, P., & Oszmiański, J. (2014). Effect of
Convective and Vacuum–Microwave Drying on the Bioactive Compounds,
Color, and Antioxidant Capacity of Sour Cherries. Food and Bioprocess
Technology, 7(3), 829-841.
Workneh, T. S., & Oke, M. O. (2013). Thin Layer Modelling of Microwave-
Convective Drying of Tomato Slices. International Journal of Food
Engineering, 9(1), 75-89.
World Food Programme. (2012). Hunger Statistics. Retrieved 2 January, 2014, from
http://www.wfp.org/hunger/stats
Yan Bai, Rahman, M. S., Perera, C. O., Smith, B., & Melton, L. D. (2002). Structural
Changes in Apple Rings during Convection Air-Drying with Controlled
Temperature and Humidity. J Agric Food Chem, 50(11), 3179-3185.
Yan, Z., Sousa-Gallagher, M. J., & Oliveira, F. A. R. (2008). Shrinkage and porosity
of banana, pineapple and mango slices during air-drying. Journal of Food
Engineering, 84(3), 430-440.
Yang, H. W., & Gunasekaran, S. (2001). Temperature Profiles in a Cylindrical
Model Food During Pulsed Microwave Heating. Journal of Food Science,
66(7), 998-1004.
Yang, H. W., & Gunasekaran, S. (2004). Comparison of temperature distribution in
model food cylinders based on Maxwell's equations and Lambert's law during
pulsed microwave heating. Journal of Food Engineering, 64(4), 445-453.
Zeki, B. (2009). Chapter 22 - Dehydration Food Process Engineering and
Technology (pp. 459-510). San Diego: Academic Press.
Zhang, J., & Datta, A. K. (2004). Some Considerations in Modeling of Moisture
Transport in Heating of Hygroscopic Materials. Drying Technology, 22(8),
1983-2008.
Zhang, J., Datta, A. K., & Mukherjee, S. (2005). Transport processes and large
deformation during baking of bread. AIChE Journal, 51(9), 2569-2580.
Zhang, M., Jiang, H., & Lim, R.-X. (2010). Recent Developments in Microwave-
Assisted Drying of Vegetables, Fruits, and Aquatic Products—Drying
Kinetics and Quality Considerations. Drying Technology, 28(11), 1307-1316.
Zhang, M., Tang, J., Mujumdar, A. S., & Wang, S. (2006). Trends in microwave-
related drying of fruits and vegetables. Trends in Food Science
andTechnology, 17(10), 524-534.

176 Bibliography
Zhang, W., & Mujumdar, A. S. (1992). Deformation and stress analysis of porous
capillary bodies during intermittent volumetric thermal drying. Drying
Technology, 10(2), 421-443.
Zhang, Z., & Kong, N. (2012). Nonequilibrium Thermal Dynamic Modeling of
Porous Medium Vacuum Drying Process. Mathematical Problems in
Engineering, 2012, 1-22.
Zhou, L., Puri, V. M., Anantheswaran, R. C., & Yeh, G. (1995). Finite element
modeling of heat and mass transfer in food materials during microwave
heating — Model development and validation. Journal of Food Engineering,
25(4), 509-529.

Appendices 177
Appendices
Appendix A
Implementation of the model in mathematical interface of COMSOL
The mathematics interfaces was used to model heat and mass transfer for
solving. A coefficient form PDE was chosen to solve the equation and the coefficient
were defined to match with the formulated equations of the models.
Where u is the independent variable, ae is the mass coefficient, ad is a
damping coefficient or a mass coefficient, c is the diffusion coefficient, α is the
conservative, flux convection coefficient, β is the convection coefficient, a is the
absorption coefficient, γ is the conservative flux source term, and f is the source
term.

178 Appendices
The final equation for liquid water transport in the model is
evapwc
w
wrw
www RcDPkk
St
,. .
Therefore, to implement this equation in COMSOL the following settings were
used.
Description Value expression
Diffusion coefficient cD
Absorption coefficient wS
t
Source term evapR
Mass coefficient 0
Damping or mass coefficient wS
Conservative flux convection coefficient 0
Convection coefficient 0
Conservative flux source P
kk
w
wrw
w
,
Similar strategy were taken for vapour conservation and energy equations.
Appendix B
The conversions of moisture content
The moisture content (dry basis), dbM , cab ne written as,
s
vwdb
ccM
1
where, wc is the mass concentration of water (kg/m3), and vc is the mass
concentration of vapour (kg/m3).
The relationship between dry basis moisture content, dbM , and wet basis
moisture content, wbM , are shown by following equations,
db
dbwb
M
MM
1
wb
wbdb
M
MM
1

Appendices 179