modelling and simulation of nitrogen injection in
TRANSCRIPT

MODELLING AND SIMULATION OF NITROGEN INJECTION IN VEGETABLE OLIVE
OIL
Filippo Ferrari(a)
, Simone Spanu(b)
, Giuseppe Vignali(c)
(a), (c) Department of Industrial Engineering, University of Parma, Parco Area delle Scienze 181/A, 43124 Parma (Italy)
(b)CERIT Center, University of Parma, Parco Area delle Scienze 181/A, 43124 Parma (Italy)
ABSTRACT
The aim of this work is to analyze, by means of a
CFD analysis, the injection of gaseous Nitrogen (N2) in
vegetable oil.
This process, called sparging, is important to
enhance oil shelf-life, because it allows to separate by
stripping the Oxygen (O2) dissolved in the product. In
fact, when the tank filling begins, N2 bubbles start to
rise towards the free surface of the product, dragging
along with themselves part of the dissolved O2. In this
way the probability of initiation of oxidative reactions is
reduced and, consequently, is reduced also the
possibility of oil degradation.
The final goal of this work is to compare different
sparger configurations and observe how they influence
the stripping process during the tank filling phase.
The various configurations have been compared in
terms of O2 residual inside the tank at the end of the
filling phase. The simulations still need to be
experimentally validated.
Keywords: CFD, Vegetable Oil, Modified Atmosphere,
Gas Flushing
1. INTRODUCTION
In the vegetable oils sector, keeping under control
the aging process of the product is of particular
importance to, because it can significantly influence the
final quality of the sale unit. In fact, during aging,
vegetable oils are subject to a process of degradation
due to fats rancidity. This phenomenon affects the
organoleptic characteristics of the product, but not its
hygienic stability, as the vegetable oils have a very low
water activity (aw) and are hardly subject to microbial
growth (Gunstone, 2011). For these reasons, no aseptic
conditions must be maintained and only a clean filling
technology is required. For the same reasons and due to
the low resistance to the high temperatures, hot-filling
technology is not admitted (Manfredi and Vignali,
2015)
One of the process phases that contributes more to
the product degradation is storage. In this case, fats
rancidity is mainly due to four factors (Choe and Min,
2006):
1. exposure to high conservation temperature
(usually the maximum storage temperature is
of 25°C, except for palm oil, which tends to
solidify at room temperature (Shahidi, 2005)); 2. exposure to light: low wavelength radiation
(and thus high energy radiation) increase the
probability of fat rancidity;
3. time: higher is the storage period higher will
be the probability of fats rancidity;
4. exposure to Oxygen (O2), since rancidity is
due to the formation of free radicals and to the
absorption of O2 by fatty acids, especially
unsaturated ones.
The first three factors are easily controlled: to
avoid exposure to light and to high temperature is
sufficient to keep the product in thermo-stated stainless
steel tanks, while to avoid an excessively long storage
period is sufficient a proper management of the oil
purchasing process.
In order to minimize exposure to O2, instead, three
main techniques are adopted: minimization of tank head
space, blanketing and sparging.
In the first case, when oil level has decreased under
a certain limit, the product is moved to a lower-capacity
tank, in order to keep head space minimized, and so on
until stock exhaustion. When blanketing is applied,
instead, the tank head space is filled with gaseous
Nitrogen (N2), or with a different inert gas, so to avoid
the contact between oil and atmospheric O2 during the
entire period of storage. Finally, sparging process
consists in injecting gaseous N2 in the vegetable oil
stream, thus, in this case, N2 is directly mixed to the
product. The goal of this treatment is to supersaturate
vegetable oil with N2. In this way, when the product
starts to fill the tank, the previously injected gas is
released through the oil free surface, pushing out the air
and occupying the tank headspace. In some cases,
blanketing and sparing are adopted simultaneously,
saturating the tank with N2 before the beginning of the
tank filling phase, so to avoid the contact between oil
and O2 also during filling (Shahidi, 2005).
Compared to blanketing, sparging process has
more advantages. When, during the tank filling phase,
N2 bubbles start to rise towards the free surface, they
drag along with themselves part of the O2 dissolved in
the product (Masella et al., 2010). This contributes in
reducing the vegetable oil alteration since, usually, there
Proceedings of the International Food Operations and Processing Simulation Workshop 978-88-97999-83-6; Bruzzone, Longo, Piera and Vignali Eds.
39

can be a maximum of 36 mg/l of dissolved O2 in the
product (Parenti et al., 2007.).
As already proposed in other food sectors, in the
case the process is hardly visible and experimental tests
do not give sufficient information, a Computational
Fluid Dynamics (CFD) approach can be used. As
already shown in other works using multiphase flows
(Spanu and Vignali, in press; Mosna and Vignali, 2015;
Bottani et al, 2014), the advantages of using CFD are
consistent and very affordable.
Based on these premises, the aim of this work is to
adopt Computational Fluid Dynamics (CFD) to assess
the efficacy of the N2 sparging process in removing the
O2 dissolved in the oil. In particular, some different
geometrical configuration of the duct in which is
inserted the sparger will be analyzed, to check how a
different geometry can influence the distribution of N2
within the vegetable oil flow and, consequently, the
removal of dissolved O2.
2. MATERIALS AND METHODS
The sparging process that has been taken into
account relies on a sparger (realized by Mott Corp.®)
made of sintered stainless steel, with a porosity of about
70% and a nominal pore diameter of 40 μm.
2.1. Equipment
The way adopted to place the sparger inside the
pipeline in which the vegetable oil flows is shown in
Figure 1.
Figure 1: sparger's position inside vegetable oil pipeline
As can be noticed from Figure 1, the sparger is
elbow mounted, in order to avoid the creation of a dead
leg along the piping, from which could arise
cleanability issues. The pipeline where vegetable oil
flows is realized with commercial pipes having a
nominal diameter of 80 mm (DN80, according to DIN
standards), while the pipeline which carries gaseous N2
to the sparger is realized with commercial pipes having
a nominal diameter of 20 mm (DN20, according to DIN
standards).
As previously explained, different geometrical
configurations of the oil pipeline have been analyzed, in
order to assess if a different geometry can influence N2
distribution inside oil flow, and thus the removal of
dissolved O2. In particular, four configurations have
been compared:
1. a configuration where the sparger is followed
by a straight DN80 pipe;
2. a configuration where the sparger is followed
by a Venturi-like pipe, with the Venturi throat
having a diameter of 30 mm and the outlet
section having a diameter of 50 mm;
3. a configurations where the sparger is followed
by a Venturi-like pipe having some
protuberances in the Venturi throat, to enhance
the turbulence and, thus, the mixing between
the gas and the vegetable oil (also in this case
the diameter of the Venturi throat is equal to
30 mm and the diameter of the outlet section is
equal to 50 mm);
4. a configuration where the sparger is followed
by a Venturi-like pipe having some
protuberances in the Venturi throat, but with
the outlet section having a diameter equal to 80
mm.
The first configuration represents the standard
system used in companies that adopt the sparging
technology to preserve vegetable oil from deterioration.
In each one of the four analyzed configurations the
distance between the top of the sparger and the outlet
section is equal to 460 mm. The four configurations are
highlighted in Figure 2.
Figure 2: A) first configuration, B) second configuration, C)
third configuration, D) fourth configuration
The tank considered in the simulation of the filling
phase, instead, is a small capacity tank of 150 liters,
made of stainless steel.
In particular, two version of the tank are adopted:
in the first version the tank inlet section has a diameter
of 80 mm (which will be coupled with sparging systems
having a DN80 outlet), while in the second version it
has a diameter of 50 mm (which will be coupled with
sparging systems having a DN50 outlet). Connected to
the inlet section there is a small-length pipe which
Proceedings of the International Food Operations and Processing Simulation Workshop 978-88-97999-83-6; Bruzzone, Longo, Piera and Vignali Eds.
40

addresses the in-flow of vegetable oil towards the
bottom of the tank. On the top of both versions, instead,
there is a gas outlet, which allows the escape of the gas
that accumulates above oil.
The following Figure 3 shows the two
configurations of the tank adopted in the simulations.
Figure 3: A) tank with DN80 inlet, B) tank with DN50 inlet
2.2. CFD Modelling
Considering the co-presence of a liquid phase
(vegetable oil) and of two gaseous substances (N2 and
O2) in this case a multi-phase simulation has to be set
up.
Consequently, to set up the physics and solve the
calculation, Ansys CFX version 16.1 has been used,
because this software allows to simulate multi-phase
flows. In fact, a 3D multi-phase simulation has been set
up, considering a mixture of vegetable oil, N2 and O2.
In particular, in both simulations (sparger
simulations and tank filling simulations) the
“Homogeneous Model” has been adopted, in the first
case because the fluids share the same velocity field,
since the gases are entrained by the oil stream, and, in
the second case, because it allows a better modeling of
the free surface inside the tank, according to Ansys
CFX Reference Guide.
In a multi-phase simulation, with the
“Homogeneous Model” activated, the continuity
equation becomes:
∑
(1)
where:
- is the density of phase α;
- is the volume fraction of phase α;
- is the vector of velocity Ux,y,z, which is the
same for all of the considered phases;
- describes user specified mass sources;
- is the mass flow rate per unit volume from
phase β to phase α. This terms only occurs if
interphase mass transfer takes place, so in this
case is equal to 0.
Instead, for the “Homogeneous Model”, the
momentum equation is given by:
( ) (2)
where:
- ∑ is the phase-averaged density;
- ∑ is the phase-averaged dynamic
viscosity;
- SM is a term that describes a user specified
momentum source.
Furthermore, is present a constraint which
specifies that the volume fractions must sum up to unity
in every instant and in every point of the fluid domain,
meaning that the following equation:
∑
(3)
has to be always respected.
With regard to energy exchanges, it has been
considered that the analyzed processes are carried out at
room temperature, with a negligible heat transfer
between the fluid domain and the outside environment.
Consequently, the isothermal model with a fixed
temperature of 25°C has been set up.
Moreover, in the case of the tank filling
simulations, to achieve a better modeling of the oil free
surface, the “Standard Free Surface Model” has been
adopted. In this case, if there are just two phases, the
following equations is used for interfacial area density:
| | (4)
Finally, for both cases (sparger simulations and
tank filling simulations) the k-ε turbulence model has
been adopted, because it is suitable both for fluid flow
inside in Venturi-like pipes (Guerra et al., 2012) and
both for tank problems (Godderidge et al., 2009). The k-
ε model is a two equations eddy viscosity turbulence
model which is widely used to solve a large number of
industrial problems (Blazek, 2015). The equation
governing the k- ε model can be found in Ferziger and
Peric (2002).
2.2.1. Mesh setting for the fluid domain
The fluid domains have been obtained starting
from the 3D CAD models of the four sparger
configurations and from the 3D CAD models of the two
tank configurations by means of the CAD software
SolidWorks (version 2014). Instead, the discretization
of the fluid domains has been performed using the
software Ansys Meshing version 16.1.
The grids were initially set by creating a uniform
subdivision, and then thickened in the critical areas of
the fluid domains.
Proceedings of the International Food Operations and Processing Simulation Workshop 978-88-97999-83-6; Bruzzone, Longo, Piera and Vignali Eds.
41

In particular, considering the sparger
configurations, a finer mesh was used near the inlets,
near the outlet, near the walls and in the Venturi throat.
At the end of the operation, the unstructured grids
obtained for the sparging simulations had, on average, a
total of 680,000 nodes and 3,730,000 tetrahedrons each.
Figure 4 shows a section of the obtained volume
meshes. In particular, Figure 4 A) shows the mesh for
the first sparger configuration, Figure 4 B) shows a
close-up of the mesh in the Venturi throat and Figure 4
C) shows a close-up of the mesh in the Venturi troath
when the protuberances are present.
Figure 4: A) section of the volume mesh for first sparger
configuration, B) close-up of the volume mesh in the Venturi
throat, C) close-up of the volume mesh in the Venturi throat
with protuberances
Also for the two tank configurations an
unstructured grid has been adopted. Figure 5 shows a
section of the volume mesh for both of the analyzed
configurations.
Figure 5: A) volume mesh for tank with DN80 inlet, B)
volume mesh for tank with DN50 inlet
As can be noticed from Figure 5, in this case a
finer mesh was adopted in correspondence of the gas
outlet and in correspondence of the point where oil
flows exits the inlet tube and enters the tank, which are
the areas where the velocity gradients are expected to be
higher.
An unstructured grid with about 1,000,000 nodes
and 5,600,000 tetrahedrons was obtained for both tank
configurations.
2.2.2. Simulation setting
Settings for sparger simulations
A 3D multi-phase simulation has been set up
considering the fluid domain as composed by oil, N2
and O2.
N2 and O2 were considered as ideal gases and the
values of the thermo-physical properties adopted for
their characterization were the ones present by default
in Ansys CFX materials database. Furthermore, since
vegetable oil is not present in Ansys CFX materials
library, it has been created using the settings showed in
Table 1. In particular, the values adopted to define the
thermo-physical properties of this substance are referred
to Olive Oil characteristics at 25°C and atmospheric
pressure.
Proceedings of the International Food Operations and Processing Simulation Workshop 978-88-97999-83-6; Bruzzone, Longo, Piera and Vignali Eds.
42
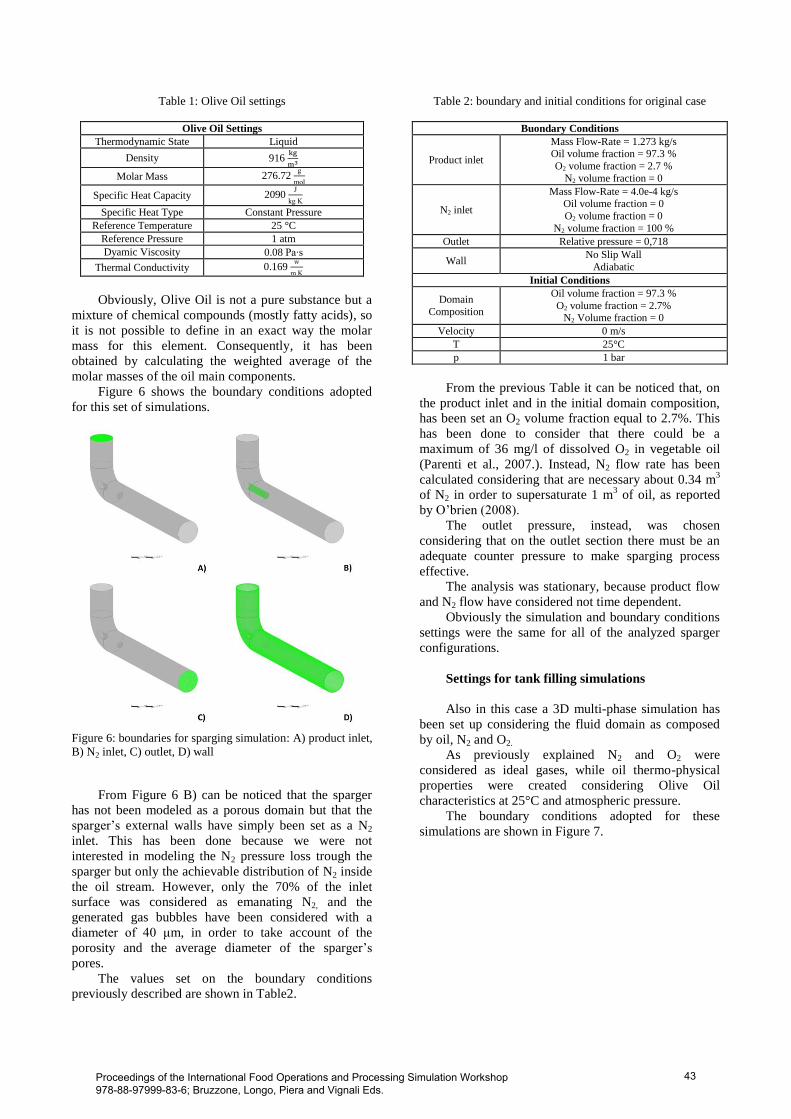
Table 1: Olive Oil settings
Olive Oil Settings
Thermodynamic State Liquid
Density 916
Molar Mass 276.72 g
mol
Specific Heat Capacity 2090
g
Specific Heat Type Constant Pressure
Reference Temperature 25 °C
Reference Pressure 1 atm
Dyamic Viscosity 0.08 a s
Thermal Conductivity 0.169
m
Obviously, Olive Oil is not a pure substance but a
mixture of chemical compounds (mostly fatty acids), so
it is not possible to define in an exact way the molar
mass for this element. Consequently, it has been
obtained by calculating the weighted average of the
molar masses of the oil main components.
Figure 6 shows the boundary conditions adopted
for this set of simulations.
Figure 6: boundaries for sparging simulation: A) product inlet,
B) N2 inlet, C) outlet, D) wall
From Figure 6 B) can be noticed that the sparger
has not been modeled as a porous domain but that the
sparger’s external walls have simply been set as a N2
inlet. This has been done because we were not
interested in modeling the N2 pressure loss trough the
sparger but only the achievable distribution of N2 inside
the oil stream. However, only the 70% of the inlet
surface was considered as emanating N2, and the
generated gas bubbles have been considered with a
diameter of 40 μm, in order to take account of the
porosity and the average diameter of the sparger’s
pores.
The values set on the boundary conditions
previously described are shown in Table2.
Table 2: boundary and initial conditions for original case
Buondary Conditions
Product inlet
Mass Flow-Rate = 1.273 kg/s Oil volume fraction = 97.3 %
O2 volume fraction = 2.7 %
N2 volume fraction = 0
N2 inlet
Mass Flow-Rate = 4.0e-4 kg/s Oil volume fraction = 0
O2 volume fraction = 0
N2 volume fraction = 100 %
Outlet Relative pressure = 0,718
Wall No Slip Wall
Adiabatic
Initial Conditions
Domain
Composition
Oil volume fraction = 97.3 %
O2 volume fraction = 2.7% N2 Volume fraction = 0
Velocity 0 m/s
T 25°C
p 1 bar
From the previous Table it can be noticed that, on
the product inlet and in the initial domain composition,
has been set an O2 volume fraction equal to 2.7%. This
has been done to consider that there could be a
maximum of 36 mg/l of dissolved O2 in vegetable oil
(Parenti et al., 2007.). Instead, N2 flow rate has been
calculated considering that are necessary about 0.34 m3
of N2 in order to supersaturate 1 m3 of oil, as reported
by O’brien (2008).
The outlet pressure, instead, was chosen
considering that on the outlet section there must be an
adequate counter pressure to make sparging process
effective.
The analysis was stationary, because product flow
and N2 flow have considered not time dependent.
Obviously the simulation and boundary conditions
settings were the same for all of the analyzed sparger
configurations.
Settings for tank filling simulations
Also in this case a 3D multi-phase simulation has
been set up considering the fluid domain as composed
by oil, N2 and O2.
As previously explained N2 and O2 were
considered as ideal gases, while oil thermo-physical
properties were created considering Olive Oil
characteristics at 25°C and atmospheric pressure.
The boundary conditions adopted for these
simulations are shown in Figure 7.
Proceedings of the International Food Operations and Processing Simulation Workshop 978-88-97999-83-6; Bruzzone, Longo, Piera and Vignali Eds.
43
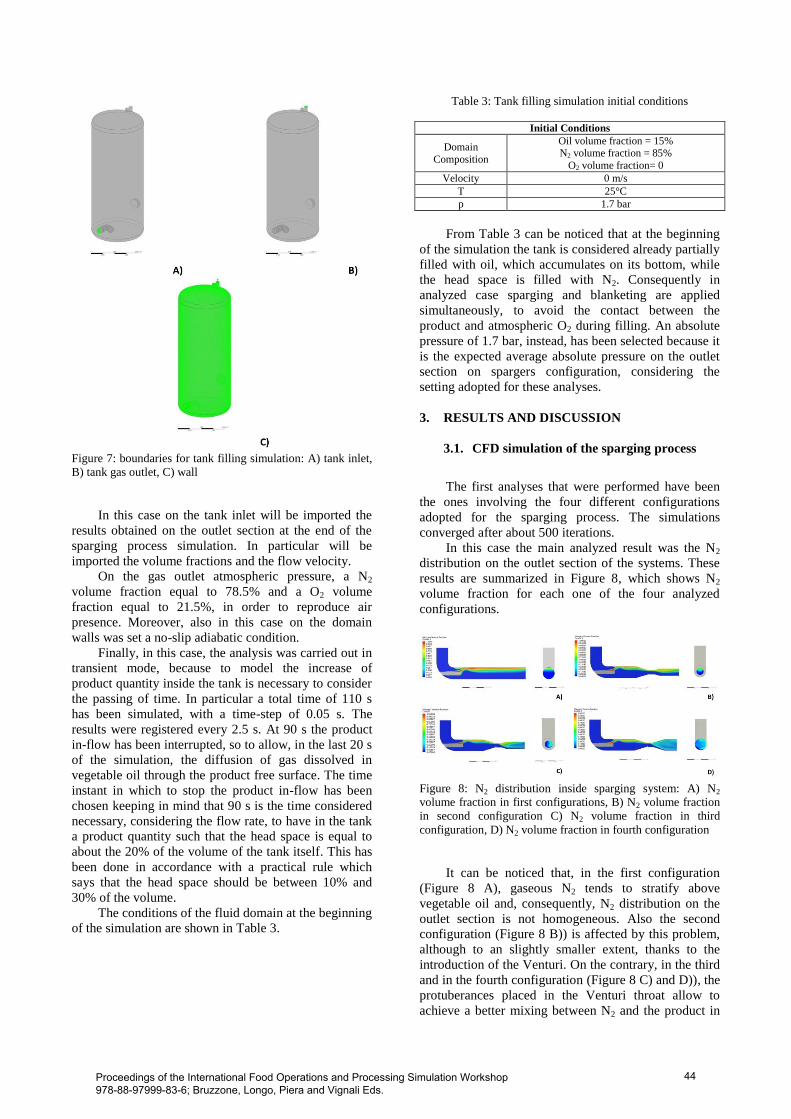
Figure 7: boundaries for tank filling simulation: A) tank inlet,
B) tank gas outlet, C) wall
In this case on the tank inlet will be imported the
results obtained on the outlet section at the end of the
sparging process simulation. In particular will be
imported the volume fractions and the flow velocity.
On the gas outlet atmospheric pressure, a N2
volume fraction equal to 78.5% and a O2 volume
fraction equal to 21.5%, in order to reproduce air
presence. Moreover, also in this case on the domain
walls was set a no-slip adiabatic condition.
Finally, in this case, the analysis was carried out in
transient mode, because to model the increase of
product quantity inside the tank is necessary to consider
the passing of time. In particular a total time of 110 s
has been simulated, with a time-step of 0.05 s. The
results were registered every 2.5 s. At 90 s the product
in-flow has been interrupted, so to allow, in the last 20 s
of the simulation, the diffusion of gas dissolved in
vegetable oil through the product free surface. The time
instant in which to stop the product in-flow has been
chosen keeping in mind that 90 s is the time considered
necessary, considering the flow rate, to have in the tank
a product quantity such that the head space is equal to
about the 20% of the volume of the tank itself. This has
been done in accordance with a practical rule which
says that the head space should be between 10% and
30% of the volume.
The conditions of the fluid domain at the beginning
of the simulation are shown in Table 3.
Table 3: Tank filling simulation initial conditions
Initial Conditions
Domain
Composition
Oil volume fraction = 15% N2 volume fraction = 85%
O2 volume fraction= 0
Velocity 0 m/s
T 25°C
p 1.7 bar
From Table 3 can be noticed that at the beginning
of the simulation the tank is considered already partially
filled with oil, which accumulates on its bottom, while
the head space is filled with N2. Consequently in
analyzed case sparging and blanketing are applied
simultaneously, to avoid the contact between the
product and atmospheric O2 during filling. An absolute
pressure of 1.7 bar, instead, has been selected because it
is the expected average absolute pressure on the outlet
section on spargers configuration, considering the
setting adopted for these analyses.
3. RESULTS AND DISCUSSION
3.1. CFD simulation of the sparging process
The first analyses that were performed have been
the ones involving the four different configurations
adopted for the sparging process. The simulations
converged after about 500 iterations.
In this case the main analyzed result was the N2
distribution on the outlet section of the systems. These
results are summarized in Figure 8, which shows N2
volume fraction for each one of the four analyzed
configurations.
Figure 8: N2 distribution inside sparging system: A) N2
volume fraction in first configurations, B) N2 volume fraction
in second configuration C) N2 volume fraction in third
configuration, D) N2 volume fraction in fourth configuration
It can be noticed that, in the first configuration
(Figure 8 A), gaseous N2 tends to stratify above
vegetable oil and, consequently, N2 distribution on the
outlet section is not homogeneous. Also the second
configuration (Figure 8 B)) is affected by this problem,
although to an slightly smaller extent, thanks to the
introduction of the Venturi. On the contrary, in the third
and in the fourth configuration (Figure 8 C) and D)), the
protuberances placed in the Venturi throat allow to
achieve a better mixing between N2 and the product in
Proceedings of the International Food Operations and Processing Simulation Workshop 978-88-97999-83-6; Bruzzone, Longo, Piera and Vignali Eds.
44

the final part of the pipeline, thus obtaining a more
homogeneous N2 distribution on the outlet section.
Also a quantitative analysis of these results was
performed, which is highlighted in Figure 9.
Figure 9: N2 distribution on the outlet section of the sparging
systems
As can be observed from the previous Figure, in
the third and in the fourth configuration, the percentage
of the outlet section area where N2 volume fraction is
lower than 10% is considerably lower than in the first
two configurations. Consequently, we can say that the
introduced changes improve the mixing between N2 and
the product. Then, the simulations of the tank filling
phase will highlight if the realized changes have an
impact also on the amount of the dissolved O2 that can
be removed.
Other analyzed results are the average absolute
pressure and the average velocity on the outlet section,
which are shown in Table 4.
Table 4: Average absolute pressure and average velocity on
outlet section
Configurations
Variables Conf. 1 Conf. 2 Conf. 3 Conf. 4
Average Absolute
Pressure
1.73 bar 1.73 bar 1.73 bar 1.73 bar
Average
Velocity 0.36 m/s 0.87 m/s 0.93 m/s 0.69 m/s
It may be noticed that the average absolute
pressure on the outlet section is 1.73 bar, which
confirms the correctness of the settings regarding the
initial pressure for the simulations of the tank filling
phase.
3.2. CFD simulations of tank filling
In this section are presented the results of the
simulations of the tank filling phase. In particular three
simulations have been carried out:
1) tank filling starting from the results obtained at
end of the analysis of the first sparger
configuration;
2) tank filling starting from the results obtained at
the end of the analysis of the third sparger
configuration;
3) tank filling starting from the results obtained at
the end of the analysis of the fourth sparger
configuration.
To carry out the simulations the results obtained on
the spargers outlet section in terms of velocities and
volume fractions were imported on tank inlet. A
coupling between the second sparger configuration and
the tank was not analyzed, because the N2 distribution
on the outlet section of the sparging system was deemed
too similar to that obtainable with the first analyzed
system.
In this case, the main analyzed result is evolution
in time of the O2 residual in oil. The graph in Figure 10
compares the O2 residual for the three simulated
configurations.
Figure 10: O2 residual in oil for the three tank filling
simulations
First of all, it can be noticed that, for all of the
three analyzed configurations, O2 residual in oil
increases for the first 90 s, then, when the filling is
stopped, the injected N2 starts to spread through the
product free surface, dragging O2 along with itself and
thus causing a rapid decrease of the residual, as
expected. This trend is more pronounced for the second
and the third configurations than in the first one.
It can be observed that the first configuration
allows to reach a final O2 residual in oil equal to 1.08%,
starting from an initial average volume fraction of O2 in
oil, on the inlet section, equal to 2.4%. Moreover, in this
case O2 residual in oil during filling never reaches a
value higher than 1.23% (at 87.5 s). This value is lower
than the O2 volume fraction on inlet section,
consequently, in this case, seems that N2 is pushing O2
towards the outlet section also during the filling phase.
This phenomenon is confirmed also for the third
analyzed configuration. In this case, the final O2
Proceedings of the International Food Operations and Processing Simulation Workshop 978-88-97999-83-6; Bruzzone, Longo, Piera and Vignali Eds.
45

residual is equal to 0.7% (also in this case starting from
an initial average volume fraction of O2 in oil, on the
inlet section, equal to 2.4%) while, the maximum value
reached by O2 volume fraction in oil during filling, is
equal to1.46%.
Instead, in the second configuration, the final O2
residual in oil is equal to 1.04%, starting from a O2
volume fraction on inlet of 2.4%. Moreover, the
maximum value reached by O2 volume fraction in oil
during filling, is equal to 2.4%, showing how, in this
case, injected N2 is less effective in eliminating
dissolved O2 during filling. This could be related to the
higher average velocity on tank inlet which, excluding
the different N2 distribution in oil stream, is the main
difference between this configuration and the other two.
3.3. Discussion
The results described in section 3.2 are
summarized in the following Table 5.
Table 5: O2 residual after tank filling
O2 residual after tank filling O2
volume
faction
on inlet
Max O2
volume
fraction in Oil
during filling
Final
O2
residual
in Oil
% decrease
of dissolved
O2
Sim. 1 2.40 % 1.23 % 1.08 % 55 %
Sim. 2 2.40 % 2.40 % 1.04 % 57 %
Sim. 3 2.40 % 1.46 % 0.70 % 71 %
Comparing the residuals highlighted in Table 5 we
can say that simulation 2 (coupling between tank and
third sparger configuration) and simulation 3 (coupling
between tank and fourth sparger configuration) show
better results than simulation 1. In particular, the best
case seems to be simulation 3, which allows to reduce
the amount of dissolved O2 by 71%. Consequently, we
can say that the sparging configuration and the N2
distribution inside the oil stream have an important
influence on the removal process of dissolved O2.
Two points instead should be discussed: the trend
in the decrease of O2 volume fraction in oil when the
filling stops (at 90 s) and the maximum O2 volume
fraction that is reached in oil during filling.
With respect to the first point, from Figure 10 can
be seen that, when the filling stops, in simulation 2 and
simulation 3 there is a drop in the amount of O2
dissolved in oil. Instead, this does not happen in
simulation 1, which shows only a small decrease. A
possible explanation is in the amount of N2 in the oil
inside the tank. If we compare N2 volume fraction in the
tank at 92.5 s we can see that in the first simulation it is
considerably lower than in the last two analyzed
configurations, as highlighted in Figure 11.
Consequently, also the quantity of O2 pushed towards
the outlet section is lower and thus, in simulation 1, is
lower the drop in O2 concentration.
Figure 11: N2 volume fraction in tank at 92.5 s: A) first tank
simulation, B) second tank simulation, C) third tank
simulation
Instead, considering the second point, again from
Figure 10 it can be observed that, in simulation 2,
during filling, the maximum concentration of O2 that is
reached in the bulk of oil is equal to 2.4%, while, in
other simulations, is considerably lower (never higher
than 1.46%). This means that, someway, in the second
case N2 cannot separate O2 also during filling and that
its action becomes significant only when the filling is
stopped. This may be related to the higher fluid
velocity. In this case, in fact, tank inlet has a DN50
section and, consequently, the average fluid velocity
over the inlet is higher, as highlighted in in Table 4.
This could lead to a very chaotic filling, which instead
of favoring N2 action partially hinders it. However, of
fundamental importance will be a subsequent
experimental phase, which will allow not only to test
the model and modify it if necessary, but also to verify
in laboratory the origin of these two behaviors.
4. CONCLUSIONS
The sparging process of vegetable oil with gaseous
N2 (or with another inert gas) is one of the most adopted
techniques to preserve vegetable oil from spoilage. This
technique consist in inject the inert gas directly in the
oil stream by means of a porous sparger. Subsequently,
the injected gas, during tank filling operation, diffuses
trough the free surface on the product, and saturates
tank head-space, preventing the contact between oil and
atmospheric O2, which is the major spoilage agent. In
some cases sparging is used coupled with blanketing,
which consists in saturating the tank inner volume with
N2, in order to create an inert environment. In this case
sparging main goal is to separate the O2 dissolved in the
product, which could be present in quantity of 36 mg/l.
In this case, when gaseous starts to diffuse through
product’s free surface, it drags along ith itself parts of
the dissolved O2.
The objective of this work was to simulate various
sparger configurations and the subsequent tank filling
operation, to assess if the sparger geometry could affect
the N2 distribution inside the oil stream and,
consequently, the O2 removal process. In particular four
different configurations were modeled:
Proceedings of the International Food Operations and Processing Simulation Workshop 978-88-97999-83-6; Bruzzone, Longo, Piera and Vignali Eds.
46

1. a configuration where the sparger is followed
by a straight DN80 pipe;
2. a configuration where the sparger is followed
by a Venturi-like pipe, with the Venturi throat
having a diameter of 30 mm and the outlet
section having a diameter of 50 mm;
3. a configurations where the sparger is followed
by a Venturi-like pipe having some
protuberances in the Venturi throat, to enhance
the turbulence and, thus, the mixing between
the gas and the vegetable oil (also in this case
the diameter of the Venturi throat is equal to
30 mm and the diameter of the outlet section is
equal to 50 mm);
4. a configuration where the sparger is followed
by a Venturi-like pipe having some
protuberances in the Venturi throat, but with
the outlet section having a diameter equal to 80
mm.
The first configuration represents the standard system
used in companies that adopt the sparging technology to
preserve vegetable oil from deterioration.
Configurations 3 and 4 allowed to obtain a more
homogeneous N2 distribution on the system outlet
section and, consequently, they were coupled with the
tank, to evaluate also the filling operation and the
effectiveness of the O2 removal process, in order to
compare them with the original configuration.
At the end of these sets of simulations, has been
verified that both configurations are more effective in
removing the dissolved O2 than the original one. In
particular, the fourth sparger configuration was
identified as the best case, since it allows to remove the
71% of the dissolved O2, compared to the 55% obtained
with the original configuration. This work,
consequently, proved that the sparging system geometry
and that the N2 distribution inside the oil stream are
very important to obtain an effective removal of
dissolved O2. In particular, simulations have shown that,
with changes having a limited cost, is possible to
increase the effectiveness of the removal process by
77%.
Points to be addressed are the trend in the O2
residual in oil when the filling stops, which is different
when adopting the original sparging system, and the
fact that in one case there is a small accumulation of O2
in the tank during filling.
Future researches should focus on the execution of
an experimental phase, in order to validate the
simulations described in this paper and to observe, in a
laboratory, the origin of the two described unexpected
behaviors.
Moreover, simulations of the described systems in
a vertical position should be carried out, since,
frequently, the adopted sparging solution is used also in
this way.
REFERENCES
ANSYS CFX-solver modeling guide, release 16.1.
ANSYS, Inc. Southpointe 2600 ANSYS Drive,
2015.
ANSYS CFX-solver theory guide, release 16.1.
ANSYS, Inc. Southpointe 2600 ANSYS Drive,
2015.
Blazek, J., 2015. Computational fluid dynamics:
principles and applications. Butterworth-
Heinemann.
Bottani E, Ferretti G, Manfredi M, Vignali G. Modeling
and thermo-fluid dynamic simulation of a fresh
pasta pasteurization process. International Journal
of Food Engineering, 9:327–39.
Choe, E., Min, D. B., 2006. Mechanisms and factors for
edible oil oxidation. Comprehensive reviews in
food science and food safety, 5(4), 169-186. Ferziger JH, Peric M., 2002. Computational methods
for fluid dynamics. Axel-Springer Verlag.
Godderidge, B., Turnock, S., Tan, M., Earl, C., 2009.
An investigation of multiphase CFD modelling of
a lateral sloshing tank. Computers & Fluids,38(2),
183-193.
Guerra, V. ., ttega, ., on alves, . ., Coury, J.
R., 2012. Pressure drop and liquid distribution in a
venturi scrubber: experimental data and CFD
simulation. Industrial & Engineering Chemistry
Research, 51(23), 8049-8060. Gunstone, F. (Ed.)., 2011. Vegetable oils in food
technology: composition, properties and uses. John
Wiley & Sons.
Manfredi, M., Vignali, G. 2015 Comparative Life Cycle
Assessment of hot filling and aseptic packaging
systems used for beverages. Journal of Food
Engineering, 147, pp. 39-48.
Masella, P., Parenti, A., Spugnoli, P., Calamai, L.,
2010. Nitrogen stripping to remove dissolved
oxygen from extra virgin olive oil. European
Journal of Lipid Science and Technology, 112(12),
1389-1392.
Mosna, D., Vignali, G. 2015. Three-dimensional cfd
simulation of a "steam water spray" retort process
for food vegetable products. International Journal
of Food Engineering, 11 (6), pp. 715-729.
O'brien, R. D., 2008. Fats and oils: formulating and
processing for applications. CRC press.
Parenti, A., Spugnoli, P., Masella, P., & Calamai, L.,
2007. Influence of the extraction process on
dissolved oxygen in olive oil. European journal of
lipid science and technology, 109(12), 1180-1185.
Shahidi, F., 2005. Bailey's Industrial Oil and Fat
Products, 6 Volume Set (Vol. 1).
Shahidi, F., 2005. Bailey's Industrial Oil and Fat
Products, 6 Volume Set (Vol. 5).
Spanu, S., Vignali, G. 2015. CFD analysis of coffee
packaging in capsules using gas flushing modified
atmosphere packaging. International Food
Operations and Processing Simulation Workshop,
FoodOPS 2015, pp. 1-8.
Proceedings of the International Food Operations and Processing Simulation Workshop 978-88-97999-83-6; Bruzzone, Longo, Piera and Vignali Eds.
47
Spanu, S., Vignali, G., in press. Modelling and Multi-
objective Optimisation of the VHP Pouch
Packaging Sterilisation Process. International
Journal of Food Engineering, DOI: 10.1515/ijfe-
2015-0061
AUTHORS BIOGRAPHY
Filippo FERRARI is a recent graduate at the
University of Parma. After taking the bachelor degree in
engineering management in February 2014, in July
2016 he has achieved a master degree in Mechanical
Engineering for the Food Industry at the same
University. His main fields of interest concern food
process modelling and simulation.
Simone SPANU is a scholarship holder at CERIT
research center at the University of Parma. In March
2014 he has achieved a master degree in Mechanical
Engineering for the Food Industry at the same
university. His main fields of research concern food
process modelling and simulation, with a particular
focus on the CFD simulation for the advanced design of
food and beverage processing plants.
Giuseppe VIGNALI is an Associate Professor at
University of Parma. He graduated in 2004 in
Mechanical Engineering at the University of Parma. In
2009, he received his PhD in Industrial Engineering at
the same university, related to the analysis and
optimization of food processes. Since August 2007, he
worked as a Lecturer at the Department of Industrial
Engineering of the University of Parma. His research
activities concern food processing and packaging issues
and safety/security of industrial plant. Results of his
studies related to the above topics have been published
in more than 70 scientific papers, some of which appear
both in national and international journals, as well in
national and international conferences.
Proceedings of the International Food Operations and Processing Simulation Workshop 978-88-97999-83-6; Bruzzone, Longo, Piera and Vignali Eds.
48