modelling and simulation of an automated manual
TRANSCRIPT

Modelling and Simulation of an Automated Manual
Transmission (AMT) System for Integrated Prognostics
of Gearbox and Dry Clutch
THESIS
Submitted in partial fulfillment
of the requirements for the degree of
DOCTOR OF PHILOSOPHY
by
RAMALINGAM SIVA KUMAR
ID. No. 2013PHXF0705H
Under the Supervision of
Dr. Saravanan Natarajan
&
Under the Co-supervision of
Prof. Srinivasa Prakash Regalla
BIRLA INSTITUTE OF TECHNOLOGY AND SCIENCE, PILANI
2020


i
BIRLA INSTITUTE OF TECHNOLOGY AND SCIENCE, PILANI
DECLARATION
I hereby declare that the thesis titled “Modelling and Simulation of an Automated
Manual Transmission (AMT) System for Integrated Prognostics of Gearbox and
Dry Clutch” is conducted under the supervision of Dr. Saravanan Natarajan, Chief
Technology Officer, Ashok Leyland, Chennai and Prof. Srinivasa Prakash Regalla,
Department of Mechanical Engineering Birla Institute of Technology and Science-
Pilani, Hyderabad campus.
I also declare that this thesis represents my own work which has been done after
registration for the degree of Ph.D at Birla Institute of Technology and Science-Pilani,
Hyderabad campus, and has not been included in any thesis or dissertation submitted
to this or any other institution for a degree, diploma or other qualification
Signature:
Name: Ramalingam Siva Kumar
Date : 28th December 2020
Place: Chennai

ii
ACKNOWLEDGEMENT
First and foremost, I would like to thank God Almighty for providing
me with the opportunity and strength to achieve my lifetime dream. I
dedicate this thesis to my beloved mother (late) Mrs Rajambal who is
showering blessings and guiding me from heaven.
I would like to express my deepest gratitude and indebtedness to my
supervisor Dr Saravanan Natarajan for guiding and supporting me
during difficult times. I would like to convey my wholehearted thanks and
appreciation to my co-supervisor Prof. Srinivasa Prakash Regalla for his
kind support, guidance, and encouragement.
I am highly indebted and would like to convey my sincere thanks to
the management of Ashok Leyland Limited, for sponsoring my research
work, as part of the prestigious “Emerging Leader Program”
I am grateful to the vice-chancellor Prof. Souvik Bhattacharyya
of BITS Pilani, former vice-chancellor Prof. Bijendra Nath Jain, Director
Prof. G. Sundar of BITS Pilani Hyderabad Campus, and the former
Director Prof. V. S. Rao, for allowing me to carry out my doctoral research
work in the institute.
I am highly grateful to the doctoral advisory committee members, Dr
Arshad Javed and Dr Amrita Priyadarshini, for their valuable inputs,
suggestions during the semester presentation, and for the valuable
comments to improve my thesis.
I would like to sincerely thank Prof. Amit Kumar Gupta, Head of
the Department, Mechanical Engineering, BITS Pilani, Hyderabad campus.
I am truly grateful to Dr Sabareesh Geetha Rajasekharan for
supporting and motivating me in completing the research work. I also
thank the members of the Departmental Research Committee (DRC), all

iii
the faculty and staff of the Department of Mechanical Engineering for their
goodwill.
I acknowledge the excellent support of the Academic-Graduate
Studies and Research Division (AGSRD) team. I thank Prof. V. Vamsi
Krishna Venuganti, Associate Dean of AGSRD, Prof. Vidya Rajesh,
former Associate Dean and Prof. S. K. Verma, Dean, ARD, BITS Pilani for
their continuous support and encouragement during my research work.
Mr Sanjeev Ramakant Pimpale and Mr Hanumath Prasad, co-
authors of my published journals deserve very special thanks for their
contribution. I thank and appreciate the kind support of my friends and on-
campus PhD scholars, Mr Shanmukha Sundaram and Ms Swagatika
Mohanty.
I would like to convey my wholehearted thanks to all my ex-
colleagues and associates who supported for experimental and research
work at Technical Centre (Chennai), vehicle assembly plant at Pantnagar
and gearbox production plant at Bhandara. My sincere thanks to all the
friends and well-wishers who are the inspiration for me.
Special thanks to my dear spouse Pushpalatha, for all the love, kind
support and encouragement. My daughter Ranjana and son Mohit deserve
appreciation for understanding and supporting me. Also, I would like to
convey my sincere thanks to my father Mr K.P.Ramalingam, sister Dr
R.Saraswathy for their inspiration and moral support.
I would like to appreciate and thank the support and guidance of my
current employer M/s. ZF WABCO, customers, supplier partners and
consultants during joint development of AMT system at M/s. Ashok Leyland
Limited. I would like to express my gratitude to everyone who supported
and made this research work possible.
Ramalingam Siva Kumar

iv
ABSTRACT
Automated Manual Transmission (AMT) system is a shift by wire
technology built upon manual gearbox and integrated with a conventional
dry clutch. AMT was developed & proven for long-haul truck application in
Europe, but it is gaining popularity in Indian passenger cars and
commercial applications as compared to fully automatic transmission (AT)
or Dual Clutch Transmission (DCT) which is an advanced form of AMT.
Since the AMT joystick replaces the gear shift lever and the clutch
pedal is deleted (two pedal vehicles), there is no physical feedback of gear
shift and clutch operating forces or travel to the driver. Also, the AMT
electronic controller does not receive feedback on the actual health condition
of the clutch and gearbox hardware; particularly wear and tear components
like gear synchronisers and clutch disc which are critical for consistent
performance, shift quality, and comfort. Hence, the driver can't get early
symptoms of degradation in gearshift and/or clutch functioning and results
in vehicle breakdown without warning signal.
This thesis covers the research work done for the development of an
integrated prognostics module for real-time condition monitoring of the dry
clutch system and manual gearbox, to address the above-stated problem.
Prognostics methodology is conceptualized separately for gearbox and
clutch and integrated within existing AMT controller. Modelling of the AMT
system is done using MATLAB/Simulink and integrated with other sub-
systems models like engine, final drive, and vehicle dynamics. The
simulation was done with road load data duty cycle acquired from actual
vehicle testing.
Real-time data logging from distance sensors and speed sensors of
the AMT system along engine speed sensor data are used done using
CANAPE software and is used by the observer to monitor the piston

v
positions of the clutch actuator and gear actuator. Also, effective
synchronisation time is monitored during the synchronisation phase which
eliminates the complexity of free play in the linkages, wear, and simplifies
data acquisition/analysis.
Original parameters of the new clutch and gearbox hardware are
stored in the Electrically Erasable Programmable Read-only Memory
(EEPROM) of the AMT controller and the real-time data is used by the
integrated prognostics module for assessing the degradation/wear and
estimating the remaining useful life (RUL).
The observer monitors clutch slip during torque transmission, by
using engine output speed (before clutch) signals from Communication Area
Network (CAN) and comparing with the gearbox input shaft speed (after
clutch) from the AMT sensor. Gearbox synchroniser movement which is
magnified at the gear actuator end could be assessed by monitoring the
travel using distance sensors of the AMT gear actuator. Actual
synchronisation time during gearshift is monitored by using the input and
output side speed sensors of the AMT gearbox.
The simplified methodology is developed for real-time monitoring of
the health of clutch and gearbox hardware and providing a timely alert to
the driver, before the failure of any hardware component. Thus, condition
monitoring of an AMT system provides prognostic functionality that
ensures consistent clutch performance, gear shift quality, and timely
warning for recalibration, repair, and/or replacement of the critical wear
and tear parts. Also, systematic analysis of the monitored data enables
accurate troubleshooting and advanced diagnosis of a developing fault.
Keywords: Automated Manual Transmission, AMT, Gearbox, Clutch,
Synchroniser, Clutch Slip, Synchronisation time, Wear, Degradation,
Condition Monitoring, Remaining Useful Life, Prognostics, and
Diagnostics.

vi
TABLE OF CONTENTS
ACKNOWLEDGEMENT ..................................................................................................... i
ABSTRACT ........................................................................................................................ iv
TABLE OF CONTENTS .................................................................................................... vi
LIST OF TABLES ............................................................................................................... x
LIST OF FIGURES .............................................................................................................. x
LIST OF SYMBOLS .......................................................................................................... xii
LIST OF ABBREVIATIONS ........................................................................................... xiv
CHAPTER 1 ......................................................................................................................... 1
INTRODUCTION ................................................................................................................ 1
1.1 Thesis Overview .................................................................................................... 1
1.2 Background ............................................................................................................... 3
1.3 AMT Gearbox ......................................................................................................... 6
1.4 AMT Clutch ............................................................................................................ 9
1.5 AMT Controller ................................................................................................... 12
1.6 AMT Functional Block Diagram ..................................................................... 15
CHAPTER 2..................................................................................................................... 17
LITERATURE REVIEW............................................................................................... 17
2.1 AMT Gearbox and Clutch ................................................................................. 17
2.2 AMT Modeling ..................................................................................................... 21
2.3 Prognostics Methodology ................................................................................... 25

vii
2.4 Summary of literature review .......................................................................... 28
2.5 Research gaps ...................................................................................................... 28
2.6 Problem Formulation ......................................................................................... 29
2.7 Motivation ............................................................................................................. 30
2.8 Objectives of the study ....................................................................................... 30
2.9 The methodology adopted for the study ......................................................... 31
2.10 Summary ........................................................................................................... 34
CHAPTER 3..................................................................................................................... 36
PROGNOSTICS METHODOLOGY ........................................................................... 36
3.1 AMT Gearbox ....................................................................................................... 36
3.1.1 Synchroniser wear ............................................................................................ 36
3.1.2. Synchronisation time ...................................................................................... 38
3.1.3 Gearbox Prognostics ......................................................................................... 38
3.2 AMT Clutch .......................................................................................................... 40
3.2.1 Clutch Disc Wear ............................................................................................... 40
3.2.2 Clutch Slip .......................................................................................................... 41
3.2.3 Clutch Prognostics Methodology.................................................................... 42
3.3 Integrated Prognostics Module ........................................................................ 45
3.3.1 Observer Concept .............................................................................................. 45
3.4 Prognostics warning ........................................................................................... 47
3.4.1 Gearbox ................................................................................................................ 47
3.4.2 Clutch ................................................................................................................... 47
3.4.3 Prognostics warning ......................................................................................... 48
3.5 Modelling of algorithms ..................................................................................... 49

viii
3.5.1. Objective ............................................................................................................. 49
3.5.2. Random value generation .............................................................................. 49
3.5.3. Output ................................................................................................................. 50
3.5.6. Report ................................................................................................................. 50
3.6 Summary ............................................................................................................... 51
CHAPTER 4..................................................................................................................... 52
AMT MODELING .......................................................................................................... 52
4.1 MATLAB / Simulink modelling ....................................................................... 52
4.2 Block Diagram of AMT vehicle ........................................................................ 53
4.3 Block Diagram of Sub-systems ........................................................................ 55
4.3.1 Vehicle Dynamics .............................................................................................. 55
4.3.2 Final Drive .......................................................................................................... 60
4.3.3 Engine .................................................................................................................. 61
4.3.4 Gearbox ................................................................................................................ 64
4.3.5 Clutch ................................................................................................................... 65
4.3.6 Drive Cycle .......................................................................................................... 65
4.4 AMT gearshift algorithm .................................................................................. 67
4.5 Gearshift “Suggestor” Model ............................................................................ 69
4.5.1 Gear Shift logic .................................................................................................. 69
4.5.2 Gearshift “Suggestor” ....................................................................................... 73
4.6 Summary ............................................................................................................... 76
CHAPTER 5..................................................................................................................... 77
SIMULATION ................................................................................................................. 77
5.1 Integrated prognostics module ........................................................................ 77

ix
5.2 Gearshift algorithm ............................................................................................ 79
5.3 Summary ............................................................................................................... 84
CHAPTER 6..................................................................................................................... 85
EXPERIMENTAL VALIDATION .............................................................................. 85
6.1 Component Level ................................................................................................ 85
6.2 Assembly Level .................................................................................................... 88
6.3 System Level ........................................................................................................ 90
6.3.1 Data logging software .................................................................................... 90
6.3.2 Data Acquisition .............................................................................................. 91
6.3.3 Data Analysis ................................................................................................... 93
6.4 DOE Factorial design ......................................................................................... 94
6.4.1 Minitab analysis ................................................................................................ 94
6.4.2 Main effects and interactions plot ................................................................. 95
6.4.3 Optimisation ....................................................................................................... 97
6.5 Results and discussions ..................................................................................... 98
6.6 Summary ............................................................................................................... 99
CHAPTER 7................................................................................................................... 100
CONCLUSION ............................................................................................................. 100
7.1 Salient conclusions ........................................................................................... 100
7.2 Specific contribution to research ................................................................... 101
7.3 Further scope of work ...................................................................................... 102
REFERENCES ............................................................................................................. 103
APPENDIX .................................................................................................................... 112
LIST OF PUBLICATIONS......................................................................................... 129

x
BRIEF BIOGRAPHY OF THE CANDIDATE ....................................................... 131
BRIEF BIOGRAPHY OF THE SUPERVISOR ..................................................... 132
BRIEF BIOGRAPHY OF THE CO-SUPERVISOR .............................................. 133
LIST OF TABLES
Table Description Page no
1.1 Comparison of AMT, AT and MT 5
4.1 Constants and assumptions for AMT modelling 56
4.2 Engine Specific Fuel Consumption map 73
LIST OF FIGURES
Figure Description Page no
1.1 Assembly of AMT gearbox arrangement 6
1.2 Exploded view of a synchroniser assembly 7
1.3 View of AMT gearbox actuator 8
1.4 Illustration of Gearbox actuator in a neutral position 8
1.5 Illustration of Gearbox actuator in 1st gear position 9
1.6 Assembly of AMT clutch arrangement 10
1.7 Pneumatic clutch actuator in clutch engaged condition 11
1.8 Pneumatic clutch actuator in clutch dis-engaged condition 11
1.9 Assembly of AMT controller 13
1.10 AMT controller interface with vehicle systems 14
1.11 AMT Functional Block Diagram 15
1.12 Organization of Thesis 16
2.1 AMT Problem Formulation 30

xi
Figure Description Page no
2.2 Design Research Model 33
2.3 Research Methodology 35
3.1 Typical synchronisation phases 37
3.2 Algorithm for AMT gearbox prognostics 39
3.3 Algorithm for AMT Clutch prognostics 44
3.4 Block diagram of AMT prognostics observer 45
3.5 Integrated Algorithm for clutch and gearbox 46
3.6 Gearbox synchro wear limits 47
3.7 AMT Clutch Wear Monitoring arrangement 48
3.8 AMT Prognostics Warning 48
3.9 MATLAB program for simulation of prognostics model 51
4.1 Simulink Model for the vehicle with AMT System 54
4.2 Simulink Model for vehicle dynamics sub-system 55
4.3 Simulink Model for rolling resistance sub-system 57
4.4 Simulink Model for gradient sub-system 58
4.5 Simulink Model for aerodynamic drag sub-system 59
4.6 Simulink Model for acceleration sub-system 60
4.7 Simulink Model for Final drive sub-system 60
4.8 Lookup table (n-D) 61
4.9 Simulink Model for engine sub-system 63
4.10 Simulink Model for gearbox sub-system 64
4.11 Simulink Model for clutch sub-system 65
4.12 Simulink Model for drive cycle sub-system 66
4.13 Typical Shift strategy based on gearshift tables 67
4.14 AMT Shift Algorithm 68
4.15 Typical engine operating map 71
4.16 Vehicle performance curve 72
4.17 Simulink model for AMT gearshift Suggestor 75
5.1 MATLAB prognostics model input 77
5.2 MATLAB prognostics model screen output 78
5.3 MATLAB prognostics model output report 79
5.4 Real-time simulated and measured speed 80
5.5 Detailed view of simulated and measured speed 81
5.6 Real-time simulated and measured torque 82
5.7 Detailed view of simulated and measured torque 83
6.1 SSP 180 Standard synchroniser test rig 86
6.2 Synchroniser test rig results 87
6.3 AMT Gearbox Test Rig at Ashok Leyland plant 88
6.4 AMT Gearbox Test setup 89

xii
Figure Description Page no
6.5 AMT Gearbox end of line testing 89
6.6 Vector CANAPE data logging 90
6.7 AMT Gearbox gear actuator stroke measurement 91
6.8 AMT data logging using Vector Canape tool 92
6.9 AMT Synchronisation time in different shift modes 93
6.10 Minitab factorial design 94
6.11 Main effects plot for shift quality 95
6.12 Interaction plot for shift quality 95
6.13 Main Effects plot for drivability 96
6.14 Interaction plot for drivability 97
6.16 Optimisation plot for shift quality and drivability 98
LIST OF SYMBOLS
g : deceleration due to gravity, 9.81 m/s2
α : angle of gradient or slope, degree
ρ : air density, 1.2 kg/m3
θ : acceleration, m/s2
F : force, N
A : frontal surface area, m2
v : vehicle speed, m/s
m : vehicle mass, kg
cw : drag co-efficient
J : engine Rotational Moment of Inertia, kg-m2
α : angular Acceleration of Engine, rad/s2
ω : angular Speed of Engine, rad/s

xiii
Te : torque Produced by the Engine, N-m
Tl : torque by the Vehicle Dynamics, N-m
r : radius of the tire,
Vs : the volumetric capacity of engine, cc
Ne : engine speed, rpm
%thr : % throttle or accelerator position, mm
Pme(R) : brake mean effective pressure by the engine to
overcome the running resistance R.
sw : synchroniser wear (mm)
dcl : the learnt value of gear actuator position (mm)
dc : the current value of gear actuator position (mm)
cl : clutch wear (mm)
ap : current value of actuator position (mm)
apl : the learnt value of actuator position (mm)
ws : wheel speed, radians/second
sp : propeller shaft speed, radians/second
tw : wheel torque, Nm
tp : propeller shaft torque, Nm

xiv
LIST OF ABBREVIATIONS
AMT : Automated Manual Transmission
MT : Manual Transmission
AT : Automatic Transmission
DCT : Dual Clutch Transmission
CVT : Continuously Variable Transmission
PCA : Pneumatic Clutch Actuator
XYA : X-Y Actuator
SLU : Shift Lever Unit
RUL : Remaining Useful Life
AMTCU : AMT Controller Unit
CAN : Controller Area Network
ABS : Antilock Brake System
SLU : Shift lever unit
PHM : Prognostics and Health Management
ECU : Electronic Control Unit
DRM : Design Research Model
TCU : Transmission Control Unit
ECU : Electronic Control Unit
AMTCU : Automated Manual Transmission Control Unit
CBM : Condition Based Maintenance

xv
EEPROM : Electrically Erasable Programmable Read-only
Memory
ISO : International Standards Organisation
DOE : Design of Experiments
KWP : Key Word Protocol
GUI : Graphical User Interface
rpm : Revolutions Per Minute
SAE : Society of Automobile Engineers
DC : Direct Current
ACC : Accelerator pedal
DTC : Diagnostic Trouble Code
SPN : Suspect Parameter Number
LPM : Lumped Parameter Model
CMGB : Constant Mesh Gear Box
SMGB : Synchro Mesh Gear Box
SFC : Specific Fuel Consumption
MATLAB : Matrix Laboratory
kmph : kilometre per hour
BMEP : Brake Mean Effective Pressure
APPS : Accelerator Pedal Position Sensor
N : Neutral Gear
F : Forward Gear
R : Reverse Gear

xvi
P : Parking
D : Drive
IoT : Internet of things
MAX-MIN : Maximum-Minimum
IAFS : Integrated Air/Fuel Frameworks

1
CHAPTER 1
INTRODUCTION
1.1 Thesis Overview
This research work is presented in seven chapters as detailed below and
the organisation of the thesis is pictorially represented as Fig.1.12:
Chapter – 1: The first chapter of the thesis introduces the research
background and a detailed review of the AMT system. The functional block
diagram of the system and interface of the AMT gearbox, clutch, and
controller is explained. The research objective and the main research topics
have been summarised.
Chapter – 2: The second chapter presents the current state of the art in
the modelling and simulation of AMT Gearbox and Clutch System
prognostics. Various experimental, theoretical, and numerical aspects of
real-time condition monitoring are explained. A brief overview of the
comparison of existing methods and research gaps are also presented in this
paper. The motivation for research work in condition monitoring of the AMT
system and methodology adopted is detailed.
Chapter – 3: The third chapter presents a detailed discussion on the
conceptualization of a real-time condition monitoring module for the clutch
and gearbox of the AMT system. This chapter also explains the prognostics
algorithms and flow charts used for coding in the simulation program in
MATLAB.

2
Chapter – 4: The fourth chapter presents the development of the
numerical simulation model for AMT using MATLAB Simulink. This chapter
also details the algorithms, constants and assumptions, block diagrams of
Sub-systems like engine, gearbox, clutch, vehicle dynamics, drive cycle, and
final drive System which are required for simulating the AMT gearbox and
clutch systems on an automotive vehicle.
Chapter – 5: The fifth chapter presents the Simulation of real-time
condition monitoring algorithms for clutch and gearbox using the Simulink
model of the complete vehicle system fitted with AMT. Comparative analysis
of simulation results with the data log from the test rig is done for validating
the prognostic model proposed is covered in this chapter.
Chapter – 6: The sixth explains the test setup, test results, factorial
design, and analysis of the experimental validation at the component level,
system-level and vehicle level for validating the model-based AMT
prognostics design
Chapter – 7: The seventh chapter presents conclusions of the research
work based on the results obtained in both simulations and experiments for
AMT gearbox and clutch prognostics. Salient contribution to the research and
recommendation for future work has also been discussed.

3
1.2 Background
Automated Manual Transmission (AMT) is a versatile “Shift by wire”
technology built on robust and proven base Manual Transmission (MT),
which is deployed in the European market for the past two decades, mainly
for long-haul commercial goods vehicles. Interface with electronically
controlled engines is a prerequisite for the AMT system, and this delayed
mass penetration of AMT in the Indian market until the implementation of
electronic engines for Bharat Stage 4 (BS4) emission norms in 2016. Also,
Anti-lock Brakes System (ABS) is required for the hill assist feature with
AMT is possible with ABS regulations for India implemented in 2014.
Although the AMT is a proven technology in Europe for inter-city goods
applications, the global markets are moving towards Dual Clutch Technology
(DCT) technology. Hence, adopting and customizing AMT technology for
passenger applications, meeting the Indian load and road conditions is a
significant challenge. Please refer to Appendix II for details market
penetration of transmission automation technologies, which is evident from
most of the passenger cars in India offering AMT solutions and customers are
willing to pay for a comfortable drive in city traffic.
Eco-friendliness norms on vehicles are getting progressively severe to
control an unnatural weather change. Transmission producers have reacted
with a scope of recommendations for improving eco-friendliness. Kuroiwa et
al. (2004) present the alternative technologies that have been developed for
better fuel efficiency transmission to replace the existing AT and
Continuously Variable Transmission (CVT). One technique that is gaining
popularity is an AMT, basically an MT with semi-automatic controls. Global
trends in transmission automation are shown in Appendix III, which
highlights the growth of AMT technology.
The intensity of the framework lies in the way that electronic gear can
respond a lot quicker and more definitely than a human. It exploits the

4
accuracy of electronic signs, for selecting and executing smooth gearshift and
clutch operation without the intervention of the driver. Automatic
Transmission (AT) with torque convertor offers superior shift comfort (no
torque interruption during gearshift) is preferred for passenger cars and
buses. Still, the acquisition cost is prohibitive, and losses in the torque
converter, wet clutch, and additional cooling arrangement result in an
inferior fuel economy.
AMT system eliminates clutch pedal and gearshift lever, providing smooth
clutch and gearshift operation and helps in improving driver and passenger
comfort. Auto mode is provided as default, but the manual mode option is
available, and this is a unique advantage of AMT over AT. The driver selects
either the forward gear (first gear) or the reverse gear, and the remaining up
or downshifts are done by the AMT system, depending on the road and load
conditions. Even in manual mode, the driver provides the intention to shift
the gear up or down through a joystick or button, but the system checks if the
road and load conditions are suitable and then executes clutch and gear
operations. If the conditions are not favourable for the safety of the clutch and
gearbox, then the request is rejected.
The gearbox is one of the central systems that impact the power and fuel
efficiency of the vehicle. The gearbox performance is associated with gear
efficiency, noise, vibration, and harness (NVH), and safety while changing
gear Bedmar (2013). AMT is turning out to be a preferred solution for
commercial vehicles because the availability of skilled drivers is becoming
scarce, and the de-skilling of the drivers enables improved and consistent fuel
economy in a fleet. Also, there is an option of choosing power or economy
mode, depending on the preference of the driver. Refer to Appendix IV for
details of transmission technology trends in India, which is evident from most
of the passenger cars offering AMT.
As the clutch pedal is eliminated, abuses like clutch riding and half
clutching are avoided, ensuring smooth clutch operation and gearshifts at

5
correct speeds for optimal performance, comfort, and enhanced life of
drivetrain components. Even though the clutch pedal is eliminated, the
accelerator pedal provides a kick-down option to avoid rollback during the
uphill launch. These features have made AMT popular even for passenger
cars, which was predominantly using AT for automation. A consolidated
summary of the comparison between AMT, AT, and MT systems is detailed
in table 1.1.
Table.1.1: Comparison of AMT, AT, and MT

6
1.3 AMT Gearbox
AMT system uses a dry clutch, a base gearbox (same as MT), and an
embedded dedicated transmission control system that uses electronic sensors,
processors, and actuators to actuate the clutch and the gear shifts. It does not
require clutch pedal actuation or gear shifting by the driver. Refer to
Appendix V for typical internal arrangements and linkages of gearbox shift
and select that are part of the AMT. A joystick replaces the gear shift lever,
and the driver selects only the forward gear or reverse gear. The Assembly of
gearbox actuator, clutch actuator, and sensors used for AMT are shown in Fig
1.1.
Fig.1.1: The AMT gearbox assembly (Service Manual 2014)
Synchronisers work as cone brakes, and they accelerate or brake the
component to adjust the speed of the shaft and gear. They are subject to
wear and impact the gearshift quality as well as the reliability of the
system. Hence, monitoring of the condition of the synchronisers will enable
the prognostics system to set the alarm to wear limits and provide an alert

7
if the condition exceeds specified accepted levels. The exploded view of the
synchroniser assembly is as shown in Fig.1.2.
Fig.1.2: Exploded view of a synchroniser (Service Manual 2014)
Generally, electro-pneumatic actuators (XYA) are used for gearshift
and select operations of AMT gearbox in commercial vehicle applications,
as shown in Fig. 1.3 whereas cars and light commercial vehicles use electro-
hydraulic or electro-magnetic actuation system. Also, complete electric
actuation using stepper motor arrangement is possible for electric vehicle
applications. The typical arrangement of a powertrain, including engine,
gearbox, and clutch, is as shown in Appendix VII.

8
Fig.1.3: AMT gearbox actuator (Service Manual 2014)
Figure 1.4 illustrates the position of the gear shift and select cylinders
of the gearbox actuator in a neutral position.
Fig.1.4: Gearbox actuator in the neutral position (Service Manual 2014)
Figure 1.5 shows the location of shift finger movement in both X & Y
directions for changing from neutral gear to 1st gear. Similarly, movement

9
in X & Y directions are done for switching to other forward gears and
reverse gear.
Fig.1.5: Gear actuator in gear position (Service Manual 2014)
1.4 AMT Clutch
Clutch controls of an automobile equipped with an AMT system are
integrated into the accelerator pedal, and there is no separate pedal for the
clutch (two pedal vehicles). Once the accelerator pedal sensor sends the
driver’s intention to launch the vehicle (forward or reverse), the AMT
electronic controller takes over the automated actuation of the electro-
pneumatic clutch actuators.
The clutch is only needed to get the car in motion. Clutch controls for
further gear changes (upshift and downshift) are synchronised along with the
gear shift actuation and automatically done by the AMT controller, with no
intervention of the driver. The optimal timing and torque required for a
smooth clutch engagement are based on input from the sensors and other

10
parameters such as engine speed, vehicle speed, and driver’s demand via the
accelerator pedal.
The dry clutch mechanism of the AMT system is the same as conventional
MT. The clutch actuator is integrated with a solenoid to form a single unit
and gets mounted over transmission bell housing. The actuator plunger will
be directly facing the clutch release fork for clutch disengagement and
engagement. The clutch booster, master cylinder, and clutch pedal used for
actuation of Manual transmission are deleted and replaced by an electro-
pneumatic actuator (with inbuilt stroke sensor) as shown in Fig. 1.6. This
ensures minimal torque interruption during launch from a stop as well as up
and down gearshift, with least jerk or shift discomfort. Also, it is critical to
launch the vehicle on a gradient (uphill or downhill), without any rollback or
roll forward due to the unavailability of the clutch pedal.
Fig.1.6: Assembly of AMT Clutch Actuator (Service Manual 2014)
The cross-section view of the pneumatic clutch actuator (PCA) shown in
figure 1.7 illustrates the position of pushrod (85 mm in as fitted condition),
which corresponds to clutch engaged or close state. Figure 1.8 illustrates the
position in clutch dis-engaged or open condition (standout changed to 105
mm), corresponding to a 20 mm stroke of the clutch actuator.

11
Fig.1.7: Clutch actuator in engaged condition (Service Manual 2014)
Fig.1.8: Clutch actuator in dis-engaged condition (Service Manual 2014)

12
Salient features of AMT clutch and advantages over manual clutch are
given below:
● The clutch is automatically disengaged when engine speed falls
below idling (engine never dies-off with AMT), in all conditions of
the vehicle, load, and slope.
● AMT system always learns the clutch wear and updates the stroke
for reaching the “kiss” point (the point where torque transmission
starts).
● Clutch engaging time is reduced by using fast and slow solenoids.
The clutch booster uses a fast solenoid till the “kiss” or contact point
and then a slow solenoid used for smooth engagement.
● Clutch engagement starts once the low idle switch is closed (~ 5%
stroke of accelerator pedal position). Clutch engagement time can
be customized for applications and modes.
● In case of electrical or CAN communication failure, the vehicle
continues in the same gear, and the clutch is disengaged when zero
speed is reached.
Typically, electro-pneumatic actuator assembly is used for AMT clutch
for commercial vehicle applications. Whereas, cars and light commercial
vehicles use electro-hydraulic or electro-magnetic actuation system. Also,
complete electric actuation using stepper motor arrangement is possible for
electric vehicle applications. Please refer to Appendix IX for the classification
of AMT systems.
1.5 AMT Controller
The electronic control unit (ECU) of AMT is an integral part of the shift
lever unit (SLU) with an electrical connector at the bottom, as shown in
Fig.1.9. Hall Effect sensors sense the direction of the requested shift, and this

13
input, together with the speed and position sensors in the gearbox, which
detects the current speed and gear selected, feeds into a central processing
unit. This unit then determines the optimal timing and torque required for
smooth clutch engagement, based on input from these two sensors as well as
other factors, such as engine speed, vehicle speed, and driver’s demand via
the accelerator pedal. It processes the status of gear position and requests
from external switches and communicates with CAN bus of vehicle network.
Fig.1.9: Shift Lever with inbuilt controller (Service manual 2014).
The central processing unit powers an actuation unit to either engage or
disengage the clutch, which is kept in close synchronisation with the gear-
shifting action the driver has started. The connections shown in black are
electrical from the vehicle to the controller and from actuators/sensors to the
controller. Transmission control deals with transmission actuator shift, select
control, and logic diagram of optimum gear position decision. By making use
of sensor inputs and a logic diagram for transmission control, optimum gear
position has been decided, and the shift up or shift down process takes place
by controlling the clutch.

14
The typical interface of AMT components interface with other vehicle
systems is as shown in Fig 1.10. The connections shown in red are typically
pneumatic or hydraulic and in red lines are electric supply from vehicle to
AMT gearbox and clutch actuators. The decision-making logic further enables
the control of driving modes, namely economic and racing modes. The power
mode is preferred when the driver wishes to overtake (accelerating further in
the same gear) a vehicle. The economic mode is the default mode. A switch
is provided for the selection of mode, which simply modifies the upshift point
for each gear limit.
Fig.1.10: AMT System interface with the vehicle. (Service Manual 2014)
Clutch Actuator
XY Actutator Shift Lever with TCU
Base GB w/o tower

15
1.6 AMT Functional Block Diagram
Based on engine speed, vehicle speed, accelerator pedal position, the
transmission controller evaluates the appropriate gear for the selected mode
(economy or power). Clutch actuation and gear shifting are done
automatically. During shifting AMT ECU controls engine throttle for a
smooth shift. The gear position sensor is used for gear shift control as well as
for display to the driver. A clutch position sensor is used for clutch control
and estimation of the remaining useful life. The gradient sensor is used for
different gear shift strategies like hill assist during uphill. R-N-D driver
controls driving mode switch through operating joystick for reverse, neutral,
or forward drive. An Air pressure sensor is used for providing a warning if
the pressure of the source reservoir drops below the threshold value. The load
sensor helps in estimating the payload and deciding the shifting strategy. The
input and output of the AMT controller are as shown functional block diagram
in Fig.1.11. The detailed operation of AMT is explained in Appendix VI.
Fig.1.11: AMT Functional Block Diagram (Service Manual 2014)

16
. Fig.1.12: Organization of Thesis

17
CHAPTER 2
LITERATURE REVIEW
In this chapter, an extensive literature review is covered in detail under
three sub-chapters
1. AMT Gearbox and Clutch System
2. AMT Modeling and
3. Prognostics methodology.
Various experimental, theoretical, and numerical aspects of real-time
condition monitoring are explained. Based on the extensive literature review
and research gaps, the motivation and objectives of the thesis have been
identified.
2.1 AMT Gearbox and Clutch
Hypothetical execution conditions are inferred for multi cone
synchronisers which have replaced the conventional single-cone gadget in
certain luxury passenger vehicles. The conditions are utilized to show the
potential upgrades in move quality for an average vehicle. Exploratory
investigations of proportionate single-and triple-cone synchronisers inside a
similar gearbox test rig are additionally detailed for transmission oil
temperatures going from cold beginning to most extreme working conditions.
The outcomes affirm the general significantly better execution of the multi
cone synchroniser contrasted and the comparable single-cone, except for at
low oil temperatures, where some trouble in disseminating the oil from the
numerous grinding surfaces was clear (Abdel-Halim et al. (1997}).
A torque information-based controller communication to counter complex
function is presented by Gander et al. (1999). Current world-wide Current

18
overall patterns in powertrain advancement for passenger vehicles and light
trucks demonstrate an expansion of motor operational standards and gearbox
automating. Both for the functionality and bodily space of the applicable
controllers this may prompt a seriously large number of controller variations.
A physical combination of the dedicated controller to the motor/gear-confine
coming about mechatronics controller reduces the variations. These thoughts
have been set into large scale manufacturing as of now by integrated air/fuel
frameworks (IAFS). For the transmission, this equivalent methodology
currently has been acknowledged in large-scale manufacturing by the first
mechatronic transmission module which coordinates the gadgets, valve-body,
and sensors of another 5-speed transmission.
Although the synchronisation process is common for both shifts to high
and low gears, the changing times are different. During the upshift, the
revolution speed of the gear should decrease. As the power losses help, less
gear shift time is required. On the contrary, during downshift, the
synchronised gear is accelerating, but power losses still try to slow it down.
Therefore, the changing time is higher as explained by Lovas et al. (2005).
Hoshino (1999) simulated the synchronisation linkages of a gearbox for a
heavy-commercial vehicle which classified the gear shifting process into six
proceedings. This paper explains the effects of the shift speed and frictional
coefficient. The simulation with three diverse shift speeds brought about
various first contact purposes of the gear spline chamfer which prompted
various procedures of spline fitting. In any case, affecting synchronisation
work between the sleeve and the grip gear, neither the linkages nor the
drivetrain is incorporated.
To defeat these challenges a unique model of the whole synchroniser,
selector instrument, driveline, and transmission has been made. The
numerical model forecasts the gearshift quality for a given arrangement of
data, which can be associated with test information. The model would then
be able to be utilized for parameter studies to explore potential enhancements

19
to gearshift quality. The model can likewise be utilized at the idea stage to
demonstrate reasonable for synchroniser performance (Kelly and Kent
(2000)).
The fitment circumstance with transmission structure and space,
potential for fuel savings by efficiency, lower emission and noise levels,
functionality, drive comfort, transmission weight, and assembling costs are
considered as the fundamental principles. This prompts an appraisal and
suggestion for the utilization of certain transmission frameworks for the
different driveline arrangements (Wagner (2001)).
Automated gear shifting, which joins gearbox structures looking like those
of manual gearboxes with control components interfacing with the gearboxes
as well as with clutches or the powertrain, turns out to be progressively
famous in drivetrain layout since it consolidates the productivity of the
manual gearbox design with the solace of fully automatic shifting (Abel et al.
(2006)). Present-day manual transmissions are furnished with synchroniser
frameworks for better and increasingly open to moving execution
Advanced manual gearboxes are fitted with synchronisers for enhanced
performance of gearshift. Gong et al. (2008) present the common method of
manual gearbox assemblies for heavy-duty vehicles and the performance test
setup for synchroniser performance is industrialized with which the real-life
working conditions are simulated. The shifting cycle is robotized which
eliminated the fatigue and error due to physical shifting by the operator. The
test strategies and assessment techniques are presented. The synchronisers
are subjected to the test as per plan and the process of shifting is analyzed
objectively using the graphical test result.
Gear shifting force is the load the driver must apply at the shift lever and
is the sum of the shifting effort in static, due to the profile of the ramp, and
the shifting effort is dynamic, due to the action of synchronisation (Sharma
and Salva (2012)).

20
Blokhin et al. (2017) examined the essential patterns of the advancement
of current mechanical transmissions of trucks and buses. It gives the created
different arrangement of multispeed transmissions with programmed control
and various transmissions from 6 to 16 for trucks and transports.
Hypothetical and test information on the gear change time are analysed.
Lei et al. (2019) focused on the dedicated automated manual gearbox
architecture of an electric bus without a clutch and a synchroniser. Shift
control strategy by effectively synchronising the drive motor and by clearance
of the control phase division and the shift quality assessment which also
forms a real-world shift combined control method. The total estimation of
shift impact is far not exactly the standard worth and the achievement pace
of the move arrives at 100%.
The requests that are set on synchronisers in AMT vary from MT in many
aspects. In vehicles fitted with MT, the driver gets physical feedback from the
gear shift lever. Besides, acoustic effects can influence the shifting perception.
Schreiber and Back (2009) proposed a shift simulator that allows different
influencing factors on the subjectively perceived shift quality to be
determined and varied.
Glielmo et al. (2006) performed the control strategy for advanced AMT
gearshift with dry clutches which is structured through a various levelled
approach by segregating among five diverse AMT operating phases: engaged,
slipping-opening, synchronisation, go-to-slipping, and slipping-closing. A
numerical model consisting of drivetrain, clutch, and actuator control are
assessed on data from experiments and checked using simulation methods to
find if the controller is feasible.
Ivanovic et al. (2009) present an experimentally bolstered control-
dependent dynamic analysis of a wet clutch operated by a gear direct current
motor. The algorithm for the controller is planned for compensation the
variations in the clutch free-play caused by wear and tear of clutch parts.

21
Niu (2010) considers the principal thoughts and acknowledgement
techniques of the current starting methodology and set forward the start
throttle control strategy based on the characteristic of the clutch. The result
of the simulation and test demonstrate that the starting strategy is smarter
to be applied in the clutch utilising the pneumatic control technique.
Galvagno et al. (2011) introduced the kinematic and dynamic study of an
Automated Manual gearbox characterised by a wet-type clutch power-shift.
This torque-assist mechanism eliminates the torque interruption by
becoming the path for transferring torque while shifting of gear. The
simulation results demonstrate the points of interest regarding the quality of
gearshift and passenger comfort. The proposed control methodology execution
is confirmed on a wet clutch experimental setup.
Tseng and Yu (2015) proposed a basic approach concerning automated
manual transmission without the clutch and investigated the dynamic
qualities of the transmission synchroniser during different phases of gear-
shifting e using an exceptional numerical model of the drivetrain. To
acknowledge fast and precise gear-shifting control, the key strategy
identifying the vigorous control system for the gear-shifting actuator's
position was depicted in detail and approved on a structured test rig.
AMT technology is concerned widely in the field of semi-automatic
transmission. However, for shifting quality, the interruption of the drive
torque is a major unresolved complaint issue that has not been solved. AMT
fitted with two degrees of freedom actuator will reduce the torque
interruption time and the shift quality improves (Lin et al. (2011)).
2.2 AMT Modeling
Modelling of various gear shift systems for simulation and optimization of
control strategy and shift calibration/algorithm are detailed below:

22
The gear-changing process was defined by Lovas et al. (2006) with eight
main operating phases, using classical theories of tribology, mechanics, and
thermodynamics.
Automobile road load duty cycles are captured from the signals of sensors
using fuzzy logic. The vehicle operator's intention is assessed using fuzzy logic
with the information from vehicle sensors through which his intention is
indicated. These are then fed into a neural network detailed (Hayashi et al.
(1993)).
Parker et al. (1993) examine a conservative detection method for fault,
isolation, and architecture for condition-based machinery maintenance. Fault
pattern recognition based on neural network is adopted to analyse usual and
defective vibration signatures in the transmission.
Montazeri et al. (2010) have indicated two distinct parameters, namely
the working conditions of the powertrain and the intention of the driver, as
the prime factors in finalising gear shifting. The gear-shifting strategy is
structured by thinking about the impacts of these parameters, with the
application of a fuzzy control method.
Kumbhar et al. (2014) introduced an actuator control strategy for AMT
which utilizes electromechanical DC motor controlled linear actuators. The
actuator control methodology was built with the software in loop method. The
result of simulation for the control strategy is comparable with manual
transmission (MT) in like to like condition.
Sang (2013) proposed a strategy based on a numerical model for analyzing
the fault in the transmission under loading conditions which are varied and
to use on the wind turbine application. In the model, the parameter related
to the issue is inversely estimated by limiting the variation between the
simulated and measured features.
Chen J (2013) explained the MAX-MIN ant framework applied in the
back-propagation neural network control model of automobile automatic
transmission. This settles on the decision of ideal shift considering the vehicle

23
speed, the acceleration given through the accelerator. Results on field data
show that the automatic transmission shift control system can accelerate
convergence and better network performance.
The major drawback of the AMT could be a reduction in comfort due to
traction loss while actuating gear shift. This can be solved by appropriate
management of gear shift strategy (Kumbhar and Panchagade (2014)).
To improve the quality of shift quality in automated mechanical
transmission (AMT), the upshifting process was isolated into five stages and
the engine target speed and control strategy of each stage were planned
dependent on the attributes of clutch work. Based on the SAEJ1939 protocol,
Engine speed and speed limit torque control by sending engine control mode
were executed. The results of the test on the NJ2046 vehicle demonstrated
that the engine control strategy realized the engine control very well, and the
AMT upshifting comfort was improved by (Liu et al. (2016)).
Li et al. (2016) proposed the clutch control engagement method for
launching the vehicle for simulation and validation using experiments. The
ideal engagement procedure for various launching intentions is concluded
dependent on the linear quadratic regulator, which makes sense of a tradeoff.
The outcomes reveal that the procedure reflects the intention of the driver’s
launch.
Qi et al. (2017) built up the elements model of the process of gear shifting
of an AMT gearbox by considering the stiffness, the damping, and the
backlash of the gear and the synchroniser. The entire shifting procedure is
modelled and validated with experimental data to demonstrate the exactness
of the elements model. The outcomes reveal that the comprehensive
evaluation index can be reduced by 23% by managing the parameters of the
shifting procedure.
Huang and Gühmann (2018) presented an innovative automatic virtual
calibration framework proposed in the Model-in-the-Loop environment. The

24
shift curve for the transmission synchronisation system is implemented and
validated as a case study for optimization.
Singh et al. (2018) proposed a novel methodology of AMT gear shifting by
using polynomial functions as opposed to utilizing gearshift maps directly for
shifting the gears. Driveline models are divided into three classifications
relying upon various periods of activity of driveline as an engaged model,
slipping model, and synchronisation model. Simulations are done for gear
shifting using the model and the outcome reveals that gearshift maps can be
used for varying load and accelerator inputs.
Wang et al. (2018) introduced a consistent gear shifting can be obtained
by changing the clutch to the synchroniser. To make the output torque of the
gearbox change easily, addressing the vehicle jerk and friction work as the
shift performance indexes, different coordinated control strategies were
embraced for various stages during shifting. The dynamic model of MATLAB
/ Simulink was built up and simulated, which showed the practicality and
adequacy of the coordinated control strategy for gear shifting.
Sun et al. (2019) proposed a gearshift assistant mechanism to take out or
lessen torque interruption and driveline jerk for customary AMT, comprising
of a torque complementary motor and an epicyclic mechanism with a
synchronising clutch. AMT controller is intended to accomplish assumed
gearshift execution, and comparable with the results of the simulation.
A dynamic simulation and investigation of the gearbox double-cone
synchroniser using ADAMS™ cover the whole shift process and two minor
phase modules, for understanding the complex mechanism and random
engagement of the Synchroniser which happens in a brief timeframe and hard
to comprehend the synchronisation experimentally (Liu et al. (2007)).
Additionally, it gives an approach to improving two significant requests,
vehicle operational comfort, and lifespan.
Assanis et al. (2006) present the development, validation, and application
of a SIMULINK-based integrated vehicle system simulation which is

25
composed of engine, conventional manual gearbox, dry clutch, driveline, and
vehicle dynamics modules. The simulation is done and compared with real-
time actual data measured on the test track. Comparative analysis revealed
a very good agreement between simulation and test results.
2.3 Prognostics Methodology
Saxena et al. (2010) discuss the interpretation of prognostics performance
execution measurements, different problems encountered by prognosis and
evaluating the performance, nevertheless a formal notational system to
support standardising of the developments subsequently.
Sun et al. (2005) discussed the significant difficulties encountered by
automotive transmission control from three facets: calibration, shift
scheduling, and sensing/actuation, and electronics along with the research
opportunities to further improve system performance. A new trend in shift
scheduling through shift business avoidance, dynamic programming, fuzzy
logic, and learning control are detailed.
Al-Atat et al. (2011) built up a fault diagnosis method based on a distance
calculation from normal along with explicit features correlated to various
fault signatures is utilized for diagnosis of specific faults. The strategy could
be additionally stretched out for different flaws if a set of features can be
associated with a known issue signature.
Sankavaram et al. (2016) present a novel data-driven prognostic approach
for fault coupled framework by combining three sorts of data, i.e., failure time
data, status parameter data, and dynamic time-series data. It is hard to apply
the model-based way to deal with huge scope frameworks since it requires
detailed analytical models to be viable.
The ongoing research in the mechanical domain diagnostics and
prognostics are detailed by Jardine et al. (2006), including systems like a
fusion of data from multiple sensors and condition-based maintenance (CBM)

26
with importance on numerical models, algorithms, and know-hows for
processing data and decision-making for the maintenance
The current advancement in numerical model-based design methodology
has gained potential savings in time for the new product development cycle.
Luo et al. (2008) proposed a prognosis method using data composed from a
numerical model-based simulation with average and worn-out conditions.
Prediction of remaining-life is done by fraternization model-based life
estimates through time-averaged model likelihoods.
Parthasarathy et al. (2008) explained that data-driven prognostic
strategies that can be applied with the insignificant mistake in RUL
estimation while thinking about the genuine working conditions. There are
numerous prognostic methodologies, however, the scientific classification is
not obviously characterized and consensually concurred at this point. Most
common prognostics approaches are prognosis based on numerical models
used for simulation, prognosis by factual data, and based on the experience.
Lessons learned – things went right, and things went wrong in the project
can be used. Analysts who are curious about this could lose all sense of
direction in the number of various models and approaches.
Numerous ways to support the prognostic process exist but its relevance
is exceptionally subject to industrial constraints. Many possible prognostic
methods and range of publication is potential for applications that might be
keen on utilizing such advancements. Dragomir et al. (2009) recommended
that one must have a more critical look at the application of the correct
techniques.
The capacity to precisely anticipates the remaining life of partially
degraded components is crucial in prognostics. In this paper, a performance
dilapidation index is worked out with the help of multiple featured fusion
techniques to present the deteriorating severity of equipment. Considering
this pointer, an improved Markov model is planned for remaining life

27
prediction (Jihong et al. (2010)). The capacity to precisely anticipate the rest
of the life of degraded parts is vital in prognosis.
Langjord et al. (2011) proposed a versatile nonlinear observer for an
electro-pneumatic actuator that estimates the velocity of the piston, pressure
of the chamber, and anti-static friction value based on piston position
measurement only. In any case, it is taken as straight since free play is wiped
out by checking the synchronisation phase alone.
Lee et al. (2013) explain a complete study of the Prognostics and Health
Management (PHM) field, trailed by a presentation of an efficient PHM
design framework to select the most fitting algorithms for explicit
applications.
In practical industrial applications, various prognostics methodologies can
be utilised based on the data sources available for the modelling. Three
different cases are studied by (Baraldi et al. (2013)).
➢ Model-based on physical science for the degradation processes
➢ Dilapidation observation measured on comparable components
➢ Dilapidation observation for the target component
Though many publications are in the area of technical diagnostics,
technical prognostics is an unexplored area in which not much research done,
particularly in real-life usage pattern. The primary focus of current research
matters in the domain of technical prognostics: Acceptance criteria for
Remain Useful Life estimates, Prognostics Methods Sorting, and Prediction
Framework for predicting (Krupa (2013)).
Kothamasu et al. (2006) investigated the methods of reasoning and
displaying procedures that attention on improving unwavering quality and
diminishing unscheduled vacation by observing and anticipating machine
failure. This philosophy is the one basis for AMT prognostics which can help
to prevent unforeseen breakdown or repairs due to consequential damages.
International Standard ISO 13381-1:2015(E) Part 1 guides development
and application for prognosis processes.

28
2.4 Summary of literature review
Real-time condition monitoring of automotive systems has gained
popularity in the last two decades, for providing a lower cost of ownership
with prognostics. Technical prognosis as compared to technical diagnosis is
still not well charted for AMT gearbox and dry clutch as compared to DCT
and AT technologies.
Systematic analysis of the monitored data along with other signals in the
controller area network (CAN) of the vehicle enables the prognosis of a
developing fault. Condition monitoring is an evolving domain with advanced
control and sensor technology, but the methodology is yet to be matured for
many applications.
Modelling of AMT gearshift and clutch controls has attracted considerable
focus in the last decade for optimizing the algorithms and simulation of
control strategy and shift calibration/algorithm, for reducing development
time and costs involved in physical validation. Also, condition monitoring of
systems is fast advancing with the maturity of electronics and the Internet of
Things (IoT). Various AMT systems used in the commercial vehicle industry
are listed in Appendix VIII.
2.5 Research gaps
The major challenges faced by automotive transmission control are from
three facets:
a) calibration
b) shift scheduling

29
c) sensing
While a lot of work has been already done for calibration and shift
scheduling, there is scope for improvements in the following areas of
sensing:
• Since there is no clutch pedal and very minimal intervention of driver
for gearshift, real-time condition monitoring of the gearbox and clutch
hardware degradation would provide timely alerts on remaining useful
life. This would help in planning for service before breakdown.
• AMT controller does not get feedback on the condition of the gearbox
hardware, specifically synchroniser and clutch slip which is critical for
gearshift quality and drivability. A closed-loop control system would
monitor the degradation and ensure consistent performance by self-
calibration as and when required.
• By doing a methodical study of the monitored AMT sensor data along
with other signals in the controller area network (CAN) of the vehicle,
it is possible to develop advanced diagnosis as well as timely prognosis
of a developing fault.
2.6 Problem Formulation
Problem formulation for the study was done by collecting the pain
points faced by end-users (driver and passenger) and failure data from the
test vehicles. Root cause analysis was done for identifying the potential
root cause for the AMT problems which needs to be considered in the
research work. The summary of failure analysis and potential causes are
depicted in Fig.2.1

30
Fig.2.1: AMT Problem Formulation
2.7 Motivation
Due to the simple and cost-effective automation solution offered for city
traffic, AMT is gaining popularity in many countries and even in the
passenger car segment which was dominated by AT. But, most of the
developed countries are moving to DCT and CVT technologies and not
much research work is being carried out for AMT problems.
A benchmarking study revealed that well-developed prognostics exist
for fully automatic transmission (AT) with wet clutch torque convertor as
shown in Appendix XI. These are the main motivations for research work
on AMT gearbox and clutch condition monitoring for prognostics.
2.8 Objectives of the study
➢ Conceptualize real-time condition monitoring module for the AMT
gearbox and dry clutch which could be integrated with the existing
AMT controller. (Chapter 3)
➢ Develop MATLAB/Simulink models of the gearbox, clutch, and
other driveline sub-systems of the test vehicle for simulating the
AMT system. (Chapter 4)

31
➢ Simulation and analysis of the AMT gearbox and clutch system
using numerical models developed for the complete vehicle
environment. (Chapter 5)
➢ Experimental testing of the AMT gearbox and clutch (components,
assembly, and sub-system) for validating the model-based system
design. (Chapter 6)
2.9 The methodology adopted for the study
The methodology adopted for the research work on AMT prognostics
through real-time condition monitoring of gearbox and clutch are detailed
below:
1. AMT Gearbox prognostics: This involves real-time monitoring of
synchroniser wear by assessing changes in the gear actuator stroke sensor,
for providing alert to repair or replace gearbox hardware. Synchronising time
is monitored by the controller for self-calibration of the system for consistent
shift quality.
2. AMT Clutch prognostics: This involves real-time monitoring of clutch disc
wear by assessing changes in clutch actuator stroke sensor, for self-
calibration of the system for consistent shift quality. Clutch slip is monitored
from CAN data broadcast in-vehicle network, for providing alert to repair or
replace clutch hardware
3. Integrated AMT prognostics: Both gearbox and clutch prognostics are
combined and inbuilt in the existing AMT controller as an Integrated
Prognostic Module. This transmits gearbox and clutch sensor data to the CAN
network which could be used by other vehicle systems as well. A prognostic
warning is provided to the driver on the dashboard of the vehicle or through
remote monitoring.

32
4. AMT modelling using MATLAB/Simulink: MATLAB program is coded for
simulation of the integrated prognostics of gearbox and clutch systems as per
the algorithm. Simulink modelling of a complete vehicle with AMT gearbox
and clutch system includes a related interface and subsystems like engine,
gearbox, clutch, final drive, drive cycle, vehicle dynamics, unit conversion.
5. Simulation of real-time condition monitoring algorithms for clutch and
gearbox as a part of integrated prognostics module proposed. Simulink model
of the vehicle system fitted with AMT for simulating the AMT gearshift
algorithm. Comparative analysis of simulation results from the test rig is
done for validating the proposed prognostic model.
6. Prognostics validation: Experimental testing planned for validation of the
AMT condition monitoring module and DOE factorial design for optimizing
the response factors as per the below stages:
6.1 Component level test for synchroniser on SSP180 standard test rig
6.2 Assembly level test on the end of line test rig available at manufacturing
plant
6.3 Vehicle level test on the test track and data logging using Vector Canape
tool for real-time analysis
7. Conclusion: Conclusion, specific contribution to the field of research, and
future scope of work of the research are elaborated.

33
The Design Research Model (DRM) was adopted for the application-
oriented research work on AMT prognostics classification 3 is shown in
Fig.2.2. DRM listed in classification 1 to 3 are recommended for Ph.D. work
whereas classification 4 to 7 are recommended for team-based research work.
Fig.2.2: Design Research Model (Regalla S.P., 2014)
Research Clasification Descriptive study 1 Prescriptive study Descriptive study 2
1. Review-based Comprehensive
2. Review-based Comprehensive Initial
3. Review-based Review-based Comprehensive Initial
4. Review-based Review-based Review-based
initial/comprehensive
Comprehensive
5. Review-based Comprehensive Comprehensive Initial
6. Review-based Review-based Comprehensive Comprehensive
7. Review-based Comprehensive Comprehensive Comprehensive
Review based study- Based only on the review of the literature.
Comprehensive study- Includes a literature review, as well as study in which the result, as well as study
in which the results are produced by the researcher.
Initial study- Closes a project and involves the first few step of a particular steps of a particular stage to
show the consequences of the result and prepare the results for use by others.

34
2.10 Summary
An extensive literature review is done (till recent date) and detailed under
three sub-chapters namely:
• AMT Gearbox and Clutch System
• AMT Modeling
• Prognostics methodology.
Based on the extensive literature review, various experimental,
theoretical, and numerical aspects of real-time condition monitoring are
explained, and research gaps are identified. While lots of work have been
already done for calibration and shift scheduling, there is scope for
improvements in the areas of sensing. The motivation for this research work
is the gaining popularity of AMT in India and not much work done in this
area.
Objectives of the research work have been identified. The methodology
adopted for the research work on AMT prognostics through real-time
condition monitoring of gearbox and clutch is detailed and depicted as a flow
chart in Fig 2.3.
The next chapter details the real-time condition monitoring concept
developed for the clutch and gearbox of the AMT system. The algorithms of
the clutch and gearbox prognostics are integrated, coded, and simulated using
MATLAB.

35
Fig.2.3: Research methodology

36
CHAPTER 3
PROGNOSTICS METHODOLOGY
This chapter details the conceptualization of a real-time condition
monitoring module for the clutch and gearbox of the AMT system. Prognostics
algorithms and flow charts are prepared for clutch and gearbox are separately
and then integrated. Coding is done using MATLAB for simulation of the
integrated prognostics concept which is inbuilt into the AMT controller.
3.1 AMT Gearbox
As a part of this research work, author Ramalingam et al. (2015) have
modelled a prognostics module for the AMT system using a closed-loop
feedback-based condition monitoring system to enable advanced
diagnostics and prognostics of the AMT gear shift system. Closed-loop
control of the automated manual transmission system integrated with
condition-based monitoring, for gear shift system needs modelling,
simulation and calibration for optimizing the shift controls of AMT electro-
pneumatic gear shift system below listed targets:
• Minimize wear of transmission parts by recalibration.
• Ensuring consistent shifting quality and comfort.
• Optimizing shifting duration for improving drivability
3.1.1 Synchroniser wear
Since gearbox synchronisation is an exhaustive process, it is proposed to
focus the measurement of synchronization travel during the synchronization
phase alone (Stage 3 of the various stages shown in Fig.3.1). Synchroniser

37
wear, which gets magnified by the overall linkage ratio can be measured
using inductive distance sensor available in electro-pneumatic gear shift
actuator during the synchronisation phase. Synchronizer wear estimation by
monitoring the gear actuator travel during synchronization phase alone
eliminates the influence of other parameters like free play, setting variations
and wear/tear of other components and linkages. This monitoring focused
during synchronization phase alone, reduces the complexity of data
acquisition and analysis. Synchroniser wear limit for replacement is specified
in the service manual of any gearbox and typically is 0.8 mm.
Fig.3.1: Typical synchronisation phases (Lovas et al. 2005)
The prognostics module is designed to monitor the current values of the
actuator position, compare with the learnt values of actuator position and
assess the synchroniser using equation 3.1.
𝑠𝑤 = 𝑑𝑐𝑙 − 𝑑𝑐 (3.1)
Where sw is synchroniser wear (mm)
dc is the current value of gear actuator position
dcl is learnt value of gear actuator position stored in EEPROM

38
3.1.2. Synchronisation time
Synchronisation time is the time required by synchroniser to match the
speed of the next intended gear to ensure smooth shifting. Speed variation
between input and output shaft of the gearbox should be brought within 50
rpm, before shifting the gear.
Typically, synchronisation is between 0.3 and 0.8 seconds and depends on
the application and construction of synchronisers (constant or Synchromesh).
If the synchronisation time is too low, it leads to jerk and faster wear of the
components. Whereas, higher synchronisation time leads to longer torque
interruption during gearshift and affects drivability.
Synchronisation time is critical for shift quality and drivability of the
vehicle. Hence, needs to be monitored continuously for achieving consistency
in gear shift quality and vehicle drivability. This data is monitored in real-
time by the gearbox prognostics observer and filtered for stage 3 of the
synchronisation phase considered for the synchronisation parameter
specified in 3.1.1.
3.1.3 Gearbox Prognostics
Step by step detailed description of AMT gearbox prognostics
methodology as shown in the flowchart Fig 3.2 is documented below:
Step 1.0: Start of the sub-routine loop
Step 2.0: Real-time input data from Controller Area Network (CAN) of the
vehicle CAN backbone as per SAE J1939 communication protocol.
Step 3.0: Read current gear actuator position (dc) and current
synchronisation time (tc)
Step 4.0: Compare with original actuator position (dcl) stored in EEPROM.
Step 5.0: Calculate synchroniser wear limit (sw). sw=dcl-dc (3.1)

39
Step 6.1: Check if travel within the specified wear limits for each gear? If yes,
GOTO 6.2. If not, GOTO 7.1
Step 6.2: Check if the synchronisation time is within the specified limit of 0.3
to 0.8 seconds for all the gears. If yes, GOTO 3.0. If not, GOTO Step 7.1
Step 7.1: Display prognostic message
Step 8.0: End of sub-routine loop.
Fig.3.2: Algorithm for AMT gearbox prognostics

40
3.2 AMT Clutch
The electro-pneumatic clutch closed-loop feedback control system of an
Automated Manual Transmission (AMT) is used for intelligent real-time
condition monitoring, enhanced diagnostics and prognostic health
management of the dry clutch system, by integrating with the existing
gearbox prognostics module Ramalingam et al. (2017) and this is part of the
research work.
Condition monitoring of the AMT dry clutch system provides enhanced
prognostic functionality and ensures consistent quality of clutch engagement,
clutch disengagement, and gear shift. Clearly shows the clutch disc is
frictional wear and tear item. Clutch System real-time data monitoring,
condition monitoring, and clutch prognostics features are integrated with the
existing prognostics module of AMT.
Prognostics methodology developed for the AMT system is unique and
provides simplified measurement and experimentally validated algorithms
using a lookup table incorporated in the prognostics module of the AMT
controller. Prognostics methodology developed for the AMT clutch system is
based on real-time monitoring of clutch actuator position and clutch slip.
Real-world vehicle test data is used for providing a prognostic alert for
replacement of the wear and tear parts of the clutch.
3.2.1 Clutch Disc Wear
In the case of a new AMT clutch system, when installed on a vehicle,
the system self-calibrates, and stores the learned values of all defined
parameters in EEPROM of the AMT controller. Clutch friction disc wear is
estimated based on the change in the home position of the electro-

41
pneumatic actuator. The input data are obtained from stroke sensor data
broadcast in the Controller Area Network (CAN) as per the Society of
Automobile Engineers protocol SAE J1949.
When an AMT clutch system is installed on new clutch assembly or
repaired one, the system self-calibrates and stores the learnt values of all
defined parameter in EEPROM of the controller. The prognostics module is
designed to monitor the current values of the actuator position, compare
with the learnt values of actuator position and assess the clutch wear using
equation 3.2.
𝑐𝑙 = 𝑎𝑝𝑙 − 𝑎𝑝 (3.2)
Where cl is clutch wear (mm)
ap is the current value of actuator position
apl is learnt value of actuator position stored in EEPROM
When the wear limit reaches 95% of the useful life, a warning or alert
will be given for repair and/or replacement. Prognostic caution with 5%
remaining useful life would provide enough time for the driver to service
the clutch. Clutch friction pad wear was closely monitored on three test
vehicles which were operated in different city routes in real-world usage
pattern. Using the above field trial data, prognostic warning for clutch
replacement is recommended at 95% wear life. Typically warning is set
when the remaining useful life is ~5% or ~ 5000 km, before
failure/replacement.
3.2.2 Clutch Slip
Clutch slip affects the gear shift quality and, in turn, passenger/driver
comfort. This phenomenon happens mainly due to worn out clutch disc
and/or contamination of the friction disc with lubricant oil/grease. The

42
clutch slip is calculated using equation 3.3 and the inputs are obtained from
sensor data broadcast in the Controller Area Network (CAN) as per the
Society of Automobile Engineers protocol SAE J1949.
Allowable slip for the dry clutch is a maximum of 5%. If the clutch slip
exceeds the prescribed limit, a warning is given for inspection and
repair/replacement of the failed parts. Suspect Parameter Number (SPN)
522 as per SAEJ1939 (2000) CAN communication protocol describes
Percent Clutch Slip as a parameter which represents the ratio of input shaft
speed to current engine speed (in per cent).
Vehicle Application Layer - J1939-71 (through December 1999) - p. 55
Data Length: 1 byte
Resolution: 0.4 %/bit, 0 offset
Data Range: 0 to 100 %
Type: Measured
Suspect Parameter Number: 522
Parameter Group Number: [61442]
Clutch Slip% =engine rpm − input shaft rpm
engine rpm∗ 100
(3.3)
3.2.3 Clutch Prognostics Methodology
Step by step detailed description of AMT clutch prognostics methodology as
shown in the flowchart Fig 3.3 is documented below:
Step 1.0: Start of the sub-routine loop

43
Step 2.0: Real-time input data from Controller Area Network (CAN) of the
vehicle CAN backbone architecture as per SAE J1939 communication
protocol.
Step 3.0: Read clutch actuator position (ap), clutch slip % (cs) which is
communicated by the AMT controller to the vehicle CAN.
Step 4.0: Compare the original gear actuator position (apl) which is stored in
the EEPROM of the AMT controller.
Step 5.0: Calculate clutch wear limit (cl)
cl=(apl-ap)
Step 6.1: Check if clutch stroke within the specified limit of 28 mm. If yes,
calculate the remaining useful life (RUL) and GOTO 6.2. If not, GOTO 7.1
Step 6.2: Check if the clutch slip is within the specified limit of 5%. If yes,
calculate the remaining useful life (RUL) and GOTO 3.0. If yes, GOTO Step
7.0
Step 7.0: Display prognostic message
Step 8.0: End of sub-routine loop.

44
Fig.3.3: Algorithm for AMT Clutch prognostics

45
3.3 Integrated Prognostics Module
The gearbox module is programmed for monitoring the synchronising time
and gear shift actuator. This algorithm is customized for different
applications where gear duty cycle varies as shown in Appendix XII. The
clutch module is programmed for monitoring the clutch wear and clutch slip
during torque transmission. Both the modules are integrated with the
existing transmission controller of the AMT gearbox and clutch system by
Ramalingam et al. (2018) and are shown in Fig.3.4.
Fig.3.4: Block diagram of AMT prognostics observer
3.3.1 Observer Concept
Visualization tools are presented for appropriately displaying prognostics
information with graphical user interface and on-board handheld diagnostic
tool. Methodology for AMT prognostics observer concept design is sequenced
as a) Modeling b) Simulation c) Prognostics d) Degradation Monitoring e)
Prediction of remaining useful life and f) Warning. Block diagram of the AMT
Prognostics Observer is shown in Fig.3.5.

46
Fig.3.5: Integrated Algorithm for clutch and gearbox

47
3.4 Prognostics warning
3.4.1 Gearbox
The max wear limit for gearbox synchroniser is shown in Fig. 3.6 and the
prognostics alert/warning message alert is provided when it reaches 95%. The
limit for synchronisation force is defined for typical synchronisation time of
0.3 to 0.8 second (from experimental data). The real-time prognostics warning
messages from the module for recalibration and/or servicing can be provided
onboard and/or off-board for remote diagnostics.
Fig.3.6: Gearbox Synchro wear limits. (Service Manual, 2014)
3.4.2 Clutch
The initial stand out setting of pneumatic clutch actuator push rod is 106.5
± 6 mm, which is achieved by Pneumatic clutch actuator (PCA) bracket
position as showing in Fig.3.7. As the disc wears off, the standout reduces.
When the standout becomes 78.55 ± 6 mm, reverse the pressure pads in cover
assembly. As the vehicle continues to run, the standout reduces once again.
When the standout becomes again 78.55 ± 6 mm, replace the clutch disc. After
replacement of new disc, ensure the initial setting of the clutch, place the
pressure pads in the original position and follow the above procedure.

48
Fig.3.7: AMT Clutch Wear Monitoring (Service Manual, 2014)
3.4.3 Prognostics warning
Amber lamp status for prognostics warning is transmitted through a
CAN (DTC 453, SPN 520645). Based on this, telltale indication (error
symbol) is displayed in the instrument cluster of the vehicle which is shown
in Fig 3.8.
Fig.3.8: AMT prognostics warning (Service Manual 2014)

49
3.5 Modelling of algorithms
3.5.1. Objective
To check the parameters of gear (tc, dc) and clutch (ap, cs) and compare
with the EEPROM values (dcl, apl). To calculate the synchroniser and clutch
wear (sw, cl) and check is they are within the threshold. If the wear values
exceed the threshold, corresponding warning messages are to be displayed in
screen and report to be generated.
To simulate the error, a live dynamic data table is created when the
program is in the run. And the live values are generated using random values.
The dynamic table includes all the data until the program is terminated
explicitly by the user.
3.5.2. Random value generation
There are five fields gear number, tc, dc, ap and cs for which random
values are to be generated. For gear number, the randi(n) method is used
which generates integers from 1 to n. For tc, rand method is used which
generates decimal values between 0 and 1. 0.3 to 0.8 is the allowed range for
tc and if our number exceeds that, warning prompt is given. For dc, a range
is given, dc_max is 10 and dc_min is 9.2. Random values are generated
between dc_max and dc_min-0.3 to increase the probability of error which is
to be handled. For ap, like dc, a range is defined where ap_max is 106.5 and
ap_min is 78.5. Random values are generated between ap_max and ap_min-
5 to increase the probability of error which is to be handled. For cs, like dc
and ap, a range is given where cs_min(threshold) is 0.5 and cs_max is 5.
Random values are generated between cs_max+2 and cs_min to increase the
probability of error which is to be handled. The formula to generate a random
number within a range is Random_no = min+rand(1,1)*(max-min)

50
3.5.3. Output
The input which is generated live and randomly is tabulated along with a
serial number. The errors in the parameters of gear and clutch are listed. For
the gear errors in dc and tc, the respective gear number is also printed
alongside. And the amount of wear which is the difference between the dc and
dcl values are also printed. Clutch errors of ap and cs are reported and the
amount of wear in case of ap error which is the difference between the ap and
apl values are also printed.
3.5.6. Report
The report consists of the data, part of the error(clutch/gear), parameter
causing the error(tc/dc/ap/cs) and the amount of wear in the case of dc and ap
errors. The data to be tabulated is saved as a structure which has the field of
column name and value as the cell array of values which is being fetched from
the live data store. The header is formatted, and the fields are assigned to it.
The loop for the rows to be added ranges from 1 to the number of values in
the structure. The fields of a row are fetched from the structure and read as
a paragraph. The paragraph is appended to the table which in turn appended
to the report document after all entries of the table are done.
Screenshot of MATLAB program coded for simulation of gearshift and
clutch prognostics algorithm is as shown in Fig.3.9. Please refer to the
Appendix I for details of coding done for generating real-time parameters and
checking condition monitoring using prognostics module.

51
Fig.3.9: MATLAB program for simulation of prognostics model
3.6 Summary
Prognostics methodologies are developed for AMT gearbox and clutch
systems. Algorithm for the gearbox (synchroniser wear and synchronising
time) and clutch (wear and slip) is developed separately and then integrated
as a single program.
Observer concept explained for the integrated prognostic module which is
a modular and unique prognostics methodology implemented as an add-on
functionality to the existing AMT controller. Also, prognostics alert for clutch
and gearbox developed.
Coding is done in MATLAB as per the algorithm depicted in flowcharts for
generating random inputs and verifying the AMT gearbox and clutch
prognostics concept developed.
Next chapter details the AMT modelling using MATLAB/Simulink,
algorithm, constants and assumptions, block diagrams of Sub-systems like
engine, gearbox, clutch, vehicle dynamics, drive cycle and final drive System
modelling for simulating the AMT gearbox and clutch systems on an
automotive vehicle.

52
CHAPTER 4
AMT MODELING
This chapter details the AMT modelling using MATLAB/Simulink,
algorithm, constants and assumptions, block diagrams of Sub-systems like
engine, gearbox, clutch, vehicle dynamics, drive cycle and final drive System
for simulating the AMT gearbox and clutch systems on an automotive vehicle.
4.1 MATLAB / Simulink modelling
Automotive product development is a costly and time-consuming process
involving detailed study, prototyping and testing of the vehicle systems, sub-
systems and components. As product lifecycle is coming down, faster time to
market is crucial and can be achieved by concurrent engineering using model-
based engineering simulation techniques.
Modelling of the AMT system for simulation of gearbox and clutch
performance is done using MATLAB/Simulink software. It is a software
package for modelling, simulating, and analyzing dynamic systems. It
supports linear and nonlinear systems, modelled in continuous time, sampled
time, or a hybrid of the two.
Simulink provides a graphical user interface (GUI) for building models as
block diagrams, using click-and-drag mouse operations. With this interface,
models can be drawn easily. Simulink includes a comprehensive block library
of sinks, sources, linear and nonlinear components, and connectors. After
defining a model, we can simulate it. MATLAB interpolation functions can be
used along with embedded lookup table for obtaining the real-time
parameters required.

53
Since the physical testing on the test track is necessary for final
verification would be necessary only for final verification, a predictive
simulation can assist in quantifying parameters associated with subjective
shift quality and drivability are important but difficult to evaluate.
4.2 Block Diagram of AMT vehicle
Simulink modelling of the complete vehicle with AMT gearbox and clutch
system is shown in Fig 4.1 and includes the related interface and subsystems
like engine, gearbox, clutch, final drive, drive cycle, vehicle dynamics, unit
conversion. Throttle position is the input to the engine model and whenever
the clutch is fully disengaged, MATLAB function for controlling the throttle
keeps it at its minimum position.
Engine model develops the torque and transmits to the clutch model.
Clutch model transmits the torque to the gearbox. Whenever gear shifting
takes place the clutch disengages from the engine and hence stops the torque
transmission to the gearbox. Torque coming out from the clutch is given as
an input to the gearbox. By using the different ratios of the gearbox and final
drive, output torque to the wheels can be manipulated according to different
driving conditions. Thus, the vehicle moves.
According to the change in the speed & driving conditions, the vehicle
dynamics resistance and net torque of engine also change. Fuel economy
target of 3.5 kilometres per litre (kmpl) is the constraint for the simulation.
The model uses a demux block for extracting the components of the input
vector signal from the engine and provides two torque and speed signals.
Various sub-systems of the Simulink model are explained using block
diagrams.

54
Fig.4.1: Schematic block diagram of AMT Simulink model.

55
4.3 Block Diagram of Sub-systems
4.3.1 Vehicle Dynamics
Vehicle dynamics is concerned with the movements of vehicles on a road
surface. Vehicle Dynamics plays a significant role during acceleration,
braking, ride, & turning. Dynamic behaviour is determined by the forces
imposed on the vehicle from the tires, gravity, & aerodynamics. The vehicle
& its components are studied to determine what forces will be produced by
each of these sources at a manoeuvre & trim condition, how the vehicle will
respond to these forces.
The fundamental law from which most of the vehicle dynamics analysis
begins is Newton’s second law. Running resistance or tractive torque required
from the vehicle drivetrain is summation rolling resistance, gradient
resistance, aerodynamic drag and inertial resistance due to acceleration.
Block diagram of the Simulink model for vehicle dynamics subsystem as
shown in Fig 4.2.
Fig 4.2: Block diagram of the Simulink model for vehicle dynamics

56
Constants and assumptions of typical commercial vehicle and related
powertrain and drivetrain systems considered for AMT modelling and
simulation are detailed in table 4.1.
Table.4.1: Constants and assumptions for AMT modelling
Parameter Typical value
Overall Width of the test vehicle 2.3 m.
Overall Height of test vehicle 2.5 m.
Rolling Radius of tires 0.508 m.
Final drive rear axle ratio of 6.14
Rolling Resistance Factor 0.0125/kg
Restart Rolling Resistance Factor 0.027/kg
Coefficient of Drag 0.6
Air Density at 200 m. attitude 1.202 Kg/m3
Gross Vehicle Weight 35200 Kg.
Payload of vehicle 25000 kg
Moment of Inertia of Engine Parts 0.76 Kgfm2
Moment of Inertia of Other Parts 10 Kgfm2
Acceleration due to gravity 9.81 m/sec2
Max powered speed of the vehicle 120 kmph
Max restart capability on gradient 10.2 degree or 18%

57
(a) Rolling Resistance
Rolling resistance always opposes vehicle motion and is proportional to
the mass of the vehicle and road to tyre rolling resistance factor 0.0125 (12.5
kg/ton). This parameter is based on Ashok Leyland design specification and
is represented in equation 4.1. As gradient is zero on a flat road, cos factor in
the block diagram for rolling resistance as shown in Fig.4.3.
𝐹𝑟𝑜𝑙𝑙 = µ𝑅 ∗ 𝑚 ∗ 𝑔 ∗ cos 𝛼 (4.1)
Fig 4.3: Block diagram of the Simulink model for rolling resistance
(b) Gradient Resistance
Gradient resistance during the drive on uphill opposes vehicle motion
whereas it aids on the downhill drive. It is proportional to the mass of the
vehicle and Sin factor of the gradient (uphill) as represented in equation 4.2.
Block diagram of the Simulink model for gradient resistance as shown in Fig
4.4.

58
𝐹𝐺𝑟𝑎𝑑 = 𝑚 ∗ 𝑔 ∗ sin 𝛼 (4.2)
Fig 4.4: Block diagram of the Simulink model for gradient
(c) Aerodynamic Drag
Aerodynamic drag from air resistance depends on the dynamic pressure
and is thus proportional to the square of the speed as represented in equation
4.3. At low speeds it is negligible. Block diagram of the Simulink model for
aerodynamic drag is shown in Fig 4.5
𝐹𝐴𝑖𝑟 =1
2∗ 𝜌𝐿 ∗ 𝑐𝑤 ∗ 𝐴 ∗ 𝑣 ∗ 𝑣 (4.3)

59
Fig 4.5: Block diagram of the Simulink model for aerodynamic drag
(d) Inertia force due to acceleration
Inertia force due to acceleration is calculated from Newton’s second law,
which is “The sum of the external forces acting on a body in a given direction
is equal to the product of its mass & the acceleration in that direction” as
represented in equation 4.4. Block diagram of the Simulink model for
acceleration is shown in Fig 4.6
𝐹 = 𝑚 ∗ 𝑎 (4.4)

60
Fig 4.6: Block diagram of the Simulink model for acceleration
4.3.2 Final Drive
Figure 4.7 shows the block diagram of the final drive with a differential
mechanism which connects the road wheels to the output shaft of the gearbox
through the propeller shaft. At wheel end, speed is divided by the final drive
ratio as per equation 4.5 and torque is multiplied as represented in equation
4.6.
Fig 4.7: Block diagram of Simulink Model for final drive
𝑤𝑠 = 𝑝𝑠 ÷ 𝑓𝑑 (4.5)
𝑤𝑡 = 𝑝𝑡 ∗ 𝑓𝑑 (4.6)

61
4.3.3 Engine
The look-up table is made of different engine speeds at different throttle
positions and torque values. Throttle position and engine speed (rpm) have
been given as input to the engine. By interpolating the different torque values
for different combinations of engine speed and throttle value, this model gives
the output torque. As the look-up table (n-D) using Simulink block library as
shown in Fig 4.8 makes use of throttle position & engine speed (rpm), the
number of table dimensions is being set at two. Cubic Spline
interpolation/extrapolation method has been used for curve fitting.
Fig 4.8: Look-up table (n-D)

62
As the first input, throttle position (% of maximum throttle) has been
given and as a second input engine speed (rpm) has been given. This output
torque developed by the engine is subtracted by the load torque based on the
vehicle dynamics, which includes rolling resistance, air drag resistance, &
gradient. Then, net torque is divided by engine inertia and integrated to
calculate engine speed (rpm) as shown in the Simulink model of engine
detailed in Fig. 4.9. Net torque is given to transmission box for changing the
torque and speed combinations, according to the drive conditions. The engine
torque less the net load torque results in acceleration.
α = ∫ ω ∂t (4.7)
𝑇𝑒 = J ∗ α (4.8)
Where,
J = Engine Rotational Moment of Inertia (MOI) (kg-m2)
α = Angular Acceleration of Engine (rad/s2)
ω = Angular Speed of Engine (rad/s)
Te = Torque Produced by the Engine (N-m)
Tl = Torque by the Engine Vehicle Dynamics (N-m)
Using α from equation 4.7, output torque developed by the engine Te is
calculated as per equation 4.8 and subtracted by the load torque from vehicle
dynamics model as shown in Fig.4.2 (includes rolling resistance, air drag
resistance and gradient). Net torque is given to transmission box for changing
the torque & speed combinations, according to the drive conditions.

63
Fig 4.9: Block diagram of the Simulink Model for engine

64
4.3.4 Gearbox
The transmission system is the mechanism that transmits power from the engine crankshaft to the wheels
of an automobile. The necessity of a gearbox can be determined by considering the variation of resistance to
the vehicle motion at various speeds and the variation of the tractive effort of the vehicle available at various
speeds. The other function includes the reversing mechanism of a vehicle and the ability to be neutral
disconnecting the engine and the wheels even with the clutch in the engaged position. Fig.4.10 shows the block
diagram of the gearbox Simulink model.
Fig 4.10: Block diagram of the Simulink Model for gearbox

65
4.3.5 Clutch
The clutch system consists of two plates that transmit torque between
the engine and transmission. The Simulink model for the clutch system
allows gear shift event when the clutch is disengaged, and the accelerator
throttle position is kept minimum until the clutch gets engaged. Clutch is
always engaged and the torque and speed inputs from engine flywheel,
depending on the throttle position is transmitted by clutch disc as input to
the AMT gearbox which is at the output side of the clutch. Considering
inertia loss due to clutch pressure and friction plate mass, the Simulink
model is built in the block diagram of the clutch system as shown in Fig
4.11.
Fig 4.11: Block diagram of the Simulink Model for clutch
4.3.6 Drive Cycle
This sub-system is for simulating the transient road load drive cycle
data captured in test track or real-world usage condition. This subsystem

66
model provides simulated vehicle speed at specified payload as well as the
real-time gradient of the operating terrain. This includes MATLAB function
for converting speed from kmph to m/s and integrators for calculating the
distance travelled based on variable operating speed. Block diagram of the
drive cycle subsystem Simulink model is as shown in Fig 4.12
Fig 4.12: Simulink Model for drive cycle sub-system

67
4.4 AMT gearshift algorithm
The main motivation for the development of AMT is the savings in fuel
consumption of vehicle along with reduced wear of vehicle components and
increased driver comfort.
Typical automotive vehicle gear shift strategy can be based on clutch
control strategy and gear upshift and downshift as shown in Fig.4.13.
Fig.4.13: Typical Shift strategy based on gearshift tables
AMT takes input from sensors like engine speed, vehicle speed and
acceleration pedal position sensor to decide on the gearshift logic. AMT
algorithm is based on the equations for designing power train for fuel
economy. The algorithm has been detailed in form of a block diagram in Fig
4.14.

68
Fig.4.14: AMT Shift Algorithm

69
4.5 Gearshift “Suggestor” Model
Simulation model of the proposed algorithm was made and verified using
MATLAB/Simulink. Inputs for AMT gearshift logic implementation for the
development of AMTCU were given using this model.
4.5.1 Gear Shift logic
The logic for a gearshift advisory system is to select the optimal gear
among useable gear positions which provides the best fuel economy as well as
drivability. The optimal gear position is found out using parameters like
acceleration, engine speed, gear position used, etc. The most economical gear
position is determined by comparison of engine specific fuel consumption data
between each usable gear position for the same running resistance and
vehicle speed.
The algorithm takes into consideration the Brake Mean Engine Pressure
(BMEP) produced by the engine. BMEP is determined by considering the %
throttle value, given by the accelerator pedal position sensor and the engine
speed from the engine speed sensor, at time t. BMEP is converted into
running resistance Pme(R) by subtracting the acceleration force as given in
equation 4.9.
𝑃𝑚𝑒(𝑅) = 𝑃𝑚𝑒(𝑁𝑒 , %𝑡ℎ𝑟) − 1.46 (𝑟
𝜇𝑓𝜇𝑡𝑖)
2
𝛸𝑚
𝑉𝑠𝛸
𝛥𝑁𝑒
𝛥𝑡 (4.9)
Where,
Pme(R) is brake mean effective pressure produced by the engine to overcome
the running resistance R. This is the Brake mean effective pressure required
to be produced by the engine to maintain constant velocity equivalent to
instantaneous vehicle velocity.
Pme(Ne,%thr) is brake mean effective pressure being produced by the engine
to overcome the vehicle driving force, F.

70
m is the mass of the vehicle,
Vs is the volumetric capacity of the engine,
r is the radius of the tire in meters
Ne is engine rpm,
%thr is % throttle or accelerator position
𝛥𝑁𝑒
𝛥𝑡 is instantaneous engine acceleration, t is taken as 10 ms for deriving
this.
ti denotes the ratio of gear i being used, tj
represents the ratio of new gear
position j,
ejN and jme RP )(
, which are eN and
)(RPme at j gear position are given by the
following relations in equation 4.10 and 4.11
𝑁𝑒𝑗 = (𝑁𝑒)𝜇𝑡𝑗
𝜇𝑡𝑖 (4.10)
𝑃𝑚𝑒(𝑅)𝑗 = 𝑃𝑚𝑒(𝑅)𝜇𝑡𝑖
𝜇𝑡𝑗 (4.11)
Equations 4.1 and 4.2 are used to calculate the engine rpm and BMEP in
other gears.
The gear selection can also be explained based on the operational zone of
an engine, a graph that depicts full-throttle BMEP varying with engine rpm.
The graph in Fig. 4.15 describes the gear selection regions as region 1 not
valid for driving force, region 2 not valid for BMEP, region 3 for max engine
RPM, and region 4 as the brake region for the engine. So, this is the other
way of describing the gear selection that all the gear selection conditions
should satisfy this graph.

71
Fig.4.15: Typical engine operating map
Fig.4.16 shows the vehicle performance curve corresponding to the engine
operating map. The vehicle Operational point shows the equal HP point. The
coordinate of vehicle Operational point is (Vehicle velocity, running
resistance). As we can see in the figure, appropriate drivability cannot be
achieved in gear 3, 4, and 5 because of the insufficient driving force, and these
gears are also eliminated from making a judgment for optimum gear position.

72
Fig.4.16: Vehicle performance curve
Specific Fuel Consumption (SFC) corresponding to possible gear positions
is determined by referring to the SFC data map given in Table 4.2. The gear
position corresponding to the least SFC is the most optimum. The gearshift
strategy adopted strategy was the dependence on SFC for determining the
optimum gear for vehicle operation, better fuel economy. This logic also has
the potential for application to a wide range of vehicle platforms because it is
based on exact formulas

73
Table.4.2: Engine SFC (g/kw.hr) map
4.5.2 Gearshift “Suggestor”
Using the AMT block diagrams, gearshift control algorithms are
modelled in Simulink and the simulation module is termed AMT gearshift
“Suggestor” as shown in Fig.4.17. This model is developed using library
functions of Simulink as well as custom MATLAB functions.
This output from the rig test is recorded in the form of a 54 column excel
sheet, with each row having instantaneous values of variables. The sampling
time in this case is 0.5 seconds. This data is input to the model and is taken
as an array named ‘a’ with 54 columns and rows equal to twice the duration
of the test in seconds. After this data is entered in MATLAB workspace, the
inputs to the model are specified in the following steps:
• Click on the engine speed block in the model

74
• Click on the lookup table
• Specify ‘vector of output values’ as the array containing engine speed
(in this case the second column of ‘a’ array), and ‘vector of input values’
• Time array must be defined in the workspace equal to no of samples
• Similarly, other inputs like Accelerator pedal position in %, present
gear ratio, and engine acceleration are to be specified in the respective
MATLAB workspace.
The acceleration signal is specified as a separate input because the
sampling time and data logging time in AMTCU are different. Acceleration is
derived in AMTCU s/w after every 10 milliseconds, but data is logged after
every 0.5 seconds. To simulate exact AMTCU conditions, acceleration data
from AMTCU is logged and given as separate input and is not calculated from
the engine speed. The MATLAB check if the jth gear can provide enough
drivability by the following steps:
• Find the driving force (in bar) required to overcome the running
resistance
• Find the maximum driving force engine can provide in the next gear
(jth)
• Find the maximum BMEP engine can produce to this speed
• Find the maximum driving force in jth gear can provide enough
drivability.
• If the gear can provide enough drivability, check if it lies in the
desirable engine operating area.
• Calculate SFC for the engine in jth gear by referring to the engine SFC
map.
• Suggest the gear(s) that gives the lowest SFC.
• If no gear satisfies all the above conditions, the vehicle is run in the
present gear.

75
Fig.4.17: Simulink model for AMT gearshift Suggestor

76
4.6 Summary
Modelling of the complete vehicle drivetrain fitted with the AMT system
is done using MATLAB/Simulink, for simulation of gearbox and clutch
prognostics. MATLAB interpolation functions are used along with an
embedded lookup table for obtaining the real-time parameters required.
Block diagrams of the vehicle sub-systems are modelled in Simulink using
the graphical user interface (GUI) for building models as block diagrams.
Using the AMT block diagrams, gearshift control algorithms are modelled in
Simulink and the simulation module termed AMT gearshift “Suggestor” is
developed.
The next chapter details the simulation of real-time condition monitoring
algorithms for clutch and gearbox as a part of the integrated prognostics
module proposed (chapter 3) is done. The Simulink model of the vehicle
system fitted with AMT developed (chapter 4) is used for simulating the AMT
gearshift algorithm. Comparative analysis of simulation results with the data
log from the test rig is done for validating the prognostic model proposed.

77
CHAPTER 5
SIMULATION
Simulation of real-time condition monitoring algorithms for clutch and
gearbox as a part of integrated prognostics module proposed (chapter 3) is
done. The Simulink model of the vehicle system fitted with AMT developed
(chapter 4) is used for simulating the AMT gearshift algorithm. Comparative
analysis of simulation results with the data log from the test rig is done for
validating the prognostic model proposed.
5.1 Integrated prognostics module
Simulation of the integrated clutch and gearbox prognostic module is
done by running the MATLAB function developed. Screenshot of MATLAB
random data table generated for real-time values of synchronisation time
(tc), synchroniser travel (dc), clutch actuator position (ap), and clutch slip
(cs) are shown in Fig.5.1
Fig.5.1: MATLAB prognostics model input

78
Real-time simulation of the prognostics function of AMT clutch and
gearbox is done using the MATLAB command for comparing the generated
random data with the synchroniser travel (dcl) and clutch actuator position
(apl) stored in EEPROM. Prognostics limit of 5% max clutch slip (cs) and
0.3 – 0.8 seconds synchronisation time (tc) are programmed in the
subroutine for providing prognostics alert.
Simulation of the integrated clutch and gearbox prognostic module is
done by running the MATLAB function. Program output screen and option
for next step or report generation. Errors handled from randomly generated
parameters and reported in screen output as the red font is shown in Fig
5.2
Fig.5.2: MATLAB prognostics program screen output
MATLAB simulation output report for prognostics of gearbox
and clutch can be generated and the sample is as shown in Fig.5.3

79
Fig.5.3: MATLAB prognostics model output report
5.2 Gearshift algorithm
Real-time simulation of the complete vehicle with AMT gearbox and clutch
system (including related interface and subsystems like engine, gearbox,
clutch, final drive, drive cycle, vehicle dynamics, and unit conversion) is run.
Simulink modelling of Throttle position is the input to the engine model
and whenever the clutch is fully disengaged, MATLAB function for
controlling the throttle keeps it at its minimum position. The engine model
develops the torque and transmits it to the clutch model. The Clutch
transmits the torque to the gearbox.
Whenever gear shifting takes place the clutch disengages from the engine
and hence stops the torque transmission to the gearbox. Torque coming out
from the clutch is given as an input to the gearbox. By using the different
ratios of the gearbox and final drive, output torque to the wheels can be
manipulated according to different driving conditions. Thus, the vehicle
moves. Actual measurement data is available by data logging from the test
rig and prototype test vehicle.

80
A screenshot of real-time comparison of simulated speed and measured speed data logged is presented in
below Fig.5.4.
Fig.5.4: Real-time engine simulated versus measured speed (Y-axis) in rpm
Simulated Measured

81
Closer (zoomed) view of the smaller sample data of simulated speed versus measured speed is shown in
Fig.5.5 reveals good co-relation of simulation and measurement. Kurtosis –ve value confirms light tail.
Skewness is between -0.5 and 0.5 and hence the distribution is ~ symmetric. Mean Absolute Deviation (MAD)
between simulation and actual measured speed is 4.6 % (mean variation -3.3%) is within acceptable of 10%
Fig.5.5: Detailed view of real-time engine simulated versus measured speed
Simulated Measured

82
A screenshot of real-time comparison of engine simulated torque versus measured torque data logged
is presented in Fig.5.6.
Fig.5.6: Real-time engine simulated torque versus measured torque (Y-axis) Nm
Simulated Measured

83
A closer (zoomed) view of the smaller sample data of engine simulated versus measured torque is shown in
Fig.5.7 reveals a good co-relation of simulation and measurement. Kurtosis –ve value confirms light tail.
Skewness is between -0.5 and 0.5 and hence the distribution is ~ symmetric. Mean Absolute Deviation between
simulation and actual measured torque is 6.6 % (mean variation -5.5%) is within the acceptable limit of 10%
Fig.5.7: Detailed view of real-time engine simulated versus measured torque
Simulated Measured

84
5.3 Summary
Analysis of the results from the simulation of MATLAB/Simulink
models are summarised below:
➢ Real-time simulation of the prognostics function of integrated AMT
clutch and gearbox module is done using the MATLAB command for
comparing the generated random data of synchronisation time (tc),
synchroniser travel (dc), clutch actuator position (ap), and clutch slip
(cs) with the synchroniser travel (dcl) and clutch actuator position (apl)
stored in EEPROM.
➢ Prognostics warning is given when the allowable wear limits of the
parameters are exceeded. Thus, the model is validated using
MATLAB.
➢ Real-time comparison of simulated speed and torque is comparable co-
relation with measured data and the trend validates the model used
for simulation. Mean Absolute Deviation (MAD) between simulation
and actual measured speed is 4.6 % (mean variation -3.3%) is
acceptable
➢ Real-time comparison of simulated speed and torque is comparable co-
relation with measured data and the trend validates the model used
for simulation. Mean Absolute Deviation (MAD) between simulation
and actual measured torque is 6.6 % (mean variation -5.5%) is
acceptable
The subsequent chapter covers the experimental validation of the AMT
system done at the component level (test rig), assembly level (end of line
production rig), and system-level (on vehicle). Also, the Design of
Experiments (DOE) factorial design using Minitab is used for optimizing the
experiments, main plots, interaction plots, and optimisation for shift quality
and drivability.

85
CHAPTER 6
EXPERIMENTAL VALIDATION
This chapter covers the experimental validation of the AMT system done
at the component level (test rig), assembly level (end of line production rig),
and system-level (on vehicle).
6.1 Component Level
The component-level test for gearbox synchroniser is carried out on SSP
180 synchroniser standard test rig as shown in Fig.6.1 is used by global
automotive companies. It a load stage test where increasing loads are applied
on the ring by increasing pressure or velocity or both in a systematic manner
to analyze at what level the part fails.
In this test, the sleeve force is kept constant and the rotational speed
difference is progressively increased in steps. The end of the test occurs when
the synchroniser ring has scuffed and there is clashing for an entire stage of
the test. Allowed variation in the test is +/- 1 stage of scuffing. For each test,
two sets of synchronizers (1–2) and (4–5) are mounted to the test rig on each
side (A/B) of the sliding sleeve (3). The gear wheel (1) on the A‑side (left) is
stationary. Gear wheel (5) and inertia (7) are fixed to shaft (6) and rotate with
constant rotational speed. Inertia (9), which is fixed to shaft (8) together with
hub (10), is changed according to the required friction work of the test. During
one cycle, the sliding sleeve moves from the A‑ to the B‑side and back and
engages the two synchronizers consecutively. Moving the sliding sleeve to the
A‑side breaks shaft (8) and inertia (9) down to standstill. Engaging
synchronizer (4) accelerates (8–9) up to n0.

86
Specification:
Maximum frictional torque TR = 400 Nm
Maximum axial force Fa = 4000 N
Fs is sliding force which is varied as shown in S
The difference in rotation ∆n with respect to n0= 3000 – 5000 rpm
I and II are gears tested for synchronisation
Fig.6.1: SSP 180 Standard synchroniser test rig

87
Synchroniser test rig results indicating torque fluctuations before failure as shown in Fig 6.2. This component-level
test is done for ascertaining the limits for torque fluctuations noticed toward the end of life. This ascertains part level
conformity before conducting assembly level on the gearbox test rig and finally AMT system testing on vehicle level.
Fig.6.2: Synchroniser test rig results

88
6.2 Assembly Level
Manual gearbox performance test rig (M/s. Dynaspede make, 30 kVA,
3.7 kW, 415 V AC, 50 Hz, 1440 rpm) is modified with AMT controller and
related wiring harness for prognostic module experimentation. AMT
controller used for rig testing of the gearbox and clutch arrangement is
circled in Fig.6.3
AMT controller is shown in the highlighted circle and used to simulate
vehicle operating conditions on the gearbox test rig. Automated cycles are
programmed to perform the testing as per DOE. The operating procedure
for the testing equipment is explained in Appendix X.
Fig.6.3: AMT Gearbox Test Rig at Ashok Leyland, Pantnagar plant.
This test is done on the AMT system level for ascertaining the gearshift
performance using the production end of the line test rig. The actual
measurement of gear actuator travel movement during shift and select
movements in various gear positions is graphically reported as shown in
Fig.6.4.

89
Fig.6.4: AMT shift select specification.
The results are found to meet the specification (16.8 – 20.1 mm for
forward gears) and 13mm for reverse gear given in Fig.6.5. If the test
results are not within limits, the prognostic alert is provided as CAN signal
to the vehicle instrument cluster located in the driver’s cockpit.
Fig.6.5: AMT Gearbox end of line test results

90
6.3 System Level
6.3.1 Data logging software
CANape software from Vector is used for real-time data logging of
AMT sensor data communicated by the controller in the controller area
network of the vehicle CAN bus. A tough book with a standard connector
interface between vehicle CAN backbone and Vector software card is
used on the test vehicle.
A snapshot of the software capability and features for application
area measurement and calibration of ECU is given in Fig 6.6
Fig.6.6: Vector CANAPE data logging software

91
6.3.2 Data Acquisition
Real-time data of clutch and gear positions for various upshift and downshift are logged and recorded as the
graphical screenshot in Fig.6.7. It is possible to focus on the synchronisation phased (encircled) which reduces the
complexity of data monitoring and prognostics.
Fig.6.7: AMT Gearbox gear actuator stroke measurement.

92
Detailed analysis of the gear actuator travel during synchronisation is shown in Fig.6.8. This data
acquisition and monitoring eliminates the complexity of analysis due to free play and wear and enables
prognostics alert when the limits exceed during the various phases of the gearshift.
Fig.6.8: Datalog of clutch and gearshift parameters of AMT

93
6.3.3 Data Analysis
AMT Synchronisation time in different shift modes is presented as the
graphical form in Fig.6.9 and prognostics warning are customized for the
corresponding mode selected by the driver.
Fig.6.9: AMT Synchronisation time in different shift modes
This is a data acquisition constraint with manual transmission and the
AMT system controller is capable of precise real-time monitoring of the
shorter synchronisation cycle time. The synchronisation time is within the
acceptable limit of 0.3 to 0.8 seconds for all modes of operation.

94
6.4 DOE Factorial design
Multi-level two factorial design is done using Minitab for the design of
experiments. The advantages are the size of the experiment is much smaller
than other designs and interactions of the factors can be detected. The output
responses considered are “shift quality” and “drivability” and determined by
a panel of expert drivers and Engineers.
6.4.1 Minitab analysis
Input parameter level – 2 levels for the factor clutch slip % (0,5) and 3
levels for factor synchronisation time (0.3,0.5,0.8) considered in Minitab
analysis as given below
Fig.6.10: Minitab factorial design

95
6.4.2 Main effects and interactions plot
The main effects plot for shift quality as shown in Fig 6.10 depicts that the
high number of shift quality is good. The good shift quality is achieved when
the clutch slip is zero. When clutch slip increases from zero the result of shift
quality is getting deteriorated and poor at maximum (clutch slip 5). If
synchronisation time is more, shift quality is good and vice versa.
Fig.6.11: Main effects plot for shift quality
The experimental responses for shift quality, interaction plot for shift
quality as shown in Fig 6.11 depict that the increment of synchronisation time
at clutch slip 5 does not give any improvement in shift quality. The increment
of synchronisation time at zero clutch slip gives a good result (improved shift
quality – green line).
Fig.6.12: Interaction plot for shift quality

96
The main effects plot for drivability as shown in Fig 6.12 depicts that the
drivability and clutch slip have inverse relations When the clutch slip is zero,
the drivability is maximum and vice versa. The less synchronisation time is
giving good drivability and increment of synchronisation time beyond 0.5 does
not give any impact on drivability. The reduced clutch slip and
synchronisation time give good drivability.
Fig.6.13: Main Effects plot for drivability
The interaction plot for drivability as shown in Fig 6.13 depicts that the
increment of clutch slip does not have any impact on drivability. The less
synchronisation time when clutch slip is zero will give good results (good
drivability – blue line).

97
Fig.6.14: Interaction plot for drivability
6.4.3 Optimisation
Shift quality is predominantly demanded by passenger buses, but it is
not complained about by truck drivers. Drivability is predominantly
demanded by truck applications for faster turnaround time. Passenger buses
particularly city operations do not demand acceleration. Fig.6.14 is the DOE
factorial design solution using Minitab for optimisation of both shift quality
and drivability responses. Points on the red lines are optimal settings and
points lying between red lines to be avoided. Thus, optimization of shift
quality and/or drivability can be customized for different applications by
varying levels of Synchro time from 0.5 to 0.8 seconds, keeping the clutch slip
closer to 0.

98
Fig.6.15: Optimisation for shift quality and drivability
6.5 Results and discussions
Analysis of the results from the experimental validation of the
simulation models are summarised below:
➢ Synchronizer ring test results on the stage of scuffing (clashing and
torque fluctuation) from the SSP rig is used as input for the
assembly level tests.
➢ Test measurement of gear actuator travel co-ordinates during shift
and select movements is graphically reported and found
comparable to the specification.

99
➢ CANAPE data logging for real-time measurement of gear actuator
travel during synchronization eliminates the complexity of analysis
due to free play.
➢ Data logging of various parameters from the vehicle CAN in
different modes of operation, provides the synchronization and
clutch time for real-time monitoring of degradation.
➢ Experimental responses are analysed using main and interaction
plots for shift quality and drivability. The optimisation is done
using the DOE factorial design.
6.6 Summary
The test setup is done for experimental validation at the component
level, system-level, and vehicle level. Experimental validation of the AMT
system is done at component level (test rig), assembly level (end of line
production rig), and system-level (on vehicle). Design of Experiments
(DOE) factorial design using Minitab is used for optimizing the
experiments, main plots, interaction plots, and optimisation for shift
quality and drivability.
The next and last chapter presents conclusions of the research work
based on the results obtained in both simulations and experiments for
AMT gearbox and clutch prognostics. Salient contribution to the research
and recommendation for future work has also been discussed.

100
CHAPTER 7
CONCLUSION
7.1 Salient conclusions
The developed MATLAB/Simulink model for simulation of the vehicle fitted
with the AMT system is validated for real-time condition monitoring and
alert. Based on the work done in this research and results obtained in both
experiment and simulation the following conclusions have been drawn:
➢ Conceptualized and optimized condition monitoring system for AMT
gearbox and clutch gear shift control and prognostics strategy
➢ AMT gearbox prognostics developed and validated for real-time
condition monitoring of synchroniser wear and synchronising time.
➢ AMT clutch prognostics developed and validated for real-time
condition monitoring of clutch wear and clutch slip.
➢ Modelled complete vehicle with AMT system using
MATLAB/Simulink for simulation and optimization of prognostics
concepts.
➢ Results of experimental validation testing of the AMT gearbox and
clutch condition monitoring and integrated prognostics module done
at the component, system, and vehicle level are within acceptable
limits.
➢ Experimental responses are analyzed using main and interaction
plots for shift quality and drivability and optimized using Minitab
DOE factorial design.

101
➢ Limits for gearbox and clutch prognostics alert are established using
real-world usage pattern and warning given before failure,
considering remaining useful life
7.2 Specific contribution to research
Through this thesis on the Integrated Prognostics Module for real-time
condition monitoring of dry clutch and gearbox systems used on Automated
Manual Transmission, the following contributions have been made towards
the frontiers of state-of-art research on AMT Prognostics:
➢ This modular and simplified condition monitoring algorithm of clutch
and gearbox parameters is conceptualized and validated for real-time
condition monitoring of gearbox and clutch health, using data-driven
and model-based hybrid methodology.
➢ Synchroniser wear monitoring during synchronisation phase eliminated
the influence of other parameters and reduced the complexity of data
acquisition and analysis.
➢ Re-calibration of the gearbox and clutch parameter ensured consistent
performance and shift quality by timely alerts for re-calibration of the
AMT system.
➢ Clutch slip monitoring will enable diagnosis of clutch slip due to any
other causes like an oil-contaminated clutch disc or bearing seizure.
➢ Clutch and gearbox prognostics observer integrated with the existing
AMT controller. No additional hardware development is involved in
AMT prognostics.
➢ Prognostic warning prevents breakdown and to ensure consistent
performance shift quality, desired vehicle drivability, and ride comfort.

102
7.3 Further scope of work
Analysis and experimentations from this research reveal several areas that
need further study. This research could be continued further in the
following areas:
➢ The research is also be continued on optimization of a closed-loop
control system for automated re-calibration of the AMT by including
other parameters.
➢ Enhanced remote diagnosis of any developing fault by systematic
analysis of the monitored data from sensors and exploiting the
Internet of Things
➢ Different drivers are using the vehicle and each driver will have a
different dataset stored in ECU through driver modelling using
Artificial Intelligence and teach the AMT system.

103
REFERENCES
Al-Atat H, Siegel D, Lee J, (2011). A Systematic Methodology for Gearbox
Health Assessment and Fault Classification. International Journal of
Prognostics and Health Management, 2(1): 16-31
Abdel-Halim NA, Barton DC, Crolla DA, Selim AM, (1997). Performance of
Multi cone Synchronizers for Manual Transmissions, Proceedings of
the Institution of Mechanical Engineers, Part D, 214(1):55-65
Abel A, Schreiber U, Schindler J, (2006). Engine and Gearbox Modeling and
Simulation for Improving the Shifting Behaviour of Powertrains with
Manual or Automated Transmissions. SAE Technical Paper Series.
Technical Report 2006-01-1641.
Assanis D, Filipi Z, Gravante S, Grohnke D, Gui X, Louca L, Rideout G, Stein
J, Wang Y (2006). Validation and Use of SIMULINK Integrated, High
Fidelity, Engine-In-Vehicle Simulation of the International Class VI
Truck, SAE Technical Paper Series. Technical Report 2006-01-0288.
Baraldi P, Cadini F, Mangili F, Zio E, (2013). Model-based and data-driven
prognostics under different available information. Probabilistic
Engineering Mechanics, 32(1):66-79
Bedmar AP, (2013). Synchronization processes and synchronizer
mechanisms. Goteborg: Chalmers University of Technology. Master’s
thesis: 2013:20
Blokhin A, Nedyalkov A, Barakhtanov L, Taratorkin A, Kropp A (2017).
Multistage Mechanical Transmissions with Automatic Control for

104
Advanced Trucks and Buses. Advances in Mechanical Engineering
SAGE journals. DOI 10.1515/ama-2017-0040
Chen J (2013). Automobile Transmission Shift Control based on MAX-MIN
Ant Algorithm. TELKOMNIKA. 2013;11:4200–4207
Dragomir OE, Gouriveau R, Dragomir F, Minca E, Zerhouni N, (2009).
Review of Prognostic Problem in Condition-Based Maintenance.
European Control Conference, ECC, Budapest, Hungary, 1587-1592
Galvagno E, Velardocchia M, Vigliani A (2011). Analysis and simulation of
torque assist automated manual transmission, Mechanical Systems
and Signal Processing, 25(6):1877- 1886
Gander H, Loibl J, Ulm M, (1999). Gearbox-Integrated Mechatronic Control:
A New Approach to Handle Powertrain Complexity, SAE Technical
Paper. Paper No.1999-01-1055. DOI: 10.4271/1999-01-1055
Gong Z, Zhang W, Chen G, Wang W. (2008): Analyses and Evaluation on
Synchronizer of Manual Transmission. Pacific-Asia Workshop on
Computational Intelligence and Industrial Application, 842-845
Glielmo L, Iannelli L, Vacca V, (2006). Gearshift control for automated
manual transmissions. IEEE/ASME Transactions on Mechatronics,
11(1):17-25
Hayashi K, Shimizu Y, Nakamura S, Dote Y, Takayama A, Hirako A, (1993).
Neuro-fuzzy optimal transmission control for an automobile with
variable loads. Proceedings of the Industrial Electronics, Control, and
Instrumentation Conference, 3(1):430-434

105
Hoshino H. (1999). Analysis on Synchronization Mechanism of Transmission.
Technical Report 1999-01-0734. SAE Technical Paper Series. Detroit,
MI, USA, 1999.
Huang H and Gühmann C (2018). Model-based gear-shift optimization for an
automated manual transmission. Proceedings of the Institution of
Mechanical Engineers, Part D: Journal of Automobile Engineering.
233(12): 3199-3208
International Standards Organization (2015). ISO, ISO13381-1:2015(E).
Condition Monitoring and Diagnostics of Machines - Prognostics part
1: General Guidelines. Genève, Switzerland: International Standards
Organization.
Ivanovic V, Deur J, Hancock M, Assadian F, (2009). A Closed-Loop Strategy
of Active Differential Clutch Control. Proceedings of ASME Dynamic
Systems and Control Conference, 611-618
Jardine AKS, Lin D, Banjevic D, (2006). A review on machinery diagnostics
and prognostics implementing condition-based maintenance.
IEEE/ASME Transactions on Mechanical Systems and Signal
Processing, 20(7):1483–1510
Jihong Y, Chaozhong G, Xing W, (2010). A dynamic multi-scale Markov
model-based methodology for remaining life prediction. IEEE/ASME
Transactions on Mechanical Systems and Signal Processing,
25(4):1364-1376
Kothamasu R., Huang SH, VerDuin WH, (2006). System health monitoring
and prognostics - a review of current paradigms and practices.
International Journal of Advanced Manufacturing Technology,
28(9):1012-1024

106
Kelly D, Kent C. (2000). Gear Shift Quality Improvement in Manual
Transmissions Using Dynamic Modelling. Paper presented at FISITA
World Automotive Congress, 2000-05-0126
Krupa M, (2013). Methods of Technical Prognosis – Review, Department of
Control and Instrumentation, Brno University of Technology, the
Czech Republic.
Kumbhar MS, Panchagade DR (2014). A Literature Review on Automated
Manual Transmission (AMT). International Journal for Scientific
Research and Development, 2(3):1236-1239
Kumbhar MS, Panchagade DR, Baidya K (2014). Development of Actuator
Control Strategy for DC Motor Controlled Automated Manual
Transmission (AMT). International Journal of Recent Technology and
Engineering (IJRTE), Corrected 3(1):2277-3878
Kuroiwa H, Ozaki N, Okada T, Yamasaki T, (2004) Next-generation Fuel-
efficient Automated Manual Transmission, Hitachi Review, 53(4): 205-
209
Langjord H, Kaasa GO, Johansen, TA, (2011). Adaptive observer-based
switched controller for an electro-pneumatic clutch actuator with
position sensor. Proceedings of the IFAC World Congress, Milan, Italy.
1:4791-4796.
Lee J, Wu F, Zhao W, Ghaffari M, Liao L, Siegel D, (2013). Prognostics and
health management design for rotary machinery systems; Reviews,
methodology and applications. IEEE/ASME Transactions on Mech
Systems and Signal Processing, 42(1-2):314-334
Lei Y, Hu J, Fu Y (2019). Control strategy of automated manual transmission
based on active synchronization of driving motor in electric bus.

107
Advances in Mechanical Engineering 11(4).
https://doi.org/10.1177/1687814019846734
Li L, Zhu Z, Chen Y, He K (2016). Engagement Control of Automated Clutch
for Vehicle Launching Considering the Instantaneous Changes of
Driver's Intention. Journal of Dynamic Systems Measurement and
Control 139(2):021011-1-12 ·
Lin S, Chang S, Li B (2011). Analysis and simulation of gear shift for an AMT
based on 2 Degrees of freedom electro-magnetic actuator. International
Conference on Electrical and Control Engineering - ICECE, 1:1994-
1997. ISBN: 978-1-4244-8162-0
Liu Z, Yi C, Cao W, Zhao K (2016). Engine Control Strategy for AMT
Upshifting of Commercial Vehicle. International Conference on
Applied Mechanics, Electronics and Mechatronics Engineering
(AMEME 2016) DOI: 10.12783/dtetr/ameme2016/5777
Liu Y, Tseng T, (2007). Simulation and analysis of synchronization and
engagement on manual transmission gearbox, International Journal of
Vehicle Design, 43(1-4):200-220.
Lovas L, Play D, Marialigeti J, Rigal JF, (2006). Mechanical behaviour
simulation for synchromesh mechanism improvements. Proceedings of
the Institution of Mechanical Engineers Part D Journal of Automobile
Engineering, 220(7):919-945.
Lovas L, Play D, Marialigeti J, Rigal JF, (2005). Modelling of Gear Changing
Behaviour. Periodica Polytechnica Ser. Transp. Eng, 34(1-2):35-58.
Luo J, Pattipati KR, Qiao L, Chigusac S, (2008). Model-Based Prognostic
Techniques Applied to a Suspension System. IEEE Transactions on

108
Systems, Man and Cybernetics, Part A: Systems and Humans,
38(5):1156–1168.
Montazeri M, Pourbafarani Z, Nehzati H (2010). Optimal Gear Ratio and
Gear Shift Strategy Design for a Parallel Hybrid Electric Vehicle
Equipped with AMT. Proceedings of ASME 2010 10th Biennial
Conference on Engineering Systems Design and Analysis, 3: 175-181.
Niu Q (2010). Clutch Control During Starting of AMT. Symposium on
Security Detection and Information Processing. Procedia Engineering
7 (2010) 447–452.
Operator Manual (2014). Ashok Leyland Jan Bus BSIV. JNNURM II.
Publication No: OM: JAN BUS-BSIV-J2:1388:0714: 500:10, July 2014.
Parker BE, Carley MP, Barron R, Dubois TA, (1993). Helicopter gearbox
diagnostics and prognostics using vibration signature analysis.
Proceedings of SPIE 1965, Applications of Artificial Neural Networks
4:531
Parthasarathy G, Menol S, Richardson K, Jameel A, McNamee D, Desper T,
Gorelik M, Hickenbottom CH, (2008). Neural Network Models for
Usage Based Remaining Life Computation. International Journal of
Engineering for Gas Turbines and Power, 130(1):7
Qi X, Yang Y, Wang X (2017). Analysis and optimization of the gear-shifting
process for automated manual transmissions in electric vehicles. SAGE
JOURNALS. Proceedings of the Institution of Mechanical Engineers,
Part D: Journal of Automobile Engineering.
https://doi.org/10.1177/0954407016685461
Ramalingam S, Pimpale SR, Regalla SP, (2015). Modelling of a Prognostics
Module for Automated Manual Transmission. 2nd International and

109
17th National Conference on Machines and Mechanisms, IIT Kanpur,
India. Paper no.50
Ramalingam S, Prasad H, Regalla SP, (2017). Integrated Prognostics Module
for Condition Monitoring of an Automated Manual Transmission dry
clutch system. International Journal of Prognostics and Health
Management, 2(28):2153-2648
Ramalingam S, Regalla SP, (2018). Integrated Prognostics Module for Real-
time Condition Monitoring of an Automated Manual Transmission
(AMT) Gearbox and Clutch Systems, International Journal of
Condition Monitoring and Diagnostic Engineering Management
(COMADEM), 21(4):37-42.
Regalla SP, (2014). Research Methodology for Undertaking Research in
Engineering Design. Workshop on Research Methodology held at BITS
Pilani, Hyderabad campus, April 2014.
SAE J1939 (2000). SAE International. Surface Vehicle Recommended
Practice. Recommended practice for a serial control and
communications vehicle network. Latest revision 2011
Sang HL, (2013). Model-based diagnosis of gear fault under variable loading
condition. Proceedings of the IEEE Conference on Prognostics and
Health Management (PHM) 1(6):2153-2648.
Sankavaram. C, Kodali A, Pattipati K, Singh S, Zhang Y, Salman M, (2016).
An Inference-based Prognostic Framework for Health Management of
Automotive Systems. International Journal of Prognostics and Health
Management, 1(9):2153-2648
Saxena A, Celaya J, Saha B, Saha S, Goebel K, (2010). Metrics for Offline
Evaluation of Prognostic Performance. International Journal of

110
Prognostics and Health Management. International Journal of
Prognostics and Health Management, 1(1):2153-2648
Schreiber U, Back O (2009). Experiencing and definition of the real shifting
comfort at the virtual synchronizer in the virtual power train, 8th
International CTI Symposium, Berlin.
Service Manual (2014). Ashok Leyland Jan Bus BSIV. JNNURM II. SMCD:
JAN BUS BSIV-J2:1389:0814: 30:11: VER-1, Jul 2014.
Sharma MK, Salva J. (2012): Shift System Inertia Mass Optimization
Techniques to Minimize Double Bump for Manual Transmission. SAE
International Technical Report 2012-01-1999.
Singh G, Sharma M, Singh AP (2018). Novel Automated Manual
Transmission Gear-Shift Map Modelling Based on Throttle Position.
International Journal of Automotive and Mechanical Engineering
15(1): 5053-5073
Sun Z, Hebbale K, (2005). Challenges and opportunities in automotive
transmission control. Proceeding of the 2005 American Control Conf,
Portland 5:3284–3289
Sun Z, Gao B, Jin J, Sanada K (2019). Modelling, Analysis and Simulation of
a Novel Automated Manual Transmission with Gearshift Assistant
Mechanism. Intl Journal of Automotive Technology. 20(5): 885–895
Tseng CY, Yu CH (2015). Advanced shifting control of synchronizer
mechanisms for clutchless automatic manual transmission in an
electric vehicle. Mechanism and Machine Theory. 84:37–56.

111
Vachtsevanos G, Lewis FL, Roemer M, Wu B, Hess A, (2006). Intelligent
Fault Diagnosis and Prognosis for Engineering Systems, Pages 434.
ISBN:978-0-471-72999-0. John Wiley and Sons, Inc. New Jersey.
Wagner G, (2001). Application of Transmission Systems for Different
Driveline Configurations in Passenger Cars. SAE Technical Paper
2001-01-0882. DOI: 10.4271/2001-01-0882.
Wang M, Sheng J, Ding F, Zhang B, Wen G, Zhang N (2018). Study on
Coordinated Control Strategy for Seamless Gear Shifting of Two-speed
AMT Hong Kong journal of Social Sciences. ISSN: 1021-3619. Vol 46,
No 8

112
APPENDICES
-------------------------------------------------------------------------------------------------------
APPENDIX I: MATLAB Code
Prognostics Algorithm Simulation
%%%%%%%%%%%%%%%%%%%%%%%%%%%%%%%%%%%%%%%%%
GEAR AND CLUTCH
%initialization
function varargout = gui(varargin)
gui_Singleton = 1;
gui_State = struct('gui_Name', mfilename, ...
'gui_Singleton', gui_Singleton, ...
'gui_OpeningFcn', @gui_OpeningFcn, ...
'gui_OutputFcn', @gui_OutputFcn, ...
'gui_LayoutFcn', [] , ...
'gui_Callback', []);
gui_State.gui_Callback = str2func(varargin{1});
end
if nargout
[varargout{1:nargout}] = gui_mainfcn(gui_State, varargin{:});
else
gui_mainfcn(gui_State, varargin{:});
end
function gui_OpeningFcn(hObject, eventdata, handles, varargin)
handles.output = hObject;
handles = initValues(hObject, eventdata, handles);

113
guidata(hObject, handles);
handles = getValues(hObject, eventdata,handles);
disp(handles);
guidata(hObject, handles);
function varargout = gui_OutputFcn(hObject, eventdata, handles)
varargout{1} = handles.output;
%core logic
function handles = initValues(hObject, eventdata, handles)
disp('inside init');
handles.count=0;
handles.cs_min = 0.5;
handles.cs_max = 5;
handles.ap_min = 78.5;
handles.ap_max = 106.5;
handles.dc_min = 9.2;
handles.dc_max = 10;
handles.params = {};
handles.wears = {};
handles.part = {};
handles.data_no_main = {};
handles.data_no = {};
handles.write_test=0;
recycle on
delete('C:\Users\HP\Desktop\gear\current_testing_data.xlsx');
function handles = getValues(hObject, eventdata,handles)
handles.data1 = xlsread('C:\Users\HP\Desktop\gear\backupdata2.xlsx');
handles.i = size(handles.data1,1);
cs_random = handles.cs_min+rand(1,1)*(handles.cs_max-handles.cs_min) + 2;
tc_random = rand+0.1;
gear_random = randi(6);
ap_random = handles.ap_min+rand(1,1)*(handles.ap_max-handles.ap_min) - 5;
dc_random = handles.dc_min+rand(1,1)*(handles.dc_max-handles.dc_min) - 0.3;

114
handles.write_line=handles.i+2;
xlswrite('C:\Users\HP\Desktop\gear\backupdata2.xlsx',
{gear_random,tc_random,dc_random,ap_random,cs_random}, 'Sheet1', ['A'
num2str(handles.write_line)]);
xlswrite('C:\Users\HP\Desktop\gear\current_testing_data.xlsx',
{gear_random,tc_random,dc_random,ap_random,cs_random}, 'Sheet1', ['A'
num2str(handles.write_line)]);
handles.write_line=handles.write_line+1;
handles.data1 = xlsread('C:\Users\HP\Desktop\gear\backupdata2.xlsx');
handles.current_testing_data = xlsread('C:\Users\HP\Desktop\gear\current_testing_data.xlsx');
handles.i = size(handles.data1,1);
textval = findobj(0, 'tag', 'gear_no');
set(textval, 'string', gear_random);
textval = findobj(0, 'tag', 'tc');
set(textval, 'string', tc_random);
textval = findobj(0, 'tag', 'dc');
set(textval, 'string', dc_random);
textval = findobj(0, 'tag', 'ap');
set(textval, 'string', ap_random);
textval = findobj(0, 'tag', 'cs');
set(textval, 'string', cs_random);
textval = findobj(0, 'tag', 'err');
err_val=0;
err_str="";
for j=2:size(handles.data1,2)
switch j
case 2
if handles.data1(handles.i,j)<=0.3 || handles.data1(handles.i,j)>=0.8
%set(textval, 'string', 'Gear Error-tc');
err_str= err_str+"Gear Error-tc"+newline+newline;
err_val=1;
disp('tc');

115
gear_no = handles.data1(handles.i,1);
handles.write_test=handles.write_test+1;
handles.data_no{handles.write_test}=handles.count+1;
handles.part{handles.write_test} = strcat('Gear-
',num2str(gear_no));
handles.params{handles.write_test} = 'tc';
handles.wears{handles.write_test} = '-';
end
case 3
if handles.data1(handles.i,j)<=9.2
%set(textval, 'string', 'Gear Error-dc');
err_str= err_str+"Gear Error-dc"+newline+newline;
%err_str= strcat(err_str,'Gear Error-dc',newline);
err_val=1;
disp('dc');
gear_no = handles.data1(handles.i,1);
GearWear = 10-handles.data1(handles.i,j);
handles.write_test=handles.write_test+1;
handles.data_no{handles.write_test}=handles.count+1;
handles.part{handles.write_test} = strcat('Gear-
',num2str(gear_no));
handles.params{handles.write_test} = 'dc';
handles.wears{handles.write_test} = GearWear;
end
case 4
if handles.data1(handles.i,j)<=78.50
%set(textval, 'string', 'Clutch Error-ap');
err_str= err_str+"Clutch Error-ap"+newline+newline;
err_val=1;
disp('ap');
ClutchWear = 106.50-handles.data1(handles.i,j);
handles.write_test=handles.write_test+1;

116
handles.data_no{handles.write_test}=handles.count+1;
handles.part{handles.write_test} = 'Clutch';
handles.params{handles.write_test} = 'ap';
handles.wears{handles.write_test} = ClutchWear;
end
case 5
if handles.data1(handles.i,j) >= 5
%set(textval, 'string', 'Clutch Error-cs');
err_str= err_str+"Clutch Error-cs"+newline+newline;
err_val=1;
disp('cs');
handles.write_test=handles.write_test+1;
handles.data_no{handles.write_test}=handles.count+1;
handles.part{handles.write_test} = 'Clutch';
handles.params{handles.write_test} = 'cs';
handles.wears{handles.write_test} = '-';
end
otherwise
set(textval, 'string', 'Not found');
err_val=1;
end
end
handles.count=handles.count+1;
handles.data_no_main{handles.count}=handles.count;
if(err_val==0)
set(textval, 'string', 'No Error');
else
set(textval, 'string', err_str);
end
function button1_callback(hObject, eventdata, handles)
handles = getValues(hObject, eventdata,handles);
guidata(hObject, handles);
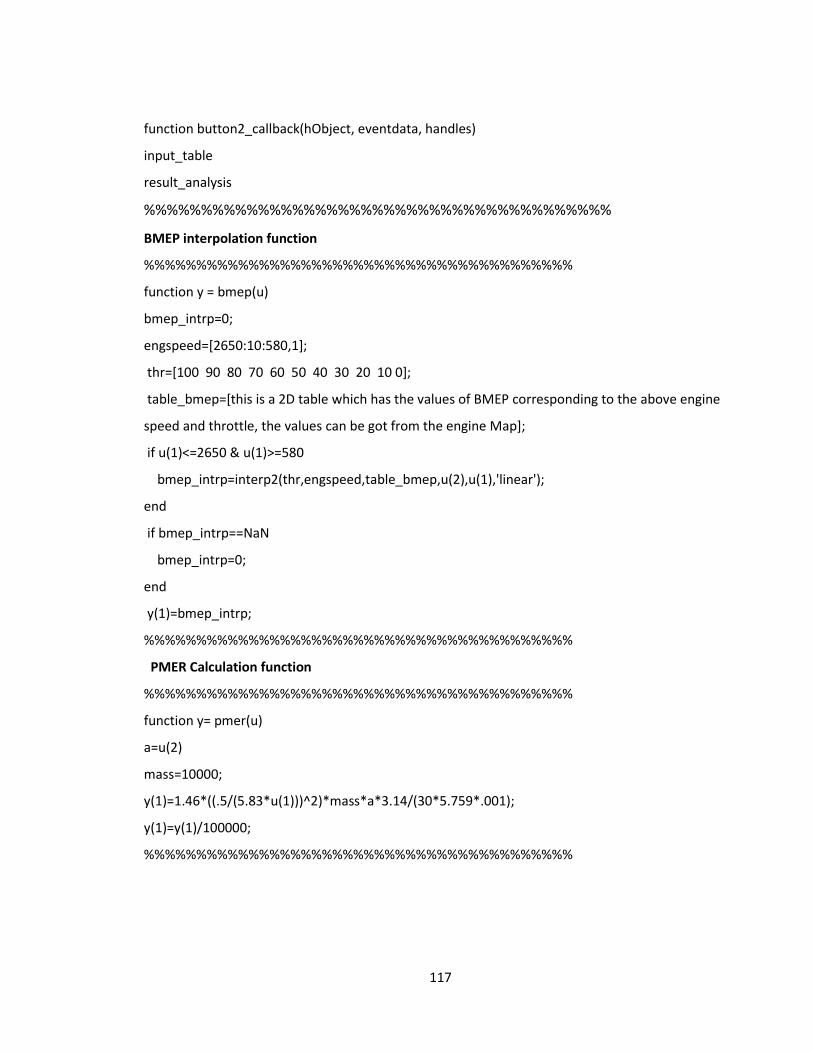
117
function button2_callback(hObject, eventdata, handles)
input_table
result_analysis
%%%%%%%%%%%%%%%%%%%%%%%%%%%%%%%%%%%%%%%%%
BMEP interpolation function
%%%%%%%%%%%%%%%%%%%%%%%%%%%%%%%%%%%%%%%%%
function y = bmep(u)
bmep_intrp=0;
engspeed=[2650:10:580,1];
thr=[100 90 80 70 60 50 40 30 20 10 0];
table_bmep=[this is a 2D table which has the values of BMEP corresponding to the above engine
speed and throttle, the values can be got from the engine Map];
if u(1)<=2650 & u(1)>=580
bmep_intrp=interp2(thr,engspeed,table_bmep,u(2),u(1),'linear');
end
if bmep_intrp==NaN
bmep_intrp=0;
end
y(1)=bmep_intrp;
%%%%%%%%%%%%%%%%%%%%%%%%%%%%%%%%%%%%%%%%%
PMER Calculation function
%%%%%%%%%%%%%%%%%%%%%%%%%%%%%%%%%%%%%%%%%
function y= pmer(u)
a=u(2)
mass=10000;
y(1)=1.46*((.5/(5.83*u(1)))^2)*mass*a*3.14/(30*5.759*.001);
y(1)=y(1)/100000;
%%%%%%%%%%%%%%%%%%%%%%%%%%%%%%%%%%%%%%%%%

118
APPENDIX II: Transmission Automation
Source: Ricardo Market Survey., Mar 2016
Inference: Automatic vehicles will be 10-12 % accounting to 500000 cars by
2020. AMT will gain a majority of the market share due to low cost of
ownership compared to AT or DCT.

119
APPENDIX III: Global Technology trends
Source: ZF WABCO Presentation, Dec 2020
Inference: AMT will be dominating up to 50% market by 2030
20
70
82
27
61
84
41 39
7 9
50
27
6
17
0
10
20
30
40
50
60
70
80
AMT MT AT E-drive
Global Transmission Trend
2018 2022 2026 2030

120
APPENDIX IV - Technology Trends in India
Source: ZF WABCO Presentation Dec 2020
Inference: AMT is growing rapidly in India

121
APPENDIX V – Gearbox Internal Linkages
Source: Ashok Leyland Advanced Engineering presentation., 2008
Inference: Though base gearbox and shift plates inside are same, rotary
motion for gear selection is replaced with linear motion in AMT

122
APPENDIX VI - AMT Operating Instructions
Source: Service Manual (2014)

123
APPENDIX VII – Typical MT powertrain arrangement
Source: Ashok Leyland Advanced Engineering presentation., 2008
Inference: AMT system is a modular system and could be integrated with
existing engine, gearbox and dry clutch.

124
APPENDIX VIII - AMT used in commercial vehicles
Source: Ashok Leyland Advanced Engineering presentation., 2008
Inference: AMT benchmark study lists the best in class features which could
be adopted for the Indian market.
OEM AMT NAME SUPPLIER AMT NAME
Freight Liner AGS Mercedes
BenzTelligent
Mercedes Benz TelligentMercedes
Benz
Telligent/Auto Trans
Scania Opticruise Scania Opticruise
Volvo I-Shift WABCOGear Tronic Comfort
Shift
DAF(Pasccar) AS Tronic ZF AS Tronic
International Freedom Line ZF Meritor AS Tronic
Forden (Paccar)AS Tronic ZF AS Tronic
IVECO Eurotronic ZF AS Tronic
Kenworth (Paccar)Freedom Line ZF Meritor AS Tronic
MAN Tipmatic ZF AS Tronic
Peterbilt Freedom Line ZF Meritor AS Tronic
Renault AS Tronic ZF AS Tronic
ISUZU E- Autoshft Isuzu -
AMT USED IN COMMERCIAL VEHICLES

125
APPENDIX IX - AMT Classification
Source: Ashok Leyland Advanced Engineering presentation. 2008
Inference: AMT benchmark study lists the various best in class technologies
and options available for the Indian market.

126
APPENDIX X – Standard Operating Procedure of Gearbox Testing Rig
Inference: Existing MT gearbox tester adapted for testing of electro-
pneumatic AMT gearbox actuator.
Air Pressure pipe
14) If communication signal is green then click on the ACKNOWLEDGE CONNECTION
15) Click “ACKNOWLEDGE CONNECTION” to complete this step and go back to the main window.(on the Pic-2)
If connection is not correct then signal will be red & switch-off the MCB-1, ensure all
connection & re-process as above.
9) Then open the webco XY actuator software in PC monitor
10) Enter the GB number in the Software icon as per Pic -2
11) Then start the MCB-1 (Ignition Switch) & click on the START REPORTING tab on Software icon as per Pic-2
12)Then click on the "START REPORTING" tab and followed by click on "CHECK CONNECTIONS" tab
13) If "Check Connection" will be correct then next icon will be opened with green
Signal as per Pic-3
5) After fitment of harness on the Pneumatic pressure with booster
5) Air pressure should be from 6.5 to 8 bar in booster
6) Then fill the testing oil in gear box (6.5Ltrs) as per existing model
7) Now start the testing motor in maintenance mode
8) Set the input RPM at 1500 (Range 1200 to 1500rpm)
Ensure that AMT-gearbox input-shaft is coupled with motor and motor
is at constant speed of around 1500 rpm
Valve Gear 3rd/4th
Distance Selection sensor Exhaust
Valve selection sensor Exhaust
Out put sensor
Input sensor
1) Rest the AMT Gear Box on the pallet as per existing Model
2) Couple the AMT gear box with the testing motor as per existing model in auto mode
3) Fit the Testing Oil filling & leveling pipe in the gear box as per existing model
4) Fit the wire harness with the XY actuator , input / output speedo sensor & Gear stroke /Rail selection stroke sensor as per below Picture
Valve gear 1st/2nd
Distance Selection Gear

127
APPENDIX XI - AT cross-sectional view
Source: Allison Transmission Training Module (Internet source 2012)
Inference: Cross-sectional view of the AT shows torque converter or fluid
coupling which acts as a clutch for the planetary gear module. Since oil
cooling arrangement for clutch, the efficiency of AT is lesser than MT due
to frictional loss, heavyweight and parasitic losses to the engine.

128
APPENDIX XII – Typical gear utilization pattern for different applications
Source: Ashok Leyland Report (2014)
Inference: Gear utilization pattern of each gear is different for various
applications. Algorithm is customized for estimating remaining useful life
for different duty cycle.
3
9.9
21.9 21.8
33
10.9
0
10
20
30
40
50
60
70
80
1 2 3 4 5 6
Gear Utilization %
Haulage truck City bus Intercity bus
Surface Tipper Mining Tipper Tractor Trailer
Gear number

129
LIST OF PUBLICATIONS
(I) International Journals:
Published:
1. Sivakumar Ramalingam, Hanumath VV Prasad and Srinivasa Prakash
Regalla (2017). Integrated Prognostics Module for Condition Monitoring
of an Automated Manual Transmission dry clutch system. International
Journal of Prognostics and Health Management, 2(28):2153-2648.
2. Sivakumar Ramalingam and Srinivasa Prakash Regalla (2018).
Integrated Prognostics Module for Real-time Condition Monitoring of an
Automated Manual Transmission (AMT) Gearbox and Clutch Systems,
International Journal of Condition Monitoring and Diagnostic
Engineering Management (COMADEM). International Journal of
COMADEM 21(4):37-42.
3. Sivakumar Ramalingam, Saravanan Natarajan and Srinivasa Prakash
Regalla. Modelling of an Automotive Automated Manual Transmission
(AMT) System for Simulation of Performance and Prognostics.
International Journal of Condition Monitoring and Diagnostic
Engineering Management (COMADEM). Accepted for publication in
April 2021 edition.

130
(II) International Conferences:
1. Sivakumar Ramalingam, Sanjeev Ramakant Pimpale and Srinivasa
Prakash Regalla. Modelling of a Gear Prognostics Observer for
Automated Manual Transmission. 2nd International and 17th National
Conference on Machines and Mechanisms INaCOMM 2015 hosted by
IIT K (Dec 16-19th 2015). Paper no 50.
2. Sivakumar Ramalingam, Vasudevan M and Srinivasa Prakash Regalla.
A Case Study on Implementation of Integrated Project Management
Using PLM Platform. Product Lifecycle Modeling, Synthesis and
Simulation PLMSS2015 conference held at BITS, Hyderabad (Dec 15-
18th 2015).
(III) National Conferences:
1. Sivakumar Ramalingam, Hanumath Prasad VV and Srinivasa Prakash
Regalla. Modelling of an Observer for Automated Manual Transmission
(AMT) Clutch Prognostics. 2nd National Conference on Design and
Manufacturing Technologies for Product Life Cycle (DPLC 2016) held at
BITS, Hyderabad (Mar 19-20th 2016).
2. Sivakumar Ramalingam. Technical Paper presentation on “Modeling of
Prognostic Observer for an Automated Manual Transmission (AMT)
gearshift control system”. Technology Day Conference held at Ashok
Leyland Technical Centre, Chennai on 3rd Jan 2018.

131
BRIEF BIOGRAPHY OF THE CANDIDATE
Mr Ramalingam Siva Kumar obtained his M.S. (Technological Operations) from
Birla Institute of Technology and Science in 1994. He completed PGDBA
(Operations Management) from Symbiosis in 2004 and Executive Leadership
Program at Great Lakes in 2015. He has around 25 years of rich R&D expertise
in the automotive industry, spanning from passenger vehicles to heavy
commercial vehicles. He started his career at TVS Brakes India, followed by
reputed companies like Mahindra & Mahindra, General Electric and Ashok
Leyland. His significant achievements include Scorpio SUV development at
Mahindra & Mahindra and Automated Manual Transmission (AMT)
development at Ashok Leyland. He is currently heading the product design
function of ZF WABCO Product Engineering and designated as General Manager.
He is a six-sigma green belt certified at General Electric. He is a certified Project
Management Professional (PMP) from the Project Management Institute (PMI,
USA). As a part of the prestigious “Emerging Leader Program” at Ashok Leyland,
he is sponsored for PhD at BITS, Pilani (Hyderabad) under the Aspirant program.
He is a member of SAE-India, PMI (USA) and IEI. He has published 3
international journals, presented in 6 national/international conferences and
delivered guest lectures at reputed engineering institutes.

132
BRIEF BIOGRAPHY OF THE SUPERVISOR
Dr Saravanan Natarajan is currently the President & Chief Technology Officer
and is also responsible for the Electric Vehicles (EV) Business at Ashok Leyland.
He is a seasoned automotive industry executive with around 26 years of a rich
expertise, spanning from passenger vehicles to heavy commercial vehicles.
Saravanan holds a PhD in Mechanical Engineering from the University of
Florida, USA (1994) and he earned his MBA from the University of Michigan,
USA (2002). He has over 20 publications, 9 book chapter and 6 international
conferences. He joined Ashok Leyland in 2005 in the Product Development
function, after working for over a decade in the USA at Ford Motor Company and
Intel Corporation. He brings with him rich experience in Vehicle Engineering,
Verification and Validation. After a 2-year assignment in 2011, as CEO of Nissan
Ashok Leyland Technologies Ltd., where he oversaw the development of LCV of
the JV, he took over as Head of Engineering at Ashok Leyland in 2013. He later
became the Head of Product Development. He serves on the board of many
industry bodies in the areas of Safety, Regulations and Emissions

133
BRIEF BIOGRAPHY OF THE CO-SUPERVISOR
Prof. Srinivasa Prakash Regalla obtained his PhD in Mechanical Engineering
from IIT Delhi in 1998, M. Tech in Manufacturing Science (Mechanical
Engineering) from IIT Kanpur in 1992 and B.Tech from Kakatiya Institute of
Technology and Science Warangal in 1990. Presently, he is a professor in the
Department of Mechanical Engineering, coordinator for the product design and
realization laboratory at the BITS Pilani, Hyderabad Campus, and the Dean
(Institute-wide) of Practice School Division. Previously, he was the Head of the
department of mechanical engineering, associate dean of work-integrated
learning programmes, assistant dean of research & consultancy, professor in-
charge of faculty affairs, and lead of the industry engagement imperative of
mission-2015 at BITS Pilani. He published 22 SCI, 18 Scopus, and 10 other peer-
reviewed journal papers and more than 30 international conference proceedings
papers, 2 books, and submitted 4 patents. He completed 3 funded research
projects, including as the PI of a project on low-cost and affordable additive
manufacturing (AM) made below-knee prosthesis funded by DBT/BIRAC/BIG. He
is currently a co-PI in an industrial R&D project. He taught a large variety of
undergraduate and postgraduate courses at BITS Pilani, some of which are newly
introduced elective courses and led the design of several new on-campus and
work-integrated learning programmes. He is a member of ASME, ISPO, SAE-
India, TSI, and IEI.