modeling with an inverse trig function { an ebola outbreak in...
TRANSCRIPT
Math 1300: Calculus I Project: Ebola, and arctan (x)
Modeling with an inverse trig function – an Ebola outbreak in 1995Goal: To study a model for deaths due to an Ebola outbreak and to use this model to discover aconnection between the values of a function and the area under the function’s derivative.
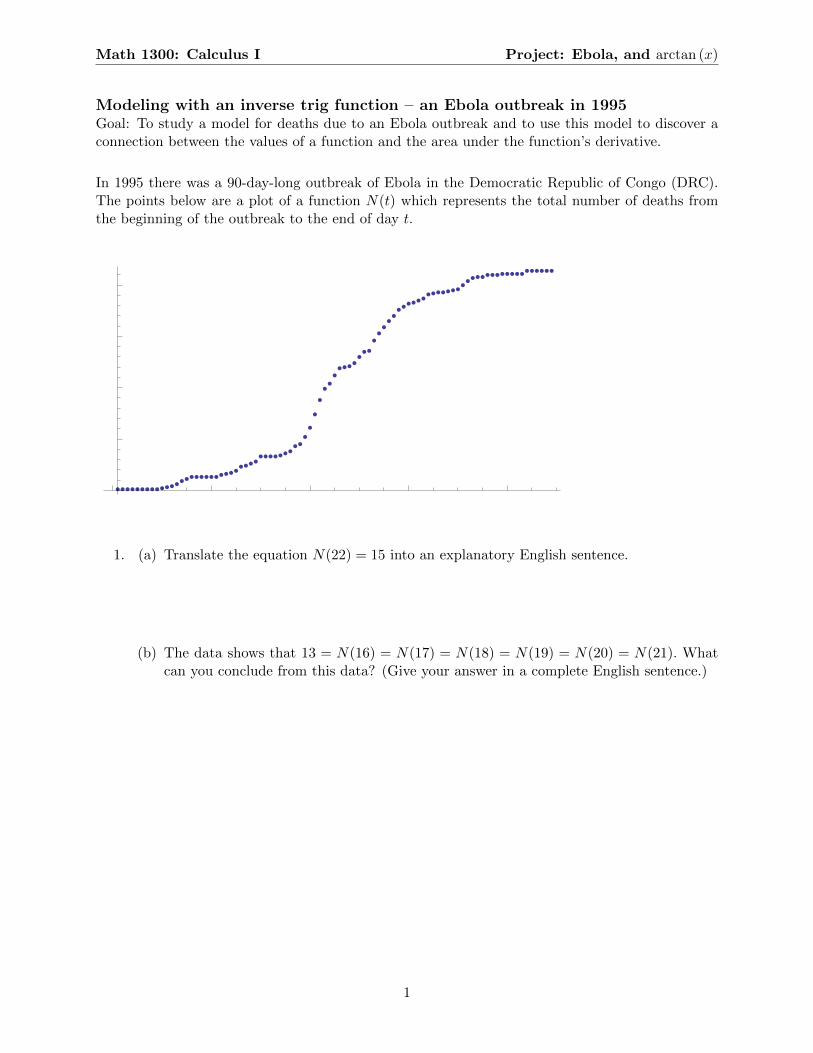
In 1995 there was a 90-day-long outbreak of Ebola in the Democratic Republic of Congo (DRC).The points below are a plot of a function N(t) which represents the total number of deaths fromthe beginning of the outbreak to the end of day t.
20 40 60 80t
50
100
150
200
1. (a) Translate the equation N(22) = 15 into an explanatory English sentence.
By day 22 of the outbreak, 15 people had died.
(b) The data shows that 13 = N(16) = N(17) = N(18) = N(19) = N(20) = N(21). Whatcan you conclude from this data? (Give your answer in a complete English sentence.)
13 people had died by day 16, and then there were no new deaths on days 17, 18, 19,20 or 21. The next person died on day 22, when it looks like N increased again. Wecan’t quite tell from the graph how many new deaths there were on that day, but atleast 14 had died by day 22.
1
Math 1300: Calculus I Project: Ebola, and arctan (x)
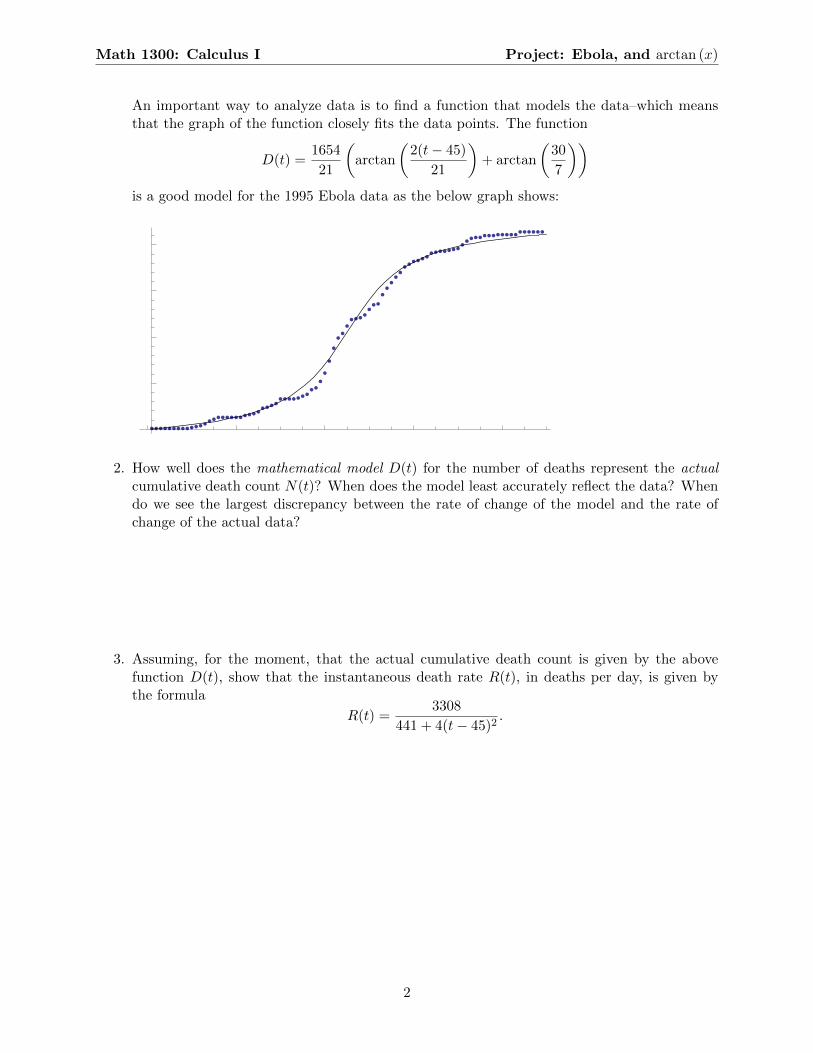
An important way to analyze data is to find a function that models the data–which meansthat the graph of the function closely fits the data points. The function
D(t) =1654
21
(arctan
(2(t− 45)
21
)+ arctan
(30
7
))is a good model for the 1995 Ebola data as the below graph shows:
20 40 60 80t
50
100
150
200
2. How well does the mathematical model D(t) for the number of deaths represent the actualcumulative death count N(t)? When does the model least accurately reflect the data? Whendo we see the largest discrepancy between the rate of change of the model and the rate ofchange of the actual data?The model fits quite well, though the actual count seems to sag a bit below the model in acouple of places, for t in the 30s and 50s. The model is least accurate between days 35 and40, where the gap between the curve and the points is largest. The rate of change (slope) isnotably inaccurate around day 40 (when the rate of change of the data is significantly steeperthan the model predicts). Then around day 45 the data looks pretty flat (derivative close to0) while the model is actually at its steepest (largest derivative occurs at the inflection point).
3. Assuming, for the moment, that the actual cumulative death count is given by the abovefunction D(t), show that the instantaneous death rate R(t), in deaths per day, is given bythe formula
R(t) =3308
441 + 4(t− 45)2.
R(t) = D′(t) =d
dt
[1654
21
(arctan
(2(t− 45)
21
)+ arctan
(30
7
))]=
1654
21
d
dtarctan
(2(t− 45)
21
)=
1654
21· 1
1 +
(2(t− 45)
21
)2 · d
dt
(2(t− 45)
21
)
=1654
21· 2
21· 1
1 +
(2(t− 45)
21
)2 =3308
441 + 4(t− 45)2.
2
Math 1300: Calculus I Project: Ebola, and arctan (x)
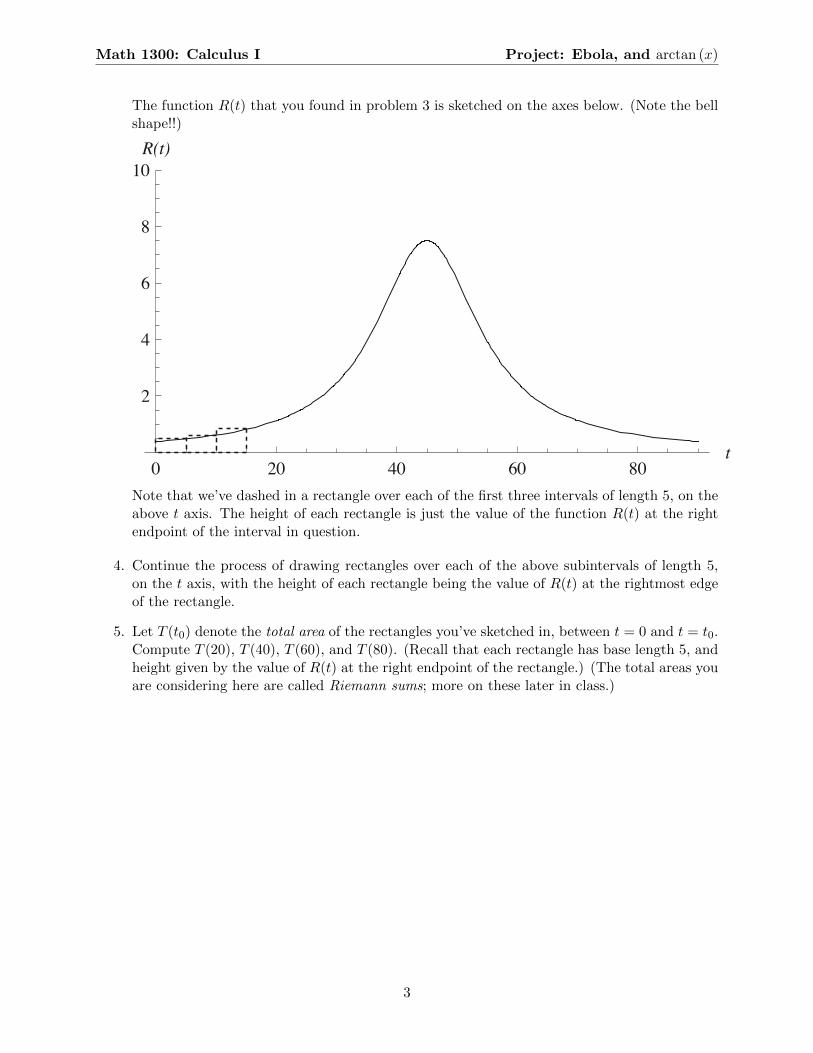
The function R(t) that you found in problem 3 is sketched on the axes below. (Note the bellshape!!)
0 20 40 60 80t
2
4
6
8
10R(t)
Note that we’ve dashed in a rectangle over each of the first three intervals of length 5, on theabove t axis. The height of each rectangle is just the value of the function R(t) at the rightendpoint of the interval in question.
4. Continue the process of drawing rectangles over each of the above subintervals of length 5,on the t axis, with the height of each rectangle being the value of R(t) at the rightmost edgeof the rectangle.
5. Let T (t0) denote the total area of the rectangles you’ve sketched in, between t = 0 and t = t0.Compute T (20), T (40), T (60), and T (80). (Recall that each rectangle has base length 5, andheight given by the value of R(t) at the right endpoint of the rectangle.) (The total areas youare considering here are called Riemann sums; more on these later in class.)
T (20) = 5R(5) + 5R(10) + 5R(15) + 5R(20) = 15.2316
T (30) = 5R(5) + 5R(10) + 5R(15) + 5R(20) + · · · + 5R(30) = 35.6695
T (40) = 5R(5) + 5R(10) + 5R(15) + 5R(20) + · · · + 5R(40) = 85.9096
T (60) = 5R(5) + 5R(10) + 5R(15) + 5R(20) + · · · + 5R(60) = 185.989
T (80) = 5R(5) + 5R(10) + 5R(15) + 5R(20) + · · · + 5R(80) = 206.907
T (90) = 5R(5) + 5R(10) + 5R(15) + 5R(20) + · · · + 5R(90) = 211.261
3
Math 1300: Calculus I Project: Ebola, and arctan (x)
6. Compare the above numbers T (20), T (40), T (60), and T (80), to the numbers D(20), D(40),D(60), and D(80) you get by plugging in the appropriate t-values into the formula for D(t)above. Do you see a correspondence between these sequences of numbers? Do you have anyidea why this correspondence should be true?
(This correspondence amounts to a HUGE theorem, called the Fundamental Theorem ofCalculus, which we’ll discuss in class later.)
We compute that
D(20) = 13.2632, D(30) = 30.0472, D(40) = 70.6609,
D(60) = 181.281, D(80) = 206.427, D(90) = 211.328
Note that these values of D are quite close, at least for t ≥ 60, to the corresponding valuesof T given on the previous page. The BIG IDEA behind what we’re seeing here is this.
Consider the area of any of the above rectangles – say, for the sake of argument, the 9threctangle indicated above (the tallest one). The baselength of of this rectangle is 5 days, andthe height is R(45). But remember R(45) = D′(45), so the height of the rectangle is D′(45),which is the instantaneous rate of change of D(t) at t = 45. But instantaneous rates of changeare roughly equal to average rates of change, over short enough intervals, so the height of therectangle is roughly equal to the average rate of change of D(t) over the interval from t = 40from t = 45.Now area=base×height, so:
area of rectangle ≈ 5 days × average death rate over those 5 days
= total, or cumulative, number of deaths over those five days.
The moral of the story is that there is a relationship between total change on the one hand,and area under the graph of the rate of change function on the other.This relationship is formalized by the Fundamental Theorem of Calculus, which we’ll get tosoon.
Why do you think the values of T (t) that you calculated in problem 5 start off higher thancorresponding values of D(t), and then later D(t) catches up?
R(t) starts off increasing, so the rectangles are all above the curve, giving a larger area thanunder the curve itself. So in the beginning T (t) is larger than D(t). But later R(t) decreases,so the rectangles lie below the curve. There the areas of the rectangles are smaller than thearea under the curve, so T (t) is growing slower than D(t). By the time we get to t = 80, theerrors pretty much balance out and T (t) is close to D(t).
4