modeling two-phase flow in pem fuel cell channelsecec.mne.psu.edu/pubs/2008-wangy-jps.pdf ·...
TRANSCRIPT

A
(flpafloflhg©
K
1
ieecafhafbog
d
U
0d
Available online at www.sciencedirect.com
Journal of Power Sources 179 (2008) 603–617
Modeling two-phase flow in PEM fuel cell channels
Yun Wang 1, Suman Basu, Chao-Yang Wang ∗Electrochemical Engine Center (ECEC), and Department of Mechanical and Nuclear Engineering,
The Pennsylvania State University, University Park, PA 16802, USA
Received 19 December 2007; received in revised form 23 January 2008; accepted 24 January 2008Available online 3 February 2008
bstract
This paper is concerned with the simultaneous flow of liquid water and gaseous reactants in mini-channels of a proton exchange membranePEM) fuel cell. Envisaging the mini-channels as structured and ordered porous media, we develop a continuum model of two-phase channelow based on two-phase Darcy’s law and the M2 formalism, which allow estimate of the parameters key to fuel cell operation such as overallressure drop and liquid saturation profiles along the axial flow direction. Analytical solutions of liquid water saturation and species concentrationslong the channel are derived to explore the dependences of these physical variables vital to cell performance on operating parameters such asow stoichiometric ratio and relative humility. The two-phase channel model is further implemented for three-dimensional numerical simulations
f two-phase, multi-component transport in a single fuel-cell channel. Three issues critical to optimizing channel design and mitigating channelooding in PEM fuel cells are fully discussed: liquid water buildup towards the fuel cell outlet, saturation spike in the vicinity of flow cross-sectionaleterogeneity, and two-phase pressure drop. Both the two-phase model and analytical solutions presented in this paper may be applicable to moreeneral two-phase flow phenomena through mini- and micro-channels.2008 Elsevier B.V. All rights reserved.
ter ma
weasutthtcoo
b
eywords: Mathematical modeling; Proton exchange membrane fuel cells; Wa
. Introduction
Fuel cells, converting chemical energy of fuels directlynto electricity, have become an integral part of alternativenergy and energy efficiency. Their noteworthy features, high-nergy conversion efficiency and zero emission, meet theritical demands of a rapidly growing society [1,2]. Amongll types of fuel cells, the proton exchange membrane (PEM)uel cell, also called polymer electrolyte fuel cell (PEFC),as reached center stage, particularly for mobile and portablepplications [3,4]. Besides their high-power capability, PEMuel cells work at low temperatures, produce only water asyproduct, and can be compactly assembled, making themne of the leading candidates for the next generation power
enerator.A typical PEFC consists of bipolar plates, gas channels, gasiffusion layers (GDLs), and a proton-conductive membrane
∗ Corresponding author. Tel.: +1 814 863 4762; fax: +1 814 863 4848.E-mail address: [email protected] (C.-Y. Wang).
1 Present address: Department of Mechanical and Aerospace Engineering,niversity of California, Irvine, CA 92697-3975, USA.
taolacfle
378-7753/$ – see front matter © 2008 Elsevier B.V. All rights reserved.oi:10.1016/j.jpowsour.2008.01.047
nagement; Two-phase flow; Channel flow
ith platinum catalyst coated on each side, called the membranelectrode assembly (MEA), as shown in Fig. 1. Gas channelsre grooved in graphite or metal plates, where injected reactanttreams are distributed for electrochemical reactions. The GDLs,sually coated with micro-porous layers (MPLs), play an impor-ant role in electronic connection between the bipolar plate andhe electrode and provide a passage for reactant transport andeat/water removal. Protons are produced from hydrogen oxida-ion in the anode catalyst layer, and pass through the membrane,arrying water molecules via electro-osmotic drag, to the cath-de catalyst layer where the oxygen reduction reaction (ORR)ccurs with water as byproduct.
Water management is a central issue in PEFC technologyecause while water is essential for membrane ionic conduc-ivity, excess liquid water leads to flooding of catalyst layersnd GDLs [5–7] as well as channel clogging [8,9]. Given low-perating temperatures during normal startup (25 ◦C) and henceow-saturation pressures, two-phase phenomena are unavoid-
ble in automotive fuel cells. Two-phase transport in a fuel cellonsists of three sub-problems: catalyst layer flooding, GDLooding, and two-phase flow in channels. To date, most of thefforts in two-phase modeling were devoted to the former two
604 Y. Wang et al. / Journal of Power S
[t
npcfliFptvaashctvfm
ipmmts
bFitputwptptpweaed
2m
ss(da
F1t
Fig. 1. Schematic of a PEM fuel cell.
5,10–18], and few models for channel flooding have existed inhe literature.
In practice, however, two-phase flow and transport in chan-els is of paramount importance for fuel cell operation,articularly in the most energy-efficient regime involving high-ell voltage and therefore low-current density. In this regime,ow rates of hydrogen and air through channels are exceed-
ngly low, resulting in substantial liquid water accumulation.ig. 2 shows experimental data of cell voltage and cathode-sideressure drop as functions of air stoichiometry. It can be seenhat channel flooding at low stoichiometry (ξ = 2) results in celloltage drop of as much as 120 mV, which would negate a volt-ge gain of 45 mV targeted by fourfold improvement in catalystctivity. Moreover, the drastic fluctuation in cell voltage at lowtoichiometry sets up voltage cycling at high potentials, whichas severe impact on PEM fuel cell durability. Other major con-erns of channel flooding include: (1) fuel starvation which leads
o carbon corrosion in the cathode catalyst layer; (2) oxygen star-ation which leads to hydrogen evolution on the cathode andurthermore H2/O2 combustion and hot spot formation; (3) flowaldistribution among parallel channels, leading to operationalsiiF
ig. 2. Cell voltage and cathode-side pressure drop measured under various air stoichio50 kPa and 80 ◦C with the dew point of both H2 and air at 70 ◦C [54]. As the air stoichihe onset of severe water flooding in cathode channels. Simultaneously, the cell volta
ources 179 (2008) 603–617
nstability and efficiency losses; (4) increase of the mass trans-ort loss at high-current densities. Thus, an urgent need in PEFCodeling has been to develop a two-phase flow and floodingodel for fuel cell channels, allowing the liquid water satura-
ion to be predicted at levels as high as 15–20%. Developinguch a preliminary model is the objective of this work.
In this work, we envision a structural and flow analogyetween PEM fuel cell channels and random porous media.ollowing the analogy, we then apply two-phase flow theory
n porous media to describe the two-phase, multi-componentransport in channels of a fuel cell. We show that such ahenomenological model is able to capture pressure, liquid sat-ration and reactant composition distributions along the flow,hereby sufficing to address such questions as channel flooding,ater trapping in channels of heterogeneous geometry, two-hase flow maldistribution in multiple, parallel channels, andhe flowfield effect on liquid water drainage. In addition, weresent analytical solutions as to the saturation distribution alonghe channel and analysis on the heterogeneity impact and two-hase pressure factor for PEFC channels for the first time asell as three-dimensional numerical simulations to explore the
ffects of key parameters such as relative humidity (RH) andir stoichiometric ratio on two-phase flow in channels. Finally,xperimental validation of the predicted two-phase pressurerop is reported.
. Analogy between mini-channels and random porousedia
PEM fuel cell channels are characterized by parallel orerpentine channels with square, rectangular or trapezoid cross-ections and channel dimensions ranging from 0.1 to 1 mmsee Figs. 3 and 4) [2,19]. Different configurations have beenescribed and explored recently, such as serpentine, parallel,nd interdigitated flow fields [19–23]. Fig. 4 shows a typical
erpentine parallel flow field in an industrial PEFC [24]. Visual-zation studies have revealed and studied two-phase phenomenan fuel cell channels experimentally [8,9,25], as illustrated inig. 5. Channels of similar structure are also encountered inmetric ratios (symbolized by ξ in the figure) in a 14 cm2 fuel cell for 0.2 A cm−2,ometry decreases, the pressure drop does not decrease proportionally, indicatingge drops by as much as 120 mV and fluctuates more.

Y. Wang et al. / Journal of Power Sources 179 (2008) 603–617 605
Fig. 3. Typical flow fields of PEFCs. (a) Parallel flow field; (b) serpe
Fig. 4. A flow field of an industrial PEFC [24].
mcetaa
lai∼srracerIttr
Fig. 5. Visualization of two-phase flow
ntine flow field; (c). pin flow field; (d) interdigitated flow field.
iniature heat pipes and micro-heat exchangers. In these appli-ations, evaporation and condensation take place to utilize thefficient latent heat transfer, therefore two-phase flow is ubiqui-ous. Previous studies in these fields include those of Stubos etl. [26], Wang et al. [27], Tio et al. [28], Imke [29], Henning etl. [30], and Sugumar and Tio [31].
Another field worthy mentioning is two-phase flow in geo-ogical media or petroleum reservoirs. Flow beds in thesepplications feature random solid particles with two-phase flown pores. Some porous formations feature a pore size range of
1 mm, thus strongly resembling the fuel cell channels. Thetructural similarity between the two, with the former beingandom porous media and the latter regular, ordered pores, wasecognized by Chaouche et al. [32], Or and Tuller [33], and Li etl. [34]. In addition, there exists a flow analogy in that flow in fuelell channels is well within the laminar regime and exhibits a lin-ar relationship between the pressure drop and velocity, the sameelation as expressed by Darcy’s law for flow in porous media.
ndeed, the proportionality constant called hydraulic conduc-ance in laminar flow through channels is physically equivalento permeability of a porous medium. Such a flow analogy wasecognized by Chen [35], Wong et al. [36], Wang et al. [27], andin PEM fuel cell channels [55].

6 wer S
ToepotcmusWp
3
coviodfmpceFflbnAtt
3
ct
Fno
fmt
C
M
wd
ρ
ρ
ν
fpiTti
s
ot
γ
w
λl =k /v + k /v
, and λg = 1 − λl (8)
06 Y. Wang et al. / Journal of Po
io et al. [28], among others. In addition, the geometrical anal-gy between a porous medium and a capillary is traditionallymployed to understand and develop flow theories in irregularorous media, in which disordered porous media with tortu-us pore channels are simplified as a bundle of straight capillaryubes. Envisaging the geometrical and flow analogy between fuelell channels and random porous media, we seek to develop aacroscopic model for two-phase flow in fuel cell channels by
sing the two-phase Darcy’s flow theory, as detailed in the nextection. Similar approaches were successfully implemented byang et al. [27], Tio et al. [28], and Imke [29] for miniature heat
ipes and micro-heat exchangers.
. Physical model
Fig. 1 schematically shows the geometry of a PEFC and itsomponents. The focus is placed on a single straight channel inrder to develop a channel two-phase flow model resolving axialariations in pressure, liquid saturation and other quantities. Thiss schematically shown in Fig. 6(a) for the cathode side. Partiallyr fully humidified air is fed in the inlet, and liquid water pro-uced from ORR is injected into the channel from the sidewallacing the GDL. The channels can generally be treated as porousedia with or without porous inserts. Without porous inserts, the
ore size in the porous medium is exactly equal to the channelross-section dimension with the pore tortuosity and porosityqual to unity. This general porous approach is illustrated inig. 6(b) and the Darcy’s law is applied to describe the two-phaseow through the channels, provided that the Reynolds numberased on the pore size is much smaller than 2000 to ensure lami-ar flow. This condition is commonly met in fuel cell operation.lso, the capillary number denoting the ratio of viscous force
o surface tension is unimportant for channel two-phase flow inhe presence of large axial velocity in gas channels.
.1. Conservation of mass and momentum
In the channel pores, we consider the gas and liquid phases asonstituents of a two-phase mixture with distinct phase veloci-ies. Following the well-known multiphase mixture formulation
ig. 6. Schematic of two-phase flow through a single channel: (a) an open chan-el; (b) a channel with porous inserts. The black shadowed regions on the upperr lower wall represent the liquid phase.
w
ources 179 (2008) 603–617
or two-phase flow through porous media [37], the mass andomentum conservations of the two-phase mixture can be writ-
en as follows:
ontinuity equation : ε∂ρ
∂t+ ∇ · (ρ�u) = 0 (1)
omentum conservation : ρ�u = −K
ν(∇P − γρρ�g) (2)
here the physical properties of the two-phase mixture areefined as
= sρl + (1 − s)ρg (3)
�u = �ulρl + �ugρg (4)
=(
krl
νl+ krg
νg
)−1
(5)
Here, the liquid water saturation, s, is defined as the volumeraction of open pores occupied by liquid water, which is a keyarameter characterizing the two-phase flow. Liquid saturations identical to liquid volume fraction in channel two-phase flow.he liquid saturation can be determined from the following rela-
ion with the mixture water concentration, CH2O, after the latters solved from the water transport equation:
= CH2O − Csat
ρl/MH2O − Csat(6)
The density correction factor in Eq. (2), γρ, is a sole functionf phase saturations and thus can be regarded as a property ofhe two-phase mixture:
ρ = ρlλl + ρgλg
sρl + (1 − s)ρg(7)
here the phase mobility, λk, is defined as
krl/vl
rl l rg g
The relationship between the phase mobility, λk, and liquidater saturation, s, is plotted in Fig. 7. It can be seen that the
Fig. 7. Phase mobility vs. liquid water saturation (nk = 4).
wer Sources 179 (2008) 603–617 607
lmoPbtu
k
avtp
ffosbf
s
E
w
c
ρ
r(btt
adtdtoH
K
w
d
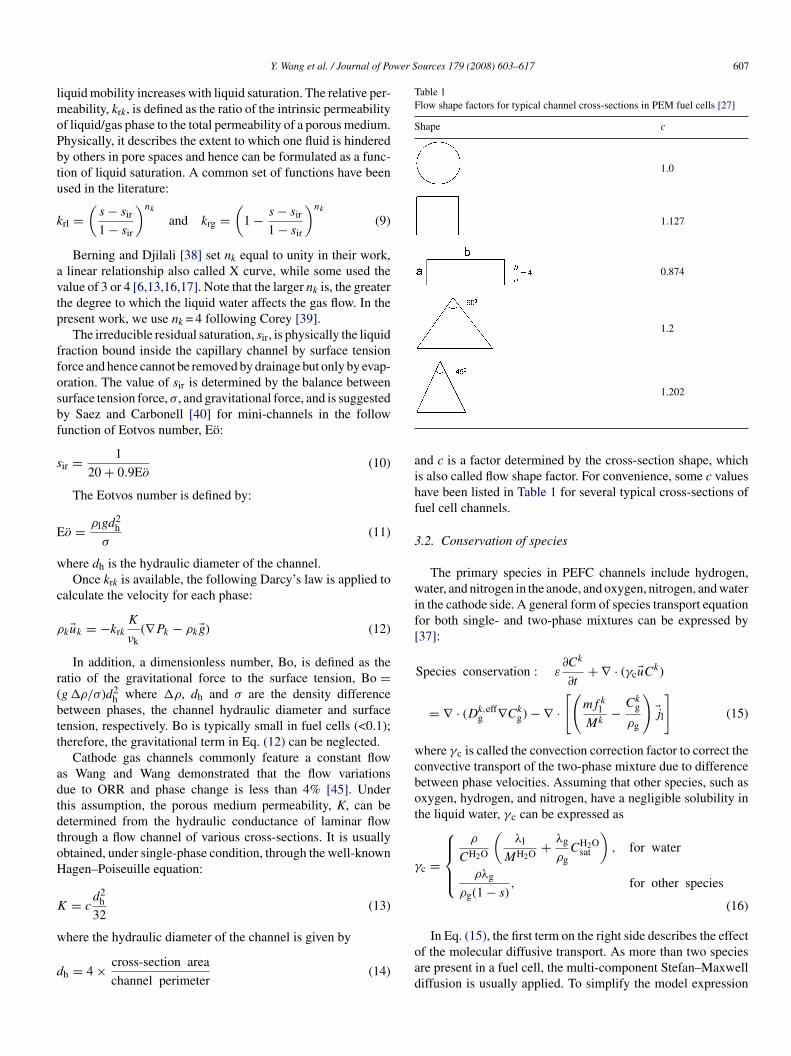
Table 1Flow shape factors for typical channel cross-sections in PEM fuel cells [27]
Shape c
1.0
1.127
0.874
1.2
aihf
3
wif[
wcbot
γ
Y. Wang et al. / Journal of Po
iquid mobility increases with liquid saturation. The relative per-eability, krk, is defined as the ratio of the intrinsic permeability
f liquid/gas phase to the total permeability of a porous medium.hysically, it describes the extent to which one fluid is hinderedy others in pore spaces and hence can be formulated as a func-ion of liquid saturation. A common set of functions have beensed in the literature:
rl =(
s − sir
1 − sir
)nk
and krg =(
1 − s − sir
1 − sir
)nk
(9)
Berning and Djilali [38] set nk equal to unity in their work,linear relationship also called X curve, while some used the
alue of 3 or 4 [6,13,16,17]. Note that the larger nk is, the greaterhe degree to which the liquid water affects the gas flow. In theresent work, we use nk = 4 following Corey [39].
The irreducible residual saturation, sir, is physically the liquidraction bound inside the capillary channel by surface tensionorce and hence cannot be removed by drainage but only by evap-ration. The value of sir is determined by the balance betweenurface tension force, σ, and gravitational force, and is suggestedy Saez and Carbonell [40] for mini-channels in the followunction of Eotvos number, Eo:
ir = 1
20 + 0.9Eo(10)
The Eotvos number is defined by:
o = ρlgd2h
σ(11)
here dh is the hydraulic diameter of the channel.Once krk is available, the following Darcy’s law is applied to
alculate the velocity for each phase:
k�uk = −krkK
νk(∇Pk − ρk�g) (12)
In addition, a dimensionless number, Bo, is defined as theatio of the gravitational force to the surface tension, Bo =g ρ/σ)d2
h where ρ, dh and σ are the density differenceetween phases, the channel hydraulic diameter and surfaceension, respectively. Bo is typically small in fuel cells (<0.1);herefore, the gravitational term in Eq. (12) can be neglected.
Cathode gas channels commonly feature a constant flows Wang and Wang demonstrated that the flow variationsue to ORR and phase change is less than 4% [45]. Underhis assumption, the porous medium permeability, K, can beetermined from the hydraulic conductance of laminar flowhrough a flow channel of various cross-sections. It is usuallybtained, under single-phase condition, through the well-knownagen–Poiseuille equation:
= cd2
h
32(13)
here the hydraulic diameter of the channel is given by
h = 4 × cross-section area
channel perimeter(14)
oad
1.202
nd c is a factor determined by the cross-section shape, whichs also called flow shape factor. For convenience, some c valuesave been listed in Table 1 for several typical cross-sections ofuel cell channels.
.2. Conservation of species
The primary species in PEFC channels include hydrogen,ater, and nitrogen in the anode, and oxygen, nitrogen, and water
n the cathode side. A general form of species transport equationor both single- and two-phase mixtures can be expressed by37]:
Species conservation : ε∂Ck
∂t+ ∇ · (γc�uCk)
= ∇ · (Dk,effg ∇Ck
g) − ∇ ·[(
mfkl
Mk− Ck
g
ρg
)�jl
](15)
here γc is called the convection correction factor to correct theonvective transport of the two-phase mixture due to differenceetween phase velocities. Assuming that other species, such asxygen, hydrogen, and nitrogen, have a negligible solubility inhe liquid water, γc can be expressed as
c =
⎧⎪⎪⎨⎪⎪⎩
ρ
CH2O
(λl
MH2O + λg
ρgCH2O
sat
), for water
ρλg
ρg(1 − s), for other species
(16)
In Eq. (15), the first term on the right side describes the effectf the molecular diffusive transport. As more than two speciesre present in a fuel cell, the multi-component Stefan–Maxwelliffusion is usually applied. To simplify the model expression

6 wer S
adtngb
D
c
D
afflflcsgfcadb
�j
w
p
Hgms
Jθc <
θc >
achG
3
psc
l
a
f
γ
d
S
wcr
m
wf
ρ
3
inbt
cWa
3
rimI
ξ
08 Y. Wang et al. / Journal of Po
nd later numerical implementation, we use the Fick’s law toescribe the molecular diffusion in the gaseous phase. In addi-ion, Eq. (15) also neglects diffusion of hydrogen, oxygen, anditrogen in liquid water due to exceedingly low solubility. In theas phase, the species diffusion coefficient in Eq. (15) is giveny [41]:
kg = Dk
g,o
(T
353
)3/2( 1
p
)(17)
In a two-phase region, the effective gaseous diffusion coeffi-ient is modified via the Bruggeman correlation:
k,effg = (1 − s)τdDk
g (18)
In addition to the convective and diffusive transport, capillaryction may take place in porous media, which drives liquid waterrom a higher liquid saturation region to a lower one. The waterux driven by the capillary force is called the capillary diffusionux, �jl, which is included in the second term of Eq. (15). Theapillary force is mathematically described by capillary pres-ure, pc, which is defined as the pressure difference betweenas and liquid phases, i.e. pg − pl. The capillary pressure is aunction of surface properties such as surface tension, σ, andontact angle, θc, porous medium properties such as porosity, ε,nd permeability, K, and the liquid saturation, s. The capillaryiffusion flux, �jl, and capillary pressure, pc, can be calculatedy
l = λlλg
νK[∇pc + (ρl − ρg)�g] (19)
here
c = σ cos(θc)( ε
K
)1/2J(s)
ere, J(s) is the Leverett function, an empirical relation that isenerally adopted for both hydrophobic and hydrophilic porousedia [7], and we extend it to structured porous medium repre-
entation of gas channels:
(s) ={
1.417(1 − s) − 2.120(1 − s)2 + 1.263(1 − s)3, for
1.417s − 2.120s2 + 1.263s3, for
Usually, the GDL materials are made hydrophobic throughdding PTFE to facilitate the water removal from thehannel–GDL interface [42]. Other channel walls are usuallyydrophilic, allowing wicking of liquid water away from theDL surface.
.3. Conservation of energy
Temperature distribution plays a vital role in channel two-hase flow due to the exponential relationship between theaturation pressure, psat, and temperature. Springer et al. [43]orrelated psat with temperature:
og10 psat = −2.1794 + 0.02953(T − 273.15)
− 9.1837 × 10⁻⁵(T − 273.15)2
+ 1.4454 × 10⁻⁷(T − 273.15)3 (21)
wtdi
ources 179 (2008) 603–617
90◦
90◦ (20)
A general thermal model for two-phase flow can be writtens
Energy conservation :∂ρ cpT
∂t+ ∇ · (γT ρcp�uT )
= ∇ · (keff∇T ) + Sfg (22)
Once again, the advection term is modified by a correctionactor, γT, and is given by
T = ρ(λlcp,l + λgcp,g)
sρlcp,l + (1 − s)ρgcp,g(23)
The source term arises from latent heat release or absorptionue to water condensation/evaporation and can be written as [16]
fg = hfgmfg (24)
here hfg and mfg are the latent heat of vapor–liquid phasehange and the phase change rate, respectively. The latter iseadily calculated from the liquid continuity equation, namely
˙ fg = ρl∂s
∂t+ ∇ · (ρl�ul) (25)
here the liquid-phase velocity in the M2 model is computedrom either Eq. (12) or the following equation:
l�ul = �jl + λlρ�u (26)
.4. Boundary conditions
Eqs. (1), (2), (15) and (22) form a complete set of govern-ng equations with unknowns of �u, P, T, and Ck to describeon-isothermal, two-phase flow in fuel cell channels. Properoundary conditions are needed to close the mathematical sys-em. The temperature distribution is usually determined by the
ooling channel design in PEFCs, as detailed previously byang and Wang [24]. Other boundary conditions are specified
s follows.
.4.1. Flow inlet boundariesThe cathode inlet flow is commonly set partially or fully satu-
ated without liquid water. Therefore, the inlet mixture velocitys the one in the gas phase, �uin,g, determined by the stoichio-
etric flow ratio, ξc, and a reference/average current density,av:
c = CO2uin,gAxz
IavAmem/4F(27)
here Axz and Amem are the areas of flow cross-sectional andhe membrane, respectively. The inlet molar concentrations areetermined by the inlet pressure and humidity according to thedeal gas law.

wer Sources 179 (2008) 603–617 609
3
3
t
u
3
piiGlF
S
wtmesapt
4
wfiFsua(ettwer(p
Fig. 8. Geometry and computational mesh of a single straight channel.
Table 2Geometrical, physical and operating parameters
Quantity Value
Gas channel depth 0.3 mmGas channel width 0.5 mmGas channel length 0.1 mCathode pressure, P 1.0 atmAverage current density, Iav 1.0 A cm−2
Temperature of fuel cell, T 353 KO2 diffusivity in the gas channel at standard
condition, Do,O2
3.2348 × 10⁻⁵ m2 s−1
H2O diffusivity in the gas channel atstandard condition, Do,H2O
7.35 × 10⁻⁵ m2 s−1
Viscosity of liquid water, μl 3.5 × 10⁻⁴ kg (m s)−1
Surface tension, liquid–water–air (80 ◦C), σ 0.0625 N m−1
CL
orasit
5
nsoTw
5
d
Y. Wang et al. / Journal of Po
.4.2. Outlet boundariesFully developed conditions are applied:
∂�u∂n
= 0 and∂Ck
∂n= 0 (28)
.4.3. Solid wallSlip and impermeable velocity condition and no-flux condi-
ion are applied:
� · �n = 0 and∂Ck
∂n= 0 (29)
.4.4. GDL surfaceAs only the flow channel is considered, during operation
roduct water is injected into the channel at the GDL–channelnterface and simultaneously a proportional amount of oxygens transported out of channel for the ORR in the catalyst layer.iven a distribution of current density, I(x,y), one can calcu-
ate the water production and oxygen consumption rates via thearaday’s law:
H2O = (1 + 2α)I
2Fand SO2 = − I
4F(30)
here α is the net water transport coefficient which describeshe total water crossover from the anode to cathode through the
embrane under combined influences of water diffusion andlectro-osmotic drag. Its value is close to zero as recently mea-ured by Liu et al. [44]. In the present work, for simplicity wessume α equal to zero while a non-zero α can be easily incor-orated in the present model. Once the reaction rate is available,he following boundary conditions can be applied [45]:
ρ�u · �n = −(MH2OSH2O − MO2SO2 )�n
γc�uCH2O · �n − Dk,effg
∂CH2Og
∂n+(
mfkl
Mk− Ck
g
ρg
)�jl · �n = −SH2O
γc�uCO2 · �n − DO2,effg
∂CO2
∂n= −SO2
(31)
. Numerical procedures
The governing equations, Eqs. (1), (2), (15) and (22), alongith their appropriate boundary conditions are discretized by thenite volume method and solved by a commercial flow solver,luent® (version 6.0.12), using the SIMPLE (semi-implicit pres-ure linked equation) algorithm [46]. The SIMPLE algorithmpdates the pressure and velocity fields from the solution ofpressure correction equation, solved by algebraic multi-grid
AMG) method. Following the solution of the flow field, speciesquations are solved. The source terms and physical proper-ies are implemented in a UDF (user-defined function) andhe species transport equations are solved through the soft-are’s user-defined scalars. The mesh of a single-channel PEFC
mployed here for a numerical study is shown in Fig. 8. Geomet-ical and operating parameters are listed in Table 2. Ten thousand20 × 100 × 5) computational cells are used to capture the com-lex two-phase phenomena in the PEFC channel. In addition,
A
ontact angle of the channel wall, θc 80◦iquid–vapor phase change latent heat, hfg 2.26 × 10⁶ J kg−1
verall species balance is checked in addition to the equationesiduals as important convergence criteria. These species bal-nce checks also ensure physically meaningful results. In all theimulations to be presented in the next section, values of speciesmbalance are all less than 1% and equation residuals smallerhan 10−6.
. Results and discussion
It is instructive to perform a one-dimensional (along the chan-el) analysis based on the above-described model. We consider aingle-straight channel and the isothermal condition with focusn variations of pressure and liquid saturation along the channel.he cathode side is selected for analysis as shown in Fig. 6(b),hile the anode channel problem can be derived similarly.
.1. Buildup of liquid water
Considering the steady state, integration of Eq. (1) in one-imension yields:
∣ ∫ y
xzρuy = (Axzρuy)∣in +0
SmLz,mem dy
= (Axzρuy)∣∣in + Lz,mem
∫ y
0 I(y) dy
2FMH2 (32)

6 wer S
wSsAci
A
wto
t
Hn
Y
g
I
bowdl
wrmC
ndwOc
e
Y
Wecsd
i(
(1/
ξc/2)
tfe
sah
ss
u
(
λ
b
λ
10 Y. Wang et al. / Journal of Po
here ( )|in represents the value of a quantity at the inlet andm denotes the mass source due to ORR. Note that the net massource consists of water production minus oxygen consumption.ssuming the capillary effect and diffusive transport along the
hannel direction are negligible as compared to the convection,ntegration of Eq. (15) for species water results in:
xzγcuyCH2O = (AxzγcuyC
H2O)|in +∫ y
0SH2OLz,mem dy
= (AxzγcuyCH2O)
∣∣in + Lz,mem
∫ y
0 I(y) dy
2F(33)
here SH2O denotes the water production rate of ORR. Substi-uting Eq. (32) into Eq. (33) to cancel the mixture velocity, uy,n the left-hand side yields:
γcCH2O
ρ= (AxzuyC
H2O)|in + Lz,mem((∫ y
0 I(y) dy)/2F )
(Axzρuy)|in + Lz,mem((∫ y
0 I(y) dy)/2F )MH2(34)
Using the inlet condition, Eq. (27), one can further expresshe above as
γcCH2O
ρ= ((ξc/2CO2 )CH2O)|in + ((
∫ Y
0 I(Y ) dY )/Iav)
((ξc/2CO2 )ρ)|in + ((∫ Y
0 I(Y ) dY )/Iav)MH2(35)
ere, Y is the dimensionless distance from the inlet (see Fig. 8),amely
= y
Ly
= y
AmemLz,mem (36)
The average current density, Iav, can be calculated by inte-rating the current density profile, I(Y):
av =∫ 1
0I(Y ) dY (37)
Note that the left-hand side of Eq. (35) is solely determinedy liquid water saturation while the right-hand side is a functionf operating parameters, such as ξc and the inlet humidity, asell as the axial location, Y. Given the expressions of mixtureensity, Eq. (3), and advection correction factor, Eq. (16), theeft-hand side can be further rearranged as
γcCH2O
ρ=
⎧⎪⎪⎨⎪⎪⎩
CH2O
ρg, Y < Yo(
1
MH2O − 1
ρgCH2O
sat
)+ λl + 1
ρgCH2O
sat , Yo < Y
(38)
here Yo is the transition point from the single- to two-phaseegions, i.e. when CH2O|Yo = CH2O
sat . That is, Yo can be deter-ined by setting CH2O on the left-hand side of Eq. (35) to be
λl = (ξc/2)(CH2O/CO2 )|in + ((∫ Y
0 I(Y ) dY )/Iav) −((1/MH2O) − (1/ρg)CH2O
sat )((
H2Osat :
CH2Osat
ρg= ((ξc/2CO2 )CH2O)|in + ((
∫ Yo0 I(Y ) dY )/Iav)
((ξc/2CO2 )ρ)|in + ((∫ Yo
0 I(Y ) dY )/Iav)MH2(39)
s
ources 179 (2008) 603–617
In the region of Y < Yo, there is single-phase flow in the chan-el. Note that ρ and ρg represent the mixture density and gaseousensity respectively and their relation is expressed in Eq. (3). Theater concentration can be calculated through Eq. (35) and (38).ther variables, such as O2 concentration and mixture velocity,
an be readily obtained similarly.Assuming a constant current density, Yo can be explicitly
xpressed as
o = ξc
2
[(1/CO2 )((CH2Osat /ρg)ρ − CH2O)]|in
1 − (CH2Osat /ρg)MH2
(40)
As ξc → ∞, Yo → ∞ unless CH2O|in ≥ CH2Osat . Wang and
ang [45] concluded that the electrochemical reaction has littleffect (<5%) on the cathode gas density and flow velocity underommon operation of PEFCs. Therefore, Eq. (39) can be furtherimplified to calculate Yo by neglecting mass injection and gasensity variation.
In the region of Y > Yo, liquid water emerges and hence theres two-phase flow in the channel. Substituting Eq. (38) into Eq.35), one obtains:
ρg)CH2Osat ((ξc/2)(ρ/CO2 )|in + ((
∫ Y
0 I(Y ) dY )/Iav)MH2 )
(ρ/CO2 )|in + ((∫ Yo
0 I(Y ) dY )/Iav)MH2 )(41)
The liquid mobility, λl, is a function of liquid water satura-ion, s, as shown in Eq. (8) and Fig. 7. Through rearrangementrom Eqs. (8) and (9), one can express liquid water saturationxplicitly by the liquid mobility, λl, as
s − sir
1 − sir= 1
(((1 − λl)/λl)(vg/vl))1/nk + 1(42)
Substituting Eq. (41) into Eq. (42), we can obtain an explicitolution of water saturation as a function of operating conditionsnd axial location. Note that the effect of residual saturation, Sir,as been accounted for in Eq. (42).
Once liquid saturation, s, becomes available, the mixture den-ity can be calculated through Eq. (3), which can further beubstituted into Eq. (32) to calculate the mixture velocity by:
y = (ρuy)|in + ((∫ Y
0 I(Y ) dY )/2F )MH2
ρ(43)
Considering the condition of a constant current density, Eq.41) can be simplified as
l=(ξc/2)(CH2O/CO2 )|in+Y−(1/ρg)CH2O
sat ((ξc/2)(ρ/CO2 )|in+YMH2 )
((1/MH2O) − (1/ρg)CH2Osat )((ξc/2)(ρ/CO2 )|in + YMH2 )
(44)
When full humidification is applied at the inlet, Eq. (44) cane further simplified to:
l = (1 − (1/ρg)CH2Osat MH2 )
H2 H2O O2 H2Y
((1/M ) − (1/ρg)Csat )((ξc/2)(ρ/C )|in + YM )(45)
In the above equation, ξc → ∞ leads to λc → 0 and hence→ sir as shown in Eq. (42).

wer Sources 179 (2008) 603–617 611
i
A
T
C
Ttr
atftstsittim
Fl
wλ
flcflbtosi
Y. Wang et al. / Journal of Po
For the oxygen equation of Eq. (15), following the similarntegration, one can arrive at the following formula:
xzγcuyCO2 = Axz(γcuyC
O2 )|in +∫ y
0SO2Lz,mem dy
= Axz(γcuyCO2 )|in − Lz,mem
∫ y
0 I(y) dy
4F(46)
herefore,
O2 = (γcuyCO2 )|in − ((
∫ Y
0 I(Y ) dY )/4F )
γcuy
(47)
he right-hand side of the above equation can be calculatedhrough the known operating conditions and liquid water satu-ation, s.
Liquid water saturation, s, is an important parameter char-cterizing the two-phase flow in fuel cell channels. Fig. 9 plotshe liquid water saturation profiles along the channel under aull-humidity operation calculated from Eqs. (42) and (45) withhe cell temperature of 80 ◦C and pressure of 100 kPa. We alsoet the irreducible residual saturation sir equal to zero to facili-ate explaining the results. The effects of the irreducible residualaturation sir can be readily obtained through Eq. (42). Since thenlet gas is already fully humidified, liquid water emerges at
he channel entrance due to local water production. The satura-ion level rises drastically at the initial stage followed by a slowncrease in the downstream. One reason for this trend is that theobility of liquid water, λl, is strongly dependent on the liquid
3ait
Fig. 10. Simulation results of: (a) liquid water saturation; (b) pres
ig. 9. Liquid water saturation profiles along the channel, predicted from ana-ytical solutions and numerical simulations.
ater saturation, as shown in Eqs. (8) and (9), with the value ofl approximately proportional to snk at low saturations. There-ore, liquid mobility is very low in low-saturation regions andiquid water builds up quickly as shown in Fig. 9. In addition, itan be seen that the higher the stoichiometric ratio, ξc, or the gasow rate, the lower the saturation level. This can be explainedy the fact that higher velocity of the gas is efficient in draininghe liquid by overcoming surface interactions. Under commonperating conditions of a fuel cell, with ξc = 2.0, the predictedaturation can reach as high as 20% towards the channel outlet,n good agreement with experimental observations. In addition,
D simulation results of the cross-section averaged saturationre plotted in the same figure and a good agreement is obtainedndicative of validity of the assumptions made in derivation ofhe analytical solutions.sure distribution at the middle cross-section of the channel.

612 Y. Wang et al. / Journal of Power Sources 179 (2008) 603–617
Fv
dsFdslGnFttttwttsvdtttm[
Fc
dEpiHtf
iawtfatwtsflsdowtraddition, as the air stoichiometry increases, the transition fromsingle- to two-phase flow delays, due to the larger capacity ofgas to uptake water vapor before reaching saturation. This con-
ig. 11. Simulation results of: (a) liquid phase velocity; (b) component of liquidelocity in the depth direction at the middle cross-section of the channel.
Detailed simulation results are depicted in Figs. 10 and 11,isplaying the distributions of liquid water saturation, gas pres-ure, and liquid velocity in the mid-section of the channel.ig. 10(a) indicates a small variation of saturation in the depthirection. This is due to the small size of the channel cross-ection compared with the channel length. Therefore, a slightiquid water motion exists in the channel depth direction from theDL–channel interface, where water is injected into the chan-el, to the opposing sidewall as shown in Fig. 11(b). In addition,ig. 10(b) indicates that the gas pressure gradient increases along
he channel which can be explained by increase of liquid satura-ion along the channel as shown in Fig. 10(a). Fig. 11(a) showshat the liquid flow along the channel speeds up, due to con-inual water injection from the GDL–channel interface (the leftall) due to ORR. As the gas phase is already fully saturated at
he inlet, the fuel cell channel totally relies on the liquid phaseo remove product water. In addition, liquid axial velocity ismall along the channel with the magnitude of 10−4 m s−1. Thiselocity magnitude renders a time constant ∼1000 s for waterrainage or the reverse process of liquid water accumulation inhe channel, given the channel length of 0.1 m. This residence
ime is consistent with experimental observations on fuel cellransients [47] and much larger than the ones for gas diffusion,embrane hydration [48–50], GDL drying [17,51] and cold start52,53].Fh
ig. 12. Analytical results of liquid water saturation profiles under non-uniformurrent density distribution.
Fig. 12 shows liquid saturation profiles under varying currentensity distributions as calculated from the analytical solution,qs. (41) and (42). As current density is proportional to waterroduction rate, the current density distribution has profoundmpacts on the local phase distribution as shown in Fig. 12.owever, the average current densities are set the same, therefore
he same level of liquid water saturation is predicted at the outletor all the cases despite of different local current density.
While the above results focus on fully saturated gases at thenlet, low-humidity operation is more common in the automotivepplication of PEFC. Fig. 13 shows simulated profiles of liquidater saturation under different inlet stoichiometric ratios for
he inlet gas dew point of 70 ◦C. Because low-humidity gas ised in, there is no liquid water in the channel entrance regionnd channel flow is single-phase in nature. As the channel con-inues receiving water produced from ORR via the GDL, theater concentration in the gas increases till saturation. After
hat, water addition leads to condensation as the gas is alreadyaturated. This is the transition point from single- to two-phaseow in channels, as clearly shown in Fig. 13. At the initialtage of two-phase flow, the liquid saturation increases graduallyue to the fact that a portion of channel flow, near the sidewallpposing to the GDL, is in pure single-phase region which holdsater to increase its water content. After the entire channel is in
he two-phase regime, the liquid saturation experiences a sharpise followed by a slow increase towards the channel outlet. In
ig. 13. Simulation results of liquid water saturation distributions under low-umidity inlet conditions.

Y. Wang et al. / Journal of Power Sources 179 (2008) 603–617 613
Fig. 14. Simulation results of: (a) liquid velocity; (b) component of liquid veloc-ia
cE
if7waFridtta
pbi
Fh
Fca
5
cwnwhatcmbavdsffo
cEa
∇
ty in the depth direction; (c) component of gas velocity in the depth directiont the middle of the gas channel.
lusion can also be drawn from the analytical solution for Yo,q. (39).
Fig. 14 shows the simulation results of liquid velocity, veloc-ty components of liquid and gas flow in the depth or x-directionor the inlet stoichiometry of 2 and dew point temperature of0 ◦C. It can be seen from Fig. 14(a) that there exists a regionhere single- and two-phase flows coexist and the liquid flow
ccelerates after the entire channel is in the two-phase regime.ig. 14(b) clearly demonstrates that the present M2 model canesolve differing velocity fields of gas and liquid, indicating thatt is a full two-fluid model. The liquid flow in the channel depthirection is away from the GDL surface while the gas flow isowards the GDL, as shown in Fig. 14(c). The magnitude of theransverse gas velocity is small (∼10−3 m s−1) compared to thexial gas velocity.
Fig. 15 displays the liquid saturation profiles for different dewoint temperatures of inlet gases at the stoichiometry of 2. It can
e seen that the higher the gas dew point, the earlier transitionnto the two-phase flow, as expected.ig. 15. Analytical solutions of liquid water saturation profiles under low-umidity inlet conditions.
f
tH
ig. 16. Schematic of branch-merge flow field and the corresponding poroushannel model (K1 > K2). The cycle shadow represents the liquid water trappingt the heterogeneity.
.2. Two-phase flow in heterogeneous channels
The foregoing results and discussion have been focused onhannels of uniform cross-section and with constant surfaceettability, while many PEFC designs have non-uniform chan-els which feature either geometrical heterogeneity or surfaceettability variation along the flow, or both. The two types ofeterogeneity are considered together and regarded generally asspatial variation in channel permeability (or hydraulic conduc-
ance) and surface contact angle. For example, a branch-mergehannel can be treated as a porous medium with differing per-eability or hydraulic conductance, as shown in Fig. 16. This
ranch-merge flowfield is a popular design in fuel cells due to itsbility to mix and re-distribute reactants in channels thereby alle-iating a tendency of flow maldistribution. However, the channelesign may also lead to water trapping at the transition point ashown in Fig. 16. In addition, a branch of parallel channels in auel cell usually share the same inlet or outlet, also called mani-old as shown in Figs. 3 and 4, which resembles either the merger branched pattern.
For liquid water transport through a homogeneous poroushannel, the capillary action can be written, through substitutingq. (19) into the second term on the right-hand side of Eq. (15),s
·[(
mfkl
Mk− Ck
g
ρg
)�jl
]= ∇ ·
[(mfk
l
Mk− Ck
g
ρg
)λlλg
νK∇Pc
]
(48)
The above term can be treated as a diffusion term with theollowing form:
∇ ·[(
mfkl
Mk− Ck
g
ρg
)�jl
]
= ∇ ·[(
mfkl
Mk− Ck
g
ρg
)λlλg
νK
dPc
ds∇s
](49)
Thus, the capillary force drives water from a higher saturationo a lower saturation region in a homogenous porous medium.owever, in a heterogeneous porous medium, Eq. (48) must be

614 Y. Wang et al. / Journal of Power Sources 179 (2008) 603–617
r
ttshKt
Fs
K
O
K
esuho
Fs
Twuaatmi
iaea
5
ctuacflthe upper channel in order to maintain the same pressure dropbetween the inlet and outlet manifolds. Such a two-phase flowmaldistribution dramatically reduces PEM fuel cell performanceas well as durability.
Fig. 17. Schematic of permeability heterogeneity in fuel cell channels.
ewritten in the following general form:
∇ ·[(
mfkl
Mk− Ck
g
ρg
)λlλg
νK∇Pc(σ, θc, ε, K, s)
]
= ∇ ·[(
mfkl
Mk− Ck
g
ρg
)λlλg
νK
(∂Pc
∂σ∇σ + ∂Pc
∂θc∇θc
+ ∂Pc
∂ε∇ε + ∂Pc
∂K∇K + ∂Pc
∂s∇s
)](50)
It can be seen that spatial variations in surface tension σ, con-act angle θc, porosity ε and permeability K add extra terms intohe capillary action in addition to the capillary diffusion underaturation gradient. For simplicity, here we only consider theeterogeneity in the permeability (or hydraulic conductance),, while keeping other properties constant. Then the additional
erm due to geometrical heterogeneity can be expressed as
∇ ·[(
mfkl
Mk− Ck
g
ρg
)λlλg
νK
(∂Pc
∂K∇K
)]
= ∇ ·[(
mfkl
Mk− Ck
g
ρg
)λlλgσ cos(θc)ε1/2
νJ(s)K∇(K−1/2)
]
(51)
urther assuming a linear profile of K along the channel, ashown in Fig. 17
= k1y + k2 (52)
ne can reach
∇(K−1/2) = K
⎛⎜⎜⎝
0
−1
2k1K
−(3/2)
0
⎞⎟⎟⎠ = −1
2k1
⎛⎜⎝
0
K−(1/2)
0
⎞⎟⎠
(53)
Fig. 18 shows the liquid water saturation profile along a het-rogeneous channel schematically shown in Fig. 17. It can be
een that the saturation profile remains almost unchanged in theniform sections of the channel while a spike is predicted in theeterogeneous region. This result indicates that the influencef local heterogeneity affects only the local phase distribution.Fm
ig. 18. Simulation result of the liquid water saturation around the heterogeneityhown in Fig. 17.
his localized phenomenon can be readily explained by Eq. (50)here the extra term acts like an additional capillary force to holdp water. On the global scale, since the extra terms in Eq. (50)re mathematically in conservative form, there is no extra waterdded besides water production by ORR. Finally, it is notewor-hy that if reaching a high-liquid saturation, the localized spike
ay cause channel clogging by liquid water and flow shutdownn a multiple, parallel channel configuration.
It should be noted that while Eq. (50) is derived forsotropic porous media, a similar analysis could be performed fornisotropic media. More discussion on two-phase flows in het-rogeneous porous media can be found in the field of petroleumnd geological systems [26,32].
.3. Two-phase pressure drop
As the presence of liquid water hampers gas flow in fuel cellhannels, the gas pressure gradient in two-phase flow is greaterhan that in single-phase. The increased pressure drop due to liq-id water accumulation is a key cause for flow maldistribution,s schematically shown in Fig. 19. Liquid water in the lowerhannel incurs additional pressure drop which forces the gasowrate to be reduced in the lower channel and increased in
ig. 19. Schematic of flow in multiple channels: (a) uniform distribution; (b)aldistribution. The black shadowed regions in (b) denote the liquid phase.
Y. Wang et al. / Journal of Power Sources 179 (2008) 603–617 615
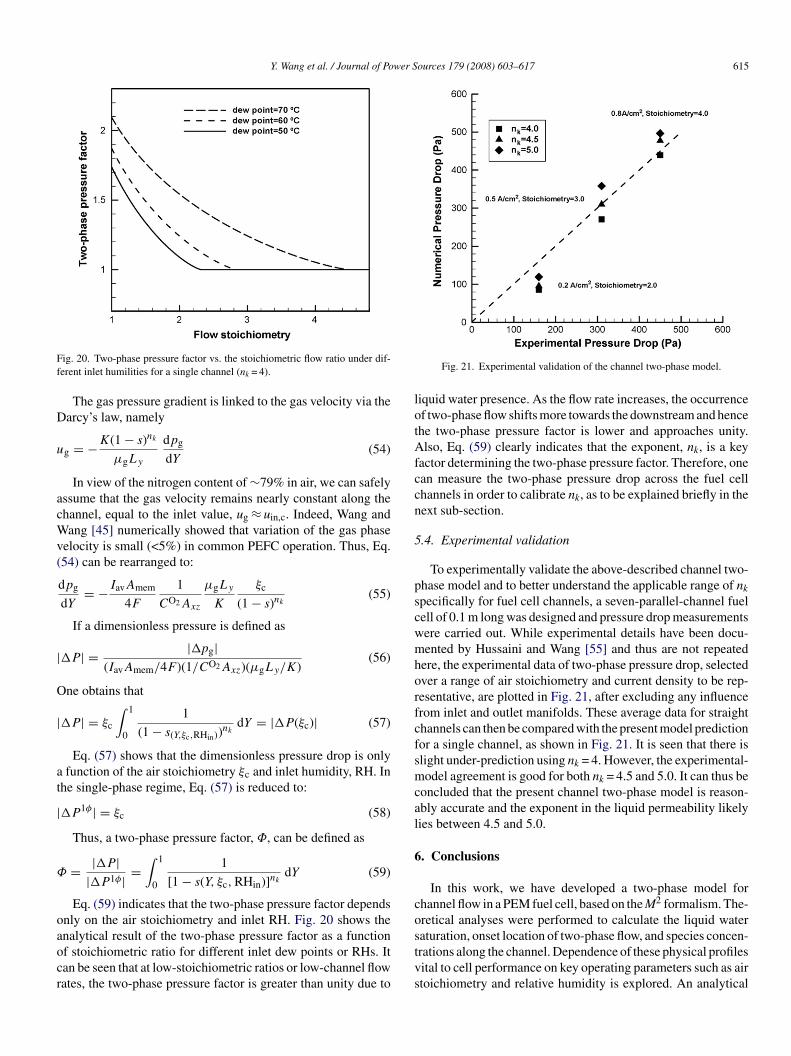
Ff
D
u
acWv(
|
O
|
at
|
Φ
oaocr
lotAfccn
5
pscwmhorfcfsmcal
6
co
ig. 20. Two-phase pressure factor vs. the stoichiometric flow ratio under dif-erent inlet humilities for a single channel (nk = 4).
The gas pressure gradient is linked to the gas velocity via thearcy’s law, namely
g = −K(1 − s)nk
μgLy
dpg
dY(54)
In view of the nitrogen content of ∼79% in air, we can safelyssume that the gas velocity remains nearly constant along thehannel, equal to the inlet value, ug ≈ uin,c. Indeed, Wang andang [45] numerically showed that variation of the gas phase
elocity is small (<5%) in common PEFC operation. Thus, Eq.54) can be rearranged to:
dpg
dY= −IavAmem
4F
1
CO2Axz
μgLy
K
ξc
(1 − s)nk(55)
If a dimensionless pressure is defined as
P | = |pg|(IavAmem/4F )(1/CO2Axz)(μgLy/K)
(56)
ne obtains that
P | = ξc
∫ 1
0
1
(1 − s(Y,ξc,RHin))nkdY = |P(ξc)| (57)
Eq. (57) shows that the dimensionless pressure drop is onlyfunction of the air stoichiometry ξc and inlet humidity, RH. In
he single-phase regime, Eq. (57) is reduced to:
P1φ| = ξc (58)
Thus, a two-phase pressure factor, Φ, can be defined as
= |P ||P1φ| =
∫ 1
0
1
[1 − s(Y, ξc, RHin)]nkdY (59)
Eq. (59) indicates that the two-phase pressure factor dependsnly on the air stoichiometry and inlet RH. Fig. 20 shows the
nalytical result of the two-phase pressure factor as a functionf stoichiometric ratio for different inlet dew points or RHs. Itan be seen that at low-stoichiometric ratios or low-channel flowates, the two-phase pressure factor is greater than unity due tostvs
Fig. 21. Experimental validation of the channel two-phase model.
iquid water presence. As the flow rate increases, the occurrencef two-phase flow shifts more towards the downstream and hencehe two-phase pressure factor is lower and approaches unity.lso, Eq. (59) clearly indicates that the exponent, nk, is a key
actor determining the two-phase pressure factor. Therefore, onean measure the two-phase pressure drop across the fuel cellhannels in order to calibrate nk, as to be explained briefly in theext sub-section.
.4. Experimental validation
To experimentally validate the above-described channel two-hase model and to better understand the applicable range of nkpecifically for fuel cell channels, a seven-parallel-channel fuelell of 0.1 m long was designed and pressure drop measurementsere carried out. While experimental details have been docu-ented by Hussaini and Wang [55] and thus are not repeated
ere, the experimental data of two-phase pressure drop, selectedver a range of air stoichiometry and current density to be rep-esentative, are plotted in Fig. 21, after excluding any influencerom inlet and outlet manifolds. These average data for straighthannels can then be compared with the present model predictionor a single channel, as shown in Fig. 21. It is seen that there islight under-prediction using nk = 4. However, the experimental-odel agreement is good for both nk = 4.5 and 5.0. It can thus be
oncluded that the present channel two-phase model is reason-bly accurate and the exponent in the liquid permeability likelyies between 4.5 and 5.0.
. Conclusions
In this work, we have developed a two-phase model forhannel flow in a PEM fuel cell, based on the M2 formalism. The-retical analyses were performed to calculate the liquid water
aturation, onset location of two-phase flow, and species concen-rations along the channel. Dependence of these physical profilesital to cell performance on key operating parameters such as airtoichiometry and relative humidity is explored. An analytical
6 wer S
saadctuuflncfuctcpfit
A
ACDFIkkKLm
MnPRs
StTu
X
Gα
ε
κ
λ
ν
ξ
ρ
σ
τ
Φ
Saacegiklmos
R
[[[[[
[[[[[
[[
[[[[[
[
[[[
[[
[[
16 Y. Wang et al. / Journal of Po
olution was developed to express the liquid water saturations a function of the stoichiometric ratio, relative humility, andxial location. The model was further implemented for three-imensional numerical simulations of two-phase flow in a singlehannel. The results reveal that liquid water builds up quickly athe entrance region followed by a slow increase downstream,nder full-humidification inlet conditions. The predicted liq-id saturation reaches as high as 20%. Subsequently, two-phaseow in heterogeneous channels were theoretically analyzed andumerically simulated. Water trapping around the geometri-al heterogeneity was found. In addition, a two-phase pressureactor was defined which could help establish a fundamentalnderstanding of two-phase flow maldistribution in fuel cellhannels. Finally, preliminary validation of the present channelwo-phase model against experimental pressure drop data wasarried out, with good agreement. Future work is to validate theresent model against experimental liquid water saturation pro-les once they are available, as well as to integrate the channel
wo-phase model into a full cell model.
ppendix A. Nomenclature
area (m2)k molar concentration of species k (mol m−3)
mass diffusivity of species (m2 s−1)Faraday’s constant (96,487 C/equivalent)current density (A cm−2)thermal conductivity (W (m K)−1)
r relative permeabilitypermeability (m2)length (m)
f kl mass fraction of species k in liquid phase
molecular weight (kg mol−1)the direction normal to the surfacepressure (Pa)gas constant (8.134 J (mol K)−1)stoichiometry coefficient in electrochemical reactionor liquid saturationsource term in transport equationstime (s)temperature (K)
� velocity vector (m s−1)mole fraction
reek lettersnet water transport coefficient per protonporosityionic conductivity (S m−1)
k mobility of phase kkinematic viscosity (m2 s−1)stoichiometric flow ratio
density (kg m−3)surface tension (N m−1)tortuosity factortwo-phase pressure factor[[[[
ources 179 (2008) 603–617
uperscripts and subscriptsanode
v averagecathode
ff effective valuegas phase
n inletspeciesliquid phase
em membranestandard condition, 273.15 K and 101.3 kPa (1 atm)
at saturate value
eferences
[1] M.L. Perry, TF. Fuller, J. Electrochem. Soc. 149 (2002) S59–S67.[2] C.Y. Wang, Chem. Rev. 104 (2004) 4727–4765.[3] P. Costamagna, S. Srinivasan, J. Power Sources 102 (2001) 242–252.[4] P. Costamagna, S. Srinivasan, J. Power Sources 102 (2001) 253–269.[5] Z.H. Wang, C.Y. Wang, K.S. Chen, J. Power Sources 94 (2001) 40–50.[6] J.-H. Nam, M. Kaviany, Int. J. Heat Mass Transfer 46 (2003) 4595–4611.[7] U. Pasaogullari, C.Y. Wang, J. Electrochem. Soc. 151 (2004) A399–A406.[8] X.G. Yang, F.Y. Zhang, A. Lubawy, C.Y. Wang, Electrochem. Solid-State
Lett. 7 (2004) A408–A411.[9] F.Y. Zhang, X.G. Yang, C.Y. Wang, J. Electrochem. Soc. 153 (2006)
A225–A232.10] D. Natarajan, T.V. Nguyen, J. Electrochem Soc. 48 (12) (2001) 1324–1335.11] S. Mazumder, J.V. Cole, J. Electrochem. Soc. 150 (2003) A1510–A1517.12] A.Z. Weber, J. Newman, J. Electrochem. Soc. 152 (4) (2005) A679–A688.13] U. Pasaogullari, C.Y. Wang, J. Electrochem. Soc. 152 (2005) A380–A390.14] E. Birgersson, M. Noponen, M. Vynnycky, J. Electrochem. Soc. 152 (2005)
A1021–A1034.15] H. Meng, C.Y. Wang, J. Electrochem. Soc. 152 (2005) A1733–A1741.16] Y. Wang, C.Y. Wang, J. Electrochem. Soc. 153 (6) (2006) A1193–A1200.17] Y. Wang, C.Y. Wang, J. Electrochem. Soc. 154 (2007) B636–B643.18] K. Promislow, J. Stockie, B. Wetton, Proc. R. Soc. A 462 (2006) 789–816.19] T.V. Nguyen, W. He, in: W. Vielstich, H. Gasteiger, A. Lamm (Eds.), Hand-
book of Fuel Cells: Fundamentals, Technology and Applications, vol. 3,John Wiley & Sons, Ltd., 2003 (Chap. 28).
20] T.V. Nguyen, J. Electrochem. Soc. 143 (5) (1996) L103–L105.21] D.P. Wilkinson, O. Vanderleeden, in: W. Vielstich, H. Gasteiger, A. Lamm
(Eds.), Handbook of Fuel Cells: Fundamentals, Technology and Applica-tions, vol. 3, John Wiley & Sons, Ltd., 2003 (Chap. 27).
22] X. Li, I. Sabir, Int. J. Hydrogen Energy 30 (4) (2005) 359–371.23] Y. Wang, C.Y. Wang, J. Power Sources 147 (2005) 148–161.24] Y. Wang, C.Y. Wang, J. Power Sources 153 (2006) 130–135.25] Y. Wang, C.Y. Wang, K.S. Chen, Electrochim. Acta. 52 (2007) 3965–3975.26] A.S. Stubos, C. Satik, Y.C. Yortsos, Int. J. Heat Mass Transfer 36 (1993)
967–976.27] C.Y. Wang, M. Groll, S. Rosler, C.J. Tu, Heat Recov. Syst. CHP 14 (4)
(1994) 377–389.28] K.-K. Tio, C.Y. Liu, K.C. Toh, Heat Mass Transfer 36 (2000) 21–28.29] U. Imke, Chem. Eng. J. 101 (2004) 295–302.30] T. Henning, J.J. Brandner, K. Schubert, Microfluid Nanofluid 1 (2005)
128–136.31] D. Sugumar, K.K. Tio, J. Heat Transfer 128 (2) (2006) 198–202.32] M. Chaouche, N. Rakotomalala, D. Salin, Y.C. Yortsos, Europhys. Lett. 21
(1993) 19–24.33] D. Or, M. Tuller, Adv. Water Resour. 26 (2003) 883–898.34] W. Li, R.D. Vigil, I.A. Beresnev, P. Iassonov, R. Ewing, J. Colloid Interf.
Sci. 289 (2005) 193–199.35] J.D. Chen, J. Colloid Int. Sci. 109 (2) (1986) 341–349.36] H. Wong, S. Morris, C.J. Radke, J. Colloid Interf. Sci. 148 (1992) 317–336.37] C.Y. Wang, P. Cheng, Int. J. Heat Mass Transfer 39 (1996) 3607–3618.38] T. Benning, N. Djilali, J. Electrochem. Soc. 150 (2003) A1589–A1598.

wer S
[[[
[
[
[[[
[
[[[[
[
Y. Wang et al. / Journal of Po
39] A.T. Corey, Producers Monthly 19 (1) (1954) 38–41.40] A.E. Saez, R.G. Carbonell, AIChE J. 31 (1985) 52–62.41] R.B. Bird, W.E. Stewart, E.N. Lightfoot, Transport Phenomena, John Wiley
& Sons, New York, 1960.42] M. Mathias, J. Roth, J. Fleming, W. Lehnert, in: W. Vielstich, H. Gasteiger,
A. Lamm (Eds.), Handbook of Fuel Cells: Fundamentals, Technology andApplications, vol. 3, John Wiley & Sons, Ltd., 2003.
43] T.E. Springer, T.A. Zawodinski, S. Gottesfeld, J. Electrochem. Soc. 138
(1991) 2334–2341.44] F.Q. Liu, G.Q. Lu, C.Y. Wang, J. Membr. Sci. 287 (2007) 126–131.45] Y. Wang, C.Y. Wang, J. Electrochem. Soc. 152 (2005) A445–A453.46] S.V. Patankar, Numerical Heat Transfer and Fluid Flow, Hemisphere Pub-
lishing Corp., New York, 1980.
[[[
ources 179 (2008) 603–617 617
47] J. Benziger, E. Chia, E. Karnas, J. Moxley, C. Teuscher, I. Kevrekidis,AIChE J. 50 (2004) 1889–1900.
48] Y. Wang, C.Y. Wang, Electrochim. Acta 50 (2005) 1307–1315.49] Y. Wang, C.Y. Wang, Electrochim. Acta 51 (2006) 3924–3933.50] H. Meng, J. Power Sources 171 (2007) 738–746.51] Y. Wang, Analysis of transient phenomena in polymer electrolyte fuel cells,
PhD thesis, The Pennsylvania State University, 2006.52] L. Mao, C.Y. Wang, J. Electrochem. Soc. 154 (2007) B139–B146.
53] Y. Wang, J. Electrochem. Soc. 154 (2007) B1041–B1048.54] X.G. Yang, F.Y. Zhang, C.Y. Wang, private communications, 2005.55] I.S. Hussaini, C.Y. Wang, Visualization and quantification of cathode chan-nel flooding in PEM fuel cells, Penn State University ElectrochemicalEngine Center (ECEC), Report No. 2007-07 (2007).