modeling the time course of feature perception and feature information retrieval
TRANSCRIPT

Journal of
Journal of Memory and Language 55 (2006) 553–571
www.elsevier.com/locate/jml
Memory andLanguage
Modeling the time course of feature perception and featureinformation retrieval q
Christopher Kent *, Koen Lamberts
Department of Psychology, University of Warwick, Coventry CV4 7AL, UK
Received 24 March 2006; revision received 27 July 2006
Abstract
Three experiments investigated whether retrieval of information about different dimensions of a visual object variesas a function of the perceptual properties of those dimensions. The experiments involved two perception-based match-ing tasks and two retrieval-based matching tasks. A signal-to-respond methodology was used in all tasks. A stochasticfeature-sampling model was applied to the results from individual participants to estimate the speed of feature percep-tion and the speed of feature information retrieval. Generally, the speed at which dimensions were retrieved was linearlyrelated to the speed at which they were perceived. Features that were quickly perceived were also quickly retrieved. Thedata have implications for theories of perception and memory.� 2006 Elsevier Inc. All rights reserved.
Keywords: Perception; Memory; Object recognition; Response times; Matching
All memory experiments require a participant to per-ceive a set of stimuli and then, after a delay, performsome task with the information that they are able toretrieve about those stimuli. It is no surprise, therefore,that there is a large volume of work investigating theinteraction between the encoding of stimulus informa-tion and the subsequent retrieval of that information(for a recent review see Neath & Surprenant, 2005).However, given that both perception and retrieval donot occur instantaneously, there is surprisingly little sys-tematic research investigating the relationship betweenthe time course of perception and the time course ofretrieval. This is even more surprising given that large
0749-596X/$ - see front matter � 2006 Elsevier Inc. All rights reserv
doi:10.1016/j.jml.2006.08.010
q This research was supported by Biotechnology and Biolog-ical Sciences Research Council Grant BBS/B/08914.
* Corresponding author. Fax: +44 (0) 24 765 24225.E-mail address: [email protected] (C. Kent).
literatures on the time course of perception and on thetime course of retrieval have evolved independently ofeach other. In this article, we describe an approach thatallows investigators to measure both the speed at whichobject features are perceived and the speed at whichinformation about those features is retrieved from mem-ory. We report three experiments that used thisapproach, and investigate the relationship between thetime course of feature perception and the time courseof feature information retrieval.
The most convincing evidence of differential process-ing rates in both perception and retrieval comes fromstudies employing a signal-to-respond methodology.Signal-to-respond methodologies are designed to pro-vide information about the time course of processingby interrupting task execution after various time inter-vals (e.g., Dosher, 1976; Meyer, Irwin, Osman, & Koun-ios, 1988; Pachella, 1974; Reed, 1973, 1976; Wickelgren,1977). By plotting a measure of accuracy against
ed.
554 C. Kent, K. Lamberts / Journal of Memory and Language 55 (2006) 553–571
response–signal interval, the shape of the speed–accura-cy trade-off curve between take-off (the intercept, beforewhich time no useable information is gained) andasymptote (after which time there is no gain in perfor-mance for continued processing, and which is oftentaken to represent maximum discriminability in percep-tion and memory strength in retrieval) can be used toinform about the rate of information processing. In thisarticle, we are primarily concerned with differences inthe rates of information accumulation between differentdimensions of visually presented objects.
Although the time course of information retrieval hasbeen extensively studied (e.g., Atkinson & Juola, 1973;Burrows & Okada, 1975; Corbett, 1977; Dosher, 1976;Dosher & Rosedale, 1991; Gronlund & Ratcliff, 1989;Hintzman & Caulton, 1997; Hintzman & Curran,1994; McElree & Dosher, 1989, 1993; Morin, DeRosa,& Shultz, 1967; Mulligan & Hirshman, 1995; Ratcliff,1978; Ratcliff & McKoon, 1982; Ratcliff & Murdock,1976; Reed, 1973, 1976; Thomas, Milner, & Haberlandt,2003), there have been few studies directly investigatingthe differences in the time course of feature informationretrieval between different attributes of the same item.The majority of studies that have looked at within-itemretrieval differences have been designed to investigate thedifferences between the time courses of different retrievalprocesses (e.g., recognition and recall). Therefore, previ-ous studies have typically used stimuli (letters, words,and sentences) and procedures that are designed to relyon different retrieval mechanisms (e.g., Corbett, 1977;Dosher, 1984; Dosher & Rosedale, 1991; Hintzman &Caulton, 1997; Hintzman & Curran, 1994; McElree &Dosher, 1989, 1993; Ratcliff, 1981; Ratcliff & McKoon,1982, 1989). Generally, studies have found evidence fordifferent asymptotic levels of performance between theprocesses under study and differences in the rate andtake-off of retrieval, although differences in the temporaldynamics are less often reported (e.g., Corbett, 1977;Corbett & Wickelgren, 1978; Dosher, 1976; Hintzman& Caulton, 1997; Hintzman & Curran, 1994; McElree& Dosher, 1989, 1993; Mulligan & Hirshman, 1995).
In the visual domain, results from a variety of percep-tual processing tasks have demonstrated that differentvisual features are processed at different speeds. Forexample, when participants are asked, under signal-to-respond conditions, to make identity judgments of real-istic objects, it is clear that some dimensions enter thedecision process faster than other dimensions. This find-ing has been observed in categorization tasks (e.g., Lam-berts, 1995, 1998, 2000, 2002), in recognition tasks (e.g.,Brockdorff & Lamberts, 2000; Lamberts, Brockdorff, &Heit, 2002), and in perceptual matching tasks (e.g., Kent& Lamberts, 2006; Lamberts et al., 2002). In a differentapproach to the issue, Moutoussis and Zeki (1997a; seealso Bartels and Zeki, 1998, 2006) have demonstratedperceptual asynchrony between different visual features.
In a task, where the color and direction of motion of apattern of squares varied continuously, participantswere shown to reliably misbind color and direction ofmotion. Further, Moutoussis and Zeki (1997b) demon-strated that color is perceived before orientation, whichis perceived before motion.
In this article, we focus on differences in retrievalrates of features of visually presented objects. Weassume that a single process governs retrieval in thetasks that we used. We use the term ‘perception’ to referto the processes through which stimulus feature infor-mation is acquired from the environment, and we usethe term ‘retrieval’ to refer to the processes that makefeature information available from memory. Before,suggesting an approach to investigating within-itemretrieval rates based on the perceptual matching para-digm (e.g., Ratcliff, 1981), we first look at the similaritiesbetween encoding and retrieval, and develop the hypoth-esis that retrieval rates are related to perception rates.
At a physiological level, there is evidence that visualperception and visual memory involve shared neuralsubstrates (e.g., Slotnick, 2004; Ungerleider, 1995). Wemight expect, therefore, to observe close links betweenencoding and retrieval at a behavioral level. Becausememory representations are intimately linked with theprocedure through which they were encoded, the moreclosely the cue re-instantiates the original encoding con-text, the easier retrieval will be (e.g., Barsalou, 1999,2003; Kolers, 1973; Kolers & Roediger, 1984; Thomson& Tulving, 1970; Tulving, 1983). Therefore, we wouldexpect manipulations of the congruency between encod-ing and retrieval processes to affect response times andaccuracy.
Congruency effects have been reported in variousmemory tasks. Thomas et al. (2003; see also Andersand Lillyquist, 1971; Anderson, Bothell, Lebiere, andMatessa, 1998; Kahana and Caplan, 2002; Sternberg,1969) demonstrated an advantage in accuracy andRT for forward recall over backward recall of wordlists. Thomas et al. (2003) interpreted this finding asa congruency effect, by suggesting that retrieval ordermimics encoding order. In the forward (congruent)recall condition, items can be reported as they areretrieved, whereas backward recall requires a list tobe scanned multiple times. Reingold (2002; see alsoRay and Reingold, 2003) manipulated the visual con-gruency between study and test phases of an imagerecognition task. At study, participants viewed imageseither in a central mode or in a peripheral mode. Inthe central mode, images were viewed through a smallgaze-contingent window centered at fixation (with theperiphery blocked out). In the peripheral mode,participants could only view the image through theperiphery of their visual field. At test, recognitionwas more accurate when gaze mode was congruentbetween encoding and retrieval (central–central and

C. Kent, K. Lamberts / Journal of Memory and Language 55 (2006) 553–571 555
peripheral–peripheral), than for incongruent conditions(central–peripheral and peripheral–central).
The effects of the overlap between encoding andretrieval on retrieval accuracy and (most importantly)retrieval response times, raise challenging questionsabout the relation between the time course of perceptualencoding and the time course of subsequent retrieval.Overlap effects on response times will emerge if the timecourse of retrieval processes is somehow congruent withthe time course of perceptual processes at initial encod-ing [as suggested by Thomas et al. (2003)]. However, thecongruence relation between the time courses of thesetwo processes can still have many different forms. Astrong version of the congruence hypothesis may positcomplete concordance between the time course of per-ception and the time course of retrieval, with retrievalmechanisms essentially reinstating the original encodingprocesses. However, given the stochastic nature of bothperception and retrieval, such a strong link seems unlike-ly. A less extreme version of the congruence hypothesismay posit that the rates of retrieval and perception arerelated, with factors that affect perception rates of fea-tures also affecting rates of retrieval of informationabout those features. According to both hypotheses, fea-tures that are perceived quickly should also be retrievedquickly. In the experiments presented in this article, weattempted to obtain information about the relationshipbetween the speed at which features are perceived, andthe speed at which information about those features isretrieved.
One approach to measuring the relationship betweenperceptual processing rates and retrieval processing ratesis to investigate the temporal dynamics of perceptionand retrieval within an object matching framework. Ina perceptual matching task, participants are required tojudge, whether two concurrently presented objects arethe same or different. Because both objects are presentat the same time, features from both objects must be per-ceived, but there is minimal demand on memory andretrieval. In addition, two forms of the perceptualmatching tasks can be used. In a simultaneous perceptual
matching task, the two objects are presented with thesame onset. In a sequential perceptual matching task,one object is pre-exposed before the other object is pre-sented. If the first object is pre-exposed for long enough,then it can reasonably be assumed that the features ofthe first object have been perceptually processed.
Greater memory demands can be induced within thegeneral matching framework by varying the intervalbetween the presentations of the two objects. In adelayed matching task, the first object is presented andthen removed before the second object is presented.Because the objects are not present at the same time, fea-tures from the second object must be perceived andinformation about features from the first object mustbe retrieved (e.g., Ratcliff, 1981). We have previously
argued that delayed perceptual matching is a form ofperceptual recognition (Kent & Lamberts, 2006).
Both simultaneous and sequential perceptual match-ing tasks can be used to estimate perceptual processingrates, whereas delayed matching tasks can be used toestimate joint perception and retrieval rates. Thisapproach has been used in two previous studies. Lam-berts et al. (2002) carried out a series of four experi-ments, using color images of complex objects andscenes as stimuli. The first experiment involved simulta-neous presentation of pairs of stimuli. The participantsimply had to decide whether the stimuli were the sameor different, with unlimited time to respond. Three typesof stimuli were used: identical (all features matched),similar (one critical feature mismatched), and different
(all features mismatched). Using a median split on theRTs, the similar stimuli were divided up into fast stimu-lus pairs (where the mismatching feature was detectedquickly) and slow stimulus pairs (where the mismatchingfeature was detected slowly). The slow and fast pairswere used in three further signal-to-respond experi-ments, to test the hypothesis that perceptual and retriev-al rates would vary between the fast-similar and slow-similar pairs. In Experiments 2 and 3, simultaneousand sequential matching tasks were used to measurethe perceptual processing rates of the critical featuresin the fast and slow stimulus pairs. Experiment 4 useda recognition task to measure joint perception andretrieval rates. By fitting a formal model to the speed–ac-curacy trade-off data from Experiments 2 to 4, Lambertset al. (2002) were able to demonstrate that the criticalfeatures in the fast-similar pairs had faster perceptualprocessing rates and faster retrieval rates than the criti-cal features in the slow-similar pairs, supporting at leasta weak version of the congruence hypothesis.
However, Kent and Lamberts (2006) noted twopotential limitations of the method employed by Lam-berts et al. (2002). First, the feature structure of the com-plex stimuli was unknown, which meant that processingrates were estimated by averaging across a wide range ofdifferent features. This averaging process may haveintroduced artifacts into the estimates of the processingrates. Second, because the study phase contained manyitems, the estimates of retrieval rates may have been con-taminated by additional (but unexplained) processing,such as searching for the relevant stimulus among thetraining set. Kent and Lamberts addressed these criti-cisms by using stimuli with a known feature structure,and by using a delayed perceptual matching task insteadof a typical recognition task with many study items.
Kent and Lamberts (2006) used images of renderedobjects composed of three binary dimensions in fourperceptual matching tasks: simultaneous matching,sequential matching, unfilled-delayed matching, andfilled-delayed matching. The delayed matching tasksinvolved a 5 s gap between presentation and removal

556 C. Kent, K. Lamberts / Journal of Memory and Language 55 (2006) 553–571
of the first stimulus and presentation of the second stim-ulus. Thus, when the second stimulus was presented,information about the first stimulus had to be retrieved.In the unfilled-delayed matching task there was a blankscreen between presentation of the first and second stim-ulus. In the filled-delayed matching task, the participanthad to answer a simple mathematical question betweenpresentation of the first and second stimulus. It wasargued that the filled-delayed matching task wouldimpose greater retrieval demands (and hence slow theretrieval process) because the filler task impaired mainte-nance of the information about the first stimulus inmemory. Indeed, the formal modeling results supportedthis idea, with slower retrieval rates in the filled-delayedmatching task compared to the unfilled-delayed match-ing task. However, contrary to Lamberts et al. (2002),there was no demonstrable relationship between percep-tion rates and retrieval rates of individual features. Theperception rates varied between the different stimulusdimensions, but there was no evidence for any differenc-es in retrieval rates between dimensions.
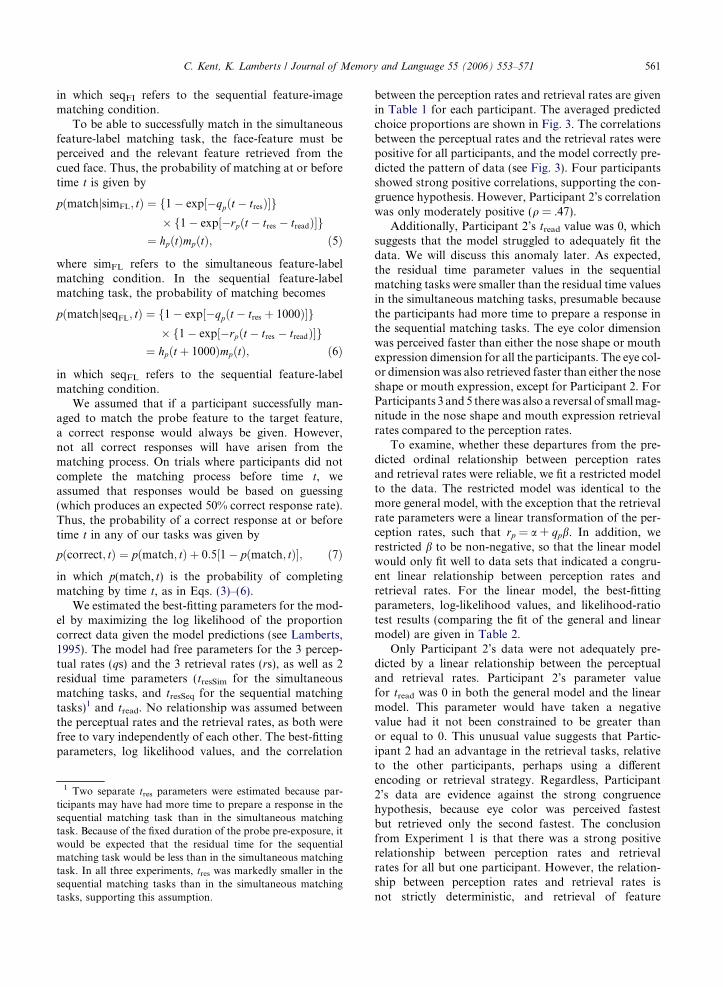
In the three experiments we report here, we attempt-ed to shed further light on these contradictory results, byusing a different methodology for the measurement offeature-information retrieval rates. In each experiment,the main stimuli were simple visual objects with threebinary dimensions. First, the participants were requiredto learn to associate a unique label (a non-word CVCstring) with each of the objects. The associations allowedus to present either the stimulus itself or the label asso-ciated with that stimulus in a matching task. We usedfour tasks to measure the perception rates and theretrieval rates (see Fig. 1). In all four tasks, participantswere required to judge whether a probe feature was thesame as the corresponding feature in the target stimulus.The probe was always an image containing a single fea-
+
Feedback
SI
RI + 500
500
100
1000
SI
F
500
1000
100
RI + 500
1000
500
100
+
Simultaneous Feature-Image
Sequential Feature-Image
Simultaneous Feature-Label
+
Fig. 1. Sequence of events in each of the four tasks. Numbers refer tostages. SI, signal interval; RI, response interval.
ture. A full image could not be used as the probe becauseparticipants may have retrieved the associated label andthus matched the stimuli based on their labels and notthe intended physical features. In the feature-imagematching tasks the target stimulus was one of the imagestimuli. In the feature-label matching tasks, only theCVC label that corresponded to a target stimulus waspresented. Using the label instead of an object meantthat the procedural differences between the perception-based tasks and retrieval-based tasks could be mini-mized, which represents a significant improvement overthe experiments in the previous two studies (Kent &Lamberts, 2006; Lamberts et al., 2002). In the simulta-neous matching tasks, the probe feature and target (orassociated CVC label) appeared at the same time. Inthe sequential matching tasks, the probe was presentedfirst before the target (or associated CVC label) was pre-sented. We used a signal-to-respond procedure in allfour tasks. Processing of the probe and target was inter-rupted at unpredictable time intervals from target onset(which in the simultaneous matching task coincided withprobe onset). We would expect accuracy to be higher inthe sequential tasks compared to the simultaneous task,because perceptual processing of the probe can startbefore the target is displayed. The data from the fea-ture-image matching tasks provide a measure of the timeit takes to perceive a feature. The data from the feature-label matching tasks provide an estimate of the joint per-ception and retrieval time of a feature. In order to esti-mate the rate at which participants perceived a featureand the rate at which participants retrieved informationabout a feature, we fitted a simple formal model to thespeed–accuracy data. If the congruence hypothesis iscorrect, there should be a systematic, positive relationbetween the perception rates and the retrieval rates ofobject features.
eedback
+
SI
RI + 500
500
100
1000
SI Feedback
Feedback 1000 RI + 500
1000
cav
cav
Sequential Feature-Label
the duration (in ms) of each stage. Arrows indicate the order of
C. Kent, K. Lamberts / Journal of Memory and Language 55 (2006) 553–571 557
Experiment 1
Method
Participants
Five postgraduate students (4 men and 1 woman,aged 23–34) from the University of Warwick participat-ed in return for £6 (approximately $10.50) per hour.
Materials and stimuli
Stimuli were presented on a 17-inch CRT monitorset to a resolution of 1280 · 1024 pixels at a refreshrate of 75 Hz. The viewing distance to the centre ofthe monitor was 1 m. Participants responded via aRazer Copperhead high-precision gaming mouse con-nected to the USB port of the Pentium 4 computerused to control the experiment. Assignment of leftand right mouse buttons to ‘‘same’’ and ‘‘different’’responses was counterbalanced across participants.The response signal was a 2120 Hz tone, 100 msin duration. Instructions and feedback appeared in24-point Arial font centered horizontally and verticallyon the monitor.
Image stimuli were schematic faces (see Fig. 2) com-posed of three binary dimensions: eye color (green orblue), nose shape (cross or triangle), and mouth expres-sion (smiling or sad). Each feature was combined withevery other combination of features to yield 8 face imag-es. The faces were pink circles, 175 pixels wide and 175pixels high (subtending approximately 2.64� of visualangle in each direction). The letter cues (labels) for eachface were three letter non-word CVCs: cav, dak, gan, laz,mas, paf, taj, and wab. The assignment of labels to thefaces was randomized for each participant. The labelswere displayed in white 48-point Arial font. The back-ground throughout the experiment remained a uniformgrey.
In the simultaneous and sequential matching tasks,the probe stimuli were single face-features, embeddedin the normal position within a face outline (seeFig. 1). The face-features were presented at the horizon-tal centre of the screen, and at least 37 pixels to the leftof the vertical centre. The labels and faces were present-ed at least 37 pixels to the right of the vertical centre ofthe screen and were positioned randomly 0–375 pixelsabove or below the horizontal centre of the screen.The vertical location was randomized to avoid cueingthe location of the relevant dimension in the face.
Design
There were two matching tasks (simultaneous match-ing and sequential matching) and two target stimulustypes (faces and labels). The tasks and target stimulustypes were combined to make four trial types. On eachtrial the participant was required to judge whether aface-feature was the same as the corresponding feature
in the target face image (feature-image matching) orcued face-image (feature-label matching). In the simulta-neous task, both the face-feature and the target face orlabel were presented at the same time. In the sequentialmatching task, the face-feature was shown first for1000 ms, after which the target face or label was present-ed. A response signal was given at one of four possiblesignal intervals. The signal intervals varied between thetarget types, because pilot data indicated that perfor-mance took longer to rise above chance level in the fea-ture-label matching task than in the feature-imagematching task. For the feature-image matching tasksthe signal intervals were 150, 250, 350, and 500 ms.For the feature-label matching tasks the signal intervalswere 300, 450, 600, and 750 ms. The start of the signalinterval was marked by the onset of the target face orlabel (in the simultaneous matching task, this onset coin-cided with the onset of the face-feature).
Blocks of feature-image matching and feature-labelmatching were presented in a randomized order. Alearning block was always run immediately before ablock of feature-label matching trials. Each learning ses-sion was terminated once the participant had successful-ly learnt the mapping between labels and faces (using acriterion of 3 consecutive blocks of 8 trials withouterror). Successful completion of the learning taskrequired that the participants retained informationabout all three dimensions for each stimulus. The simul-taneous matching and sequential matching trials weremixed within blocks.
Procedure
Before each learning session, the participants wereallowed to preview all 8 faces, with the correspondinglabels. A face appeared at the center of the screen withthe label below. Participants could cycle through the fac-es and labels by pressing the left mouse button. Presen-tation of faces and labels was randomized per block of 8presentations. The participants were allowed as muchtime to view each face and label and cycle through thefaces and labels as many times as they wanted. The par-ticipant could proceed to the learning stage at any timeby pressing the right mouse button.
In the learning stage, a label appeared at the top ofthe screen and the 8 faces appeared in a 4 · 2 array,centered on the vertical and horizontal midpoint ofthe display. Each face was centered in one of thearray cells (260 · 260 pixels). Each face was separatedfrom its neighbors by at least 84 pixels. The assign-ment of faces to array cells was randomized on eachtrial. Participants were required to left-click the facethat corresponded to the label. There was no timepressure on the participant to respond. Once theparticipant had selected a response, auditory correct/incorrect feedback was given. After the response, thecorrect face remained on screen with the label, while

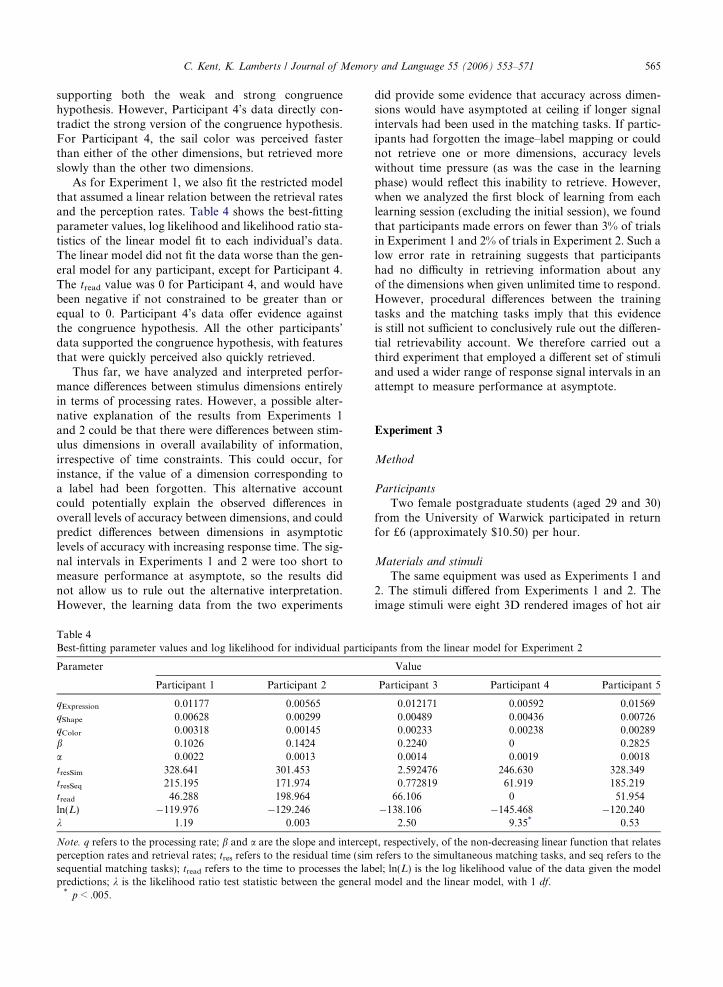
Fig. 2. Top row: two sample stimuli from Experiment 1, showing features along the three dimensions: eye color (blue or green), noseshape (cross or triangle), and mouth expression (happy or sad). Middle row: two sample stimuli from Experiment 2 showing featuresalong the three dimensions: sail color (blue or red stripe), flag orientation (0� or 45�), and porthole shape (circular or square). Bottomrow: two sample stimuli from Experiment 3 showing features along the three dimensions: balloon color (blue and white check or redand white check), rope orientation (vertical or diagonal), and gondola shape (cuboidal or cylindrical). (For interpretation of thereferences to color in this figure legend, the reader is referred to the web version of this paper).
558 C. Kent, K. Lamberts / Journal of Memory and Language 55 (2006) 553–571
the other faces disappeared. The participant couldthen study this screen for as long as he or she wanted,before clicking either mouse button to continue. Stim-ulus presentation was randomized per block of 8 tri-als. Once participants had correctly identified 3
successive blocks of 8 stimuli, they proceeded to a fea-ture-label matching block.
Each trial in the matching tasks started with asmall white fixation cross at the horizontal and verti-cal centre of the screen for 500 ms, followed by a
C. Kent, K. Lamberts / Journal of Memory and Language 55 (2006) 553–571 559
blank screen for 100 ms. On the simultaneous match-ing trials, both the face-feature and target face or labelwere presented after fixation. On the sequential match-ing trials the face-feature was displayed on screen for1000 ms, followed by the target face or label. In bothtasks, the participants were told to respond ‘‘same’’only if the face-feature matched the corresponding fea-ture in the target face (in feature-image matching) orthe face that corresponded to the label (in feature-la-bel matching). The participants were required torespond as soon as a response signal was detected.The screen went blank at the onset of the responsesignal. Participants were given timing feedback500 ms after they responded. ‘‘Too slow’’ appeared ifthey responded after 350 ms of response signal onsetand ‘‘Too fast’’ appeared if they responded beforethe onset of the response signal. Feedback remainedon screen for 1000 ms. There was an inter-trial intervalof 1000 ms in all tasks.
In total, each participant completed 3072 matchingtrials. Half of the trials (1536) were same and halfwere different. Half of the trials involved simultaneousmatching and half involved sequential matching. Halfof the trials involved feature-image matching and halfinvolved feature-label matching. A third of the trials(1024) involved matching the eye color dimension, athird the nose shape, and a third the mouthexpression.
Simultaneous Feature-Label
0.20
0.40
0.60
0.80
1.00
400 600 800 1000 1200
RT
Pro
port
ion
Cor
rect
Simultaneous Feature-Image
0.20
0.40
0.60
0.80
1.00
300 400 500 600 700 800
Pro
port
ion
Cor
rect
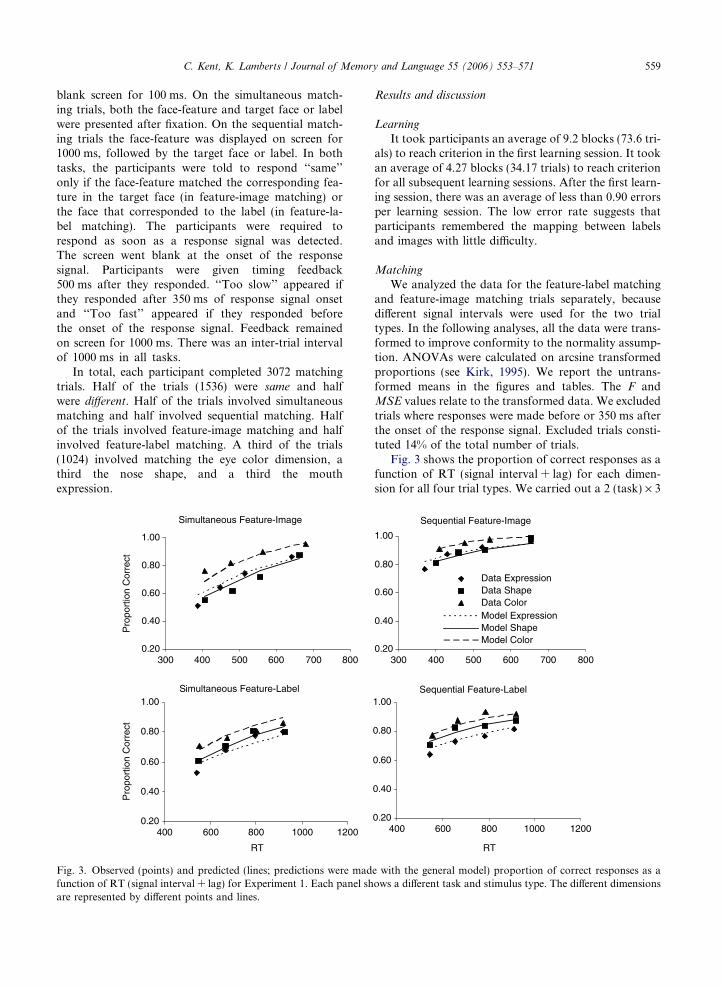
Fig. 3. Observed (points) and predicted (lines; predictions were madfunction of RT (signal interval + lag) for Experiment 1. Each panel share represented by different points and lines.
Results and discussion
Learning
It took participants an average of 9.2 blocks (73.6 tri-als) to reach criterion in the first learning session. It tookan average of 4.27 blocks (34.17 trials) to reach criterionfor all subsequent learning sessions. After the first learn-ing session, there was an average of less than 0.90 errorsper learning session. The low error rate suggests thatparticipants remembered the mapping between labelsand images with little difficulty.
Matching
We analyzed the data for the feature-label matchingand feature-image matching trials separately, becausedifferent signal intervals were used for the two trialtypes. In the following analyses, all the data were trans-formed to improve conformity to the normality assump-tion. ANOVAs were calculated on arcsine transformedproportions (see Kirk, 1995). We report the untrans-formed means in the figures and tables. The F andMSE values relate to the transformed data. We excludedtrials where responses were made before or 350 ms afterthe onset of the response signal. Excluded trials consti-tuted 14% of the total number of trials.
Fig. 3 shows the proportion of correct responses as afunction of RT (signal interval + lag) for each dimen-sion for all four trial types. We carried out a 2 (task) · 3
Sequential Feature-Label
0.20
0.40
0.60
0.80
1.00
400 600 800 1000 1200
RT
Sequential Feature-Image
0.20
0.40
0.60
0.80
1.00
300 400 500 600 700 800
Data ExpressionData ShapeData ColorModel ExpressionModel ShapeModel Color
e with the general model) proportion of correct responses as aows a different task and stimulus type. The different dimensions
560 C. Kent, K. Lamberts / Journal of Memory and Language 55 (2006) 553–571
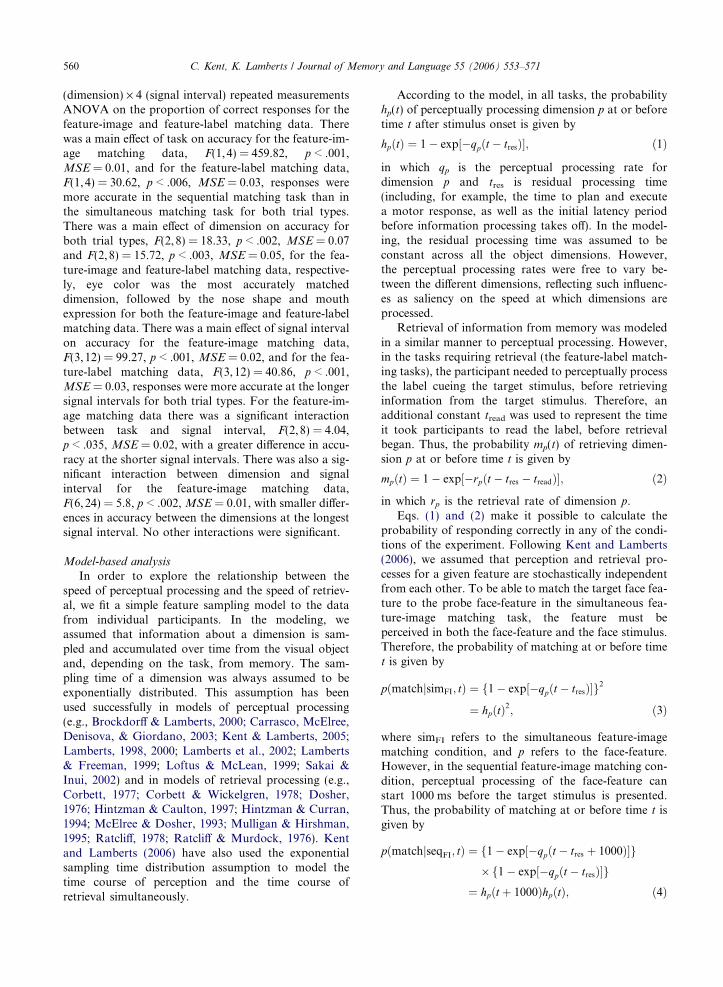
(dimension) · 4 (signal interval) repeated measurementsANOVA on the proportion of correct responses for thefeature-image and feature-label matching data. Therewas a main effect of task on accuracy for the feature-im-age matching data, F(1,4) = 459.82, p < .001,MSE = 0.01, and for the feature-label matching data,F(1,4) = 30.62, p < .006, MSE = 0.03, responses weremore accurate in the sequential matching task than inthe simultaneous matching task for both trial types.There was a main effect of dimension on accuracy forboth trial types, F(2,8) = 18.33, p < .002, MSE = 0.07and F(2,8) = 15.72, p < .003, MSE = 0.05, for the fea-ture-image and feature-label matching data, respective-ly, eye color was the most accurately matcheddimension, followed by the nose shape and mouthexpression for both the feature-image and feature-labelmatching data. There was a main effect of signal intervalon accuracy for the feature-image matching data,F(3,12) = 99.27, p < .001, MSE = 0.02, and for the fea-ture-label matching data, F(3,12) = 40.86, p < .001,MSE = 0.03, responses were more accurate at the longersignal intervals for both trial types. For the feature-im-age matching data there was a significant interactionbetween task and signal interval, F(2,8) = 4.04,p < .035, MSE = 0.02, with a greater difference in accu-racy at the shorter signal intervals. There was also a sig-nificant interaction between dimension and signalinterval for the feature-image matching data,F(6,24) = 5.8, p < .002, MSE = 0.01, with smaller differ-ences in accuracy between the dimensions at the longestsignal interval. No other interactions were significant.
Model-based analysis
In order to explore the relationship between thespeed of perceptual processing and the speed of retriev-al, we fit a simple feature sampling model to the datafrom individual participants. In the modeling, weassumed that information about a dimension is sam-pled and accumulated over time from the visual objectand, depending on the task, from memory. The sam-pling time of a dimension was always assumed to beexponentially distributed. This assumption has beenused successfully in models of perceptual processing(e.g., Brockdorff & Lamberts, 2000; Carrasco, McElree,Denisova, & Giordano, 2003; Kent & Lamberts, 2005;Lamberts, 1998, 2000; Lamberts et al., 2002; Lamberts& Freeman, 1999; Loftus & McLean, 1999; Sakai &Inui, 2002) and in models of retrieval processing (e.g.,Corbett, 1977; Corbett & Wickelgren, 1978; Dosher,1976; Hintzman & Caulton, 1997; Hintzman & Curran,1994; McElree & Dosher, 1993; Mulligan & Hirshman,1995; Ratcliff, 1978; Ratcliff & Murdock, 1976). Kentand Lamberts (2006) have also used the exponentialsampling time distribution assumption to model thetime course of perception and the time course ofretrieval simultaneously.
According to the model, in all tasks, the probabilityhp(t) of perceptually processing dimension p at or beforetime t after stimulus onset is given by
hpðtÞ ¼ 1� exp½�qpðt � tresÞ�; ð1Þ
in which qp is the perceptual processing rate fordimension p and tres is residual processing time(including, for example, the time to plan and executea motor response, as well as the initial latency periodbefore information processing takes off). In the model-ing, the residual processing time was assumed to beconstant across all the object dimensions. However,the perceptual processing rates were free to vary be-tween the different dimensions, reflecting such influenc-es as saliency on the speed at which dimensions areprocessed.
Retrieval of information from memory was modeledin a similar manner to perceptual processing. However,in the tasks requiring retrieval (the feature-label match-ing tasks), the participant needed to perceptually processthe label cueing the target stimulus, before retrievinginformation from the target stimulus. Therefore, anadditional constant tread was used to represent the timeit took participants to read the label, before retrievalbegan. Thus, the probability mp(t) of retrieving dimen-sion p at or before time t is given by
mpðtÞ ¼ 1� exp½�rpðt � tres � treadÞ�; ð2Þ
in which rp is the retrieval rate of dimension p.Eqs. (1) and (2) make it possible to calculate the
probability of responding correctly in any of the condi-tions of the experiment. Following Kent and Lamberts(2006), we assumed that perception and retrieval pro-cesses for a given feature are stochastically independentfrom each other. To be able to match the target face fea-ture to the probe face-feature in the simultaneous fea-ture-image matching task, the feature must beperceived in both the face-feature and the face stimulus.Therefore, the probability of matching at or before timet is given by
pðmatchjsimFI; tÞ ¼ f1� exp½�qpðt � tresÞ�g2
¼ hpðtÞ2; ð3Þ
where simFI refers to the simultaneous feature-imagematching condition, and p refers to the face-feature.However, in the sequential feature-image matching con-dition, perceptual processing of the face-feature canstart 1000 ms before the target stimulus is presented.Thus, the probability of matching at or before time t isgiven by
pðmatchjseqFI; tÞ ¼ f1� exp½�qpðt � tres þ 1000Þ�g� f1� exp½�qpðt � tresÞ�g
¼ hpðt þ 1000ÞhpðtÞ; ð4Þ
C. Kent, K. Lamberts / Journal of Memory and Language 55 (2006) 553–571 561
in which seqFI refers to the sequential feature-imagematching condition.
To be able to successfully match in the simultaneousfeature-label matching task, the face-feature must beperceived and the relevant feature retrieved from thecued face. Thus, the probability of matching at or beforetime t is given by
pðmatchjsimFL; tÞ ¼ f1� exp½�qpðt � tresÞ�g� f1� exp½�rpðt � tres � treadÞ�g
¼ hpðtÞmpðtÞ; ð5Þ
where simFL refers to the simultaneous feature-labelmatching condition. In the sequential feature-labelmatching task, the probability of matching becomes
pðmatchjseqFL; tÞ ¼ f1� exp½�qpðt � tres þ 1000Þ�g� f1� exp½�rpðt � tres � treadÞ�g
¼ hpðt þ 1000ÞmpðtÞ; ð6Þ
in which seqFL refers to the sequential feature-labelmatching condition.
We assumed that if a participant successfully man-aged to match the probe feature to the target feature,a correct response would always be given. However,not all correct responses will have arisen from thematching process. On trials where participants did notcomplete the matching process before time t, weassumed that responses would be based on guessing(which produces an expected 50% correct response rate).Thus, the probability of a correct response at or beforetime t in any of our tasks was given by
pðcorrect; tÞ ¼ pðmatch; tÞ þ 0:5½1� pðmatch; tÞ�; ð7Þ
in which p(match, t) is the probability of completingmatching by time t, as in Eqs. (3)–(6).
We estimated the best-fitting parameters for the mod-el by maximizing the log likelihood of the proportioncorrect data given the model predictions (see Lamberts,1995). The model had free parameters for the 3 percep-tual rates (qs) and the 3 retrieval rates (rs), as well as 2residual time parameters (tresSim for the simultaneousmatching tasks, and tresSeq for the sequential matchingtasks)1 and tread. No relationship was assumed betweenthe perceptual rates and the retrieval rates, as both werefree to vary independently of each other. The best-fittingparameters, log likelihood values, and the correlation
1 Two separate tres parameters were estimated because par-ticipants may have had more time to prepare a response in thesequential matching task than in the simultaneous matchingtask. Because of the fixed duration of the probe pre-exposure, itwould be expected that the residual time for the sequentialmatching task would be less than in the simultaneous matchingtask. In all three experiments, tres was markedly smaller in thesequential matching tasks than in the simultaneous matchingtasks, supporting this assumption.
between the perception rates and retrieval rates are givenin Table 1 for each participant. The averaged predictedchoice proportions are shown in Fig. 3. The correlationsbetween the perceptual rates and the retrieval rates werepositive for all participants, and the model correctly pre-dicted the pattern of data (see Fig. 3). Four participantsshowed strong positive correlations, supporting the con-gruence hypothesis. However, Participant 2’s correlationwas only moderately positive (q = .47).
Additionally, Participant 2’s tread value was 0, whichsuggests that the model struggled to adequately fit thedata. We will discuss this anomaly later. As expected,the residual time parameter values in the sequentialmatching tasks were smaller than the residual time valuesin the simultaneous matching tasks, presumable becausethe participants had more time to prepare a response inthe sequential matching tasks. The eye color dimensionwas perceived faster than either the nose shape or mouthexpression dimension for all the participants. The eye col-or dimension was also retrieved faster than either the noseshape or mouth expression, except for Participant 2. ForParticipants 3 and 5 there was also a reversal of small mag-nitude in the nose shape and mouth expression retrievalrates compared to the perception rates.
To examine, whether these departures from the pre-dicted ordinal relationship between perception ratesand retrieval rates were reliable, we fit a restricted modelto the data. The restricted model was identical to themore general model, with the exception that the retrievalrate parameters were a linear transformation of the per-ception rates, such that rp = a + qpb. In addition, werestricted b to be non-negative, so that the linear modelwould only fit well to data sets that indicated a congru-ent linear relationship between perception rates andretrieval rates. For the linear model, the best-fittingparameters, log-likelihood values, and likelihood-ratiotest results (comparing the fit of the general and linearmodel) are given in Table 2.
Only Participant 2’s data were not adequately pre-dicted by a linear relationship between the perceptualand retrieval rates. Participant 2’s parameter valuefor tread was 0 in both the general model and the linearmodel. This parameter would have taken a negativevalue had it not been constrained to be greater thanor equal to 0. This unusual value suggests that Partic-ipant 2 had an advantage in the retrieval tasks, relativeto the other participants, perhaps using a differentencoding or retrieval strategy. Regardless, Participant2’s data are evidence against the strong congruencehypothesis, because eye color was perceived fastestbut retrieved only the second fastest. The conclusionfrom Experiment 1 is that there was a strong positiverelationship between perception rates and retrievalrates for all but one participant. However, the relation-ship between perception rates and retrieval rates isnot strictly deterministic, and retrieval of feature

Table 2Best-fitting parameter values and log likelihood for individual participants from the linear model for Experiment 1
Parameter Value
Participant 1 Participant 2 Participant 3 Participant 4 Participant 5
qExpression 0.00341 0.00551 0.00505 0.00270 0.00749qShape 0.00392 0.00816 0.00396 0.00395 0.00639qColor 0.00597 0.00959 0.00794 0.00818 0.01489b 0.7961 0.7200 0.3745 0.22609 0.1271a �0.0008 �0.0016 0.0004 �0.0001 0.0025tresSim 285.478 293.811 299.584 263.681 349.589tresSeq 187.227 190.811 172.800 131.008 243.512tread 178.458 0 204.325 209.908 109.176ln(L) �114.907 �106.873 �121.669 �121.621 �119.981k 1.43 14.59* 2.87 0.17 1.94
Note. q refers to the processing rate; b and a are the slope and intercept, respectively, of the non-decreasing linear function that relatesperception rates and retrieval rates; tres refers to the residual time (sim refers to the simultaneous matching tasks, and seq refers to thesequential matching tasks); tread refers to the time to process the label; ln(L) is the log likelihood value of the data given the modelpredictions; k is the likelihood ratio test statistic between the general model and the linear model, with 1 df.
* p < .001.
Table 1Best-fitting parameter values, log likelihood, and perception–retrieval rate correlations for individual participants from the generalmodel for Experiment 1
Parameter Value
Participant 1 Participant 2 Participant 3 Participant 4 Participant 5
qExpression 0.00366 0.00602 0.00536 0.00272 0.00775qShape 0.00376 0.00731 0.00379 0.00389 0.00630qColor 0.00624 0.01213 0.00773 0.00821 0.01491rExpression 0.00174 0.00229 0.00196 0.00047 0.00324rShape 0.00253 0.00542 0.00210 0.00084 0.00381rColor 0.00382 0.00466 0.00351 0.00172 0.00462tresSim 292.176 304.165 298.133 263.562 350.168tresSeq 192.920 207.673 172.183 130.414 245.708tread 170.481 0 202.970 211.341 108.042ln(L) �114.191 �99.575 �120.232 �121.535 �119.009q .939 .471 .883 .996 .835
Note. q refers to the processing rate; r refers to the retrieval rate; tres refers to the residual time (sim refers to the simultaneous matchingtasks, and seq refers to the sequential matching tasks); tread refers to the time to process the label; ln(L) is the log likelihood value of thedata given the model predictions; q is the correlation between the perceptual rates (qs) and the retrieval rates (rs).
562 C. Kent, K. Lamberts / Journal of Memory and Language 55 (2006) 553–571
information can have a different time course from pre-vious feature perception.
Inspection of Fig. 3 demonstrates that there tended tobe relatively small differences in accuracy between themouth expression dimension and nose shape dimensionin the perceptual tasks, whereas there was a sizeable differ-ence in the estimated retrieval rates for these two dimen-sions. This finding suggests that there may be somequalitative differences, as well as quantitative differences,between the time course of perception and the time courseof retrieval for some participants (see Table 1). Althoughthe rates for the mouth and nose features may simply havebeen very close, an alternative explanation is that in theperceptual matching tasks, participants may have per-ceived the nose and mouth features as a single emergent
feature (e.g., Treisman & Paterson, 1984). Another possi-ble explanation is that perfect perceptual dependencyexisted between the nose and mouth features (e.g., Lam-berts & Freeman, 1999; Townsend, Hu, & Ashby,1980). Because both the nose shape and mouth expressioncan be construed as shape dimensions, emergence ordependency may have been induced.
In Experiment 2, we replicated the design of Exper-iment 1, but with different stimuli. The stimuli inExperiment 2 (images of sail boats) had featuresdefined by color, orientation, and shape (which alsowere the defining dimensions of the faces in Experiment1). However, the different appearance of the stimuli inExperiment 2 might produce differences in the timecourse of feature perception and retrieval. Therefore,

C. Kent, K. Lamberts / Journal of Memory and Language 55 (2006) 553–571 563
the primary purpose of Experiment 2 was to provide afurther, independent assessment of the relation betweenthe time course of perception and the time course ofretrieval.
Experiment 2
Method
Participants
Five female postgraduate students (aged 23–30) fromthe University of Warwick participated in return for £6(approximately $10.50) per hour.
Materials and Stimuli
The same materials were used as in Experiment 1.Only the stimuli differed from Experiment 1. The imagestimuli were eight 3D rendered sail boats that differedalong three binary dimensions: sail stripe color (red orblue); flag orientation (0� or 45�); and porthole shape(circular or square). Examples of two boat stimuli areshown in Fig. 2. The boats were 181 pixels (2.73 visualdegrees) high and 203 pixels (3.06 visual degrees) or222 pixels (3.35 visual degrees) wide for the 0� and 45�flag, respectively. All probe features were shown
Simultaneous Feature-Image
0.2
0.4
0.6
0.8
1
300 400 500 600 700 800
Pro
port
ion
Cor
rect
Simultaneous Feature-Label
0.2
0.4
0.6
0.8
1
400 600 800 1000 1200
RT
Pro
port
ion
Cor
rect
Fig. 4. Observed (points) and predicted (lines; predictions were madfunction of RT (signal interval + lag) for Experiment 2. Each panel share represented by different points and lines.
attached to the boat body. The same labels were usedas in Experiment 1.
Design and procedure
The design and procedure were identical to Experi-ment 1.
Results and discussion
Learning
It took an average of 10.8 blocks (86.4 trials) to reachcriterion in the first learning session. It took an averageof 4.27 blocks (34.18 trials) to reach criterion in allsubsequent sessions, with an average of 0.83 errors persession. Again, the low error rate suggests that partici-pants had little difficulty remembering the mappingbetween labels and images.
Matching
As in Experiment 1, we excluded trials with responsesthat were made 350 ms after the response signal orbefore the start of the response signal. Excluded trialsconstituted 12% of the total number of trials.
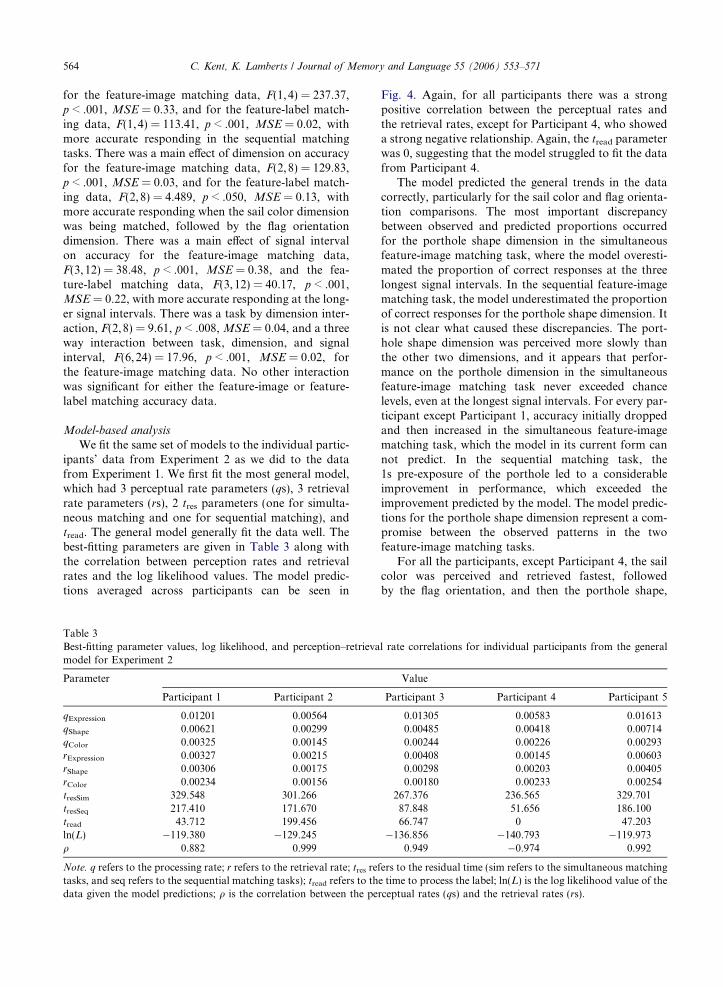
Fig. 4 shows the proportion of correct responses as afunction of RT for all four trial types. There was a maineffect of task (simultaneous or sequential) on accuracy
Sequential Feature-Image
0.2
0.4
0.6
0.8
1
300 400 500 600 700 800
Data Orientation
Data Shape
Data ColorModel Orientation
Model Shape
Model Color
Sequential Feature-Label
0.2
0.4
0.6
0.8
1
400 600 800 1000 1200
RT
e with the general model) proportion of correct responses as aows a different task and stimulus type. The different dimensions
564 C. Kent, K. Lamberts / Journal of Memory and Language 55 (2006) 553–571
for the feature-image matching data, F(1,4) = 237.37,p < .001, MSE = 0.33, and for the feature-label match-ing data, F(1,4) = 113.41, p < .001, MSE = 0.02, withmore accurate responding in the sequential matchingtasks. There was a main effect of dimension on accuracyfor the feature-image matching data, F(2,8) = 129.83,p < .001, MSE = 0.03, and for the feature-label match-ing data, F(2,8) = 4.489, p < .050, MSE = 0.13, withmore accurate responding when the sail color dimensionwas being matched, followed by the flag orientationdimension. There was a main effect of signal intervalon accuracy for the feature-image matching data,F(3,12) = 38.48, p < .001, MSE = 0.38, and the fea-ture-label matching data, F(3,12) = 40.17, p < .001,MSE = 0.22, with more accurate responding at the long-er signal intervals. There was a task by dimension inter-action, F(2,8) = 9.61, p < .008, MSE = 0.04, and a threeway interaction between task, dimension, and signalinterval, F(6,24) = 17.96, p < .001, MSE = 0.02, forthe feature-image matching data. No other interactionwas significant for either the feature-image or feature-label matching accuracy data.
Model-based analysis
We fit the same set of models to the individual partic-ipants’ data from Experiment 2 as we did to the datafrom Experiment 1. We first fit the most general model,which had 3 perceptual rate parameters (qs), 3 retrievalrate parameters (rs), 2 tres parameters (one for simulta-neous matching and one for sequential matching), andtread. The general model generally fit the data well. Thebest-fitting parameters are given in Table 3 along withthe correlation between perception rates and retrievalrates and the log likelihood values. The model predic-tions averaged across participants can be seen in
Table 3Best-fitting parameter values, log likelihood, and perception–retrievamodel for Experiment 2
Parameter
Participant 1 Participant 2
qExpression 0.01201 0.00564qShape 0.00621 0.00299qColor 0.00325 0.00145rExpression 0.00327 0.00215rShape 0.00306 0.00175rColor 0.00234 0.00156tresSim 329.548 301.266tresSeq 217.410 171.670tread 43.712 199.456ln(L) �119.380 �129.245q 0.882 0.999
Note. q refers to the processing rate; r refers to the retrieval rate; tres reftasks, and seq refers to the sequential matching tasks); tread refers to thdata given the model predictions; q is the correlation between the pe
Fig. 4. Again, for all participants there was a strongpositive correlation between the perceptual rates andthe retrieval rates, except for Participant 4, who showeda strong negative relationship. Again, the tread parameterwas 0, suggesting that the model struggled to fit the datafrom Participant 4.
The model predicted the general trends in the datacorrectly, particularly for the sail color and flag orienta-tion comparisons. The most important discrepancybetween observed and predicted proportions occurredfor the porthole shape dimension in the simultaneousfeature-image matching task, where the model overesti-mated the proportion of correct responses at the threelongest signal intervals. In the sequential feature-imagematching task, the model underestimated the proportionof correct responses for the porthole shape dimension. Itis not clear what caused these discrepancies. The port-hole shape dimension was perceived more slowly thanthe other two dimensions, and it appears that perfor-mance on the porthole dimension in the simultaneousfeature-image matching task never exceeded chancelevels, even at the longest signal intervals. For every par-ticipant except Participant 1, accuracy initially droppedand then increased in the simultaneous feature-imagematching task, which the model in its current form cannot predict. In the sequential matching task, the1s pre-exposure of the porthole led to a considerableimprovement in performance, which exceeded theimprovement predicted by the model. The model predic-tions for the porthole shape dimension represent a com-promise between the observed patterns in the twofeature-image matching tasks.
For all the participants, except Participant 4, the sailcolor was perceived and retrieved fastest, followedby the flag orientation, and then the porthole shape,
l rate correlations for individual participants from the general
Value
Participant 3 Participant 4 Participant 5
0.01305 0.00583 0.016130.00485 0.00418 0.007140.00244 0.00226 0.002930.00408 0.00145 0.006030.00298 0.00203 0.004050.00180 0.00233 0.00254
267.376 236.565 329.70187.848 51.656 186.10066.747 0 47.203
�136.856 �140.793 �119.9730.949 �0.974 0.992
ers to the residual time (sim refers to the simultaneous matchinge time to process the label; ln(L) is the log likelihood value of therceptual rates (qs) and the retrieval rates (rs).
C. Kent, K. Lamberts / Journal of Memory and Language 55 (2006) 553–571 565
supporting both the weak and strong congruencehypothesis. However, Participant 4’s data directly con-tradict the strong version of the congruence hypothesis.For Participant 4, the sail color was perceived fasterthan either of the other dimensions, but retrieved moreslowly than the other two dimensions.
As for Experiment 1, we also fit the restricted modelthat assumed a linear relation between the retrieval ratesand the perception rates. Table 4 shows the best-fittingparameter values, log likelihood and likelihood ratio sta-tistics of the linear model fit to each individual’s data.The linear model did not fit the data worse than the gen-eral model for any participant, except for Participant 4.The tread value was 0 for Participant 4, and would havebeen negative if not constrained to be greater than orequal to 0. Participant 4’s data offer evidence againstthe congruence hypothesis. All the other participants’data supported the congruence hypothesis, with featuresthat were quickly perceived also quickly retrieved.
Thus far, we have analyzed and interpreted perfor-mance differences between stimulus dimensions entirelyin terms of processing rates. However, a possible alter-native explanation of the results from Experiments 1and 2 could be that there were differences between stim-ulus dimensions in overall availability of information,irrespective of time constraints. This could occur, forinstance, if the value of a dimension corresponding toa label had been forgotten. This alternative accountcould potentially explain the observed differences inoverall levels of accuracy between dimensions, and couldpredict differences between dimensions in asymptoticlevels of accuracy with increasing response time. The sig-nal intervals in Experiments 1 and 2 were too short tomeasure performance at asymptote, so the results didnot allow us to rule out the alternative interpretation.However, the learning data from the two experiments
Table 4Best-fitting parameter values and log likelihood for individual partici
Parameter
Participant 1 Participant 2
qExpression 0.01177 0.00565qShape 0.00628 0.00299qColor 0.00318 0.00145b 0.1026 0.1424a 0.0022 0.0013tresSim 328.641 301.453tresSeq 215.195 171.974tread 46.288 198.964ln(L) �119.976 �129.246k 1.19 0.003
Note. q refers to the processing rate; b and a are the slope and intercepperception rates and retrieval rates; tres refers to the residual time (simsequential matching tasks); tread refers to the time to processes the labpredictions; k is the likelihood ratio test statistic between the general
* p < .005.
did provide some evidence that accuracy across dimen-sions would have asymptoted at ceiling if longer signalintervals had been used in the matching tasks. If partic-ipants had forgotten the image–label mapping or couldnot retrieve one or more dimensions, accuracy levelswithout time pressure (as was the case in the learningphase) would reflect this inability to retrieve. However,when we analyzed the first block of learning from eachlearning session (excluding the initial session), we foundthat participants made errors on fewer than 3% of trialsin Experiment 1 and 2% of trials in Experiment 2. Such alow error rate in retraining suggests that participantshad no difficulty in retrieving information about anyof the dimensions when given unlimited time to respond.However, procedural differences between the trainingtasks and the matching tasks imply that this evidenceis still not sufficient to conclusively rule out the differen-tial retrievability account. We therefore carried out athird experiment that employed a different set of stimuliand used a wider range of response signal intervals in anattempt to measure performance at asymptote.
Experiment 3
Method
Participants
Two female postgraduate students (aged 29 and 30)from the University of Warwick participated in returnfor £6 (approximately $10.50) per hour.
Materials and stimuli
The same equipment was used as Experiments 1 and2. The stimuli differed from Experiments 1 and 2. Theimage stimuli were eight 3D rendered images of hot air
pants from the linear model for Experiment 2
Value
Participant 3 Participant 4 Participant 5
0.012171 0.00592 0.015690.00489 0.00436 0.007260.00233 0.00238 0.002890.2240 0 0.28250.0014 0.0019 0.00182.592476 246.630 328.3490.772819 61.919 185.219
66.106 0 51.954�138.106 �145.468 �120.240
2.50 9.35* 0.53
t, respectively, of the non-decreasing linear function that relatesrefers to the simultaneous matching tasks, and seq refers to theel; ln(L) is the log likelihood value of the data given the modelmodel and the linear model, with 1 df.

566 C. Kent, K. Lamberts / Journal of Memory and Language 55 (2006) 553–571
balloons that differed along three binary dimensions:balloon check color (red or blue); rope orientation (ver-tical or angled); and gondola shape (cylindrical or cuboi-dal). Examples of 2 balloon stimuli are shown in Fig. 2.The balloons were 417 pixels high (approximately 5.92visual degrees) and 229 pixels wide (approximately3.25 visual degrees). All probes consisted of a single fea-ture (the other features were not visible in the probes).The same labels were used as in Experiment 1.
Design and procedure
The design and procedure were identical to Experi-ment 1, with the exception of an extra response signalcondition. The response intervals used were: 100, 200,400, 800, and 2000 ms in the feature-image matchingtasks and 200, 400, 800, 1500, and 3000 ms in the fea-ture-label matching task.
Results and discussion
Learning
Participant 1 needed 5 blocks (40 trials) and Partici-pant 2 needed 3 blocks (24 trials) to reach criterion in thefirst learning session. In all subsequent learning sessions,Participants 1 and 2 needed an average of 3.13 and 3blocks, respectively, to reach criterion, with an averageerror rate of less than 1% for both participants. Thisextremely low error rate suggests that participants hadno difficulty in remembering the mapping between labelsand images.
Matching
As in the previous two experiments, we excluded tri-als with responses that were made more than 350 msafter the onset of the response signal or before the startof the response signal. Excluded trials constituted 6% ofthe total number of trials for both participants.
Figs. 5 and 6 show the proportions of correctresponses for Participants 1 and 2, respectively. Bothparticipants’ data show very similar patterns, with accu-racy increasing as response interval increases and reach-ing an equal asymptote at the longest two intervals forall three dimensions. For both participants, the ballooncolor dimensions was most accurate, followed by thegondola shape dimension, with the rope orientationdimension showing the lowest levels of accuracy. Accu-racy was higher in the sequential matching tasks than inthe simultaneous matching tasks. The overall pattern ofdata is similar to the data from the previous two exper-iments, except that accuracy appears to have reachedasymptote at the longer response intervals employed inExperiment 3.
Model-based analysis
We again fit the general model with unconstrainedperception and retrieval rates to the data from both par-
ticipants. The model predictions are shown in Figs. 5and 6 for Participants 1 and 2, respectively. The best-fit-ting parameters, log likelihood, and correlation betweenthe perception rates and the retrieval rates are given inTable 5. The model fit well and reproduced all the maintrends in the data. There was a strong positive correla-tion between the perception rates and the retrieval ratesfor both participants, with the speed of perception andretrieval fastest for the balloon color, followed by gon-dola shape, and then rope orientation. As in Experi-ments 1 and 2, the residual time parameter was largerin the simultaneous matching tasks than in the sequen-tial matching tasks.
Next, we fit the linear model, which assumes that theretrieval rates are a linear transform of the perceptionrates, to both participants’ data. The best-fitting param-eters and log likelihood values are given in Table 6. Thelinear model did not fit significantly worse than the gen-eral model, v2(1) = 0.02, p > .2, and v2(1) = 0.53,p > .25, for Participants 1 and 2, respectively. Both par-ticipants’ data support the congruence hypothesis, withdimensions that were perceived quickly, also retrievedquickly.
The main aim of Experiment 3 was to rule out thepossibility that differences in retrievability, but not inretrieval speed, produced the observed differences in per-formance between dimensions in Experiments 1 and 2.Figs. 5 and 6 show apparently equal asymptotes for allthree dimensions. To confirm the visual interpretationwe fit a series of models with varying asymptote and rateparameters to both participants’ data. The first modelassumed that both rates and asymptotes varied betweenthe different dimensions. This model version was identi-cal to the general model used previously, except that wemultiplied the expression for retrieval probability mp(t)in Eq. (2) by a positive availability likelihood parameter,separately estimated for each dimension, such that theasymptote of the retrieval probability function over timefor a given dimension was equal to the value of theparameter for that dimension. This model fit the datafrom Participant 1 significantly better than thepreviously applied general model, ln(L) = �114.29,v2(3) = 35.656, p < .001. However, a restricted versionof this model with only a single asymptote parameter(which applied to all three dimensions) did not fit thedata worse than the version with three asymptotes,ln(L) = �114.854, v2(2) = 1.14, p > .5. Together, thesecomparisons indicate that one asymptote parameter isessential for explaining the data from Participant 1,but that it is not necessary to assume that the asymp-totes differed between dimensions. A further, criticalcomparison indicated that asymptote differences werealso not sufficient to explain the differences betweenthe dimensions. A model version with three asymptoteparameters (one for each dimension), but with only asingle retrieval rate parameter for all dimensions, fit

Simultaneous Feature-Image
0.4
0.6
0.8
1
0 500 1000 1500 2000 2500
Pro
port
ion
Cor
rect
Data Orientation
Data Shape
Data Color
Model Orientation
Model Shape
Model Color
Sequential Feature-Image
0.6
0.7
0.8
0.9
1
0 500 1000 1500 2000 2500
Pro
port
ion
Cor
rect
Simultaneous Feature-Label
0.4
0.6
0.8
1
0 500 1000 1500 2000 2500 3000 3500
Pro
port
ion
Cor
rect
Sequential Feature-Label
0.4
0.6
0.8
1
0 500 1000 1500 2000 2500 3000 3500
RT
Pro
port
ion
Cor
rect
Fig. 5. Observed (points) and predicted (lines; predictions were made with the general model) proportion of correct responses as afunction of RT (signal interval + lag) for Participant 1 in Experiment 3. Each panel shows a different task and stimulus type. Thedifferent dimensions are represented by different lines.
C. Kent, K. Lamberts / Journal of Memory and Language 55 (2006) 553–571 567

Simultaneous Feature-Image
0.4
0.6
0.8
1
0 500 1000 1500 2000 2500
Pro
port
ion
Cor
rect
Data Orientation
Data Shape
Data Color
Model Orientation
Model Shape
Model Color
Sequential Feature-Image
0.8
0.9
1
0 500 1000 1500 2000 2500
Pro
port
ion
Cor
rect
Simultaneous Feature-Label
0.4
0.6
0.8
1
0 500 1000 1500 2000 2500 3000 3500
Pro
port
ion
Cor
rect
Sequential Feature-Label
0.4
0.6
0.8
1
0 500 1000 1500 2000 2500 3000 3500
RT
Pro
port
ion
Cor
rect
Fig. 6. Observed (points) and predicted (lines; predictions were made with the general model) proportion of correct responses as afunction of RT (signal interval + lag) for Participant 2 in Experiment 3. Each panel shows a different task and stimulus type. Thedifferent dimensions are represented by different lines.
568 C. Kent, K. Lamberts / Journal of Memory and Language 55 (2006) 553–571

Table 5Best-fitting parameter values, log likelihood, and perception–retrieval rate correlations for both participants from the generalmodel for Experiment 3
Parameter Value
Participant 1 Participant 2
qExpression 0.01199 0.01859qShape 0.00851 0.01216qColor 0.00673 0.01119rExpression 0.00256 0.00701rShape 0.00216 0.00383rColor 0.00202 0.00243tresSim 304.039 319.562tresSeq 219.450 199.515tread 8.418 80.841ln(L) �132.118 �84.205q 0.997 0.983
Note. q refers to the processing rate; r refers to the retrieval rate;tres refers to the residual time (sim refers to the simultaneousmatching tasks, and seq refers to the sequential matching tasks);tread refers to the time to process the label; ln(L) is the loglikelihood value of the data given the model predictions; q is thecorrelation between the perceptual rates (qs) and the retrievalrates (rs).
Table 6Best-fitting parameter values, log likelihood for both partici-pants from the linear model for Experiment 3
Parameter Value
Participant 1 Participant 2
qExpression 0.01202 0.01804qShape 0.00848 0.01270qColor 0.00674 0.01078b 0.1019 0.6451a 0.0013 �0.0044tresSim 304.029 318.413tresSeq 219.448 198.784tread 8.417 82.454ln(L) �132.126 �84.468k 0.02 0.53
Note. q refers to the processing rate; b and a are the slope andintercept, respectively, of the non-decreasing linear functionthat relates perception rates and retrieval rates; tres refers to theresidual time (sim refers to the simultaneous matching tasks,and seq refers to the sequential matching tasks); tread refers tothe time to process the label; ln(L) is the log likelihood value ofthe data given the model predictions; k is the likelihood ratiotest statistic between the general model and the linear model,with 1 df.
C. Kent, K. Lamberts / Journal of Memory and Language 55 (2006) 553–571 569
the data, significantly worse than the model version withthree retrieval rates and three asymptotes,ln(L) = �119.71, v2(2) = 10.85, p < .005. The conclusionfrom the model applications to the data from Partici-pant 1 is, therefore, that an account in terms of feature
retrievability is not correct, and that the differencesbetween the dimensions reflect differences in processingrates.
We carried out additional model comparisons forParticipant 2 as well. For this participant, the threeadditional asymptote parameters did not yield a signif-icant improvement in the overall model fit,ln(L) = �81.93, v2(3) = 4.55, p > .20, which shows thatthere was no need to assume that asymptotic perfor-mance differed from 100% accuracy for this participant.A model version with a single retrieval rate but withthree asymptote parameters fit the data much worsethan the version with three retrieval rates and threeasymptotes, ln(L) = �95.154, v2(2) = 26.45, p < .001.An explanation of the results from Participant 2 interms of asymptote differences alone was thereforerejected. For both participants, the model comparisonsshow that the rate differences are the cause of the dif-ferent performance patterns across dimensions, and notdifferences in retrievability. This provides furthersupport for our interpretation of the results fromExperiments 1 and 2.
General discussion
The findings from all three experiments support theconclusion that the rate at which information isretrieved appears to be at least linearly related to therate at which information was encoded, with dimen-sions that are quickly perceived also being quicklyretrieved. Across the three experiments, the model thatassumed a linear relation between perception rates andretrieval rates could not be rejected for 10 out of the12 participants. However, in both Experiments 1 and2, there was one participant who demonstrated a nota-bly different pattern of rates between perception andretrieval. For Participant 2 in Experiment 1, the fastestperceived dimension was only the second fastestdimension retrieved. In Experiment 2, Participant 4showed a negative relationship between the perceptionrates and the retrieval rates. These two participantsprovide evidence against the strong version of the con-gruence hypothesis (retrieval processes reinstate encod-ing processes), but they do not necessarily invalidatethe weak congruence hypothesis. Although the weakcongruence hypothesis predicts a positive correlationbetween perception rates and retrieval rates, it doesallow the possibility that certain encoding or retrievalstrategies may also affect the ordering with whichinformation about features is retrieved.
The data from the three experiments support thefindings from Lamberts et al. (2002), who found evi-dence for a relationship between perception rates andretrieval rates using a different methodology. However,the findings from the three experiment disagree with

570 C. Kent, K. Lamberts / Journal of Memory and Language 55 (2006) 553–571
the results in Kent and Lamberts (2006), who failed tofind a relationship between the perception rates and theretrieval rates. We propose that the apparent inconsis-tency of these results is due to the different time scalesof retention in the different studies. Kent and Lamberts(2006) used a very short time scale, whereby partici-pants were required to hold and maintain informationabout a simple object for just 5 s. However, in the cur-rent experiments and in the relevant experiment inLamberts et al. (2002), the participants needed to holdand maintain information over a much longer timeinterval. If information is held and rehearsed in an eas-ily accessible temporary short-term store, any discrep-ancies between feature information retrieval rates maybe too small to detect. Information retrieval from a rel-atively long-term durable store (which is not beingactively rehearsed) may be more likely to reflect thetime course of perceptual processing, as differencesbetween retrieval rates become more apparent. Addi-tionally, future work will need to explore more specif-ically how feature information is encoded, and howdifferent kinds of representation may produce differentretrieval patterns. For example, is the correlationbetween perception rates and retrieval rates only pres-ent for visual stimuli, as we have demonstrated, or doesit also hold for stimuli that can only be encoded verbal-ly? Perhaps the two participants in Experiments 1 and2 who did not demonstrate a clear relationship betweenperceptual rates and retrieval rates, encoded the stimulidifferently to the other participants, possibly relying ona verbal encoding strategy. Representational form may,in turn, interact with the timescale of memory. Atshorter time scales, participants may prefer to use arote verbal rehearsal method, while at longer timeintervals a visual representation may serve better.
Our results have implications for formal theories ofmemory. If the congruence hypothesis (even in its weak-est form) is correct, as our data indicate, there is an intri-cate connection between the time course of informationstorage and the time course of subsequent retrieval. Thisimplies that a full understanding of retrieval processescannot be achieved without an understanding of the ini-tial stimulus encoding processes. Therefore, it may beimpossible to formulate a valid model of informationretrieval without specifying how stimulus properties thatare known to affect the time course of encoding (such asfeature saliency) also affect the time course of retrieval.Our experiments represent only a first step towards suchan account.
References
Anders, T. R., & Lillyquist, T. D. (1971). Retrieval time inforward and backward recall. Psychonomic Science, 22,205–206.
Anderson, J. R., Bothell, D., Lebiere, C., & Matessa, M. (1998).An integrated theory of list memory. Journal of Memory and
Language, 38, 341–380.Atkinson, R. C., & Juola, J. F. (1973). Factors influencing the
speed and accuracy of word recognition. In S. Kornblum(Ed.), Attention and Performance IV (pp. 583–612). NewYork: Academic Press.
Barsalou, L. W. (1999). Perceptual symbol systems. Behavioral
and Brain Sciences, 22, 577–660.Barsalou, L. W. (2003). Abstraction in perceptual symbol
systems. Philosophical Transactions of the Royal Society of
London Series B-Biological Sciences, 358, 1177–1187.Bartels, A., & Zeki, S. (1998). The theory of multistage
integration in the visual brain. Proceedings of the Royal
Society of London Series B-Biological Sciences, 265,2327–2332.
Bartels, A., & Zeki, S. (2006). The temporal order of bindingvisual attributes. Vision Research, 46, 2280–2286.
Brockdorff, N., & Lamberts, K. (2000). A feature-samplingaccount of the time course of old-new recognition judgment.Journal of Experimental Psychology: Learning, Memory, and
Cognition, 25, 77–102.Burrows, D., & Okada, R. (1975). Memory retrieval from long
and short lists. Science, 188, 1031–1033.Carrasco, M., McElree, B., Denisova, K., & Giordano, A. M.
(2003). Speed of visual processing increases with eccentric-ity. Nature Neuroscience, 6, 699–700.
Corbett, A. T. (1977). Retrieval dynamics for rote and visualimage mnemonics. Journal of Verbal Learning and Verbal
Behavior, 16, 233–246.Corbett, A. T., & Wickelgren, W. A. (1978). Semantic memory
retrieval: analysis by speed accuracy tradeoff functions.Quarterly Journal of Experimental Psychology, 30, 1–15.
Dosher, B. A. (1976). Retrieval of sentences from memory:speed–accuracy study. Cognitive Psychology, 8, 291–310.
Dosher, B. A. (1984). Discriminating pre-experimental (seman-tic) from learned (episodic) associations: a speed accuracystudy. Cognitive Psychology, 16, 519–555.
Dosher, B. A., & Rosedale, G. (1991). Judgments of semanticand episodic relatedness: common time-course and failureof segregation. Journal of Memory and Language, 30,125–160.
Gronlund, S. D., & Ratcliff, R. (1989). Time course of item andassociative information: implications for global memorymodels. Journal of Experimental Psychology: Learning,
Memory, and Cognition, 15, 846–858.Hintzman, D. L., & Caulton, D. A. (1997). Recognition
memory and modality judgments: a comparison ofretrieval dynamics. Journal of Memory and Language,
37, 1–23.Hintzman, D. L., & Curran, T. (1994). Retrieval dynamics of
recognition and frequency judgments: evidence for separateprocesses of familiarity and recall. Journal of Memory and
Language, 33, 1–18.Kahana, M. J., & Caplan, J. B. (2002). Associative asymmetry
in probed recall of serial lists. Memory & Cognition, 30,841–849.
Kent, C., & Lamberts, K. (2006). The time course of perceptionand retrieval in matching and recognition. Journal of
Experimental Psychology: Human Perception and Perfor-
mance, 32, 920–931.

C. Kent, K. Lamberts / Journal of Memory and Language 55 (2006) 553–571 571
Kent, C., & Lamberts, K. (2005). An exemplar account of thebow and set size effects in absolute identification. Journal of
Experimental Psychology: Learning, Memory, and Cogni-
tion, 31, 289–305.Kirk, R. E. (1995). Experimental design: Procedures for the
behavioral sciences. Pacific Grove, CA: Brooks/Cole.Kolers, P. A. (1973). Remembering operations. Memory &
Cognition, 1, 347–355.Kolers, P. A., & Roediger, H. L. III, (1984). Procedures of
mind. Journal of Verbal Learning and Verbal Behavior, 23,425–449.
Lamberts, K. (1995). Categorization under time pressure.Journal of Experimental Psychology: General, 124, 161–180.
Lamberts, K. (1998). The time course of categorization. Journal
of Experimental Psychology: Learning, Memory, and Cog-
nition, 24, 695–711.Lamberts, K. (2000). Information-accumulation theory of
speeded categorization. Psychological Review, 107, 227–260.Lamberts, K. (2002). Feature sampling in categorization and
recognition of objects. Quarterly Journal of Experimental
Psychology, 55A, 141–154.Lamberts, K., Brockdorff, N., & Heit, E. (2002). Perceptual
processes in matching and recognition of complex pictures.Journal of Experimental Psychology: Human Perception and
Performance, 28, 1176–1191.Lamberts, K., & Freeman, R. P. J. (1999). Building object
representations from parts: tests of a stochastic samplingmodel. Journal of Experimental Psychology: Human Per-
ception and Performance, 25, 904–926.Loftus, G. R., & McLean, J. (1999). A front end to a theory of
picture recognition. Psychonomic Bulletin & Review, 6,394–411.
McElree, B., & Dosher, B. A. (1989). Serial position and set sizein short-term-memory: the time course of recognition.Journal of Experimental Psychology—General, 118,346–373.
McElree, B., & Dosher, B. A. (1993). Serial retrieval-processesin the recovery of order information. Journal of Experimen-
tal Psychology: General, 122, 291–315.Meyer, D. E., Irwin, D. E., Osman, A. M., & Kounios, J.
(1988). The dynamics of cognition and action: mentalprocesses inferred from speed–accuracy decomposition.Psychological Review, 95, 183–237.
Morin, R., DeRosa, D., & Shultz, V. (1967). Recognitionmemory and reaction time. In A. F. Sanders (Ed.), Attention
and performance (pp. 298–305). Amsterdam: North-HollandPublishing Company.
Moutoussis, K., & Zeki, S. (1997a). A direct demonstration ofperceptual asynchrony in vision. Proceedings of the Royal
Society of London Series B-Biological Sciences, 264,393–399.
Moutoussis, K., & Zeki, S. (1997b). Functional segregation andtemporal hierarchy of the visual perceptive systems. Pro-
ceedings of the Royal Society of London Series B-Biological
Sciences, 264, 1407–1414.Mulligan, N., & Hirshman, E. (1995). Speed accuracy trade-offs
and the dual process model of recognition memory. Journal
of Memory and Language, 34, 1–18.
Neath, I., & Surprenant, A. M. (2005). Mechanisms of memory.In K. Lamberts & R. L. Goldstone (Eds.), Handbook of
cognition (pp. 221–238). London: Sage.Pachella, R. G. (1974). The interpretation of reaction time
information-processing research. In B. H. Kantowitz (Ed.),Human information processing: Tutorials in performance and
cognition. Hillsdale, NJ: Erlbaum.Ratcliff, R. (1978). A theory of memory retrieval. Psychological
Review, 85, 59–109.Ratcliff, R. (1981). A theory of order relations in perceptual
matching. Psychological Review, 88, 552–572.Ratcliff, R., & McKoon, G. (1982). Speed and accuracy in the
processing of false statements about semantic information.Journal of Experimental Psychology: Human Learning and
Memory, 8, 16–36.Ratcliff, R., & McKoon, G. (1989). Similarity information
versus relational information: differences in the time courseof retrieval. Cognitive Psychology, 21, 139–155.
Ratcliff, R., & Murdock, B. B. (1976). Retrieval processes inrecognition memory. Psychological Review, 83, 190–214.
Ray, C. A., & Reingold, E. M. (2003). Long-term perceptualspecificity effects in recognition memory: the transformedpictures paradigm. Canadian Journal of Experimental Psy-
chology, 57, 131–137.Reed, A. V. (1973). Speed–accuracy trade-off in recognition
memory. Science, 181, 574–576.Reed, A. V. (1976). List length and time course of recognition
in immediate memory. Memory & Cognition, 4, 16–30.Reingold, E. M. (2002). On the perceptual specificity of
memory representations. Memory, 10, 365–379.Sakai, K., & Inui, T. (2002). A feature-segmentation model of
short-term visual memory. Perception, 31, 579–589.Slotnick, S. D. (2004). Visual memory and visual perception
recruit common neural substrates. Behavioural and Cogni-
tive Neuroscience Reviews, 3, 207–221.Sternberg, S. (1969). Memory-scanning: mental processes
revealed by reaction-time experiments. American Scientist,
57, 421–457.Thomas, J. G., Milner, H. R., & Haberlandt, K. F. (2003).
Forward and backward recall: different response timepatterns, same retrieval order. Psychological Science, 14,169–174.
Thomson, D. M., & Tulving, E. (1970). Associative encodingand retrieval: weak and strong cues. Journal of Experimental
Psychology, 86, 255–262.Townsend, J. T., Hu, G. G., & Ashby, G. F. (1980). A test of
visual feature sampling independence with orthogonalstraight lines. Bulletin of the Psychonomic Society, 15,163–166.
Treisman, A., & Paterson, R. (1984). Emergent features,attention, and object perception. Journal of Experimental
Psychology: Human Perception and Performance, 10, 12–31.Tulving, E. (1983). Elements of episodic memory. New York:
Oxford University Press.Ungerleider, L. G. (1995). Functional brain imaging studies of
cortical mechanisms for memory. Science, 270, 769–775.Wickelgren, W. A. (1977). Speed–accuracy tradeoff and infor-
mation processing dynamics. Acta Psychologica, 41, 67–85.