modeling the impact of hospital logistics on quality of
TRANSCRIPT

Journal of Industrial Engineering and ManagementJIEM, 2020 – 13(2): 296-320 – Online ISSN: 2013-0953 – Print ISSN: 2013-8423
https://doi.org/10.3926/jiem.3143
Modeling the Impact of Hospital Logistics on Quality of Care and Patient Satisfaction: Results of a Survey
in Three Public Healthcare Facilities in Fez - Morocco
Youness Frichi , Fouad Jawab , Said Boutahari
Industrial Technologies and Services, High School of Technology, Sidi Mohamed Ben Abdellah University (Morocco)
[email protected], [email protected], [email protected]
Received: February 2020Accepted: March 2020
Abstract:
Purpose: The objective of this research is to examine the role of hospital logistics in improving quality ofcare and patient satisfaction. Thus, the paper focuses on modeling and evaluating the relationship betweenthese three constructs.
Design/methodology/approach: In the present study, hospital logistics was specified as a second-orderconstruct composed of five first-order constructs: physical accessibility, waiting time, consultation time, hospitalhotel services, and administrative procedures. A questionnaire was developed and administered face-to-face to384 hospitalized patients in three public healthcare facilities in Fez-Morocco. Collected data were processed andanalyzed deploying the PLS-SEM method and using SmartPLS3 software. Data analysis was carried out byconsidering two types of patient circuits according to the admission modes in the healthcare facility: UrgentPatients Circuit and Scheduled Patients Circuit. Thus, two PLS-SEM models were evaluated and validated.
Findings: Results highlighted the significant impact of hospital logistics on quality and satisfaction. Inparticular, the results of the two models showed that the most preponderant hospital logistics componentis physical accessibility which consists of the availability and accessibility of ambulances, medical andnursing staff, support and guidance staff, technical facilities and equipment, etc. Thus, hospital managersand health system stakeholders should pay particular attention to hospital logistics activities in general andspecifically to the physical accessibility to improve the quality of care and patient satisfaction.
Research limitations/implications: This study only included patients from three public healthcarefacilities in Fez-Morocco. Also, the model variables of hospital logistics construct are restricted and wereapplied in a specific context. Besides, the sample size was relatively reduced. Thus, results generalizationmight be limited. Further studies including more patients from other territories and including otherlogistics components are needed for large-scale validation of the proposed model.
Originality/value: The results of this study contribute to the scientific literature on hospital logistics andits role as a lever for quality of care and patient satisfaction.
Keywords: hospital logistics, quality of care, patient satisfaction, modeling, PLS-SEM, Morocco
To cite this article:
Frichi, Y., Jawab, F., & Boutahari, S. (2020). Modeling the impact of hospital logistics on quality of care andpatient satisfaction: Results of a survey in three public healthcare facilities in Fez - Morocco. Journal of IndustrialEngineering and Management, 13(2), 296-320. https://doi.org/10.3926/jiem.3143
-296-

Journal of Industrial Engineering and Management – https://doi.org/10.3926/jiem.3143
1. Introduction
In 2015, Member States of the United Nations adopted the seventeen Sustainable Development Goals (SDGs) tobe achieved by 2030. In particular, the SDG3 on health and well-being aims to improve the health status ofindividuals and promote access to quality care (United Nations, 2015). Morocco, as a member state of the UnitedNations, has implemented several health strategies, intending to provide quality and patient-centered healthcareservices. In this context, Moroccan healthcare facilities are required to constantly improve the quality of care andenhance patient satisfaction. In that respect, hospital managers often focus the improvement efforts onreorganizing medical activities and show little interest in hospital logistics activities (Jobin, Beaulieu & Boivin, 2004).This is because the primary goal of healthcare facilities is to provide care, therefore managers have historicallylooked at healthcare challenges through a clinical lens (Landry & Philippe, 2004). However, several scholars havesuggested looking at some of these challenges through the support services lens. They have highlighted the role ofhospital logistics in helping healthcare facilities respond to health system challenges. In particular, hospital logisticsis considered as a determining factor and lever for quality of care and patient satisfaction (Costin, 2010; Kriegel,Jehle, Dieck & Mallory, 2013; Kwon, Kim & Martin, 2016).
Hospital logistics is defined as a set of design, planning and execution activities that enable the purchase, inventorymanagement and replenishment of goods and services surrounding the provision of medical services to patients(Landry & Beaulieu, 2002). Studies agree that optimized hospital logistics enhances patient-centered care (Chow &Heaver, 1994; Villa, Barbieri & Lega, 2009). Indeed, some patient satisfaction studies have included logistics factorsin their surveys and concluded the significant impact of these factors on quality and satisfaction levels. However, tothe authors’ knowledge, there is no research on the evaluation of logistics factors on quality and satisfaction in anintegrated way (Frichi, Jawab & Boutahari, 2019b). Hence a lack of clear and comprehensive evidence base thatdecision-makers could rely on to monitor the health system. Determining the extent of the contribution of hospitallogistics to quality and patient’s level of satisfaction is quite interesting considering the bunch of valuableinformation it will generate. Thus, the objective of this paper is to examine and confirm the positive impact ofhospital logistics on quality of care and patient satisfaction.
The health system in Morocco is organized into two main sectors. The first is the public sector, made up of thehealthcare services of the Ministry of Health, defense department and local authorities. The second is the privatesector, which comprises the private for-profit sector, that includes hospital clinics, physicians’ offices, dental surgeryoffices, pharmacies, etc., and the private not-for-profit sector, which encompasses health facilities ofnon-governmental organizations, Mutuals and National Fund of Social Security, Moroccan Red Crescent, etc. Inthis article, the focus is on the public health sector, particularly the healthcare services of the Ministry of Health, asthey represent the bulk of the total healthcare offer, about 85% of the national hospital bed capacity (Bouhaddou,Bennani Othmani & Diouny, 2013).
The remainder of this paper is structured as follows. Section 2 reviewed the literature on quality of care and patientsatisfaction and their interactions with hospital logistics. It formulated the research hypotheses and the theoreticalresearch model. Section 3 detailed the methodology for hypotheses assessment and validation. It consisted of adescription of the healthcare facilities where the study was conducted, the participants included in the study, thequestionnaire development and data analysis. Section 4 provided the research results while describing the varioussteps of model validation. Section 5 interpreted and discusses the obtained results. The last section concluded thepaper and gave insights into future research.
2. Background2.1. Quality of Care and Patient Satisfaction
Definitions of quality of care (QC) have been the subject of several studies in the literature. However, there noexisting or likely consensus on a standardized definition (Nylenna, Bjertnaes, Saunes & Lindahl, 2015). TheAmerican National Academy of Medicine defined QC as the degree to which health services for individuals andpopulations increase the likelihood of desired health outcomes, and are consistent with current professional knowledge (Lohr &Schroeder, 1990). This definition underlined the clinical effectiveness of healthcare with the aim of improvingthe outcomes. These outcomes, according to Donabedian (2003), are the effects of healthcare on the population
-297-

Journal of Industrial Engineering and Management – https://doi.org/10.3926/jiem.3143
health status. Examples of healthcare outcomes are reduced mortality rates, restoration of function and survival,reduced hospital-acquired infections, improved patient satisfaction, etc. Furthermore, the QC should also reflectthe wishes of health system stakeholders (Frichi, Jawab & Boutahari, 2019c). On that point, some researchershave proposed to link QC to stakeholder satisfaction (Bautista & Tangsoc, 2016), and particularly to thesatisfaction of patients, as they are the most important stakeholder group in the health system (Frichi et al.,2019c; Symmank, Krause & Gurtner, 2015).
Patient satisfaction (PS) is an assessment that reflects the patient’s perceived differences between what is expectedand what is received during the care process (Mohd & Chakravarty, 2014). The measurement of PS is an essentialelement in the evaluation of QC (Derebe, Shiferaw & Ayalew, 2017; Más, Parra, Bermejo, Hidalgo & Calle, 2016).Indeed, the literature on the assessment of QC shows extensive use of PS measurement as an indicator of QC(Akachi & Kruk, 2017; Frosch, 2015). Thus, we hypothesize that:
H1: Quality of care (QC) influences positively patient satisfaction (PS).
The goal of PS studies and surveys is to understand its associated factors, whose improvement could contribute toenhancing the quality of the healthcare system (Park, Park, Kwon, Kang & Noh, 2016). Factors thought to beassociated with PS include patient demographics and health characteristics (Soufi, Belayachi, Himmich, Ahid, Soufi,Zekraoui et al., 2010; Verulava, Jorbenadze, Karimi, Dangadze & Barkalaia, 2018), healthcare workers attitude andbehavior (Fang, Liu & Fang, 2019), accessibility of care (Põlluste, Kallikorm, Meiesaar & Lember, 2012), waitingtime (Bleustein, Rothschild, Valen, Valaitis, Schweitzer & Jones, 2014), consultation time (Howie, Porter, Heaney &Hopton, 1991), administrative procedures (Mohamed & Azizan, 2015), hospital hotel services (Sevin, 2018; Suess& Mody, 2018), etc.
2.2. Hospital Logistics and its Interaction with QC and PS
Logistics is a rather diffuse function; it takes different forms that vary over time and context. In particular,hospital logistics (HL) has been defined in different ways in the literature. The French Association of SupplyChain and Logistics (ASLOG) defined HL as the management of the flow of patients, products, materials, services, and therelated information to ensure quality and safety at a defined level of performance and efficiency, from the provider to the patient and,as appropriate, to the final destination (Beaulieu, Bentahar & Benzidia, 2019). HL is concerned with the managementof flows to produce and deliver healthcare effectively. The HL includes a wide range of ancillary and supportactivities necessary in providing healthcare. It comprises planning and scheduling activities, purchase andreplenishment management, distribution of equipment and medical supplies to care units, patients and productstransportation, information system management, facilities maintenance, waste management, production activitiessuch as laundry, sterilization, and hospital kitchen, etc. (Beaulieu & Venne, 2018; Jawab, Frichi & Boutahari,2018).
Given its critical aspect in the provision of healthcare as well as its broad scope of intervention, HL is a researcharea that attracts researchers worldwide. In fact, the literature reviews of Moons, Waeyenbergh and Pintelon (2019),Volland, Fügener, Schoenfelder and Brunner (2017), and Narayana, Kumar Pati and Vrat (2014) highlighted theextent of studies conducted in the field of logistics in the health sector. Some of these studies argued that HL has acrucial role in improving QC and PS (Frichi, Jawab, Boutahari, Zehmed, Moufad et al., 2018; Landry & Philippe,2004; Melo, 2012). Melo (2012) considered that logistics activities impact significantly the quality of healthcareprovided. According to Landry and Philippe (2004), optimizing and reengineering healthcare logistics could bringnew sources of effectiveness and efficiencies both in logistical and clinical terms. HL aims at ensuring smoothphysical, information and financial flows, and reducing the waiting time by a timely provision of needed resourcesto meet demands of healthcare users as well as the healthcare system as a whole (Buntak, Kovačić & Martinčević,2019; Landry & Philippe, 2004). For instance, the unavailability of supplies may postpone a planned surgicalintervention and negatively impact the patient’s health. Logistics services enable the necessary production factors(caregivers, medicines, medical devices, etc.) to be available, functional and accessible as needed at the point of care(Kriegel et al., 2013).
Several factors associated with PS such as physical accessibility, waiting time, consultation time, hospital hotelservices, and administrative procedures are highly dependent on the effectiveness of logistics activities in hospitals
-298-

Journal of Industrial Engineering and Management – https://doi.org/10.3926/jiem.3143
(Azzi, Persona, Sgarbossa & Bonin, 2013; Costin, 2010; Frichi, Jawab & Boutahari, 2018). In the following weprovided the main interactions between HL on one hand and QC and PS on the other:
Physical accessibility of healthcare (PA): it refers to geographically accessible healthcare, provided in settings where thenecessary and adequate skills and resources are available and appropriate to medical needs (Munir, Hafeez, Rashid,Iqbal & Javed, 2019; WHO, 2006). It is about the physical ease with which patients receive healthcare services. Toattain favorable healthcare outcomes in terms of QC and PS, healthcare services should be combined withimprovements in PA (Munir et al., 2019). The PA includes access to healthcare facilities, which means theavailability of medical transportation and access to care within the healthcare facility, particularly in terms of theavailability of human resources (doctors, nurses, laboratory technicians, etc.) and materials (drugs, medical supplies,technical equipment, etc.). Thus, the ease of PA contributes to enhancing PS and QC (Derebe et al., 2017; Verulavaet al., 2018).
Waiting time (WT): is the time between the patient’s arrival at the hospital and the consultation (Assefa, Mosse &Hailemichael, Y., 2011). Some authors include in WT, post-consultation time when patients have to wait in orderto retrieve their medical record and physician’s note before leaving the healthcare facility (Johnson & Russell,2015). WT was considered as a dimension of PS and a critical component of QC (Bleustein et al., 2014). In mostPS studies, long WT has been found frustrating to patients and a predictor of patient dissatisfaction (Abu-Odah,Abu Salah, El-Khateeb & El-Nems, 2018; Hussain, Asif, Jameel & Hwang, 2019). WT can result from severalfactors, including delays in intervention planning, poor organization, unclear and complex administrativeprocedures, large patient flows, unavailable resources to meet medical needs, etc. (Bleustein et al., 2014; Derebeet al., 2017).
Consultation time (CT): is the time that caregivers spend with the patient (Assefa et al., 2011). It is considered tobe an important attribute of PS and QC. Long CT is associated with higher satisfaction (Bleustein et al.,2014). The CT can be shortened because caregivers spent a huge amount of their time managingadministrative and logistics activities, organizing care units and recording patients’ information, which reducesthe available time for consultations (Howie et al., 1991). Therefore, it is necessary to free caregivers from thesetime-consuming logistics and administrative activities so as to devote more time to patients (Landry &Beaulieu, 2013). Studies have estimated that a nurse spends between 30% and 34% of her time performinglogistics and administrative activities (Lerebours, Saltel, Béthune-volters, Nallet, Bourdat, Vesin-etterlen et al. ,2015). According to WHO, a rational division of tasks among health workers is an effective strategy forenhancing care accessibility and quality (WHO, 2012). For example, freeing caregivers from logistics activitieswould allow them to focus on their mission of providing healthcare and consequently giving more time topatients (Beaulieu, 2019).
Hospital hotel services (HHS): these cover the conditions under which patients are accommodated in hospitals,including catering, cleanliness, hotel comfort, etc. All of these conditions significantly affect the PS level(Chougrani & Ouhadji, 2014; Halsdorfer, Blasquez, Bensoussan, Gentile, Collado, Viton et al., 2011; Marama,Bayu, Merga & Binu, 2018). Thus, it is necessary to pay great attention to these hotel services. For instance, thecatering activity requires an adapted supply system to guarantee fresh meals, as well as better coordinationbetween the catering department and the health care teams to take into account the nutritional specificities ofeach patient. The cleaning activity is responsible for the cleanliness of the premises. It requires that cleaningarticles are available in the right quantities and at the right places, as well as appropriate management of hospitalwaste. The hospital laundry provides services such as the cleaning of linen, towels and staff uniforms, whichensures the comfort and hygiene to hospitalized patients. For this reason, well-adapted logistics circuits arerequired for the definition of clean and dirty linen storage areas, transportation, operation scheduling(disinfection, washing, rinsing, and drying) (WHO, 2008).
Administrative procedures (AP): they include administrative formalities and procedures relating to patient admission,medical treatment, and discharge processes. The clarity and simplicity of AP are fundamental to PS (Duggirala,Rajendran & Anantharaman, 2008; Mohamed & Azizan, 2015). In contrast, complex and repetitive AP have beenidentified as one of the main causes of waiting times (Ahmad, Khairatul & Farnaza, 2017). Information flows, inparticular, AP can be optimized and simplified through the use of hospital information systems, which have a
-299-

Journal of Industrial Engineering and Management – https://doi.org/10.3926/jiem.3143
decisive effect on information availability and reliability (Benamirouche, 2015). The use of information systemsallows the collection, sharing and use of patient data for better health care delivery (Parks, Wigand, BennaniOthmani, Serhier & Bouhaddou, 2019).
All of the above PS factors fall within the scope of HL. Based on these facts, our research hypotheses state that HLimpacts both PS and QC (Figure 1):
H2: Hospital logistics (HL) has a positive impact on quality of care (QC);
H3: Hospital logistics (HL) has a positive impact on patient satisfaction (PS).
Figure 1. Hypothetical model
The hypotheses of the model in Figure 1 were supported and consolidated in an exploratory qualitative study in theform of semi-structured interviews with healthcare professionals and patients in the Moroccan context (Frichi,Jawab & Boutahari, 2019a). The objective of the present study is to confirm empirically the hypothetical modelwith quantitative data.
In order to reduce the complexity of the model in Figure 1 and to test assumptions about the influence of HL onQC and PS, we modeled the variable HL as a second-order hierarchical reflective latent variable composed andmeasured by five first-order latent variables: PA, WT, CT, HHS and AP (Figure 2).
Figure 2. Theoretical model
The adopted method for hypotheses confirmation and validation is the Structural Equation Modelling (SEM),which tests statistically hypothetical correlation and causality relationships (Roussel & Wacheux, 2005). Thischoice is justified by the objective of this research, which is to prove the correlation between HL, QC, and PS.Indeed, SEM is appropriate for modeling relationship systems, where correlations are hypothesized between a setof independent variables and dependent variables. In particular, SEM is recommended when key concepts arecomplex, multi-faceted, and difficult to measure (Kline, 2011). Also, SEM has known a wide application in thehealth and logistics sectors (Frichi et al., 2019b). As an indication, in the health sector, we cite (Schmalbach &Avila, 2018; Al-Mhasnah, Salleh, Afthanorhan & Ghazali, 2018; Jang & Jang, 2017) and in the logistics sector(Moufad & Jawab, 2019; Errassafi, Abbar & Benabbou, 2019; De Carvalho, Kalid & Rodriguez, 2019).
-300-

Journal of Industrial Engineering and Management – https://doi.org/10.3926/jiem.3143
3. Methods3.1. Settings
This study was conducted in three public healthcare facilities in Fez-Morocco. These facilities account for almost allthe public hospital care supply in the city of Fez. The characteristics of these healthcare facilities are described inTable 1.
Healthcare facility Functional bedding capacity Population served
Prefectural Hospital 282 1 427 917
Regional Hospital 250 4 412 905
University Hospital 950 5 961 868
Table 1. Study sittings’ characteristics
3.2. Participants
The study participants are patients who had been hospitalized for at least 48 hours in one of the three healthcarefacilities listed in Table 1. Thus, only patients who had experienced the entire process of the healthcare serviceand its related logistics activities are included in the survey. On the other hand, were excluded patients who hadonly benefited from outpatient care, patients under 18 years of age, and patients with acute physical and mentaldisabilities. The questionnaire was administered face-to-face to patients who met the inclusion criteria during thedischarge process. The survey period was spread over 3 months from November 2019 to January 2020.
3.3. Questionnaire Development
The confirmation and validation of the theoretical model in Figure 1 consist of testing it with empirical data. Forthis reason, it is essential to have an instrument for measuring the model variables. To establish the measurementinstrument, we have drawn inspiration from the paradigm suggested by Churchill (1979). The first step of theparadigm is to generate a sample of items capable to measure the variables. Through literature research, 56 itemswere generated. The second step deals with content validity, which assesses the degree to which the generated itemscapture the research constructs and are suitable for use in a survey. This step was carried out in two focus groupsconducted sequentially. The first is made up of healthcare professionals from the Regional Hospital. It included thequality manager, the head of the medical affairs unit, the head of the nursing unit, and the head of the social careunit. The second focus group was organized with healthcare professionals of the Prefectural Hospital. It wascomposed of two nurses and a doctor. Focus groups participants were chosen based mainly on their experienceand availability. At the end of the two focus groups, some items were judged inadequate and therefore deleted, orpoorly formulated and therefore reformulated, while other items were grouped into a single item because theyreferred to similar aspects. On the other hand, some items were added by the participants.
It was noticed that some items are appropriate only for patients admitted through the emergency department, suchas ambulance availability, while other items are more appropriate for scheduled patients, such as appointmentdelays. Accordingly, we decided to consider two patient circuits: Urgent Patients Circuit (UPC) and ScheduledPatients Circuit (SPC). Thus, the questionnaire questions are adapted according to the circuit type. The final resultsof the selected items are presented in Table 2. Constructs of PA, WT, and AP for the UPC were measured usingitems PAE1 to PAE15, WT1 to WT5 and APE1 to APE4 respectively. Similarly, the same constructs for the SPCwere measured using items PAS1 to PAS12, WTS1 to WTS7 and APS1 to APS5. For the other model’s constructsCT, HHS, QC, and PS, they were measured by items CT1, CT2, HHS1 to HHS13, QC1 to QC4, and SP1 to SP5for both circuits UPC and SPC (Table 2).
The measurement scale adopted in this study is the Likert scale. Roussel and Wacheux (2005) recommended5-point scales when questionnaires are long (more than 60 items), and 7 or 9-point scales in the opposite case.Following these recommendations, we opted for a 7-point Likert scale ranging from “strongly agree (7)” to“strongly disagree (1)”.
-301-

Journal of Industrial Engineering and Management – https://doi.org/10.3926/jiem.3143
Variables Items Sources
PA
PAE1 PAS1 Time to reach the hospital (Derebe et al., 2017)
PAE2 PAS2 Hospital geographic location (Lobo, Duarte, Carvalho, Rodrigues, Monteiro & Alves, 2014)
PAE3 Ambulance access (Schmalbach & Avila, 2018)
PAE4 Adequate number of ambulances (Schmalbach & Avila, 2018)
PAE5 PAS3 Availability of adequate parking (Badri, Dodeen, Al Khaili & Abdulla, 2005)
PAE6 Ease of access to the emergency department Focus group results
PAE7 PAS4 Availability of support and guidance staff Focus group results
PAE8 PAS5 Lighting and clarity of patient lanes and passageways Focus group results
PAE9 PAS6 Signs and orientation panels (Lobo et al., 2014)
PAE10 PAS7 Ease of access for persons with disabilities Focus group results
PAE11 PAS8 Availability of qualified and specialized doctors and nurses
(Bautista & Tangsoc, 2016)
PAE12 PAS9 Availability and accessibility of technical equipment and facilities (Schmalbach & Avila, 2018)
PAE13 PAS10 Availability of prescribed drug (Marama et al., 2018)
PAE14 PAS11 Blood Availability (Duggirala et al., 2008)
PAE15 PAS12 Overall physical accessibility of care (Schmalbach & Avila, 2018)
WT
WTS1 Appointment delays (Dagger & Sweeney, 2007)
WTS2 Waiting time for registration (Nottingham, Johnson & Russell, 2018)
WTS3 Waiting time for medical consultation (Nottingham et al., 2018)
WT1 Waiting time in the emergency department Focus group results
WT2 WTS4 Waiting time for medical tests and radiological examinations
(Duggirala et al., 2008)
WT3 WTS5 Delays between discharge decision and effective discharge
(Soares, Marinho, Fernandes, Moreira Gonçalves, Camila-Dias, Gonçalves et al., 2015)
WT4 WTS6 Information about any delays (Nottingham et al., 2018)
WT5 WTS7 Overall assessment of waiting times (Derebe et al., 2017)
CT CT1 Amount of time the physicians spent with you (Verulava et al., 2018)
CT2 Amount of time the nursing staff spent with you (Duggirala et al., 2008)
HHS
HHS1 Cleanliness of waiting and consultation rooms (Assefa et al., 2011)
HHS2 Comfort of waiting and consultation rooms: air conditioning, availability of chairs, etc. (Abu-Odah et al., 2018)
HHS3 Availability of in-patient rooms and beds Focus group results
HHS4 Cleanliness of patient rooms (Marama et al., 2018)
HHS5 Patient rooms are well equipped: TV, shower, clean towels, pillows, etc.
Focus group results
HHS6 Comfort of the patients’ rooms: air conditioning, calm, beds in good repair, etc. (Dagger & Sweeney, 2007)
HHS7 Number of toilets and their accessibility Focus group results
-302-

Journal of Industrial Engineering and Management – https://doi.org/10.3926/jiem.3143
Variables Items Sources
HHS8 Cleanliness of toilets: availability of toilet paper, disinfectants, etc. (Marama et al., 2018)
HHS9 The smell in the hospital Focus group results
HHS10 Quality of meals (Halsdorfer et al., 2011)
HHS11 Quantity of meals Focus group results
HHS12 Freshness and hygiene of meals Focus group results
HHS13 Respect for meal delivery times Focus group results
AP
APS1 Ease of getting appointments (Verulava et al., 2018)
APE1 APS2 Clarity and ease of the admission administrative process
(Marama et al., 2018)
APE2 APS3 Clarity and ease of payment procedure (Badri et al., 2005)
APE3 APS4 Clarity and ease of discharge procedure (Dagger & Sweeney, 2007)
APE4 APS5 Overall hospital administrative procedure (Um & Lau, 2018)
QC
QC1 Excellence of care provided (Soares et al., 2015)
QC2 Extent to which the care provided is of high standards (Um & Lau, 2018)
QC3 Extent to which the quality of care at this hospitalis good in comparison with other hospitals
(Duggirala et al., 2008)
QC4 Overall quality of care (Schmalbach & Avila, 2018)
PS
PS1 Fulfillment of needs and expectations (Aljaberi, Juni, Al-Maqtari, Lye, Saeed, Al-Dubai et al., 2018)
PS2 Likelihood of recommending this hospital (Johnson & Russell, 2015)
PS3 Likelihood of choosing the same hospital (Badri, Attia & Ustadi, 2009)
PS4 Proximity of this hospital to an ideal hospital (Kashkoli, Zarei, Daneshkohan & Khodakarim, 2017)
PS5 Overall satisfaction (Aljaberi et al., 2018)
Table 2. Questionnaire items
3.4. Data Analysis
For the evaluation and validation of the proposed model, we used the SEM. There are two SEM approaches forestimating model parameters: PLS-SEM and CB-SEM. The PLS-SEM technique can be used in explanatory andpredictive research. It is suitable for complex models for which the theory is not sufficiently developed. Also,PLS-SEM does make no data distributional assumptions and can be used for a small sample size. As for the CB-SEMtechnique, it is used in explanatory research. It requires a normal data distribution and a large sample size (Hair, Hult,Ringle & Sarstedt, 2017). Schmalbach and Avila (2018) used the two approaches PLS-SEM and CB-SEM forvalidating their model on the evaluation of citizens’ satisfaction regarding healthcare services’ quality. The authorsvalidated the applicability of the two approaches to their research model. Nevertheless, they favored the PLS-SEMapproach, since it presented advantages over the CB-SEM approach, notably the flexibility in its application in thesocial science area, where data are usually not normally distributed, and the sample size is small. Hence, and followingthe recommendations of Hair et al. (2017), we opted for the PLS-SEM approach for the estimation of the modelparameters. The data collected through the survey were processed using SmartPLS3 software.
3.5. Sample
The sample size for this study was calculated based on the rule of thumb for PLS-SEM model estimationparameters proposed by Barclay, Higgins and Thompson (1995). The rule of thumb specified that the minimum
-303-

Journal of Industrial Engineering and Management – https://doi.org/10.3926/jiem.3143
sample size is 10 times the maximum number of manifest variables of any latent variable in the measurementmodel, and 10 times the maximum number of paths aiming at any latent variable.
In the UPC model, the latent variable with the largest number of manifest variables is the PA, which has 15manifest variables. For the SPC model, the largest number of manifest variables is 13 corresponding to the HHS.According to the rule of Barclay et al. (1995), a minimum of 150 participants for the first circuit and 130 for thesecond are required.
3.6. Ethical Approval
The conduct of this study in the above-mentioned hospitals was approved by the decision of the Fez-MeknesRegional Health Directorate No. 7579/SRHC/UGC3.
4. Results 4.1. Participants Characteristics
Four hundred thirty-seven patients were approached, 53 of them refused to participate because of a lack of time orunwillingness to take part in the study. Thus, 384 patients were included in the study, of which 242 (63%) werewomen and 142 (37%) men. The number of patients admitted through the emergency department was 235(61.20%) and 149 (38.80%) were scheduled patients. Most of the participants (45.57%) were young people between25 and 34 years of age. Residents of cities represented 61.20% of the respondents, those living in villages andremote areas represented 21.87% and 16.93% respectively. Nearly 50% of the surveyed population had a lowerlevel of education. 26% of surveyed patients were hospitalized in the Prefectural Hospital, 37.24% in the RegionalHospital and 36.72% in the University Hospital. In terms of monthly income, 45.31% earned less than 260 USD,24% had an income between 260 and 600 USD, and 17.54% between 600 and 1000 USD per month. As for thetype of medical coverage, 35.42% had RAMED assurance, 25.52% CNOPS, 14.06% CNSS, 3.65% other types, and21.35% had no coverage (Table 3).
Data normal distribution was checked by skewness and kurtosis tests. For normally distributed data, skewnessvalues should be between +1 and -1, and kurtosis values should be less than +1 (Hair et al., 2017). The applicationof these tests revealed that our data distribution was not normal.
Variable Type Frequency %
SexWomen 242 63.02
Men 142 36.98
Type of admissionEmergency department 235 61.20
Scheduled patient 149 38.80
Age (year)
[18 – 24] 82 21.35
[25 – 34] 175 45.57
[35 – 44] 68 17.70
[45 – 59] 33 8.59
Above 60 26 6.77
Residence area
City 235 61.20
Village 84 21.87
Remote region 65 16.93
Leve of education
Primary 191 49.74
Secondary 98 25.52
Bac and Bac+5 60 15.62
bac+5 and above 35 9.11
-304-

Journal of Industrial Engineering and Management – https://doi.org/10.3926/jiem.3143
Variable Type Frequency %
Income (USD)
Less than 260 174 45.31
[260 – 600] 92 23.96
]600 – 1000] 67 17.45
]1000 – 1500] 39 10.15
Above 1500 12 3.12
Healthcare facility
Prefectural hospital 100 26.04
Regional hospital 143 37.24
University hospital 141 36.72
Healthcare coverage
RAMED 136 35.42
CNOPS 98 25.52
CNSS 54 14.06
Other 14 3.65
None 82 21.35
Table 3. Participants’ socio-demographic characteristics
4.2. Model Assessment and Validation
As indicated earlier, we distinguished between two types of patient circuits depending on the admission type. Thus,we have considered two models: the UPC model and the SPC model. The two models were evaluated separatelyfollowing guidelines and criteria recommended by Hair, Risher, Sarstedt and Ringle (2019).
4.2.1. Measurement Model
The assessment of the measurement model with reflective indicators consisted of checking indicators reliability,internal consistency reliability, convergent validity, and discriminant validity (Sarstedt & Cheah, 2019).
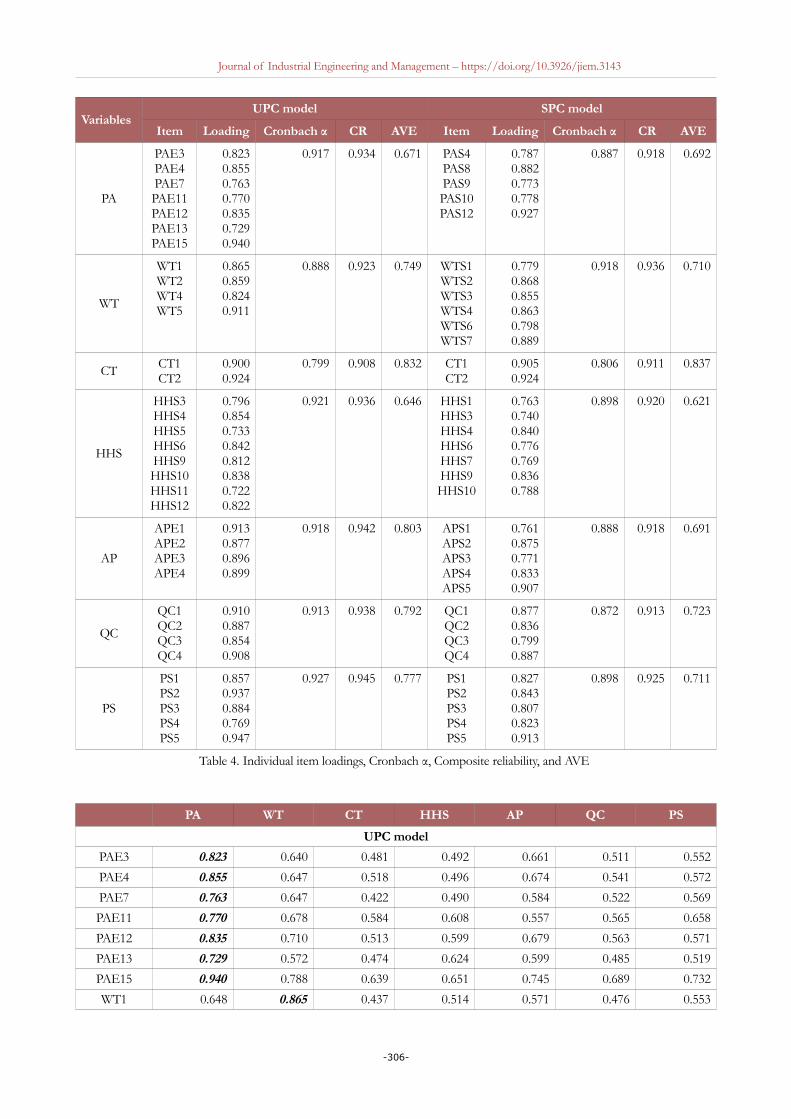
Indicators reliability: The first step in evaluating the measurement model is to check the reliability of eachmanifest variable by examining its factor loading in the latent variable. It is recommended that only items withfactor loadings greater than 0.708 be retained (Hair et al., 2019). Therefore, in the UPC model, 8 items of thelatent variable PA and 5 items of the variable HHS, as well as one item of the variable WT, were eliminated.Similarly, in the SPC model, 7 items of the variable PA, 6 items of the variable HHS and one item of thevariable WT were removed, because their loadings were lower than 0.708. Also, these items did not showsignificant factorial contributions with any of the other latent variables. Furthermore, it was observed that theelimination of these items increased the Average Variance Extracted (AVE) values. Retained items arereported in Table 4.
Internal consistency reliability: constructs internal consistency was assessed using Cronbach’s alpha and compositereliability (CR). Higher values of Cronbach’s alpha and CR, above 0.7 or 0.8, generally indicate a high level ofreliability (Meena & Sarmah, 2012), but they should not be greater than the limit of 0.95 as recommended by Hairet al. (2017). The results of Cronbach’s alpha and CR are satisfactory (Table 4).
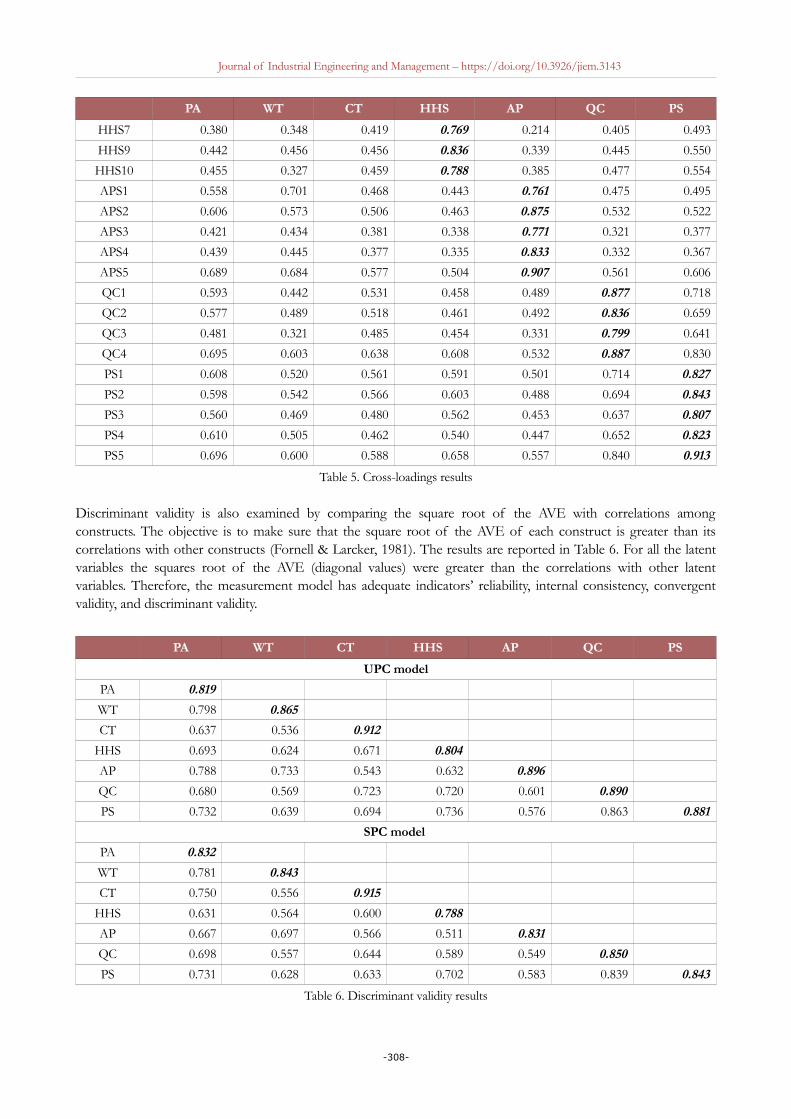
Convergent and discriminant validity: the convergent validity of each bloc of items was examined using the AVEvalues, which must be greater than 0.5 (Table 4). Discriminant validity indicates the extent to which a construct isdifferent from all the model other constructs (Raposo, Alves & Duarte, 2009). It was evaluated by establishingthe cross-loadings matrix, which consists of checking that the loading of each indicator in its latent variable isgreater than all its loadings in the other latent variables of the model (Hair et al., 2017). Cross-loadings results aregiven in Table 5. All indicators did not show higher loadings in any other latent variable than in the one theyintended to measure.
-305-
Journal of Industrial Engineering and Management – https://doi.org/10.3926/jiem.3143
VariablesUPC model SPC model
Item Loading Cronbach α CR AVE Item Loading Cronbach α CR AVE
PA
PAE3PAE4PAE7PAE11PAE12PAE13PAE15
0.8230.8550.7630.7700.8350.7290.940
0.917 0.934 0.671 PAS4PAS8PAS9PAS10PAS12
0.7870.8820.7730.7780.927
0.887 0.918 0.692
WT
WT1WT2WT4WT5
0.8650.8590.8240.911
0.888 0.923 0.749 WTS1WTS2WTS3WTS4WTS6WTS7
0.7790.8680.8550.8630.7980.889
0.918 0.936 0.710
CT CT1CT2
0.9000.924
0.799 0.908 0.832 CT1CT2
0.9050.924
0.806 0.911 0.837
HHS
HHS3HHS4HHS5HHS6HHS9HHS10HHS11HHS12
0.7960.8540.7330.8420.8120.8380.7220.822
0.921 0.936 0.646 HHS1HHS3HHS4HHS6HHS7HHS9HHS10
0.7630.7400.8400.7760.7690.8360.788
0.898 0.920 0.621
AP
APE1APE2APE3APE4
0.9130.8770.8960.899
0.918 0.942 0.803 APS1APS2APS3APS4APS5
0.7610.8750.7710.8330.907
0.888 0.918 0.691
QC
QC1QC2QC3QC4
0.9100.8870.8540.908
0.913 0.938 0.792 QC1QC2QC3QC4
0.8770.8360.7990.887
0.872 0.913 0.723
PS
PS1PS2PS3PS4PS5
0.8570.9370.8840.7690.947
0.927 0.945 0.777 PS1PS2PS3PS4PS5
0.8270.8430.8070.8230.913
0.898 0.925 0.711
Table 4. Individual item loadings, Cronbach α, Composite reliability, and AVE
PA WT CT HHS AP QC PS
UPC model
PAE3 0.823 0.640 0.481 0.492 0.661 0.511 0.552
PAE4 0.855 0.647 0.518 0.496 0.674 0.541 0.572
PAE7 0.763 0.647 0.422 0.490 0.584 0.522 0.569
PAE11 0.770 0.678 0.584 0.608 0.557 0.565 0.658
PAE12 0.835 0.710 0.513 0.599 0.679 0.563 0.571
PAE13 0.729 0.572 0.474 0.624 0.599 0.485 0.519
PAE15 0.940 0.788 0.639 0.651 0.745 0.689 0.732
WT1 0.648 0.865 0.437 0.514 0.571 0.476 0.553
-306-

Journal of Industrial Engineering and Management – https://doi.org/10.3926/jiem.3143
PA WT CT HHS AP QC PS
WT2 0.741 0.859 0.520 0.588 0.694 0.490 0.547
WT4 0.656 0.824 0.409 0.501 0.612 0.466 0.503
WT5 0.783 0.911 0.482 0.552 0.655 0.535 0.606
CT1 0.517 0.440 0.900 0.602 0.448 0.674 0.617
CT2 0.639 0.533 0.924 0.621 0.538 0.648 0.648
HHS3 0.617 0.590 0.534 0.796 0.559 0.549 0.590
HHS4 0.570 0.506 0.630 0.854 0.475 0.637 0.634
HHS5 0.487 0.406 0.405 0.733 0.426 0.441 0.426
HHS6 0.682 0.642 0.564 0.842 0.615 0.588 0.618
HHS9 0.587 0.537 0.489 0.812 0.560 0.550 0.610
HHS10 0.519 0.470 0.571 0.838 0.506 0.642 0.657
HHS11 0.432 0.352 0.507 0.722 0.429 0.574 0.560
HHS12 0.520 0.459 0.597 0.822 0.463 0.642 0.617
APE1 0.723 0.678 0.447 0.533 0.913 0.472 0.480
APE2 0.623 0.581 0.435 0.553 0.877 0.538 0.485
APE3 0.648 0.605 0.503 0.562 0.896 0.566 0.507
APE4 0.812 0.750 0.555 0.613 0.899 0.578 0.584
QC1 0.586 0.474 0.674 0.619 0.526 0.910 0.747
QC2 0.555 0.456 0.589 0.564 0.479 0.887 0.740
QC3 0.574 0.490 0.574 0.656 0.521 0.854 0.713
QC4 0.692 0.592 0.724 0.713 0.604 0.908 0.850
PS1 0.641 0.531 0.649 0.616 0.511 0.835 0.859
PS2 0.694 0.619 0.608 0.688 0.560 0.791 0.937
PS3 0.646 0.580 0.578 0.650 0.543 0.697 0.883
PS4 0.563 0.506 0.484 0.559 0.377 0.561 0.767
PS5 0.671 0.582 0.710 0.720 0.525 0.845 0.948
SPC model
PAS4 0.787 0.577 0.635 0.446 0.527 0.540 0.536
PAS8 0.882 0.710 0.711 0.594 0.607 0.676 0.685
PAS9 0.773 0.600 0.542 0.504 0.497 0.492 0.540
PAS10 0.778 0.620 0.538 0.517 0.499 0.466 0.544
PAS12 0.927 0.724 0.680 0.554 0.630 0.699 0.711
WTS1 0.590 0.779 0.420 0.364 0.526 0.450 0.446
WTS2 0.622 0.868 0.467 0.507 0.644 0.497 0.561
WTS3 0.623 0.855 0.444 0.430 0.614 0.428 0.507
WTS4 0.708 0.863 0.488 0.481 0.542 0.514 0.550
WTS6 0.617 0.798 0.445 0.493 0.542 0.363 0.437
WTS7 0.771 0.889 0.538 0.560 0.648 0.550 0.650
CT1 0.651 0.483 0.905 0.509 0.473 0.552 0.536
CT2 0.718 0.532 0.924 0.585 0.558 0.623 0.618
HHS1 0.576 0.493 0.543 0.763 0.497 0.511 0.593
HHS3 0.591 0.519 0.494 0.740 0.564 0.502 0.552
HHS4 0.543 0.470 0.525 0.840 0.437 0.508 0.605
HHS6 0.440 0.455 0.381 0.776 0.306 0.366 0.504
-307-
Journal of Industrial Engineering and Management – https://doi.org/10.3926/jiem.3143
PA WT CT HHS AP QC PS
HHS7 0.380 0.348 0.419 0.769 0.214 0.405 0.493
HHS9 0.442 0.456 0.456 0.836 0.339 0.445 0.550
HHS10 0.455 0.327 0.459 0.788 0.385 0.477 0.554
APS1 0.558 0.701 0.468 0.443 0.761 0.475 0.495
APS2 0.606 0.573 0.506 0.463 0.875 0.532 0.522
APS3 0.421 0.434 0.381 0.338 0.771 0.321 0.377
APS4 0.439 0.445 0.377 0.335 0.833 0.332 0.367
APS5 0.689 0.684 0.577 0.504 0.907 0.561 0.606
QC1 0.593 0.442 0.531 0.458 0.489 0.877 0.718
QC2 0.577 0.489 0.518 0.461 0.492 0.836 0.659
QC3 0.481 0.321 0.485 0.454 0.331 0.799 0.641
QC4 0.695 0.603 0.638 0.608 0.532 0.887 0.830
PS1 0.608 0.520 0.561 0.591 0.501 0.714 0.827
PS2 0.598 0.542 0.566 0.603 0.488 0.694 0.843
PS3 0.560 0.469 0.480 0.562 0.453 0.637 0.807
PS4 0.610 0.505 0.462 0.540 0.447 0.652 0.823
PS5 0.696 0.600 0.588 0.658 0.557 0.840 0.913
Table 5. Cross-loadings results
Discriminant validity is also examined by comparing the square root of the AVE with correlations amongconstructs. The objective is to make sure that the square root of the AVE of each construct is greater than itscorrelations with other constructs (Fornell & Larcker, 1981). The results are reported in Table 6. For all the latentvariables the squares root of the AVE (diagonal values) were greater than the correlations with other latentvariables. Therefore, the measurement model has adequate indicators’ reliability, internal consistency, convergentvalidity, and discriminant validity.
PA WT CT HHS AP QC PS
UPC model
PA 0.819
WT 0.798 0.865
CT 0.637 0.536 0.912
HHS 0.693 0.624 0.671 0.804
AP 0.788 0.733 0.543 0.632 0.896
QC 0.680 0.569 0.723 0.720 0.601 0.890
PS 0.732 0.639 0.694 0.736 0.576 0.863 0.881
SPC model
PA 0.832
WT 0.781 0.843
CT 0.750 0.556 0.915
HHS 0.631 0.564 0.600 0.788
AP 0.667 0.697 0.566 0.511 0.831
QC 0.698 0.557 0.644 0.589 0.549 0.850
PS 0.731 0.628 0.633 0.702 0.583 0.839 0.843
Table 6. Discriminant validity results
-308-

Journal of Industrial Engineering and Management – https://doi.org/10.3926/jiem.3143
4.2.2. Hierarchical Model
In this study, HL was specified as a second-order hierarchical reflective latent variable, comprising five first-orderlatent variables (PA, WT, CT, HHS, and AP). The HL variable received all the first-order latent variables’ items.Table 7 presents the hierarchical structure of HL and the explained variance in its components.
Indices PA WT CT HHS AP
UPC model
R2 0.866 0.744 0.549 0.757 0.737
β 0.931 0.863 0.741 0.870 0.858
p- value <0.001 <0.001 <0.001 <0.001 <0.001
SPC model
R2 0.827 0.778 0.599 0.640 0.667
β 0.909 0.882 0.774 0.800 0.817
p-value <0.001 <0.001 <0.001 <0.001 <0.001
Table 7. HL Hierarchical model
4.2.3. Structural Model
The structural model was assessed by checking a set of indices as described by Hair et al. (2019): significance andrelevance of the structural model relationships, coefficient of determination R2, effect size f2, and predictiverelevance of the model Q². The final two models UPC and SPC are provided in Figures 3 and 4 respectively.
Figure 3. UPC final SEM-PLS model
-309-
Journal of Industrial Engineering and Management – https://doi.org/10.3926/jiem.3143
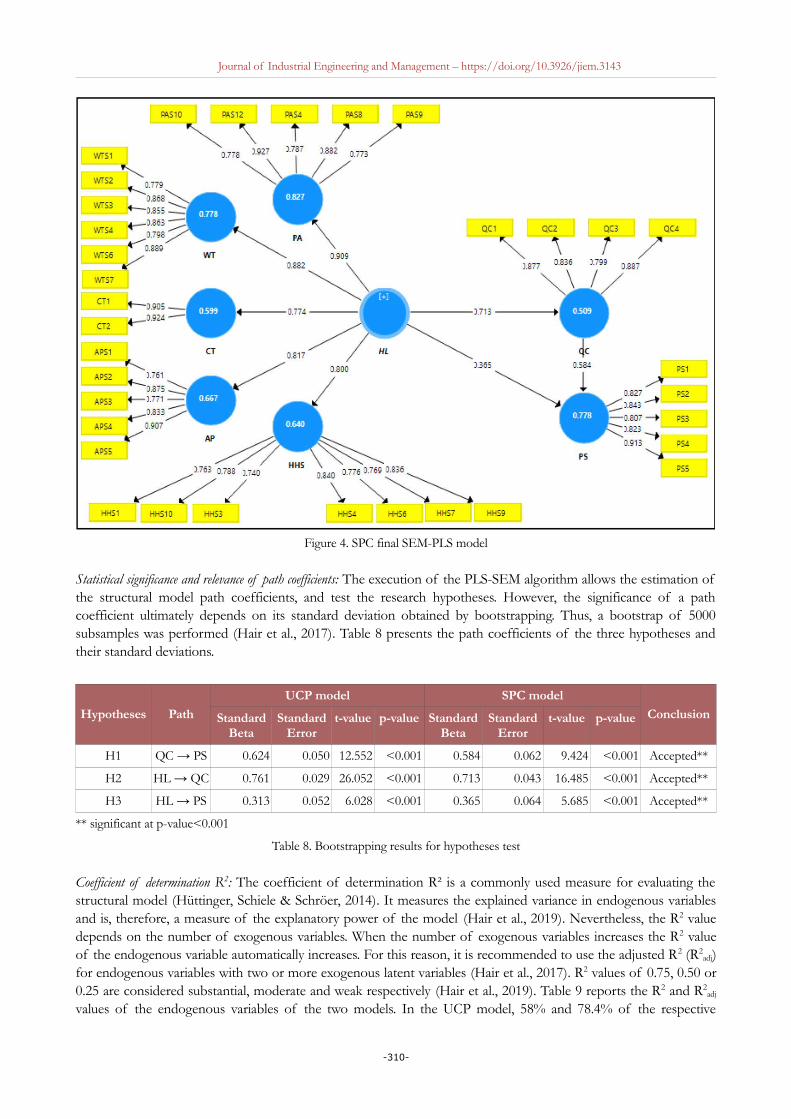
Figure 4. SPC final SEM-PLS model
Statistical significance and relevance of path coefficients: The execution of the PLS-SEM algorithm allows the estimation ofthe structural model path coefficients, and test the research hypotheses. However, the significance of a pathcoefficient ultimately depends on its standard deviation obtained by bootstrapping. Thus, a bootstrap of 5000subsamples was performed (Hair et al., 2017). Table 8 presents the path coefficients of the three hypotheses andtheir standard deviations.
Hypotheses Path
UCP model SPC model
ConclusionStandardBeta
StandardError
t-value p-value StandardBeta
StandardError
t-value p-value
H1 QC → PS 0.624 0.050 12.552 <0.001 0.584 0.062 9.424 <0.001 Accepted**
H2 HL → QC 0.761 0.029 26.052 <0.001 0.713 0.043 16.485 <0.001 Accepted**
H3 HL → PS 0.313 0.052 6.028 <0.001 0.365 0.064 5.685 <0.001 Accepted**
** significant at p-value<0.001
Table 8. Bootstrapping results for hypotheses test
Coefficient of determination R2: The coefficient of determination R² is a commonly used measure for evaluating thestructural model (Hüttinger, Schiele & Schröer, 2014). It measures the explained variance in endogenous variablesand is, therefore, a measure of the explanatory power of the model (Hair et al., 2019). Nevertheless, the R2 valuedepends on the number of exogenous variables. When the number of exogenous variables increases the R2 valueof the endogenous variable automatically increases. For this reason, it is recommended to use the adjusted R2 (R2
adj)for endogenous variables with two or more exogenous latent variables (Hair et al., 2017). R2 values of 0.75, 0.50 or0.25 are considered substantial, moderate and weak respectively (Hair et al., 2019). Table 9 reports the R2 and R2
adj
values of the endogenous variables of the two models. In the UCP model, 58% and 78.4% of the respective
-310-

Journal of Industrial Engineering and Management – https://doi.org/10.3926/jiem.3143
variances of the variables QC and PS are explained by the exogenous variable HL. These values are 50.9% and77.5% for the SPC model.
Effect size f2: As underlined above the R2 value increases as the number of exogenous variables increases, it is thensuggested to evaluate the impact of the removal of each exogenous variable on the endogenous variable using theeffect size f2. This parameter allows specifying if the removal of an exogenous variable has an impact on theendogenous latent variable. f2 values of 0.02, 0.15 and 0.35 Indicate, respectively, small, medium and large effect ofthe exogenous variable (Hair et al., 2019). Models in Figures 3 and 4 show that the endogenous variable PS has twoexogenous variables: HL and QC. Table 10 presents the effect size of the removal of each of these two exogenousvariables on the endogenous variable.
Blindfolding and predictive relevance Q²: The Q2 is another mean to assess the model’s predictive accuracy. It is based onthe blindfolding procedure, which consists of deleting individual data points of latent variables’ indicators andestimating the model parameters based on the remaining data. Using these estimates as inputs, the blindfoldingprocedure predicts the original values of data points that have been deleted. The differences between the predictedvalues and the original values are used to calculate the Q² value. As a rule of thumb Q 2 values greater than 0, 0.25and 0.50 illustrate small, medium and large predictive relevance of the model (Hair et al., 2019). The Q2 values ofthe two endogenous variables QC and PS, using an omitted distance D=7, are given in Table 11. These resultssupport the predictive power of the model.
Endogenousvariables
UPC model SPC modelResults
R2 R2adj R2 R2
adj
QC 0.580 - 0.509 - Moderate
PS 0.785 0.784 0.778 0.775 Substantial
Table 9. Coefficients of determination R2 and R2adj
Exogenous variablesUPC model SPC model
Resultsf2 f2
HL 0.192 0.295 Medium effect size
QC 0.764 0.754 Large effect size
Table 10. Effect size f2 of the exogenous variables
Endogenousvariables
UPC model SPC modelResults
SSO SSE Q2 SSO SSE Q2
QC 940.000 516.179 0.451 596.000 382.137 0.359 Medium predictive relevance
PS 1175.000 473.764 0.597 745.000 339.168 0.545 Large predictive relevance
SSO: the sum of the squared observations, SEE: the sum of the squared prediction errors
Table 11. Blindfolding results
4.2.4. Mediating Effect
In the developed model, HL and PS are connected by two paths (Figure 5): direct path HL→PS and indirect pathHL→QC→PS. In the indirect path, the variable QC is considered as a mediator variable. Hence, it is necessary totest the relevance of this mediation. In this regard, we followed steps described by Hair, Hult, Ringle, and Sarstedt(2014). First, we checked the significance of the direct effect HL→PS, without the introduction of the mediatorvariable QC. Second, we included the mediator variable QC and examined the significance of the indirect effect.Finally, we assessed the strength of the mediation by calculating the variance accounted for (VAF) value. All ofthese steps were performed by applying a bootstrapping of 5000 subsamples (Hair et al., 2014).
-311-

Journal of Industrial Engineering and Management – https://doi.org/10.3926/jiem.3143
The results, for the UPC model, showed that the direct effect HL→PS has a coefficient β=0.787 (t=29.715), andtherefore it is a significant effect. After the introduction of the mediator variable QC, we obtained a coefficientβ2=0.761 (t=25.929) for the effect HL→QC and β3=0.624 (t=12.321) for the effect QC→PS. Consequently, theindirect effect HL→QC→PS has a coefficient β2×β3=0.475 (t=11.688), which is significant. The inclusion of themediator variable QC has increased the R2 value of the endogenous variable PS from 0.619 (t=14.955) to 0.785(t=33.573). Also, the coefficient of the direct effect HL→PS decreased from β=0.787 (t=29.715) to β1=0.313(t=6.028). Thus, the mediator effect absorbed some of the direct effects. The absorbed proportion is calculated bythe VAF value, which indicates the size of the indirect effect in relation to the total effect. The VAF value is 0.603,which leads to the conclusion that the indirect effect explained 60.3% of the total effect (Figure 5). Therefore, themediating effect of QC is partial as the VAF score is between 20% and 80% (Hair et al., 2014). It is acomplementary mediation since the product of the three path coefficients β1, β2 and β3 is positive (Hair et al.,2014). For the SPC model, the same analysis was conducted. The results are shown in Figure 5.
Path
UPC model SPC model
Pathcoefficient
t-statistics p-value Pathcoefficient
t-statistics p-value
β: HL → PS (without mediator variable) 0.787 29.715 <0.001 0.780 20.087 <0.001
β1: HL → PS (with mediator variable)
0.313 6.028 <0.001 0.365 5.542 <0.001
β2: HL → QC 0.761 25.929 <0.001 0.713 16.541 <0.001
β3: QC → PS 0.624 12.321 <0.001 0.584 9.151 <0.001
β2× β3 0.475 11.688 <0.001 0.416 9.616 <0.001
VAF ( ) 0.603 0.533
Figure 5. Mediating effect analysis
5. Discussion
This study reports the results of the first study concerning the examination of the relationship between HL, QC,and PS. It represents one of the first attempts to develop a structured model to empirically examine the effect ofHL on both QC and PS. Up to now, there has been little in-depth analysis especially quantitative studies in thisresearch area; therefore, our study helps to partially fill this knowledge gap.
In order to test the research’s hypotheses, which stipulate the existence of an influential relationship between HL,QC, and PS, a survey was conducted among hospitalized patients in three public healthcare facilities located in thecity of Fez-Morocco. Collected data were analyzed using the SEM method, which remains the most widely usedmethod for testing and validating research hypotheses in the social sciences area. Results revealed a significantinfluence of HL on QC and PS. Thus, the research hypotheses are all confirmed and validated. Further, theproposed model leads to the conclusion that HL contributes to explaining more than 50% and 70% respectively ofthe variance in the QC and PS. In the proposed model, HL was specified as a second-order latent variable,composed of first-order latent variables, namely: PA, WT, CT, HHS, and AP.
Statistical analysis showed that the variable PA is the most preponderant component of HL. Its path coefficient isthe highest exceeding 0.900: β=0.931 (p-value<0.001) for the UPC model and β=0.909 (p-value<0.001) for the
-312-

Journal of Industrial Engineering and Management – https://doi.org/10.3926/jiem.3143
SPC model. In the Moroccan context, this result is far from being surprising. Health officials and researchersrecognize that accessibility of care and particularly PA remains the major concern of the health system (Bouhaddouet al., 2013). Indeed, the household panel survey indicated that only 76.1% of sick people seek healthcare. In otherwords, one sick person out of four did not use healthcare services (ONDH, 2015). Also, the National Populationand Family Health Survey denoted that almost 14% of women did not use healthcare services for childbirth(Ministry of Health, 2018). The same survey revealed that about 15% of elderly people requiring medicalexaminations did not seek healthcare because of PA difficulties. This was explained by many factors, includinggeographical remoteness, insufficient human resources, problems with the supply of medicines, under-equipmentof healthcare facilities, inadequate medical transportation, etc. (Ministry of Health, 2018; The World Bank, 2015).
According to the UPC model results, special attention should be paid to the accessibility of medical transportationand the availability of technical equipment/facilities, as these elements showed strong correlations with the PA.These findings are in line with other studies and official reports that have reported the issue of medicaltransportation in Morocco (Frichi, Ben Kacem, Jawab, Kamach & Chafik, 2020; Hssain & Hssain, 2013; Tachfouti,Bhatti, Nejjari, Kanjaa & Salmi, 2011), and the low availability of technical facilities (CESE, 2013).
As for the SPC model, two elements showed strong correlations with the PA. The first is the availability of medicaland nursing staff. This can be explained by the critical shortage of physicians and nurses in Morocco (Ministry ofHealth, 2012). Moreover, the health workforce shortfall is exacerbated by the unbalanced distribution of physiciansand nurses across the country, which highlights the shortcomings of the human resources management system(CESE, 2013). The second element is the availability of support and guidance staff, whose role is to guide, assistand help patients moving smoothly between care units. This is in accordance with the findings of previousresearch, which indicated that difficulties in patient movements inside healthcare facilities caused patientdissatisfaction (Obtel, El Achhab, Bendahhou, Benider, Errihani, Zidouh et al., 2012).
The second and third components of HL with high path coefficients are different depending on the admissionmode. In the UCP model, for patients admitted through the emergency department, the second component isHHS (β=0.870; p-value<0.001) and the third is WT (β=0.863; p-value<0.001). In the SPC model, for scheduledpatients, the second component is WT (β=0.882; p-value<0.001) followed by AP (β=0.817; p-value<0.001). Thisdifference is explained by the hospital admission type. In fact, urgent patients wait less than scheduled patients toreceive care; they are prioritized because they require rapid medical intervention. In addition, the preparation andconstitution of administrative files are carried out downstream of the care process. In contrast, planned patients arerequired to complete the administrative procedures upstream of the admission process, and therefore theyexperience delays. Regarding the HHS, scheduled patients are admitted in prepared conditions: rooms and hospitalbeds are available, waiting areas and examination rooms are less crowded and therefore cleaner, etc. In general,HHS are not a major concern for scheduled patients comparing to difficulties related to WT and AP. On the otherhand, urgent patients are often confronted with a lack of resources, particularly in terms of places (hospital roomsand beds), as their admission is not planned and therefore takes place without preparation. Likewise, waiting areasand examination rooms are overcrowded, resulting in a lack of cleanliness, available chairs in waiting areas, etc.
Several patient satisfaction surveys conducted in Morocco support the results of this study. Damghi, Belayachi,Armel, Zekraoui, Madani, Abidi et al. (2013), in their survey in an emergency department of a public hospital inMorocco, found a significant correlation between WT and PS. Their results also indicated that urgent patientsperceived the WT more favorably than non-urgent patients. WT, as a predictor of dissatisfaction, was also reportedby Kasouati, Bouti, Zidouh, Abd El Hamid, Boufaresse and Mrabet (2015). A study by Amazian, Toughrai,Benmansour, Laalim, El Alami and Mazaz, (2013) conducted in Fez University Hospital revealed high satisfactionrates, explained in particular by the hotel comfort. Nevertheless, almost half of the surveyed patients made negativejudgments concerning AP. Another more recent survey at Fez University Hospital showed that a significantproportion of surveyed patients complained about appointment delays, WT, HHS and the complexity of AP (ElMarnissi et al., 2019).
-313-

Journal of Industrial Engineering and Management – https://doi.org/10.3926/jiem.3143
6. Conclusion
Healthcare facilities are called upon to find new strategies to improve the quality of their services and patientsatisfaction. There is general agreement that quality of care and patient satisfaction depend to a large extent onthe performance of support activities. Indeed, medical acts can only be of high quality if the related logisticsactivities are managed and performed effectively. Thus, hospital logistics enhances healthcare accessibility andquality.
The objective of this study was to empirically examine the influence of hospital logistics on quality of careand patient satisfaction using the PLS-SEM method. The results showed a significant impact of hospitallogistics on both quality of care and patient satisfaction. More specifically, among the five investigatedcomponents of hospital logistics, physical accessibility emerged as the most preponderant factor in both UPCand SPC models. Hence, improvement of physical accessibility would result in a significant increase in qualityand satisfaction. It implies the availability and accessibility of medical transportation, support and guidancestaff, medical and nursing staff, medical facilities and equipment, drug, etc. The coming together of all ofthese elements is a challenging issue. It requires optimal resources planning and management, effectivesynchronization of the various flows both within (between care units) and outside (with providers andstakeholders) healthcare facilities, etc.
Hospital logistics, as a performance lever, aims to rethink the entire health system by putting the patient at thecenter of activities. To ensure this, health policymakers and hospital managers should pay more interest andattention to logistics activities within hospitals.
Like most studies, this research has some limitations. First, its results cannot be generalized since the survey onlyconcerned patients from three public healthcare facilities in the city of Fez. It didn’t include patients from otherMoroccan cities. Second, the components of hospital logistics in the model are restricted. They should be adaptedand extended depending on the research scope and context. Third, the sample size is reduced because it wasdivided into two models. Therefore, the generalization of the results may be limited by these limitations.
Further studies in this area are encouraged. They should consider, in addition to the research limitations mentionedabove, cultural and context specifies. The analysis of results may be used on some classification, such as providinginformation about the hospital type, number of beds, patients categories, etc.
Declaration of Conflicting InterestsThe authors declared no conflicts of interest with respect to the research, authorship, and/or publication of thisarticle.
Funding
The authors received no financial support for the research, authorship, and/or publication of this article.
ReferencesAbu-Odah, H., Abu Salah, A., El-Khateeb, A., & El-Nems, K. (2018). Patients’ satisfaction towards medical
services at the emergency department of European Gaza Hospital-Gaza Strip. Journal of Emergency Practice and Trauma, 4(2), 77-81. https://doi.org/10.15171/jept.2018.08
Ahmad, B.A., Khairatul, K., & Farnaza, A. (2017). An assessment of patient waiting and consultation time in a primary healthcare clinic. Malaysian Family Physician : The Official Journal of the Academy of Family Physicians of Malaysia, 12(1), 14-21.
Akachi, Y., & Kruk, M.E. (2017). Quality of care : measuring a neglected driver of improved health. Bulletin of theWorld Health Organization, 95(6), 465-472. https://doi.org/10.2471/BLT.16.180190
Al-Mhasnah, A.M., Salleh, F., Afthanorhan, A., & Ghazali, P.L. (2018). The relationship between services quality and customer satisfaction among Jordanian healthcare sector. Management Science Letters, 8(12), 1413-1420. https://doi.org/10.5267/j.msl.2018.10.003
-314-

Journal of Industrial Engineering and Management – https://doi.org/10.3926/jiem.3143
Aljaberi, M.A., Juni, M.H., Al-Maqtari, R.A., Lye, M.S., Saeed, M.A., Al-Dubai, S.A.R. et al. (2018). Relationships among perceived quality of healthcare services, satisfaction and behavioural intentions of international students in Kuala Lumpur, Malaysia: a cross-sectional study. BMJ Open, 8(9), e021180. https://doi.org/10.1136/bmjopen-2017-021180
Amazian, K., Toughrai, I., Benmansour, N., Laalim, S. A., El Alami, M.E.A., & Mazaz, K. (2013). Enquête de satisfaction des patients atteints de cancer dans un hôpital universitaire au Maroc. Sante Publique, 25(5), 627-632.https://doi.org/10.3917/spub.135.0627
Assefa, F., Mosse, A., & Hailemichael, Y. (2011). Assessment of Clients’ Satisfaction with Health Service Deliveries at Jimma University Specialized Hospital. Ethiopian Journal of Health Sciences, 21(2), 101-109. https://doi.org/10.4314/ejhs.v21i2.69050
Azzi, A., Persona, A., Sgarbossa, F., & Bonin, M. (2013). Drug inventory management and distribution: outsourcing logistics to third party providers. ‐ Strategic Outsourcing: An International Journal, 6(1), 48-64. https://doi.org/10.1108/17538291311316063
Badri, M.A., Attia, S., & Ustadi, A.M. (2009). Healthcare quality and moderators of patient satisfaction : testing for causality. International Journal of Health Care Quality Assurance, 22(4), 382-410. https://doi.org/10.1108/09526860910964843
Badri, M.A., Dodeen, H., Al Khaili, M., & Abdulla, M. (2005). Development of the National Inpatient Satisfaction Constructs and Items for the United Arab Emirates. International Journal of Applied Health Studies, 1(3), 1-22.
Barclay, D., Higgins, C., & Thompson, R. (1995). The Partial Least Squares Approach to Causal Modeling: Personal Computer Adoption and Use as an Illustration, Technology Studies. Special Issue on Research Methodology,2(2), 285-309.
Bautista, J.M.S., & Tangsoc, J.C. (2016). Hospital Service Quality Assessment and Analysis: A Multi-Perspective Approach. DLSU Business & Economics Review, 26(1), 30-49.
Beaulieu, M. (2019). Une expérience de collaboration logistique. Gestion Hospitalière, 585, 211-214.
Beaulieu, M., Bentahar, O., & Benzidia, S. (2019). L’évolution de la logistique hospitalière - L’expérience du Québec. Gestion Hospitalière, 583, 94-97.
Beaulieu, M., & Venne, J.-F. (2018). La logistique au coeur de la performance. Gestion, 43(3), 86-89.
https://doi.org/10.3917/riges.433.0086
Benamirouche, R. (2015). L’impact du système d’information hospitalier sur la qualité des soins. Revue d’Épidémiologie et de Santé Publique, 63, S29. https://doi.org/10.1016/j.respe.2015.01.068
Bleustein, C., Rothschild, D.B., Valen, A., Valaitis, E., Schweitzer, L., & Jones, R. (2014). Wait Times, Patient Satisfaction Scores, and the Perception of Care. The American Journal of Managed Care, 20(5), 393-400.
Bouhaddou, O., Bennani Othmani, M., & Diouny, S. (2013). Medical informatics in morocco. Yearbook of Medical
Informatics, 22(1), 190-196. https://doi.org/10.1055/s-0038-1638855
Buntak, K., Kovačić, M., & Martinčević, I. (2019). Impact of medical logistics on the quality of life of healthcareusers. In Quality Festival 2019 (1025-1032). https://doi.org/10.24874/PES01.02.109
CESE. (2013). Les soins de santé de base Vers un accès équitable et généralisé. Available at: http://www.cese.ma/Documents/PDF/Rapport SSB VF.pdf
Chougrani, S., & Ouhadji, S. (2014). Les questionnaires de sortie et la place des usagers dans le projet qualité à l’Etablissement hospitalier universitaire d’Oran. Santé Publique, 26(4), 499-508. https://doi.org/10.3917/spub.144.0499
Chow, G., & Heaver, T. (1994). Logistics in the Canadian health care industry. Canadian Logistics Journal, 1(1), 29-73.
-315-

Journal of Industrial Engineering and Management – https://doi.org/10.3926/jiem.3143
Churchill, G.A. (1979). A Paradigm for Developing Better Measures of Marketing Constructs. Journal of Marketing Research, 16(1), 64-73. https://doi.org/10.2307/3150876
Costin, M. (2010). Logistique hospitalière, un outil du management : le cas des hôpitaux français et moldaves. Humanisme et Entreprise, 299(4), 29-48. https://doi.org/10.3917/hume.299.0029
Dagger, T.S., & Sweeney, J.C. (2007). Service quality attribute weights: How do novice and longer-term customersconstruct service quality perceptions? Journal of Service Research, 10(1), 22-42. https://doi.org/10.1177/1094670507303010
Damghi, N., Belayachi, J., Armel, B., Zekraoui, A., Madani, N., Abidi, K. et al. (2013). Patient satisfaction in a Moroccan emergency department. International Archives of Medicine, 6(1), 20. https://doi.org/10.1186/1755-7682-6-20
De Carvalho, P.P.S., Kalid, R.D.A., & Rodriguez, J.L.M. (2019). Evaluation of the City Logistics Performance Through Structural Equations Model. IEEE Access, 7, 121081-121094. https://doi.org/10.1109/ACCESS.2019.2934647
Derebe, M.M., Shiferaw, M.B., & Ayalew, M.A. (2017). Low satisfaction of clients for the health service provisionin West Amhara region, Ethiopia. PLoS ONE, 12(6), 1-10. https://doi.org/10.1371/journal.pone.0179909
Donabedian, A. (2003). An Introduction to Quality Assurance in Health Care. Bashshur, R. (Ed.). New York: Oxford University Press.
Duggirala, M., Rajendran, C., & Anantharaman, R.N. (2008). Patient-perceived dimensions of total quality service in healthcare. Benchmarking: An International Journal, 15(5), 560-583.
https://doi.org/10.1108/14635770810903150
El Marnissi, B., Abbass, F., Charaka, H., Mouhoute, N., Tritha, A., Bouhafa, T. et al. (2019). Evaluation of CancerPatient Satisfaction : A Transversal Study in Radiotherapy Department, Hassan II University Hospital, Fez, Morocco. Advances in Public Health. https://doi.org/10.1155/2019/6430608
Errassafi, M., Abbar, H., & Benabbou, Z. (2019). The mediating effect of internal integration on the relationshipbetween supply chain integration and operational performance: evidence from Moroccan manufacturing companies. Journal of Industrial Engineering and Management, 12(2), 254-273. https://doi.org/10.3926/jiem.2794
Fang, J., Liu, L., & Fang, P. (2019). What is the most important factor affecting patient satisfaction – A study based on gamma coefficient. Patient Preference and Adherence, 13, 515-525. https://doi.org/10.2147/PPA.S197015
Fornell, C., & Larcker, D.F. (1981). Evaluating Structural Equation Models with Unobservable Variables and Measurement Error. Journal of Marketing Research, 18(1), 39-50. https://doi.org/10.1177/002224378101800104
Frichi, Y., Ben Kacem, A., Jawab, F., Kamach, O., & Chafik, S. (2020). Improving Interhospital Medical Patient Transportation in Morocco: A Forcasting Collaborative Approach. In Euchi, J. (Ed.), Transportation, Logistics, andSupply Chain Management in Home Healthcare: Emerging Research and Opportunities (136-162). Pennsylvania, USA: IGIGlobal. https://doi.org/10.4018/978-1-7998-0268-6.ch008
Frichi, Y., Jawab, F., & Boutahari, S. (2018). Patient satisfaction factors and their correspondence with hospital logistics activities. In Proceedings of the International Conference on Industrial Engineering and Operations Management (1141-1147). Paris, France: IEOM Society International.
Frichi, Y., Jawab, F., & Boutahari, S. (2019a). An Exploratory Qualitative Study of the Influence of Hospital Logistics Factors on Quality of Care and Patient Satisfaction at Public Hospitals in Morocco. Advances in Science,Technology and Engineering Systems Journal, 4(6), 414-422. https://doi.org/10.25046/aj040652
-316-

Journal of Industrial Engineering and Management – https://doi.org/10.3926/jiem.3143
Frichi, Y., Jawab, F., & Boutahari, S. (2019b). SEM to analyze the interaction between hospital logistics and quality of care, a systematic review. In International Colloquium on Logistics and Supply Chain Management, LOGISTIQUA 2019. IEEE. https://doi.org/10.1109/LOGISTIQUA.2019.8907313
Frichi, Y., Jawab, F., & Boutahari, S. (2019c). The Mixed-Method 5W2D Approach for Health System Stakeholders Analysis in Quality of Care: An Application to the Moroccan Context. International Journal of Environmental Research and Public Health, 16(16), 2899. https://doi.org/10.3390/ijerph16162899
Frichi, Y., Jawab, F., Boutahari, S., Zehmed, K., Moufad, I., Akoudad, K. et al. (2018). Hospital logistics: An effective tool in improving the quality of care. In Proceedings of the International Conference on Industrial Engineering and Operations Management. Paris, France.
Frosch, D.L. (2015). Patient-Reported Outcomes as a Measure of Healthcare Quality. Journal of General Internal Medicine, 30(10), 1383-1384. https://doi.org/10.1007/s11606-015-3476-2
Hair, J.F., Hult, G.T.M., Ringle, C.M., & Sarstedt, M. (2014). A Primer on Partial Least Squares Structural Equation Modeling (PLS-SEM). Los Angeless: SAGE Publications. https://doi.org/10.1016/j.lrp.2013.01.002
Hair, J.F., Hult, G.T.M., Ringle, C.M., & Sarstedt, M. (2017). A Primer on Partial Least Squares Structural Equation Modeling ( PLS-SEM ) (2nd ed.). Los Angeles: SAGE Publications, Inc.
Hair, J.F., Risher, J.J., Sarstedt, M., & Ringle, C.M. (2019). When to use and how to report the results of PLS-SEM. European Business Review, 31(1), 2-24. https://doi.org/10.1108/EBR-11-2018-0203
Halsdorfer, N.D., Blasquez, J., Bensoussan, L., Gentile, S., Collado, H., Viton, J.M. et al. (2011). An assessment ofpatient satisfaction for a short-stay program in a physical and rehabilitation medicine day hospital. Annals of Physical and Rehabilitation Medicine, 54(4), 236-247. https://doi.org/10.1016/j.rehab.2011.04.001
Howie, J.G.R., Porter, M.D., Heaney, D.J., & Hopton, J.L. (1991). Long to short consultation ratio : a proxy measure of quality of care for general practice. British Journal of General Practice, 41(343), 48-54.
Hssain, H., & Hssain, I. (2013). la régulation Médicale et la stratégie De Mise à niveau Des urgences au Maroc. Mediterranean Journal of Emergency Medicine, 17, 26-30.
Hussain, A., Asif, M., Jameel, A., & Hwang, J. (2019). Measuring OPD Patient Satisfaction with Different ServiceDelivery Aspects at Public Hospitals in Pakistan. International Journal of Environmental Research and Public Health, 16(13), 2340. https://doi.org/10.3390/ijerph16132340
Hüttinger, L., Schiele, H., & Schröer, D. (2014). Exploring the antecedents of preferential customer treatment bysuppliers: A mixed methods approach. Supply Chain Management: An International Journal, 19(5/6), 697-721. https://doi.org/10.1108/SCM-06-2014-0194
Jang, A.R., & Jang, K.S. (2017). Structural Equation Modeling on Health-related Quality of Life of Patients with Ankylosing Spondylitis. Iranian Journal of Public Health, 46(10), 1338-1346.
Jawab, F., Frichi, Y., & Boutahari, S. (2018). Hospital Logistics Activities. In International Conference on Industrial Engineering and Operations Management. Bandung, Indonesia.
Jobin, M.-H., Beaulieu, M., & Boivin, A. (2004). Gérer la performance de la logistique hospitalière. Logistique & Management, 12(sup1), 21-30. https://doi.org/10.1080/12507970.2004.11516815
Johnson, D.M., & Russell, R.S. (2015). SEM of service quality to predict overall patient satisfaction in medical clinics: A case study. Quality Management Journal, 22(4), 18-36. https://doi.org/10.1080/10686967.2015.11918448
Kashkoli, S.A., Zarei, E., Daneshkohan, A., & Khodakarim, S. (2017). Hospital responsiveness and its effect on overall patient satisfaction: A cross-sectional study in Iran. International Journal of Health Care Quality Assurance, 30(8), 728-736. https://doi.org/10.1108/IJHCQA-07-2016-0098
-317-

Journal of Industrial Engineering and Management – https://doi.org/10.3926/jiem.3143
Kasouati, J., Bouti, L., Zidouh, O., Abd El Hamid, Z., Boufaresse, A., & Mrabet, M. (2015). Évaluation de la satisfaction des patients de la prise en charge de la douleur au service des urgences de l’Hôpital Militaire d’Instruction Mohamed V, Rabat, Maroc. Revue d’Épidémiologie et de Santé Publique, 63, S75. https://doi.org/10.1016/j.respe.2015.03.085
Kline, R.B. (2011). Principles and Practice of Structural Equation Modeling (3rd ed.). The Guilford Press.
Kriegel, J., Jehle, F., Dieck, M., & Mallory, P. (2013). Advanced services in hospital logistics in the German health service sector. Logistics Research, 6(2-3), 47-56. https://doi.org/10.1007/s12159-013-0100-x
Kwon, I.W.G., Kim, S.H., & Martin, D.G. (2016). Healthcare supply chain management; strategic areas for quality and financial improvement. Technological Forecasting and Social Change, 113, 422-428. https://doi.org/10.1016/j.techfore.2016.07.014
Landry, S., & Beaulieu, M. (2002). La logistique hospitalière : un remède aux maux du secteur de la santé? Gestion, 26(4), 34-41. https://doi.org/10.3917/riges.264.0034
Landry, S., & Beaulieu, M. (2013). The Challenges of Hospital Supply Chain Management, from Central Stores to Nursing Units. In Springer (Ed.), Handbook of Healthcare Operations Management - Methods and Applications, 184, 465-482. New York. https://doi.org/10.1007/978-1-4419-6151-8
Landry, S., & Philippe, R. (2004). How logistics can service healthcare. Supply Chain Forum : An International Journal, 5(2), 24-30. https://doi.org/10.1080/16258312.2004.11517130
Lerebours, F., Saltel, P., Béthune-volters, A., Nallet, G., Bourdat, P., Vesin-etterlen, F. et al. (2015). Satisfaction despatientes traitées par chimiothérapie en hôpital de jour pour un cancer du sein : résultats de l’enquête TemporELLES. Bulletin Du Cancer, 102(4), 316-323. https://doi.org/10.1016/j.bulcan.2015.01.011
Lobo, A., Duarte, P., Carvalho, A., Rodrigues, V., Monteiro, J.M., & Alves, H. (2014). The Association of Equity, Accessibility , and Price With Primary Healthcare User’s Satisfaction. Western Journal of Nursing Research, 36(2), 191-208. https://doi.org/10.1177/0193945913497830
Lohr, K.N., & Schroeder, S.A. (1990). A strategy for quality assurance in medicare. The New England Journal of Medicine, 322(10), 707-712. https://doi.org/10.1056/NEJM199003083221031
Marama, T., Bayu, H., Merga, M., & Binu, W. (2018). Patient Satisfaction and Associated Factors among Clients Admitted to Obstetrics and Gynecology Wards of Public Hospitals in Mekelle Town, Ethiopia: An Institution-Based Cross-Sectional Study. Obstetrics and Gynecology International. https://doi.org/10.1155/2018/2475059
Más, A., Parra, P., Bermejo, R., Hidalgo, M., & Calle, J. (2016). Improving quality in healthcare: What makes a satisfied patient ? Revista de Calidad Asistencial, 31(4), 196-203. https://doi.org/10.1016/j.cali.2015.11.006
Meena, P.L., & Sarmah, S.P. (2012). Development of a supplier satisfaction index model. Industrial Management & Data Systems, 112(8), 1236-1254. https://doi.org/10.1108/IMDS-02-2016-0052
Melo, T. (2012). A note on challenges and opportunities for Operations Research in hospital logistics. Technical Reports on Logistics of the Saarland Business School, 2, 1-13.
Ministry of Health. (2012). Stratégie Sectorielle de Santé 2012-2016. Available at: http://www.sante.gov.ma/Docs/Documents/secteur santé.pdf
Ministry of Health. (2018). Enquête Nationale sur la Population et la Santé Familiale (ENPSF). Rabat, Morocco.
Mohamed, B., & Azizan, N.A. (2015). Perceived service quality’s effect on patient satisfaction and behavioural compliance. International Journal of Health Care Quality Assurance, 28(3), 300-314. https://doi.org/10.1108/IJHCQA-
06-2014-0074
Mohd, A., & Chakravarty, A. (2014). Patient satisfaction with services of the outpatient department. Medical Journal Armed Forces India, 70(3), 237-242. https://doi.org/10.1016/j.mjafi.2013.06.010
-318-

Journal of Industrial Engineering and Management – https://doi.org/10.3926/jiem.3143
Moons, K., Waeyenbergh, G., & Pintelon, L. (2019). Measuring the logistics performance of internal hospital supply chains – a literature study. Omega (United Kingdom), 82, 205-217. https://doi.org/10.1016/j.omega.2018.01.007
Moufad, I., & Jawab, F. (2019). A study framework for assessing the performance of the urban freight transport based on PLS approach. Archives of Transport, 49(1), 69-85. https://doi.org/10.5604/01.3001.0013.2777
Munir, B.A., Hafeez, S., Rashid, S., Iqbal, R., & Javed, M.A. (2019). Geospatial assessment of physical accessibility of healthcare and agent-based modeling for system efficacy. GeoJournal, 0123456789. https://doi.org/10.1007/s10708-019-09987-z
Narayana, S.A., Kumar Pati, R., & Vrat, P. (2014). Managerial research on the pharmaceutical supply chain - A critical review and some insights for future directions. Journal of Purchasing & Supply Management, 20(1), 18-40. https://doi.org/10.1016/j.pursup.2013.09.001
Nottingham, Q., Johnson, D.M., & Russell, R. (2018). A multi-year SEM model predicting the impact of behavior attributes on overall patient satisfaction. International Journal of Quality & Reliability Management. https://doi.org/10.1108/IJQRM-02-2018-0031
Nylenna, M., Bjertnaes, O., Saunes, I.S., & Lindahl, A.K. (2015). What is Good Quality of Health Care ? Professions and Professionalism, 5(1). https://doi.org/10.7577/pp.909
Obtel, M., El Achhab, Y., Bendahhou, K., Benider, A., Errihani, H., Zidouh, A. et al. (2012). Measuring patient satisfaction in Moroccan oncology institutions: EORTC IN-Patsat32 and satisfaction in Moroccan patient with cancer. Journal Africain Du Cancer, 4(1), 9-17. https://doi.org/10.1007/s12558-011-0185-6
ONDH. (2015). Enquête Panel de ménages 2012 - rapport des premiers résultats. Rabat.
Park, K., Park, J., Kwon, Y.D., Kang, Y., & Noh, J.W. (2016). Public satisfaction with the healthcare system performance in South Korea: Universal healthcare system. Health Policy, 120(6), 621-629. https://doi.org/10.1016/j.healthpol.2016.01.017
Parks, R., Wigand, R.T., Bennani Othmani, M., Serhier, Z., & Bouhaddou, O. (2019). Electronic health records implementation in Morocco: Challenges of silo efforts and recommendations for improvements. International Journal of Medical Informatics, 129, 430-437. https://doi.org/10.1016/j.ijmedinf.2019.05.026
Põlluste, K., Kallikorm, R., Meiesaar, K., & Lember, M. (2012). Satisfaction with access to health services: The perspective of Estonian patients with rheumatoid arthritis. The Scientific World Journal. https://doi.org/10.1100/2012/257569
Raposo, M.L., Alves, H.M., & Duarte, P.A. (2009). Dimensions of service quality and satisfaction in healthcare: A patient’s satisfaction index. Service Business, 3(1), 85-100. https://doi.org/10.1007/s11628-008-0055-1
Roussel, P., & Wacheux, F. (2005). Management des ressources humaines. Méthodes de recherche en sciences humaines et sociales. De Boeck Supérieur, « Méthodes & Recherches » . https://doi.org/10.3917/dbu.rouss.2005.01
Sarstedt, M., & Cheah, J.-H. (2019). Partial least squares structural equation modeling using SmartPLS: a softwarereview. Journal of Marketing Analytics, 1. https://doi.org/10.1057/s41270-019-00058-3
Schmalbach, J.C.V., & Avila, F.J.M. (2018). Structural equation models applied for evaluating service quality and satisfaction in the healthcare system of Cartagena de Indias D. T. Y C. (Colombia). Economics and Sociology, 11(2),200-215. https://doi.org/10.14254/2071-789X.2018/11-2/14
Sevin, H.D. (2018). Hotel Services In Hospitals. Journal of Tourism and Gastronomy Studies, 6(1), 451-459. https://doi.org/10.21325/jotags.2018.198
Soares, J.B., Marinho, A.S., Fernandes, D., Moreira Gonçalves, B., Camila-Dias, C., Gonçalves, R. et al. (2015). Assessing overall patient satisfaction in inflammatory bowel disease using structural equation modeling. European Journal of Gastroenterology & Hepatology, 27(8), 941-950. https://doi.org/10.1097/MEG.0000000000000385
-319-

Journal of Industrial Engineering and Management – https://doi.org/10.3926/jiem.3143
Soufi, G., Belayachi, J., Himmich, S., Ahid, S., Soufi, M., Zekraoui, A. et al. (2010). Patient satisfaction in an acute medicine department in Morocco. BMC Health Services Research, 10(1), 149. https://doi.org/10.1186/1472-6963-10-149
Suess, C., & Mody, M.A. (2018). Hotel-like hospital rooms’ impact on patient well-being and willingness to pay: An examination using the theory of supportive design. International Journal of Contemporary Hospitality Management, 30(10), 3006-3025. https://doi.org/10.1108/IJCHM-04-2017-0231
Symmank, C., Krause, J., & Gurtner, S. (2015). Stakeholder Variety in Healthcare and Their Integration in the Medical Device Development Process. In Gurtner, S., & Soyez, K. (Eds.), Challenges and Opportunities in Health Care Management (247-258). Springer. https://doi.org/10.1007/978-3-319-12178-9
Tachfouti, N., Bhatti, J.A., Nejjari, C., Kanjaa, N., & Salmi, L.R. (2011). Emergency trauma care for severe injuries in a Moroccan region: conformance to French and World Health Organization standards. Journal for Healthcare Quality, 33(1), 30-38. https://doi.org/10.1111/j.1945-1474.2010.00095.x
The World Bank (2015). Programme pour résultats d’amélioration de la santé primaire dans les zones rurales - Evaluation des systèmes de gestion environnementale et sociale.
Um, K.H., & Lau, A.K.W. (2018). Healthcare service failure: how dissatisfied patients respond to poor service quality. International Journal of Operations and Production Management, 38(5), 1245-1270.
https://doi.org/10.1108/IJOPM-11-2016-0669
United Nations. (2015). Goal 3: Ensure healthy lives and promote well-being for all at all ages. Available at: https://www.un.org/sustainabledevelopment/health/ (Accesed: September 2019)
Verulava, T., Jorbenadze, R., Karimi, L., Dangadze, B., & Barkalaia, T. (2018). Evaluation of Patient Satisfaction with Cardiology Services. The Open Public Health Journal, 11, 201-208. https://doi.org/10.2174/1874944501811010201
Villa, S., Barbieri, M., & Lega, F. (2009). Restructuring patient flow logistics around patient care needs : implications and practicalities from three critical cases. Health Care Management Science, 12(2), 155-165. https://doi.org/10.1007/s10729-008-9091-6
Volland, J., Fügener, A., Schoenfelder, J., & Brunner, J.O. (2017). Material logistics in hospitals: A literature review. Omega, 69, 82-101. https://doi.org/10.1016/j.omega.2016.08.004
WHO (2006). Quality of care: a process for making strategic choices in health systems. Geneva. https://doi.org/10.1542/peds.2010-1791
WHO (2008). Essential Environmental Health Standards in Health Care. Geneva, Switzerland. Available at: https://apps.who.int/iris/bitstream/handle/10665/43767/9789241547239_eng.pdf?sequence=1&isAllowed=y
WHO (2012). WHO recommendations: Optimizing health worker roles to improve access to key maternal and newborn health interventions through task shifting. Geneva, Switzerland. Available at: https://apps.who.int/iris/bitstream/handle/10665/77764/9789241504843_eng.pdf?sequence=1
Journal of Industrial Engineering and Management, 2020 (www.jiem.org)
Article’s contents are provided on an Attribution-Non Commercial 4.0 Creative commons International License. Readers areallowed to copy, distribute and communicate article’s contents, provided the author’s and Journal of Industrial Engineering andManagement’s names are included. It must not be used for commercial purposes. To see the complete license contents, please
visit https://creativecommons.org/licenses/by-nc/4.0/.
-320-