modeling the core metabolism of komagataeibacter … · metabolic models is the constraint-based...
TRANSCRIPT

Brazilian Journalof ChemicalEngineering
ISSN 0104-6632Printed in Brazil
www.scielo.br/bjce
Vol. 35, No. 03, pp. 869-886, July - September, 2018dx.doi.org/10.1590/0104-6632.20180353s20170327
MODELING THE CORE METABOLISM OF Komagataeibacter hansenii ATCC 23769 TO
EVALUATE NANOCELLULOSE BIOSYNTHESISSamara Silva de Souza1, Julia de Vasconcellos Castro1,
and Luismar Marques Porto1,*1 Chemical and Food Engineering Department, Federal University of Santa Catarina.
InteLab - Integrated Technologies Laboratory, Genomic and Tissue Engineering Group. Florianópolis - Santa Catarina, Brazil
(Submitted: June 21, 2017; Revised: August 19, 2017; Accepted: September 1, 2017)
Abstract - Genome-scale metabolic models based on a combination of genome sequence and biochemical information have strongly influenced the field of systems biology. However, basic principles of the operation of metabolic networks, in particular the central metabolism can be easily studied in smaller metabolic (core) models. Komagataeibacter hansenii ATCC 23769 has been used for bacterial nanocellulose (BNC) biosynthesis, and the recent availability of its genome sequence allowed the development of a metabolic model. The core metabolic model was constructed from an initial draft metabolic reconstruction including 74 reactions and 68 metabolites that provides insights for a better understanding of K. hansenii metabolic pathways. The applicability of the model is finally demonstrated by applying the FBA approach, and the in silico simulation successfully predicted the minimal medium and the growing abilities on different substrates. This core model can facilitate system-level metabolic analysis as well as developments for improving BNC production.
Keywords: Komagataeibacter hansenii; Bacterial nanocellulose; Core metabolic model; Flux balance analysis.
INTRODUCTION
Metabolic models have a promising ability to describe cellular phenotypes accurately and to relate the annotated genome sequence to the physiological functions of a cell (Covert et al., 2001; Kim et al., 2015). There is an extensive diversity of unexplored metabolism encoded into the genomes of microorganisms and a huge gap in understanding the link between the genetic information and the resulting phenotype (Blank and Ebert, 2013; Mahadevan et al., 2011). Metabolic models are based on a network of chemical reactions that characterize the vast metabolic network of an organism (Almaas et al., 2004; Shimizu, 2009; Wiechert, 2002). These networks
may be used to generate metabolic states for a given set of environmental conditions.
Genomes of several bacterial strains have been sequenced and annotated, providing information that has been used alongside biochemical and physiological data to reconstruct metabolic networks (Huang et al., 2014; Loira et al., 2012; Terzer et al., 2009; Zhang and Hua, 2015). A comprehensive protocol was developed to describe each step necessary to build a high-quality genome-scale metabolic reconstruction (Thiele and Palsson, 2010). This protocol was properly structured for large-scale metabolic networks and well-studied organisms when several experimental evidences are available to allow the required significant manual curation (Becker et al., 2007; Cheng et al., 2009). Although
*Corresponding author. E-mail address: [email protected]

870 Samara Silva de Souza, Julia de Vasconcellos Castro and Luismar Marques Porto
Brazilian Journal of Chemical Engineering
well-curated genome-scale models were developed, some microorganisms do not have sufficient information available about their metabolic features. In this case, reducing those models to a certain core or module while keeping key elements or/and important functional properties, i.e., to construct metabolic core models, can be a suitable way to study and understand basic principles of the central metabolism. In core models, the reactions and pathways are chosen to represent the most well-known and widely studied metabolic pathways (Orth, 2010). However, for the construction of a core and representative model for organisms with little reported information on their metabolic capabilities, some adaptations in the current protocol were necessary.
The combination of metabolic network reconstruction and constraint-based modeling provides a rich information set from which one can build mathematical models of biological interest (Barabási and Oltvai, 2004). Moreover, computational tools have been developed to predict fluxes in biochemical networks, thereby integrating different fields such as systems biology, bioinformatics and metabolic engineering (Fernández-Castané et al., 2014; Ishii et al., 2004; McCloskey et al., 2013). Flux Balance Analysis (FBA) has been successfully applied to obtain growth predictions, theoretical product yields and for a global estimation of flux distribution within the metabolism of different organisms (Grafahrend-Belau et al., 2014; Reed, 2012). Critical steps in FBA are the reconstruction of a metabolic network, followed by mass balance, imposition of constraints, choice of a suitable (biologically relevant) objective function and linear optimization (Angeles-Martinez and Theodoropoulos, 2016; Orth et al., 2010; Raman and Chandra, 2009). Simulation results can be a useful guide for metabolic engineering (Liu et al., 2014; Simeonidis and Price, 2015). Currently, a popular tool for investigating complex metabolic models is the constraint-based reconstruction and analysis (COBRA), a MATLAB(r) (MathWorks Inc.) toolbox (Becker et al., 2007; Schellenberger et al., 2011). Our group has developed a set of computational systems biology tools, called GEnSys (Genomic Engineering System), which comprises several modules that allow analysis and simulation of biochemical reaction networks, for instance, flux balance analysis (FBA) (Bagnariolli et al., 2010).
Komagataeibacter hansenii ATCC 23769 (formerly Gluconacetobacter hansenii) (Iyer et al., 2010; Yamada et al., 2012) produces, as a result of the fermentation process, a microstructured nanocellulose with high purity (Benziman et al., 1980; Deinema and Zevenhuizen, 1971; Ross et al., 1991). Bacterial nanocellulose (BNC) is a potential material for medical applications and it has been
commonly applied as wound dressing and temporary skin replacement (Cheng et al., 2009; Hutchens et al., 2007; Jorfi and Foster, 2015; Jozala et al., 2016). Given the importance of bacterial nanocellulose-based biomaterials in tissue engineering, an in silico core metabolic model of K. hansenii can provide new strategic insights into the BNC synthesis and be useful in the study of typical synthesis conditions, such as different growth media, environmental conditions and formation of bioproducts. K. hansenii is not the most commonly studied model bacterium for BNC production, such as K. xylinum, however it has the ability, as well, to produce nanocellulose (Ramana et al., 2000; Ruka et al., 2012; Zeng et al., 2011).
Here, a core metabolic model of K. hansenii ATCC 23769 was developed, based on the draft assembly of the genome of this bacterium (GenBank accession no. CM000920 and taxonomy ID: 714995) (Iyer et al., 2010). Through simulation, relevant physiological scenarios were studied. The FBA approach was performed to simulate different conditions and maximize specific reactions to understand the effects of nanocellulose production and distribution of cellular fluxes by varying three carbon sources: glucose, mannitol and glycerol under minimal nutritional requirements. These carbon sources were chosen because they are known to lead to differences in the nanocellulose microstructure, which have different fiber densities (Mikkelsen et al., 2009; Ruka et al., 2012). This in silico model can facilitate system-level metabolic analysis and allow experiments with K. hansenii growing in a defined medium that enables controlled experiments since the exact composition of nutrients is known.
MATERIALS AND METHODS
Draft reconstruction
The reconstruction process of the K. hansenii core metabolic model involved the following steps, as outlined in Figure 1: (1) creation of a draft model (draft reconstruction); (2) reconstruction of a detailed model (manual curation to build the core model); (3) conversion into a mathematical format (FBA; mathematical formulation); (4) analysis of the network (model simulation).
The annotated data of the draft genome sequence of K. hansenii (NCBI ID 714995; ACCESSION NZ CM000920, 3636659 bp) (Iyer et al., 2010) were used in two different platforms that can map genes to reactions in an automated manner and allow exporting all reactions and metabolites to a SBML file, to create two different drafts models. The first one was the software Pathway

Brazilian Journal of Chemical Engineering Vol. 35, No. 03, pp. 869-886, July - September, 2018
871Modeling the core metabolism of Komagataeibacter hansenii ATCC 23769 to evaluate nanocellulose biosynthesis
Tools (SRI International), version 16.5 (Karp et al., 2002, 2009; Paley et al., 2012) that gives a raw draft model file as a result. The second one was the web-based resource, called Model SEED (Devoid et al., 2013), where the assembled genome sequence is annotated by the RAST server, which provides a semi-automated curation of the draft model. The set of reactions from the drafts contains incorrect or unbalanced stoichiometry, missing reactions and mistakes from the annotated sequence and neither of these approaches replace a careful manual curation. The resources used during the reconstruction are summarized in Table 1.
Manual curation
The basic principles of the operation of metabolic networks, in particular of the central metabolism, can sometimes be more easily studied in smaller scale models, known as core models (Hädicke and Klamt, 2017). As the goal is to construct a core model that represents the central metabolism of K. hansenii in detail, the reactions and metabolites involved in glycolysis, pentose phosphate pathway, Entner-Doudoroff pathway, tricarboxylic acid cycle, and key reactions of the electron transport chain were included in the model. To improve network connectivity and decrease the number of dead-end metabolites, the
reactions not inferred in the automatic drafts models were added during manual curation. Such reactions include: (1) spontaneous reactions; (2) extracellular transport reactions; (3) intracellular transport reactions; and (4) exchange reactions, which allows specific molecules through the system and environment and (5) reactions of cellulose biosynthesis common to microorganism producers.
Biochemistry textbooks and biochemical digital databases, including KEGG (Kanehisa et al., 2006, 2010), BRENDA (Scheer et al., 2011), ExPASy (Gasteiger et al., 2003) and the platform IMG (Integrated Microbial Genomes) (Markowitz et al., 2012) were used to verify the reactions. A biochemical thermodynamics calculator, eQuilibrator (Flamholz et al., 2012), was used to check the reversibility and stoichiometry of the reactions. The metabolic reactions in the model were organized into two compartments (cytoplasm and extracellular) based on the localization of associated enzymes. Then, we organized the reactions into pathways/subsystems. For each metabolite, the charge, formula and identification were compiled from the KEGG database.
The last step was the incorporation of a biomass reaction. In order to represent growth, the core K. hansenii model includes a biomass reaction, which drains precursor
Figure 1. Schematic illustration of the network reconstruction. The four steps used in the present work are: 1) creation of a draft model using automated resources, 2) manual curation to construct the core model, 3) conversion of the model into a mathematical format and, 4) biological analysis of the network through simulations.

872 Samara Silva de Souza, Julia de Vasconcellos Castro and Luismar Marques Porto
Brazilian Journal of Chemical Engineering
metabolites from the network. The biomass composition data for K. hansenii used in this study was obtained from the literature (Edirisinghe et al., 2016). The reaction of the biomass included internal protons and water (Appendix - Table A1). The amount of water required is equal to the amount of hydrolyzed ATP to satisfy the ATP growth requirement. The ATP hydrolysis results in the production of one proton, while using NADPH as NADH consumes one proton, resulting in the production of protons in the biomass reaction. All precursors were added to the molecules to perform oxidation (NAD), reduction (NADPH) and provide energy (ATP), resulting in 1 mol of biomass, which is the amount of biomass produced with these compounds. Missing reactions (referred to as gaps) that resulted in dead-end metabolites and prevented the computational simulation of cell growth were identified and filled in. The procedure was continued until all the biomass components were include. This ensures that the reduced network contains at least all protected reactions and, additionally, a set of biosynthesis routes that produces all components consumed by the biomass synthesis reaction. In total, 74 reactions and their reactants have been protected in the central metabolism as listed in the Appendix (Tables A1 and A2).
The in silico minimal medium composition capable of supporting growth of K. hansenii chosen was the Yamanaka medium (Yamanaka et al., 1989), which is composed of 50 g∙L-1 (carbon source), 5 g∙L-1 (nitrogen source) and 3 g∙L-1 (phosphate source). Three different carbon sources (glucose, mannitol and glycerol) were used to calculate the carbon flux through different pathways. The uptake rates of nitrogen and phosphate sources were determined according to the composition of the medium and we used experimental data in continuous culture since the FBA approach assumes steady state and generates
predictions that are consistent with continuous culture. Biomass concentration and dilution rate values were estimated to calculate and infer the maximum uptake rates of nitrogen ((NH4)2SO4) and phosphate sources (KH2PO4) in the model.
Flux Balance Analysis (FBA)
The metabolic flux distribution of the core model of K. hansenii was calculated using FBA. With this approach, it was possible to obtain the optimal solution for the intracellular fluxes by optimizing an objective function. The core model was converted into a mathematical representation known as a stoichiometric matrix. The stoichiometric matrix (S) consists of rows of metabolites and columns of reactions, and is the basis from which all constraints-based modeling is carried out. The converted core model is expressed as a stoichiometric model represented by a pseudo steady-state system of mass balance equations dc/dt = S ∙ v = 0, where v corresponds to a vector of all reaction fluxes in the network (Feist, 2009; Orth et al., 2010). To identify optimal solutions in the vast solution space, we defined FBA objective functions to solve the system of linear equations that represent the mass balance constraints. In this study, we evaluated four scenarios for biologically meaningful predictions: (i) maximization of biomass yield; (ii) maximization of nanocellulose synthesis, product of greatest interest derived from the bacterium K. hansenii; (iii) the maximization of the external metabolites to evaluate the balance consistency; and (iv) the ability to synthesize precursors of biomass by adding demand reactions. Moreover, metabolic flux distribution was estimated under limitations of some nutrients, such as phosphate and nitrogen source.
Table 1. Online resources for the reconstruction of the metabolic network of K hansenii.RESOURCE URLGenome sequence (NCBI) http://www.ncbi.nlm.nih.gov/genome/?term=gluconacetobacter%20hanseniiIMG – Integrated Microbial Genomes http://img.jgi.doe.gov/cgi-bin/w/main.cgiKyoto Encyclopedia of Genes and Genomes http://www.genome.jp/kegg/pathway.htmlExPASy Biochemical Pathways http://www.expasy.ch/cgi-bin/search-biochem-indexBRENDA http://www.brenda-enzymes.orgUniprot http://www.uniprot.org/uniprot/?query=gluconacetobacter%20hansenii&sort=scoreSEED http://pubseed.theseed.orgeQuilibrator http://equilibrator.weizmann.ac.ilSBML validator http://sbml.org/validatorMATLAB® http://www.mathworks.comPathway Tools version 16.5 http://bioinformatics.ai.sri.com/ptoolsCOBRA (Constraint-based reconstruction and analysis) toolbox http://opencobra.sourceforge.net/openCOBRA/Welcome.htmlGNU linear programming toolkit (GLPK) http://glpkmex.sourceforge.netSBMLToolbox version 4.0.1 http://www.sbml.orglibSBML library 4.0.1 http://sbml.org/Software/libSBMLrBioNet http://sourceforge.net/projects/opencobra/files/cobra/foundry/rBioNetGEnSys Available upon request from the authors.
Brazilian Journal of Chemical Engineering Vol. 35, No. 03, pp. 869-886, July - September, 2018
873Modeling the core metabolism of Komagataeibacter hansenii ATCC 23769 to evaluate nanocellulose biosynthesis
The constraints for the upper and lower bounds of reversible and irreversible reactions were defined as -∞ ≤ vi ≤ ∞ and 0 ≤ vi ≤ ∞, respectively. For irreversible reactions, the lower bound was set to zero and for reversible reactions, lower and upper bounds were typically set to arbitrarily large values. Besides defining the directions of all metabolic reactions, these constraints were used to specify a maximum flux through a given reaction or to specify a measured substrate uptake rate. Exchange reactions were added to enable uptake and secretion of extracellular metabolites for simulations. The stoichiometry and the reversibility of each reaction, together with the steady state assumption for the internal metabolites, allow defining a region of feasible flux distribution.
Model simulation
The core metabolic network of K. hansenii was built and loaded into MATLAB(r) (MathWorks Inc.) using functions available in the GEnSys toolbox (Bagnariolli et al., 2010). The GenSys Toolbox is available upon request. By using Flux Balance Analysis (FBA), we investigated the core metabolic network of K. hansenii through simulations. The flux values were expressed in mmol∙gDW-1∙h-1. For the simulation of aerobic growth on minimal medium, we allowed the following external metabolites to freely enter and leave the network: O2, H
+, CO2, H2O, NH4
+ and PO43-. With the minimal medium,
each carbon source was allowed to enter into the in silico core model one by one by adding exchange reactions (if there was no corresponding one) for the sake of simulating the growth under different environmental conditions.
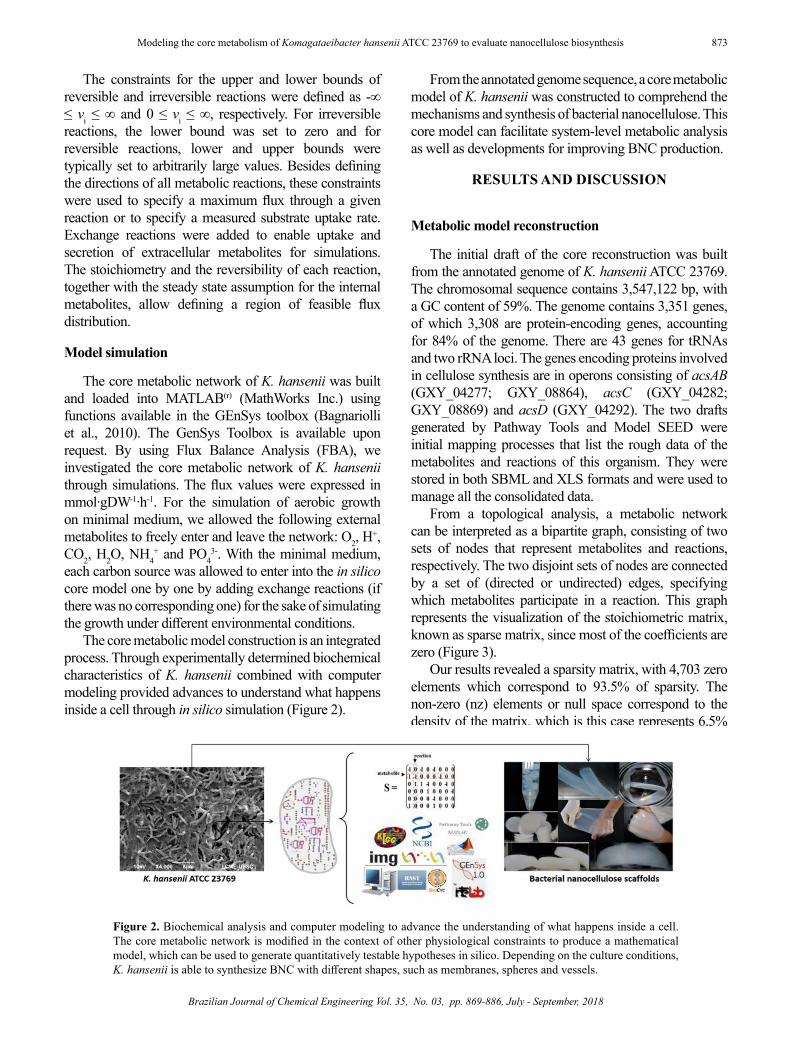
The core metabolic model construction is an integrated process. Through experimentally determined biochemical characteristics of K. hansenii combined with computer modeling provided advances to understand what happens inside a cell through in silico simulation (Figure 2).
From the annotated genome sequence, a core metabolic model of K. hansenii was constructed to comprehend the mechanisms and synthesis of bacterial nanocellulose. This core model can facilitate system-level metabolic analysis as well as developments for improving BNC production.
RESULTS AND DISCUSSION
Metabolic model reconstruction
The initial draft of the core reconstruction was built from the annotated genome of K. hansenii ATCC 23769. The chromosomal sequence contains 3,547,122 bp, with a GC content of 59%. The genome contains 3,351 genes, of which 3,308 are protein-encoding genes, accounting for 84% of the genome. There are 43 genes for tRNAs and two rRNA loci. The genes encoding proteins involved in cellulose synthesis are in operons consisting of acsAB (GXY_04277; GXY_08864), acsC (GXY_04282; GXY_08869) and acsD (GXY_04292). The two drafts generated by Pathway Tools and Model SEED were initial mapping processes that list the rough data of the metabolites and reactions of this organism. They were stored in both SBML and XLS formats and were used to manage all the consolidated data.
From a topological analysis, a metabolic network can be interpreted as a bipartite graph, consisting of two sets of nodes that represent metabolites and reactions, respectively. The two disjoint sets of nodes are connected by a set of (directed or undirected) edges, specifying which metabolites participate in a reaction. This graph represents the visualization of the stoichiometric matrix, known as sparse matrix, since most of the coefficients are zero (Figure 3).
Our results revealed a sparsity matrix, with 4,703 zero elements which correspond to 93.5% of sparsity. The non-zero (nz) elements or null space correspond to the density of the matrix, which is this case represents 6.5%
Figure 2. Biochemical analysis and computer modeling to advance the understanding of what happens inside a cell. The core metabolic network is modified in the context of other physiological constraints to produce a mathematical model, which can be used to generate quantitatively testable hypotheses in silico. Depending on the culture conditions, K. hansenii is able to synthesize BNC with different shapes, such as membranes, spheres and vessels.

874 Samara Silva de Souza, Julia de Vasconcellos Castro and Luismar Marques Porto
Brazilian Journal of Chemical Engineering
was used to obtain a linear programming problem. The four physiological scenarios of interest were defined as objective functions: (i) maximization of biomass yield; (ii) maximization of nanocellulose synthesis; (iii) maximization of the external metabolites; and (iv) the ability to synthesize precursors of biomass by adding demand reactions. Each objective function was tested with the addition of constraints (Table 2) to identify which one was the most appropriate for predicting fluxes by FBA.
With the FBA technique, the carbon sources were chosen to evaluate the capability of K. hansenii to grow on each carbon source supplemented in the minimal medium. Glucose and mannitol uptake rates were 10 mmol∙gDW-
1∙h-1 and glycerol uptake rate was 20 mmol∙gDW-1∙h-1. Uptake rates were established based on the C-mol of each carbon source. Glucose and mannitol are six-carbon sources, while glycerol is a three-carbon source. The rates were obtained by dividing the concentration (g(L-
1) of each source by its molar mass (g(mol-1), and then multiplying it by the specific dilution rate (h-1) divided by biomass concentration (gDW(L-1). Also, for the correct mass balance of the model, glycerol needed to enter twice as much as the other carbon sources.
In order to analyze the metabolic flux for these different carbon sources at the same dilution rate and to prevent the wash out, a dilution rate of 0.05·h was chosen for the experiments, based on previous studies which revealed a high growth yield using a low dilution rate (Olijve and Kok, 1979). For simulation of aerobic growth on Yamanaka medium, the following external metabolites were allowed to freely enter and leave the network: O2, H
+, CO2, H2O, NH4
+ and PO43-, except for the carbon sources.
Since the nutrients, such as nitrogen and phosphate, are not considered unlimited, the maximum uptake rates of nitrogen and phosphate were calculated to determine which combination results in an optimal growth of bacterial nanocellulose. A maximum uptake rate of 1.26 mmol∙gDW-1∙h-1 and 0.78 mmol∙gDW-1∙h-1, for nitrogen and phosphate, respectively, were set as lower boundaries (-1.26 ≤ v ≤ 1000 mmol∙gDW-1∙h-1) and (-0.78 ≤ v ≤ 1000 mmol∙gDW-1∙h-1). The oxygen uptake was set as a virtually unlimited flux (-1000 ≤ v ≤ 1000 mmol∙gDW-1∙h-1), because K. hansenii is an aerobic bacterium.
The COBRA Toolbox generated the Systems Biology Markup Language (SBML) file of the core model. The XML-based data format is presented in the Supplementary file I "sbml_coremodel". The FBA method computes the maximal growth yield achievable in the core metabolic model by maximizing the biomass reaction flux (v74). By maximizing the biomass reaction (Figure 4) the carbon flux was used for the bacterial growth, without any production of cellulose (reaction v5) (See reactions in the
Figure 3. Sparse matrix of the K. hansenii core model. The matrix contains 329 non-zero elements (blue points), with 4,703 zero elements (white points). Its sparsity is 93.5%, and its density is 6.5%.
(nz=329). A sparsity matrix indicates that most substrates participate in only a few reactions, whereas a small number of metabolites, such as ATP, NADPH, NADH, participate in a very large number of reactions. These more interconnected metabolites play important roles in the metabolic network: for example, the stability in the transport of such metabolites inside or outside the network can affect the organization of regulatory mechanisms. Generally, metabolic networks are considered to be sparse and sparsity has been used as a criteria for inferring linear network models.
In silico capabilities of the K. hansenii core metabolic model
Model simulations were carried out to obtain insights on the metabolic network and the flux distribution. The metabolic flux analysis combines a set of measured fluxes (often extracellular), with a constraint-based model to obtain an estimate of all the fluxes. In this case, the uptake and consumption rates for all three carbon sources and for nitrogen and phosphate sources were set, as shown in Table 2.
The network contains 79 metabolites and 74 fluxes. Of those, 68 are internal metabolites, resulting in 6 degrees of freedom and the stoichiometric matrix consisted of 68 rows and 74 columns. The matrix included exchange reactions to allow metabolites to be taken up or excreted to the extracellular medium, and transport reactions to allow the uptake of metabolites. Because the number of measured fluxes is less than the degrees of freedom of the matrix, the solution space will have infinite solutions. To determinate the optimal solution, an objective function

Brazilian Journal of Chemical Engineering Vol. 35, No. 03, pp. 869-886, July - September, 2018
875Modeling the core metabolism of Komagataeibacter hansenii ATCC 23769 to evaluate nanocellulose biosynthesis
appendix - Table A1). This is a biological representative scenario since there are strains that do not produce cellulose (Iguchi et al., 2000).
Flux distribution using glycerol as a carbon source revealed that the pentose phosphate pathway was not favored (Figure 4). The fraction of carbon directed to the pentose phosphate pathway was growth-rate dependent. The specific growth rates per hour were µ = 1.93 in glucose, and lower in mannitol, µ = 0.72 and µ = 0.84 in glycerol, under minimal nutritional requirements. These results indicated that the bacterium has the metabolic machinery needed to use all those carbon sources for growth competence. This is the first reported in silico prediction of K. hansenii metabolic capabilities under a minimal medium growth condition. We have tested the hypothesis that K. hansenii uses its metabolism to grow at a maximal rate using the core metabolic model. Based on this hypothesis, further studies should be performed to describe the quantitative relationship between glucose uptake rate, oxygen uptake rate, and maximal cellular growth rate.
The second scenario was the maximization of nanocellulose synthesis. In this case, we used this reaction of BNC production (v5) as objective function. During the analysis, the results revealed that this flux is a suitable objective function and predicts the theoretical yield of nanocellulose, since the biomass flux (cell growth) was zero under that constraint. Thus, the majority of the carbon flux is directed to the production of nanocellulose, and there was no carbon used to produce biomass. The theoretical nanocellulose yield was calculated per mol of carbon of the substrate consumed: 0.95 C-mol/C-mol of glucose, 0.5 C-mol/C-mol of mannitol and 0.6 C-mol/C-mol of glycerol, on a Carbon-mol base. These results can be explained by the metabolism of K. hansenii. Glucose is easily transported through the cell membrane and incorporated into the nanocellulose biosynthetic pathway (Oikawa et al., 1995; Ross et al., 1991). Mannitol is known to be converted to fructose, and then metabolized by this organism to produce BNC, while glucose and fructose are
transported through the cell membrane and incorporated into the cellulose biosynthetic pathway. Glycerol, a three-carbon sugar, on the other hand, is introduced into metabolic pathways at the triose phosphate level. The oxidation of triose phosphate is a primary reaction in this organism for the channeling of sugar carbon from the pentose phosphate pathway (PPP) into the tricarboxylic acid cycle (TCA cycle). Biosynthesis of bacterial nanocellulose depends on two amphibolic pathways (anabolism and catabolism): PPP for the oxidation of carbohydrates and TCA for the oxidation of organic acids and related compounds (Brown et al., 1976; Oikawa et al., 1995; Ross et al., 1991).
This could explain the lower theoretical nanocellulose yield using mannitol and glycerol, compared to glucose as carbon source. In terms of BNC yields, there is a variation depending on the strain, the composition of the medium and the operating conditions, such as static or agitated culture, temperature, oxygen and pH (Jozala et al., 2016; Keshk and Sameshima, 2005; Ruka et al., 2012). The core model is consistent with experimental data, since this bacterium can synthesize BNC with all these carbon sources. The central metabolic pathway for the three carbon sources varies in many aspects like the pathway used for catabolism of carbon sources and production of extra-cellular metabolites, as shown in Figure 5.
The inability to metabolize glucose (GLC) via the Embden-Meyerhof pathway in K. hansenii lies in the fact that it lacks phosphofructokinase, which is required for glycolysis (Velasco-Bedrán and López-Isunza, 2007; Zhong et al., 2014). Gluconeogenesis occurs from oxaloacetate (OAA) via pyruvate (PYR), because of the unusual regulation of the enzymes oxaloacetate decarboxylase and pyruvate phosphate dikinase. Thus, cellulose arises in this organism from a metabolic pool of hexose phosphate that is sustained directly by the phosphorylation of exogenous hexoses and indirectly via the pentose phosphate and the gluconeogenic pathways.
The glucose catabolism involves its conversion to glyceraldehyde-3-phosphate and pyruvate via the
Table 2. Composition and boundary conditions of the minimal growth medium for the simulations. The carbon source uptake rates were set and the following external metabolites were allowed to freely enter and leave the network. All the equations are from extracellular [e] compartment to the cytoplasm [c].Reaction description Equation LB * UB *Carbon Source Glucose [e]: glc-D -> 0 10 Mannitol [e]: mann -> 0 10 Glycerol [e]: glyc -> 0 20O2exchange [e]: o2<-> -1000 1000H2O exchange [e]: h2o <-> -1000 1000Proton exchange [e]: h <-> -1000 1000NH4
+exchange (Nitrogen source) [e]: nh4<-> -1.3 1000PO4
-3exchange (Phosphate source) [e]: pi <-> -0.75 1000CO2exchange [e]: co2<-> -1000 1000
*LB: lower bound; UB: upper bound; unit are given in mmol∙gDW-1∙h-1.

876 Samara Silva de Souza, Julia de Vasconcellos Castro and Luismar Marques Porto
Brazilian Journal of Chemical Engineering
Enter-Doudoroff enzymes 6-phosphogluconate dehydro-genase and 2-dehydro-3-deoxyphosphogluconate aldo-lase. Depending on physiological conditions, glucose is converted into 6-phosphogluconate (6PGC) by one of two routes, one of which is oxidative and the other is phos-phorylative. The direct oxidative route involves oxida-tion of glucose to gluconate (GLCN) and gluconokinase. Alternatively, the phosphorylative route involves uptake of glucose by an inducible transport system. Once inside the organism, glucose is phosphorylated by glucokinase and then converted to 6-phosphogluconate by glucose-6--phosphate dehydrogenase. One important metabolite that influenced the nanocellulose synthesis is the gluconic acid production, which our core model predicted, in accordan-ce with previous studies (Hwang et al., 1999; Ishihara et al., 2002; Liu et al., 2016). Our results showed that the three carbon sources, glucose, mannitol and glycerol can be used by K. hansenii under minimal nutritional require-ments. To the best of our knowledge, no previous studies reported a core metabolic model of K. hansenii ATCC 23769. Two metabolic networks of Gluconacetobacter xylinus E25 were developed, the first by Ross (Ross et al., 1991) consisted in 42 reactions, and the second by Zhong and co-workers (Zhong et al., 2013), adapted from Ross' model, consisted of 26 reactions. Zhong and coworkers (2013) performed a metabolic flux analysis (MFA) to
compare the metabolic flux distribution. However, neither of these two networks was built based on the genome se-quence and a flux balance analysis performed.
The third scenario related to the maximization of external metabolites evaluated the balance consistency. For example, to maximize carbon dioxide (CO2_out), 10 mmol∙gDW-1∙h-1 of glucose was fed, resulting in 60 mmol∙gDW-1∙h-1of CO2. This is stoichiometrically consistent, given that glucose has six carbons and the carbon dioxide molecule has only one. The mass balance was checked using all external metabolites.
In the fourth scenario, the ability to synthesize precursors of biomass by adding demand reactions was performed. To verify the fluxes distribution under nutrient deprived conditions, nitrogen, phosphate and oxygen uptake were limited, which means those fluxes were set to zero. Under oxygen limitation conditions the bacterial growth rate, nanocellulose production and all the other main function were null, as expected, confirming aerobic functionality. Limitation of nitrogen and/or phosphate sources was shown to be insufficient to prevent bacterial growth. According to Ross (Ross et al., 1991), in Acetobacter xylinum washed cells, deprived of a nitrogen source, production of nanocellulose continues when supplied with an adequate carbon substrate and does not depend on net protein synthesis. The excess of available
Figure 4. Representation of the most important metabolic fluxes resulting from FBA analysis using the biomass reaction as the objective function. By maximizing this reaction, we proved that all carbon flux was used for bacterial growth without any production of BNC. Glucose as carbon source presented the highest specific growth rates per hour, μ = 1.93. Mannitol and glycerol showed lower growth rates, μ = 0.72 and μ = 0.84, respectively.

Brazilian Journal of Chemical Engineering Vol. 35, No. 03, pp. 869-886, July - September, 2018
877Modeling the core metabolism of Komagataeibacter hansenii ATCC 23769 to evaluate nanocellulose biosynthesis
Figure 5. Representation of the core metabolic network of K. hansenii and the input of three carbon sources: glucose (GLC), mannitol (MANN) and glycerol (GLYC). The microfibrils of BNC and biomass are represented as output. Metabolite abbreviations and reaction details are provided in the Appendix (Tables A1 and A2).

878 Samara Silva de Souza, Julia de Vasconcellos Castro and Luismar Marques Porto
Brazilian Journal of Chemical Engineering
carbon substrate and limitations in other nutrients, such as nitrogen or phosphate, could promote nanocellulose synthesis. Flux consistency implies that each one of the metabolite precursors was produced by the bacterium. By including a demand reaction (reaction that consumes the compound without producing anything) for each metabolite of the biomass reaction, and optimizing demand reaction fluxes, results revealed that the core model could predict each of the biomass constituents, for all carbon sources used.
CONCLUSIONS
In this study, a core metabolic model of K. hansenii ATCC 23769 was developed. The network was constructed by using automatic reconstruction and an iterative process of manual curation based on genomic and bibliome databases. This curated core model accounts for 68 metabolites and 74 reactions and represents an up-to-date database that encompasses the knowledge available in public databases, scientific publications and textbooks on the metabolism of this bacteria.
Flux balance analysis of the model was applied under different physiological scenarios and predicted quantitative relationships between input rates of nutrients, output rates of products and bacterial growth rate. A simplified model could answer simple biological questions and the central carbon metabolism addressed key metabolites. Moreover, the in silico core model successfully predicted the growing abilities on different substrates and gave insights of the use of minimal medium capable to support BNC production. With the increased interest in BNC, the in silico model presented here will be a valuable tool for fundamental research, serving as a starting point for metabolic engineering approaches. The core model is one important step for understanding the nanocellulose production process and contributes to the general knowledge of microbial function and physiology with computational analysis.
ACKNOWLEDGEMENTS
This work was supported by the Financer of Studies and Projects - FINEP (grant 550084/2014-2 MCT/FINEP-COENG), by the Coordination of Improvement of Higher Education Personnel - CAPES (scholarship grant 1118675/2012-1- Samara Silva de Souza) and by the National Council for Scientific and Technological Development - CNPq (grant 402901/2013-4 - MCTI/CNPq/CT-Biotec and scholarship grant 158853/2012-1 CNPq GM/GD - Julia de Vasconcellos Castro). The content is solely the responsibility of the authors and does not necessarily represent the official views of the funding agencies.APPENDIX
REFERENCES
Almaas, E., Kovacs, B., Vicsek, T., Oltvai, Z. N. and Barabasi, A.-L., Global organization of metabolic fluxes in the bacterium Escherichia coli, Nature, 427(6977), 839-843 (2004).
Angeles-Martinez, L. and Theodoropoulos, C., Estimation of flux distribution in metabolic networks accounting for thermodynamic constraints: The effect of equilibrium vs. blocked reactions, Biochem. Eng. J., 105, Part, 347-357 (2016).
Bagnariolli, B., Oliveira, I. L., Castro, J. de V. and Porto, L. M., GEnSys 1.0 - A Systems Biology Toolbox for Complex Biochemical Reaction Networks, in XVIII Brazilian Congress of Chemical Engineering, Foz do Iguaçu. (2010).
Barabási, A.-L. and Oltvai, Z. N., Network biology: understanding the cell's functional organization., Nat. Rev. Genet., 5(2), 101-113 (2004).
Becker, S. A., Feist, A. M., Mo, M. L., Hannum, G., Palsson, B. O. and Herrgard, M. J., Quantitative prediction of cellular metabolism with constraint-based models: the COBRA Toolbox, Nat. Protoc., 2(3), 727-738 (2007).
Benziman, M., Haigler, C. H., Brown, R. M., White, a R. andCooper, K. M., Cellulose biogenesis: Polymerization and crystallization are coupled processes in Acetobacter xylinum., Proc. Natl. Acad. Sci. U. S. A., 77(11), 6678-6682 (1980).
Blank, L. M. and Ebert, B. E., From measurement to implementation of metabolic fluxes, Curr. Opin. Biotechnol., 24(1), 13-21 (2013).
Brown, R. M., Willison, J. H. and Richardson, C. L., Cellulose biosynthesis in Acetobacter xylinum: visualization of the site of synthesis and direct measurement of the in vivo process., Proc. Natl. Acad. Sci. U. S. A., 73(12), 4565-4569 (1976).
Cheng, K.-C., Catchmark, J. and Demirci, A., Enhanced production of bacterial cellulose by using a biofilm reactor and its material property analysis, J. Biol. Eng., 3(1), 12 (2009).
Covert, M. W., Schilling, C. H., Famili, I., Edwards, J. S., Goryanin, I. I., Selkov, E. and Palsson, B. O., Metabolic modeling of microbial strains in silico, Trends Biochem. Sci., 26(3), 179-186 (2001).
Deinema, M. and Zevenhuizen, L. P. T. M., Formation of cellulose fibrils by gram-negative bacteria and their role in bacterial flocculation, Arch. Mikrobiol., 78(1), 42-57 (1971).
Devoid, S., Overbeek, R., DeJongh, M., Vonstein, V., Best, A. and Henry, C., Automated Genome Annotation and Metabolic Model Reconstruction in the SEED and

Brazilian Journal of Chemical Engineering Vol. 35, No. 03, pp. 869-886, July - September, 2018
879Modeling the core metabolism of Komagataeibacter hansenii ATCC 23769 to evaluate nanocellulose biosynthesis
Model SEED, in Systems Metabolic Engineering SE - 2, vol. 985, edited by H. S. Alper, pp. 17-45, Humana Press. (2013).
Edirisinghe, J. N., Weisenhorn, P., Conrad, N., Xia, F., Overbeek, R., Stevens, R. L. and Henry, C. S., Modeling central metabolism and energy biosynthesis across microbial life, BMC Genomics, 17(1), 568 (2016).
Feist, A. M., Reconstruction of biochemical networks in microorganisms, Nat Rev Microbiol, 7(2), 129-143 (2009).
Fernández-Castané, A., Fehér, T., Carbonell, P., Pauthenier, C. and Faulon, J.-L., Computer-aided design for metabolic engineering, J. Biotechnol., 192, Part, 302-313 (2014).
Flamholz, A., Noor, E., Bar-Even, A. and Milo, R., eQuilibrator-the biochemical thermodynamics calculator, Nucleic Acids Res., 40(Database issue), D770-D775 (2012).
Gasteiger, E., Gattiker, A., Hoogland, C., Ivanyi, I., Appel, R. D. and Bairoch, A., ExPASy: the proteomics server for in-depth protein knowledge and analysis, Nucleic Acids Res., 31(13), 3784-3788 (2003).
Grafahrend-Belau, E., Junker, A., Schreiber, F. and Junker, B., Flux Balance Analysis as an Alternative Method to Estimate Fluxes Without Labeling, in Plant Metabolic Flux Analysis SE - 17, vol. 1090, edited by M. Dieuaide-Noubhani and A. P. Alonso, pp. 281-299, Humana Press. (2014).
Hädicke, O. and Klamt, S. EColiCore2: a reference network model of the central metabolism of Escherichia coli and relationships to its genome-scale parent model. Scientific Reports, v. 7, p. 39647, (2017).
Huang, Y., Zhu, C., Yang, J., Nie, Y., Chen, C. and Sun, D., Recent advances in bacterial cellulose, Cellulose, 21(1), 1-30 (2014).
Hutchens, S. A., León, R. V, O'Neill, H. M. and Evans, B. R., Statistical analysis of optimal culture conditions for Gluconacetobacter hansenii cellulose production, Lett. Appl. Microbiol., 44(2), 175-180 (2007).
Hwang, J. W., Yang, Y. K., Hwang, J. K., Pyun, Y. R. and Kim, Y. S., Effects of pH and dissolved oxygen on cellulose production by Acetobacter xylinum BRC5 in agitated culture, J. Biosci. Bioeng., 88(2), 183-188 (1999).
Iguchi, M., Yamanaka, S. and Budhiono, A., Bacterial cellulose-a masterpiece of nature's arts, J. Mater. Sci., 35(2), 261-270 (2000).
Ishihara, M., Matsunaga, M., Hayashi, N. and Tišler, V., Utilization of d-xylose as carbon source for production of bacterial cellulose, Enzyme Microb. Technol., 31(7), 986-991 (2002).
Ishii, N., Robert, M., Nakayama, Y., Kanai, A. and Tomita, M., Toward large-scale modeling of the microbial cell for computer simulation, J. Biotechnol., 113(1-3), 281-294(2004).
Iyer, P. R., Geib, S. M., Catchmark, J., Kao, T. H. and Tien, M., Genome sequence of a cellulose-producing bacterium, Gluconacetobacter hansenii ATCC 23769, J. Bacteriol., 192(16), 4256-4257 (2010).
Jorfi, M. and Foster, E. J., Recent advances in nanocellulose for biomedical applications, J. Appl. Polym. Sci., 132(14) (2015).
Jozala, A. F., de Lencastre-Novaes, L. C., Lopes, A. M., de Carvalho Santos-Ebinuma, V., Mazzola, P. G., Pessoa-Jr, A., Grotto, D., Gerenutti, M. and Chaud, M. V., Bacterial nanocellulose production and application: a 10-year overview, Appl. Microbiol. Biotechnol., 100(5), 2063-2072 (2016).
Kanehisa, M., Goto, S., Hattori, M., Aoki-Kinoshita, K. F., Itoh, M., Kawashima, S., Katayama, T., Araki, M. and Hirakawa, M., From genomics to chemical genomics: new developments in KEGG, Nucleic Acids Res., 34(suppl 1), D354-D357 (2006).
Kanehisa, M., Goto, S., Furumichi, M., Tanabe, M. and Hirakawa, M., KEGG for representation and analysis of molecular networks involving diseases and drugs, Nucleic Acids Res., 38(suppl 1), D355-D360 (2010).
Karp, P. D., Paley, S. and Romero, P., The Pathway Tools software., Bioinformatics, 18 Suppl 1, S225-S232 (2002).
Karp, P. D., Paley, S. M., Krummenacker, M., Latendresse, M., Dale, J. M., Lee, T. J., Kaipa, P., Gilham, F., Spaulding, A., Popescu, L., Altman, T., Paulsen, I., Keseler, I. M. and Caspi, R., Pathway Tools version 13.0: Integrated software for pathway/genome informatics and systems biology, Brief. Bioinform., 11(1), 40-79 (2009).
Keshk, S. M. A. S. and Sameshima, K., Evaluation of different carbon sources for bacterial cellulose production, African J. Biotechnol., 4(6), 478-482 (2005).
Kim, B., Kim, W., Kim, D. and Lee, S., Applications of genome-scale metabolic network model in metabolic engineering, J. Ind. Microbiol. Biotechnol., 42(3), 339-348 (2015).
Liu, M., Zhong, C., Zhang, Y. M., Xu, Z. M., Qiao, C. S. and Jia, S. R., Metabolic Investigation in Gluconacetobacter xylinus and Its Bacterial Cellulose Production under a Direct Current Electric Field, Front. Microbiol., 7, 331 (2016).
Liu, Y., Shin, H., Li, J. and Liu, L., Toward metabolic engineering in the context of system biology and

880 Samara Silva de Souza, Julia de Vasconcellos Castro and Luismar Marques Porto
Brazilian Journal of Chemical Engineering
synthetic biology: advances and prospects, Appl. Microbiol. Biotechnol., 99(3), 1109-1118 (2014).
Loira, N., Dulermo, T., Nicaud, J.-M. and Sherman, D., A genome-scale metabolic model of the lipid-accumulating yeast Yarrowia lipolytica, BMC Syst. Biol., 6(1), 35 (2012).
Mahadevan, R., Palsson, B. Ø. and Lovley, D. R., In situ to in silico and back: elucidating the physiology and ecology of Geobacter spp. using genome-scale modelling, Nat Rev Micro, 9(1), 39-50 (2011).
Markowitz, V. M., Chen, I.-M. A., Palaniappan, K., Chu, K., Szeto, E., Grechkin, Y., Ratner, A., Jacob, B., Huang, J., Williams, P., Huntemann, M., Anderson, I., Mavromatis, K., Ivanova, N. N. and Kyrpides, N. C., IMG: the integrated microbial genomes database and comparative analysis system, Nucleic Acids Res., 40(D1), D115-D122 (2012).
McCloskey, D., Palsson, B. Ø. and Feist, A. M., Basic and applied uses of genome-scale metabolic network reconstructions of Escherichia coli., Mol. Syst. Biol., 9(1), 661 (2013).
Mikkelsen, D., Flanagan, B. M., Dykes, G. a. and Gidley, M. J., Influence of different carbon sources on bacterial cellulose production by Gluconacetobacter xylinus strain ATCC 53524, J. Appl. Microbiol., 107(2), 576-583 (2009).
Oikawa, T., Ohtori, T. and Ameyama, M., Production of Cellulose from D-Mannitol by Acetobacter xylinum KU-1, Biosci. Biotechnol. Biochem., 59(2), 331-332 (1995).
Olijve, W. and Kok, J. J.: An analysis of the growth of Gluconobacter oxydans in chemostat cultures, Arch. Microbiol., 121(3), 291-297 (1979).
Orth, J. D., Thiele, I. and Palsson, B. Ø., What is flux balance analysis?, Nat. Biotechnol., 28(3), 245-248 (2010).
Orth J, F. R. P. B., Reconstruction and Use of Microbial Metabolic Networks: the Core Escherichia coli Me-tabolic Model as an Educational Guide, EcoSal Plus. Available from: http://www.asmscience.org/content/journal/ecosalplus/10.1128/ecosalplus.10.2.1. (2010).
Paley, S. M., Latendresse, M. and Karp, P. D., Regulatory network operations in the Pathway Tools software, BMC Bioinformatics, 13(1), 243 (2012).
Palsson, B. O., Systems Biology: Properties of Reconstructed Networks. (2006).
Raman, K. and Chandra, N., Flux balance analysis of biological systems: Applications and challenges, Brief. Bioinform., 10(4), 435-449 (2009).
Ramana, K., Tomar, A. and Singh, L., Effect of various carbon and nitrogen sources on cellulose synthesis by
Acetobacter xylinum, World J. Microbiol. Biotechnol., 16, 245-248 (2000).
Reed, J. L., Shrinking the Metabolic Solution Space Using Experimental Datasets, PLoS Comput Biol, 8(8), e1002662 (2012).
Ross, P., Mayer, R. and Benziman, M., Cellulose biosynthesis and function in bacteria., Microbiol. Rev., 55(1), 35-58 (1991).
Ruka, D. R., Simon, G. P. and Dean, K. M., Altering the growth conditions of Gluconacetobacter xylinus to maximize the yield of bacterial cellulose, Carbohydr. Polym., 89(2), 613-622 (2012).
Scheer, M., Grote, A., Chang, A., Schomburg, I., Munaretto, C., Rother, M., Söhngen, C., Stelzer, M., Thiele, J. and Schomburg, D., BRENDA, the enzyme information system in 2011, Nucleic Acids Res., 39(suppl 1), D670-D676 (2011).
Schellenberger, J., Que, R., Fleming, R. M. T., Thiele, I., Orth, J. D., Feist, A. M., Zielinski, D. C., Bordbar, A., Lewis, N. E., Rahmanian, S., Kang, J., Hyduke, D. R. and Palsson, B. O., Quantitative prediction of cellular metabolism with constraint-based models: the COBRA Toolbox v2.0, Nat. Protoc., 6(9), 1290-1307 (2011).
Shimizu, K., Toward systematic metabolic engineering based on the analysis of metabolic regulation by the integration of different levels of information, Biochem. Eng. J., 46(3), 235-251 (2009).
Simeonidis, E. and Price, N., Genome-scale modeling for metabolic engineering, J. Ind. Microbiol. Biotechnol., 42(3), 327-338 (2015).
Terzer, M., Maynard, N. D., Covert, M. W. and Stelling, J., Genome-scale metabolic networks, Wiley Interdiscip. Rev. Biol. Med., 1(3), 285-297 (2009).
Thiele, I. and Palsson, B. O., A protocol for generating a high-quality genome-scale metabolic reconstruction, Nat. Protoc., 5(1), 93-121 (2010).
Velasco-Bedrán, H. and López-Isunza, F., The unified metabolism of Gluconacetobacter entanii in continuous and batch processes, Process Biochem., 42(8), 1180-1190 (2007).
Wiechert, W., Modeling and simulation: tools for metabolic engineering, J. Biotechnol., 94(1), 37-63 (2002).
Yamada, Y., Yukphan, P., Lan Vu, H. T., Muramatsu, Y., Ochaikul, D., Tanasupawat, S. and Nakagawa, Y., Description of Komagataeibacter gen. nov., with proposals of new combinations (Acetobacteraceae), J. Gen. Appl. Microbiol., 58(5), 397-404 (2012).
Yamanaka, S., Watanabe, K., Kitamura, N., Iguchi, M., Mitsuhashi, S., Nishi, Y. and Uryu, M., The structure

Brazilian Journal of Chemical Engineering Vol. 35, No. 03, pp. 869-886, July - September, 2018
881Modeling the core metabolism of Komagataeibacter hansenii ATCC 23769 to evaluate nanocellulose biosynthesis
and mechanical properties of sheets prepared from bacterial cellulose, J. Mater. Sci., 24(9), 3141-3145 (1989).
Zeng, X., Liu, J., Chen, J., Wang, Q., Li, Z. and Wang, H., Screening of the common culture conditions affecting crystallinity of bacterial cellulose, J. Ind. Microbiol. Biotechnol., 38(12), 1993-1999 (2011).
Zhang, C. and Hua, Q., Applications of Genome-Scale Metabolic Models in Biotechnology and Systems Medicine, Front. Physiol., 6, 413 (2015).
Zhong, C., Zhang, G.-C., Liu, M., Zheng, X.-T., Han, P.-P. and Jia, S.-R., Metabolic flux analysis of Gluconacetobacter xylinus for bacterial cellulose production, Appl. Microbiol. Biotechnol., 97(14), 6189-6199 (2013).
Zhong, C., Li, F., Liu, M., Yang, X.-N., Zhu, H.-X., Jia, Y.-Y., Jia, S.-R. and Piergiovanni, L., Revealing Differences in Metabolic Flux Distributions between a Mutant Strain and Its Parent Strain Gluconacetobacter xylinus CGMCC 2955, PLoS One, 9(6), e98772 (2014).
Table A1. List of all biochemical reactions of the core model network.
Abbrev RxN Description Equation Equation EC GENE Subsistem
v1_gli glucose transport in/out via diffusion reversible GLC_x -> GLC D-glucose_out ->D-glucose
v2_o2 O2 transport via diffusion O2_x -> O2 Oxygen_out <=> Oxygen v3_co2 CO2 transport via diffusion CO2_x <-> CO2 Carbon dioxide_out <=>Carbon dioxide
v4_bio biomass transport out BIOMASS -> BIOMASS_x biomass -> biomass_out
v5_cell cellulose transport out CELL -> CELL_x cellulose ->Cellulose_out v6_mann mannitol transport in/out
via diffusion reversible MANN_x -> MANN mannitol_out-> mannitol
v7_nh4 nitrogen transport NH4_x <-> NH4 ammonium_out<=> ammonium
v8_glyc glycerol transport in/out via diffusion reversible GLYC_x -> GLYC Glycerol_out -> Glycerol
v9_h2o water transport H2O_x <-> H2O water_out <-> water v10_glcn gluconate - gluconic acid
transport GLCN -> GLCN_x Gluconate -> Gluconate_out
v11_h proton transport H_x <-> H hidrogen_out <-> hidrogen
v12_pi phosphate transport PI_x + ATP + H2O -> PI + ADP + H
phosphate_out + atp + water <-> phosphate + adp + proton
v13 R00299 glucokinase GLC + ATP -> ADP + G6P
ATP + D-glucose <->ADP + D-Glucose 6-phosphate 2.7.1.2 GXY_05501, GXY_13683(putative) Glycolysis/Gluconeogenesis
v14 R00741 phosphoglucoisomerase G6P <-> F6P D-Glucose 6-phosphate <=> D-Fructose 6-phosphate 5.3.1.9 GXY_02166 Glycolysis/Gluconeogenesis
v15 R00762 fructose difosfatos FDP + H2O -> F6P + PI Fructose 1,6-bisphosphate + H2O => D-Fructose 6-phosphate + Orthophosphate 3.1.3.11 GXY_08300 (glpX) Glycolysis/Gluconeogenesis
v16 R01068 fructose-bisphosphate aldolase FDP <-> DHAP + G3P Fructose 1,6-bisphosphate <=> Glycerone
phosphate + D-Glyceraldehyde 3-phosphate 4.1.2.13 GXY_08305, GXY_09124 Glycolysis/Gluconeogenesis
v17 R01015 triosephosphate isomerase DHAP <-> G3P Glycerone phosphate<-> D-Glyceraldehyde 3-phosphate 5.3.1.1 GXY_10284 Glycolysis/Gluconeogenesis
v18 R01061glyceraldehyde
3-phosphate dehydrogenase
G3P + NAD + PI -> 13-DPG + NADH_x + H
D-Glyceraldehyde 3-phosphate + NAD+ + Orthophosphate<=> 3-Phospho-D-glyceroyl
phosphate + NADH + H+1.2.1.12 GXY_04003 Glycolysis/Gluconeogenesis
v19 R01512 phosphoglycerate kinase 13-DPG + ADP + PI <-> ATP + 3-PG
3-Phospho-D-glyceroyl phosphate + ADP <-> ATP + 3-Phospho-D-glycerate 2.7.2.3 GXY_03998 (pgk) Glycolysis/Gluconeogenesis
v20 R01518 phosphoglycerate mutase 3-PG <-> 2-PG 3-Phospho-D-glycerate <=> 2-Phospho-D-glycerate 5.4.2.1 GXY_02671,GXY_12768 Glycolysis/Gluconeogenesis
v21 R00658 phosphopyruvate hydratase/enolase 2-PG <-> PEP + H2O 2-Phospho-D-glycerate <=>
Phosphoenolpyruvate + H2O 4.2.1.11 GXY_10254 (eno) Glycolysis/Gluconeogenesis
v22 R00200 pyruvate kinase PEP + ADP + H -> ATP + PYR
Phosphoenolpyruvate + ADP => ATP + Pyruvate 2.7.1.40 GXY_00359 Glycolysis/Gluconeogenesis
v23 R00209 pyruvate dehydrogenase complex
PYR + NAD + COA -> ACCOA_x + NADH_x
+ CO2
Pyruvate + NAD+ + CoenzimaA<=> Acetyl-CoA + CO2 + NADH + H+
(2.3.1.12 and
1.8.1.4 and
1.2.4.1)
(GXY_16242 OR GXY_10329 OR GXY_07680) - (GXY_03931
OR(GXY_03931 AND GXY_03943) - (GXY_15912 OR (ilvH AND
GXY_00049) OR (GXY_10324 AND GXY_10319) OR (GXY_13548 OR
GXY_15937)
Glycolysis/Gluconeogenesis
v24 R00206 pyruvate phosphate dikinase
PYR + ATP + PI -> AMP + PEP + PPI
ATP + Pyruvate + Orthophosphate <=> AMP + Phosphoenolpyruvate + Diphosphate 2.7.9.1 GXY_08205 Glycolysis/Gluconeogenesis
v25 R00217 oxaloacetate decarboxylase OAA + ADP + PI -> PYR + ATP + CO2
Oxaloacetate + ADP + phosphate -> pyruvate + ATP + CO2 4.1.1.3 Glycolysis/Gluconeogenesis
v26 R00345 phosphoenolpyruvate carboxylase
PEP + H2O + CO2 -> OAA + PI + H
Phosphoenolpyruvate + H2O + CO2 -> + Oxaloacetate + Orthophosphate 4.1.1.31 GXY_12143 Glycolysis/Gluconeogenesis
v27 R08639 phosphoglucomutase G6P -> G1P D-Glucose 6-phosphate -> D-Glucose 1-phosphate 5.4.2.2 GXY_09809 Glycolysis/Gluconeogenesis
APPENDIX

882 Samara Silva de Souza, Julia de Vasconcellos Castro and Luismar Marques Porto
Brazilian Journal of Chemical Engineering
Abbrev RxN Description Equation Equation EC GENE Subsistem
v28 R00289 uridine glucose pyrophosphorylase
G1P + UTP + H -> UDPG + PPI
D-Glucose 1-phosphate + UTP + H <=> UDP-glucose + Diphosphate 2.7.7.9 GXY_10109 Starch and sucrose
metabolism
v29 R02889 cellulose - UDP forming UDPG -> UDP + CELL UDP-glucose-> UDP + Cellulose 2.4.1.12 GXY_04277, GXY_08869 Starch and sucrose metabolism
v30 GLC + Q8 + H2O -> GLCN + Q8H2
D-Glucose + Ubiquinone + H2O => Gluconate + Ubiquinol
v31 R01737 gluconokinase/gluconate dehydrogenase
GLCN + ATP -> ADP + 6-PGC + H
D-Gluconic acid/gluconate + atp ->ADP + 6-Phospho-D-gluconate 2.7.1.12 GXY_02201,GXY_12403 pentose phosphate
v32 R00835 glucose-6-phosphate dehydrogenase
G6P + NADP_x <-> 6-PGL + NADPH
D-Glucose 6-phosphate + NADP+ <=> D-Glucono-1,5-lactone 6-phosphate + NADPH
+ H+1.1.1.49 GXY_01616,GXY_02176,GXY_11509 pentose phosphate
v33 R02035 6-phosphogluconolactonase 6-PGL + H2O -> 6-PGC D-Glucono-1,5-lactone 6-phosphate + H2O => 6-Phospho-D-gluconate 3.1.1.31 GXY_02191,GXY_10154 pentose phosphate
v34 R01528 6-phosphogluconate dehydrogenase
6-PGC + NADP_x -> RU5P + CO2 + NADPH
6-Phospho-D-gluconate + NADP+ -> D-Ribulose 5-phosphate + CO2 + NADPH 1.1.1.44 GXY_04594 pentose phosphate
v35 R02036 phosphogluconate dehydratase
6-PGC -> 2-DDG6P + H2O
6-Phospho-D-gluconate => 2-Dehydro-3-deoxy-6-phospho-D-gluconate + H2O 4.2.1.12 GXY_03863 pentose phosphate
v36 R056052-dehydro-3-
deoxyphosphogluconate aldolase
2-DDG6P -> G3P + PYR 2-Dehydro-3-deoxy-6-phospho-D-gluconate => D-Glyceraldehyde 3-phosphate + Pyruvate 4.1.2.14 GXY_03858 pentose phosphate
v37 R01529 epimerase RU5P <-> XU5P D-Ribulose 5-phosphate <=> D-Xylulose 5-phosphate 5.1.3.1 pentose phosphate
v38 R01056 isomerase RU5P <-> R5P D-Ribulose 5-phosphate<=> D-Ribose 5-phosphate 5.3.1.6 GXY_02196 pentose phosphate
v39 R01827 transaldolase S7P + G3P <-> E4P + F6P
Sedoheptulose 7-phosphate + D-Glyceraldehyde 3-phosphate =>
D-Erythrose 4-phosphate + D-Fructose 6-phosphate
2.2.1.2 GXY_02166 pentose phosphate
v40 R01641 transketolase R5P + XU5P <-> S7P + G3P
D-Ribose 5-phosphate + D-Xylulose 5-phosphate =>Sedoheptulose 7-phosphate +
D-Glyceraldehyde 3-phosphate2.2.1.1 GXY_02161,GXY_04008 pentose phosphate
v41 R01067 transketolase E4P + XU5P <-> F6P + G3P
D-Erythrose 4-phosphate + D-Xylulose 5-phosphate <=>D-Fructose 6-phosphate +
D-Glyceraldehyde 3-phosphate2.2.1.1 GXY_02161,GXY_04008 pentose phosphate
v42 R00868 mannitol 2-dehydrogenase MANN + NAD <-> FRU + NADH_x + H
Mannitol + NAD+ <=> D-Fructose + NADH + H+ 1.1.1.67 GXY_02161 manitol
v43 R00760 fructokinase FRU + ATP -> ADP + F6P + H
ATP + D-Fructose => ADP + D-Fructose 6-phosphate 2.7.1.4 GXY_10569
v44 R00847 glycerol kinase GLYC + ATP -> ADP + GLYC3P
Glycerol + ATP=> ADP + Glycerol 3-phosphate 2.7.1.30 GXY_08295 Glycerophospholipid
metabolism
v45 R00842 glycerol-3-phosphate dehydrogenase
GLYC3P + NAD <-> DHAP + NADH_x + H
Glycerol 3-phosphate + NAD<=> Glycerone phosphate + NADH 1.1.1.94 GXY_04966 Glycerophospholipid
metabolism
v46 R00351 citrate synthase ACCOA_x + H2O + OAA -> CIT + COA + H
Acetyl-CoA + H2O + Oxaloacetate=> Citrate + CoA 2.3.3.1 GXY_10922 TCA cycle
v47 R01325 aconitate hydratase 1 CIT -> ACON-C + H2O Citrate => cis-Aconitate + H2O 4.2.1.3 GXY_01403 TCA cycle
v48 R01900 aconitate hydratase 2 ACON-C + H2O <-> ICIT cis-Aconitate + H2O <=> Isocitrate 4.2.1.3 GXY_01403 TCA cycle
v49 R00267 isocitrate dehydrogenase ICIT + NADP_x <-> AKG + CO2 + NADPH + H
Isocitrate + NADP+ <=> 2-Oxoglutarate + CO2 + NADPH + H+ 1.1.1.42 GXY_08180 TCA cycle
v50 R01197 2-oxoglutarate synthaseAKG + NAD + COA -> SUCCOA + NADH_x
+ CO2 1.2.7.3 TCA cycle
v51 R00405 succinyl-CoA synthetase SUCCOA + ADP + PI <-> ATP + SUCC + COA
ADP + orthophosphate + succinyl-CoA => ATP + succinate + CoA 6.2.1.5 GXY_05758, GXY_05763 TCA cycle
v52 R00408 Succinate dehydrogenase SUCC + FAD <-> FADH2 + FUM Succinate + FAD <=> FADH2 + Fumarate 1.3.99.1 GXY_01598 - sdhB TCA cycle
v53 R01082 fumarase FUM + H2O <-> MAL-L Fumarate + H2O<-> (S)-Malate 4.2.1.2 GXY_13863, GXY_02031 TCA cycle
v54 R00342 malate dehydrogenase MAL-L + NAD <-> NADH_x + OAA + H
(S)-Malate + NAD+ => Oxaloacetate + NADH2 + H+ 1.1.1.37 TCA cycle
v55 R00253 glutamine synthetase ATP + GLU-L + NH4 -> ADP + PI + GLN-L + H
ATP + L-Glutamate + NH4 -> ADP + Orthophosphate + L-Glutamine 6.3.1.2 GXY_02336 nitrogen metabolism
v56 R00256 glutaminase GLN-L + H2O -> GLU-L + NH4 L-Glutamine + Water => L-Glutamate + NH4 3.5.1.2 GXY_12733; carB nitrogen metabolism
v57 R00114 glutamate synthase GLN-L + AKG +
NADPH + H -> 2GLU-L + NADP_x
L-Glutamine + 2-Oxoglutarate + NADPH + H+ => L-Glutamate + NADP+ 1.4.1.13 GXY_04844, gxy_04839 nitrogen metabolism
v58 GLN-L_x + H_x <-> GLN-L + H
L-Glutamine_out + proton => L-Glutamine + proton transport
v59 GLU-L_x + H_x <-> GLU-L + H
L-Glutamate_out + proton => L-Glutamate + proton transport
v60 adenylate kinase AMP + ATP <-> 2ADP AMP + ATP <-> 2ADP 2.7.4.3 GXY_12943 purine metabolism
v61 ATP maintenance requirement
ATP + H2O -> ADP + PI + H ATP + H2O -> ADP + PI + H
v62 ATP synthase - Complex V
ADP + PI + 4H_x -> ATP + H2O + 3H ADP + PI + 4H_x -> ATP + H2O + 3H 3.6.3.14
GXY_00619, GXY_00624, GXY_00629, GXY_00634, GXY_15649, GXY_15672, GXY_15677, GXY_15682
oxidative phosphorilation
v63 inorganic diphosphatase PPI + H2O -> 2PI + H Diphosphate + H2O -> 2 ortophosphate + H 3.6.1.1 GXY_01896

Brazilian Journal of Chemical Engineering Vol. 35, No. 03, pp. 869-886, July - September, 2018
883Modeling the core metabolism of Komagataeibacter hansenii ATCC 23769 to evaluate nanocellulose biosynthesis
Abbrev RxN Description Equation Equation EC GENE Subsistem
v64 NAD transhydrogenase NAD + NADPH -> NADH_x + NADP_x
NAD + NADPH + H-> NADH + NADP+H_out 1.6.1.2
v65 nucleoside-triphosphatase (UTP)
UTP + H2O -> UDP + H + PI UTP + H2O -> UDP + H + PI 3.6.1.5 purine metabolism
v66 nucleoside-diphosphate kinase (ATP:UDP)
ATP + UDP -> ADP + UTP ATP + UDP -> ADP + UTP 2.7.4.6 ndk purine metabolism
v67 Complex I (NADH desidrogenase)
Q8 + NADH_x + 5H -> Q8H2 + NAD + 4H_x
Ubiquinone + NADH + 5H => Ubiquinol + NAD + 4H 1.6.5.3
GXY_08325,GXY_11983,GXY_11988,GXY_11993,GXY_12583,G
XY_15579oxidative phosphorilation
v68 Complex II (succinate desidrogenase)
Q8 + SUCC -> Q8H2 + FUM
Ubiquinone + Succinate -> Ubiquinol + Fumarate 1.3.5.1 oxidative phosphorilation
v69 Ubiquinol Oxidase (citocromo bd oxidase)
2Q8H2 + 4H + O2 -> 2Q8 + 2H2O + 4H_x
2Ubiquinol + 4H + Oxygen => 2Ubiquinone + 2H2O + 4H_out 1.10.3.10 GXY_05121,GXY_05126,GXY_0513
1,GXY_05136 oxidative phosphorilation
v70 Complex IV (citocromo c oxidase)
O2 + 4FERROCYTOCHROME
+ 4H -> 4FERRICYTOCHROME +
2H2O + 4H_x
Oxygen + 4 reduced-cytochrome-c => 4oxidized-cytochrome-c + 2H2O + 4H_out 1.9.3.1 GXY_04894,GXY_07135 oxidative phosphorilation
v71 Complex III (citocromo bc1)
Q8H2 + 2FERRICYTOCHROME
+ 2H -> Q8 + 2FERROCYTOCHROME
+ 4H_x
Ubiquinol + 2 oxidized-cytochrome-c -> Ubiquinone + 2 reduced-cytochrome-c 1.10.2.2 GXY_00569,GXY_00574,GXY_16474 oxidative phosphorilation
v72 NADH_x + 0.5O2 +
2.5ADP + 2.5PI + 3.5H -> 3.5H2O + NAD + 2.5ATP
NADH_x + 0.5O2 + 2.5ADP + 2.5PI + 3.5H -> 3.5H2O + NAD + 2.5ATP oxidative phosphorilation
v73 FADH2 + 0.5O2 +
1.5ADP + 1.5PI + 2.5H -> 2.5H2O + FAD + 1.5ATP
FADH2 + 0.5O2 + 1.5ADP + 1.5PI + 2.5H -> 2.5H2O + FAD + 1.5ATP
v74 biomass reaction
41.257ATP + 0.205G6P + 0.0709F6P + 0.8977R5P + 0.8977E4P + 0.129G3P
+ 1.496*3-PG + 0.5191PEP + 28.328PYR
+ 3.747ACCOA_x + 1.078AKG + 1.786OAA
+ 1.822NADPH + 3.547NAD + 41.257H2O
-> 41.257ADP + 41.257PI + 3.747CoA+
1.822NADP + 46.626H + BIOMASS
biomass
BIOMASS COMPOSITION Metabolites Coefficient NADPH -1.822 D-Erythrose4-phosphate -0.8977 NADH 3.547 Phosphoenolpyruvate -0.5191 NADP 1.822 NAD -3.547 H2O -41.257 Acetyl-CoA -3.747 ADP 41.257 CoA 3.747 ATP -41.257 Pyruvate -2.832 3-Phosphoglycerate -1.496 Oxaloacetate -1.786 Phosphate 41.257 D-fructose-6-phosphate -0.0709 ribose-5-phosphate -0.8977 H+ 46.626 Glyceraldehyde3-phosphate -0.129 2-Oxoglutarate -1.078 D-glucose-6-phosphate -0.205 Biomass 1 EXCHANGE REACTIONS EX_co2(e) CO2 exchange co2_out[e] <=> EX_glc-D(e) glucose exchange glc-D_out[e] <=> EX_glyc(e) glycerol exchange glyc_out[e] <=> EX_h(e) H+ exchange h_out[e] <=> EX_h2o(e) H2O exchange h2o_out[e] <=> EX_mann(e) mannitol exchange mann_out[e] <=> EX_nh4(e) NH4 exchange nh4_out[e] <=> EX_pi(e) phosphate exchange pi_out[e] <=>

884 Samara Silva de Souza, Julia de Vasconcellos Castro and Luismar Marques Porto
Brazilian Journal of Chemical Engineering
Abbrev RxN Description Equation Equation EC GENE Subsistem EX_o2(e) oxygen exchange o2_out[e] <=> DEMAND REACTIONS DM_g6p Glucose -6-phosphate demand DM_f6p Fructose-6-phosphate demand DM_r5p Ribose-5-phosphate demand DM_e4p Erythose-4-phosphate demand DM_g3p Glyceraldehyde -3-phosphate demand DM_3-pg 3-Phospho-D-glycerate demand DM_pep Phosphooenolpyruvate demand DM_pyr Pyruvate demand DM_accoa Acetyl-CoA demand DM_akg 2-oxoglutaratedemand DM_oaa Oxaloacetate demand
Table A2. List of all metabolites of the core model network.Abbrev. Description Neutral Formula Charged formula Charge KEGG ID Compart-ment PubChem ID
13dpg 3-Phospho-D-glyceroyl phosphate C3H8O10P2 C3H4O10P2 -4 C00236 cytosol 3535
2ddg6p 2-Dehydro-3-deoxy-6-phospho-D-gluconate C6H11O9P C6H8O9P -3 c04442 cytosol 7071
2pg D-Glycerate 2-phosphate C3H7O7P C3H4O7P -3 C00631 cytosol 3904
3pg 3-Phospho-D-glycerate C3H7O7P C3H4O7P -3 C00197 cytosol 3497
6pgc 6-Phospho-D-gluconate C6H13O10P C6H10O10P -3 c00345 cytosol 3638
6pgl D-glucono-1,5-lactone-6-phosphate C6H11O9P C6H9O9P -2 c01236 cytosol 4457
ac Acetate C2H4O2 C2H3O2 -1 C00033 cytosol 3335
acald Acetaldehyde C2H4O C2H4O 0 C00084 cytosol 3384
accoa Acetyl-CoA C23H38N7O17P3S C23H34N7O17P3S -4 C00024 cytosol 3326
acon-C Cis-Aconitate C6H6O6 C6H3O6 -3 C00417 cytosol 3707
actp Acetyl phosphate C2H3O5P C2H5O5P -2 C00227 cytosol 3527
adp ADP C10H15N5O10P2 C10H12N5O10P2 -3 C00008 cytosol 3310
akg 2-oxoglutarate C5H6O5 C5H4O5 -2 C00026 cytosol 3328
amp AMP C10H14N5O7P C10H12N5O7P -2 c00020 cytosol 3322
atp ATP C10H16N5O13P3 C10H12N5O13P3 -4 C00002 cytosol 3304
biomass Biomass 0 [] cytosol []
biomass_out Biomass_out 0 [] extracellular []
cell Cellulose or 1,4-beta-D-glucan C6H10O5 C6H10O5 0 c00760 cytosol 4022
cell_out Cellulose or 1,4-beta-D-glucan C6H10O5 C6H10O5 0 c00760 extracellular 4022
cit Citrate C6H8O7 C6H5O7 -3 C00158 cytosol 3458
co2 carbon dioxide CO2 CO2 0 C00011 cytosol 3313
co2_out carbon dioxide_out CO2 CO2 0 C00011 extracellular 3313
CoA Coenzime A C21H36N7O16P3S C21H32N7O16P3S -4 C00010 cytosol 3312
dha Glycerone or Dihydroxyacetone C3H6O3 C3H6O3 0 c00184 cytosol 3484
dhap Glycerone phosphate/ Dihydroxyacetone phosphate C3H7O6P C3H5O6P -2 C00111 cytosol 3411
e4p D-Erythrose 4-phosphate C4H9O7P C4H7O7P -2 c00085 cytosol 3574
f6p D-Fructose 6-phosphate C6H13O9P C6H11O9P -2 c00016 cytosol 3385
fad Flavin adenine dinucleotide C27H33N9O15P2 C27H31N9O15P2 -2 C01352 cytosol 3318
fadh2 FADH2 C27H35N9O15P2 C27H33N9O15P2 -2 C00354 cytosol 4556
fdp Fructose 1,6-bisphosphate C6H14O12P2 C6H10O12P2 -4 C00125 cytosol 3647
Ferricytochrome c Oxidized cytochrome c C42H44FeN8O8S2R4 C42H44FeN8O8S2R4 0 C00126 cytosol 3425
Ferrocytochrome c Reduced cytochrome c C42H44FeN8O8S2R4 C42H44FeN8O8S2R4 0 c00095 cytosol 3426
fru D-fructose C6H12O6 C6H12O6 0 C00122 cytosol 3395
fum fumarate C4H4O4 C4H2O4 -2 C00103 cytosol 3422
g1p D-glucose 1-phosphate C6H13O9P C6H11O9P -2 C00118 cytosol 3403
g3p Glyceraldehyde 3-phosphate C3H7O6P C3H5O6P -2 C00092 cytosol 3418
g6p D-glucose 6-phosphate C6H13O9P C6H11O9P -2 c00031 cytosol 3392

Brazilian Journal of Chemical Engineering Vol. 35, No. 03, pp. 869-886, July - September, 2018
885Modeling the core metabolism of Komagataeibacter hansenii ATCC 23769 to evaluate nanocellulose biosynthesis
Abbrev. Description Neutral Formula Charged formula Charge KEGG ID Compart-ment PubChem ID
glc-D D-glucose C6H12O6 C6H12O6 0 c00031 extracellular 3333
glc-D_out D-glucose_out C6H12O6 C6H12O6 0 c00257 cytosol 3333
glcn D-gluconic acid or D-gluconate C6H12O7 C6H11O7 -1 c00257 cytosol 3556
glcn_out D-gluconic acid or D-gluconate C6H12O7 C6H11O7 -1 C00064 cytosol 3556
gln-L L-glutamine C5H10N2O3 C5H10N2O3 0 C00025 cytosol 3364
glu-L L-glutamate C5H8NO4 C5H9NO4 -1 c00116 cytosol 3327
glyc Glycerol or 1,2,3-Trihydroxypropane C3H8O3 C3H8O3 0 c00116 extracellular 3416
glyc_out Glycerol or 1,2,3-Trihydroxypropane C3H8O3 C3H8O3 0 c00093 cytosol 3416
glyc3p Glycerol 3 -phosphate C3H9O6P C3H7O6P -2 C00080 cytosol 3393
h H+ /proton H H 1 C00080 extracellular 3380
h_out H+/proton_out H H 1 C00001 cytosol 3380
h2o water H2O H2O 0 C00001 extracellular 3303
h2o_out water_out H2O H2O 0 c00311 cytosol 3303
icit Isocitrate C6H8O7 C6H5O7 -3 C15972 cytosol 3605
mal (S)-Malate / Malic Acid C4H6O5 C4H4O5 -2 c00392 cytosol 3449
mann D-mannitol C6H14O6 C6H14O6 0 c00392 extracellular 3682
mann_out D-mannitol_out C6H14O6 C6H14O6 0 C00003 cytosol 3682
nad Nicotinamide adenine dinucleotide C21H28N7O14P2 C21H26N7O14P2 -1 C00004 cytosol 3305
nadh Nicotinamide adenine dinucleotide - reduced C21H29N7O14P2 C21H27N7O14P2 -2 C00006 cytosol 3306
nadp Nicotinamide adenine dinucleotide phosphate C21H28N7O17P3 C21H25N7O17P3 -3 C00005 cytosol 3307
nadphNicotinamide adenine
dinucleotide phosphate - reduced
C21H30N7O17P3 C21H26N7O17P3 -4 C01342 cytosol 3308
nh4 Ammonium NH3 NH4 1 C01342 extracellular 4547
nh4_out Ammonium_out NH3 NH4 1 c00007 cytosol 4547
o2 Oxygen O2 O2 0 c00007 extracellular 3309
o2_out Oxygen_out O2 O2 0 C00036 cytosol 3309
oaa Oxaloacetate C4H4O5 C4H2O5 -2 C00074 cytosol 3338
pep Phosphoenolpyruvate C3H5O6P C3H2O6P -3 c00198 cytosol 3374
pgl D-glucono-1,5-lactone /Gluconic lactone C6H10O6 C6H10O6 0 C00009 cytosol 3498
pi orthophosphate H3O4P HO4P -2 c00013 cytosol 3311
ppi Diphosphate or pirofosfato H4P2O7 HO7P2 -3 C00022 cytosol 3315
pyr pyruvate C3H4O3 C3H3O3 -1 c00399 cytosol 3324
q8 Ubiquinone C14H18O4 C14H18O4 0 c00390 cytosol 3689
q8h2 Ubiquinol C14H20O4 C14H20O4 0 C00117 cytosol 3680
r5p D-Ribose 5-phosphate C5H11O8P C5H9O8P -2 C00199 cytosol 3417
ru5p D-Ribulose 5-phosphate C5H11O8P C5H9O8P -2 C00281 cytosol 3499
s7p Sedoheptulose 7-phosphate C7H15O10P C7H13O10P -2 C05382 cytosol 7756
succ succinate C4H6O4 C4H4O4 -2 C00042 cytosol 3344
succoa Succinyl-CoA C25H40N7O19P3S C25H35N7O19P3S -5 C00091 cytosol 3391
udp Uridine 5'-diphosphate C9H14N2O12P2 C9H11N2O12P2 -3 c00015 cytosol 3317
udpg UDPglucose C15H24N2O17P2 C15H22N2O17P2 -2 c00029 cytosol 3331
utp Uridine triphosphate C9H15N2O15P3 C9H11N2O15P3 -4 C00075 cytosol 3375
xu5p D-Xylulose 5-phosphate C5H11O8P C5H9O8P -2 C00231 cytosol 3530

886 Samara Silva de Souza, Julia de Vasconcellos Castro and Luismar Marques Porto
Brazilian Journal of Chemical Engineering