modeling the clickstream: implications for web-based advertising
TRANSCRIPT

Modeling the Clickstream: Implications forWeb-Based Advertising Efforts
Patrali Chatterjee • Donna L. Hoffman • Thomas P. NovakRutgers Business School—Newark & New Brunswick, Rutgers University, Newark, New Jersey 07102-1897
Owen Graduate School of Management, Vanderbilt University, Nashville, Tennessee 37203Owen Graduate School of Management, Vanderbilt University, Nashville, Tennessee [email protected] • [email protected] • [email protected]
In this paper, we develop an analytical approach to modeling consumer response to ban-ner ad exposures at a sponsored content Web site that reveals significant heterogeneity in(unobservable) click proneness across consumers. The effect of repeated exposures to bannerads is negative and nonlinear, and the differential effect of each successive ad exposure isinitially negative, though nonlinear, and levels off at higher levels of passive ad exposures.Further, significant correlations between session and consumer click proneness and bannerexposure sensitivity suggest gains from repeated banner exposures when consumers are lessclick prone. For a particular number of sessions, more clicks are generated from consumerswho revisit over a longer period of time, than for those with the same number of sessionsin a relatively shorter timeframe. We also find that consumers are equally likely to click onbanner ads placed early or late in navigation path and that exposures have a positive cumu-lative effect in inducing click-through in future sessions. Our results have implications foronline advertising response measurement and dynamic ad placement, and may help guideadvertising media placement decisions.(Advertising and Media Research; Clickstream Data; Computer-Mediated Environments; OnlineConsumer Behavior; Random-Coefficient Models; Internet; World Wide Web)
1. IntroductionAdvertising sponsorship is an important revenuemodel for firms doing business on the Internet. U.S.Web advertising expenditures are expected to reach$6.3 billion in 2003 (Jupiter Research 2003) and pre-dicted to reach more than $14.8 billion by 2005, evenas they represent only a fraction (3.3%) of the total$243 billion in advertising expenditures across tra-ditional vehicles such as TV, print, and direct mail(Jupiter Research 2003). Additionally, the share of Webad expenditures accounted for by mainstream adver-tisers is expected to increase from 31% in 2001 to 84%in 2005 (eMarketer 2001).Despite these positive indicators, declining click-
through rates, confusion concerning appropriate
advertising pricing models, and uncertainty regardingwhether traditional advertising metrics are appropri-ate for new media like the Internet, are contributingto increasing skepticism regarding the value of adver-tising in this digital medium (Hoffman and Novak2000). While Web sites still sell advertising using tra-ditional CPM (cost-per-thousand) pricing, advertiserinsistence on performance-based pricing that linksconsumer exposure to advertising with actual mar-ket response is forcing the emergence of hybrid pric-ing models that charge on the basis of click-throughin addition to mere exposure (Hoffman and Novak2000).The Internet is a unique marketing medium because
consumer response to online advertising, typically in
Marketing Science © 2003 INFORMSVol. 22, No. 4, Fall 2003, pp. 520–541
0732-2399/03/2204/05201526-548X electronic ISSN

MODELING THE CLICKSTREAM: IMPLICATIONS FOR WEB-BASED ADVERTISING EFFORTS
the form of so-called “banner ads,” can readily be cap-tured and modeled. When a consumer clicks on a ban-ner ad, a click-through is recorded in the server accesslog. Each time a consumer visits a Web page withan inline ad, a “banner impression” or “ad view” isrecorded for the advertising sponsor. As in traditionalmedia, the number of impressions generated dependson exposure to the surrounding editorial content andis thus, in part, under the firm’s control. Banner adsaccounted for 52% of Web ad revenue in 2000 (eMar-keter 2001).However, consumers rarely click on banner ads.
Average click-through rates have declined dramati-cally since the late 1990s; currently, fewer than 3 outof every 1,000 visitors to a Web site clicks on a ban-ner ad (eMarketer 2001). Despite industry efforts toimprove online advertising effectiveness, plummetingclick-through rates remain a concern and are fuel-ing industry speculation that clicks on banner adsare entirely random and cannot be influenced by themarketer (Bicknell 1999). Nevertheless, click-throughsremain an important media pricing metric for theWeb.Even though aggregate click rates are low, rigorous
examination of individual consumer click-throughbehavior is important for several reasons. First,click-throughs are a behavioral and therefore moreaccountable measure of online advertising, especiallycompared to mere exposure. Second, even thoughclick rates are low, the absolute number of ad expo-sures and subsequent click-throughs at high-trafficWeb sites are still substantial. Thus, click-throughscan be an important mechanism for driving trafficto advertiser Web sites. Finally, modeling the click-through allows us to address several fundamentalissues of both theoretical and practical importancein the nascent area of online advertising responsemeasurement, including the number of times an adshould be displayed, the cumulative and marginalimpact on click-through of repeated exposures, anddeclining click-through rates.We tackle these issues with an analytical approach
to modeling consumer response to banner ad expo-sures at a sponsored content Web site. Our mod-eling framework allows us to analyze variation inclick probability at each banner ad exposure occasion
and account for heterogeneity across consumers andevolution in response across sessions for each individ-ual consumer at the Web site.Our paper makes two key contributions to the liter-
ature. First, we develop, estimate, and test an analyti-cal model of consumer response to online advertisingin a dynamic framework. We note that empiricalanalysis of behavioral outcomes at the microlevel ofeach ad exposure occasion has not been investigated inearlier research for any media, simply because thedata were not available. The random coefficients logitmodel with evolution that we specify allows for unob-served heterogeneity and evolution (or change) inclick proneness and in responses to banner ad expo-sures using information that can be obtained fromclickstream data. Second, our modeling effort revealsimportant insights into online consumer behavior inthe context of response to Internet advertising thatcan motivate additional research in this area andimpact managerial practice.The rest of the paper is organized as follows. In
§2, we develop a set of testable effects of consumerresponse to banner ads that follow from theory. Wedevelop our clickstream model in §3 and presentmodel results in §4. In §5, we discuss the implicationsof our modeling effort for research and practice andconclude with suggestions for future research.
2. TheoryWe seek to model advertising response in digital envi-ronments where consumers navigate through content-laden Web sites with embedded banner advertising.The response variable of interest is whether or nota consumer clicked on a banner ad while navigatingthe Web site. Such navigations produce a clickstreamof responses that are highly amenable to modeling.We build a multiperiod model that attempts to cap-ture the differential effects of banner ad exposures onclick-through over time, both within a single sessionand across multiple sessions. The key effects we testin our model are introduced below.
2.1. Intrasession Exposure EffectsPrior research on repetition effects in advertising anddirect marketing suggest two different patterns of
Marketing Science/Vol. 22, No. 4, Fall 2003 521
CHATTERJEE, HOFFMAN, AND NOVAKImplications for Web-Based Advertising Efforts
consumer response to repeated advertising exposureswithin the same Web session. The first patternposits that response probability decreases over time.This common effect occurs when consecutive stim-uli are independent and the probability of a positiveresponse is assumed to be the same across stimuli(Buchanan and Morrison 1988). The second responsepattern holds that initial response probability may below, but increases with repetition to a maximum leveland then diminishes over subsequent repetitions.Berlyne’s (1970) two-factor theory provides strongsupport for this inverted-U relationship between thenumber of ad exposures and responses. In traditionalmedia, this relationship is caused by two opposingfactors. In the initial wearin stage, increased responseopportunity with each additional ad exposure leadsto an increase in affect (Pechmann and Stewart 1989).Subsequently, satiation (or tedium) leads to wearout,when each additional ad exposure after wearin has asignificant negative effect.We theorize that wearout dominates in online
advertising environments so that for most consumers,there are relatively strong diminishing returns to earlyrepeated exposures that taper off as exposures con-tinue. The rationale for this follows from the fact thatthe first banner exposure provides sufficient oppor-tunity to elicit a response, similar to print advertis-ing (Calder and Sternthal 1980). The Internet offersconsumers relatively more control over the communi-cation and exchange process than has been the casein traditional media environments like broadcast andprint. Consumers have both a broader and deeperarray of choices about how to receive and interactwith communications online (Ariely 2000, Hoffmanand Novak 1996, Peterman et al. 1999, Sohn andLeckenby 2001). This direct control extends to controlover advertising response. Because consumers largelycontrol their exposure and response to online ads, itfollows that those consumers who are most likely toattend and click will do so at the first exposure itself.Research on visual attention to repeated print ads
(Pieters et al. 1999) suggests that consumer controlover ad exposure allows them to adapt to advertis-ing repetition by reducing exposure duration. Theamount of attention paid to the ad is likely todecline after the first exposure in a monotonically
decreasing fashion. This implies that the conditionalprobability of a click following a string of “failed”banner exposures will decline as the number of ban-ner exposures increases.1 Industry research supportsthis idea. Usability studies indicate that once con-sumers have attended to and recognized a bannerad they learn to ignore it and become progres-sively insensitive to it (Benway 1998, Schroeder 1998).Additionally, commercial studies of “banner burnout”(DoubleClick 1996) show that the probability of clickis highest on the first banner ad exposure during asession and decreases thereafter, implying a decline inclick probability with each additional banner ad expo-sure. The DoubleClick study, invoked by some onlineadvertisers to reject exposure-based advertising pric-ing, reveals that beyond four banner ad exposures,the probability of a click is zero.Although we believe that Web wearout describes
the response function for most consumers, underwhat conditions might we expect wearin to occur?At any given banner exposure occasion, a consumerwho failed to click on the ad may have yet to noticeit due to “banner blindness” (Benway 1998) or mayhave noticed the ad but declined to attend to it.Commercial usability analysis (Schroeder 1998) andacademic studies (Briggs and Hollis 1997, Dreze andHussherr 2003) do show that most banner ads gounnoticed, despite the use of attention-grabbing exe-cution features. Further, unlike television ads, bannerads occupy a relatively small portion of the con-sumer’s visual field and can be easily missed evenif the consumer is interested in them. This suggeststhat there may be some consumers for whom addi-tional exposures may actually increase the probabil-ity of a more positive response. This is because eachadditional banner ad exposure increases the proba-bility the ad will be noticed and hence the probabil-ity it will ultimately be clicked on. However, thesegains in response probability from additional banner
1 Note that a consumer may notice the banner ad and attend toit but fail to click on it because of time pressure, lack of interest,preoccupation with the content, or their desire to accomplish theiroriginal navigation goals (Novak et al. 2000). In those cases, addi-tional banner exposures during the session may or may not imme-diately increase the click probability.
522 Marketing Science/Vol. 22, No. 4, Fall 2003

CHATTERJEE, HOFFMAN, AND NOVAKImplications for Web-Based Advertising Efforts
exposures would ultimately be expected to decreaseat higher levels of banner exposure.The control over banner ad exposure and the pres-
ence of wearout means that, for most consumers,we could reasonably expect declining click-throughprobabilities over repeated banner ad repetitions thatwould level off after a certain number of exposures.Because repeated exposures to a banner ad are likelyto have a negative and nonlinear effect on click prob-ability for a majority of consumers, the aggregateresponse to the number of exposures within a given ses-sion is likely to be negative and nonlinear. Because clickbehavior is primarily driven by immediate relevance,the negative effect due to wearout is expected to dom-inate over any positive effects due to wearin.
2.1.1. Banner Location in Navigational Path.Huberman et al. (1998) model Web browsers as con-stantly making judgments about the value of click-ing on a hyperlink on the current page, based onthe value of that page and the uncertainty about thevalue of the pages not yet seen. They find that, inthe aggregate, consumers have a lower threshold foruncertainty at the beginning of the navigation ses-sion, when they are more likely to click on hyperlinksthat deviate from their navigational path. As brows-ing depth increases, their threshold for uncertaintyincreases and consumers are less likely to click onhyperlinks unrelated to navigational goals. This find-ing suggests that, other things equal, banner ads displayedearlier in the session will be more likely to be clicked onthan those consumers are exposed to later.
2.2. Exposure Effects Across Sessions
2.2.1. Intersession Time. The more frequentlyconsumers visit a Web site, the more opportunitiesexist for the online marketer to expose the consumerto advertising messages and build commitment andloyalty (Hanson 2000). On the Web, intersession time(the length of time between a consumer’s visits to thesite) is somewhat analogous to store repatronage, butbesides measuring repeat visits also captures intervisitduration.Consumers who revisit after relatively short dura-
tions are likely to be more goal-oriented than con-sumers who revisit after relatively longer intervals
(Hoffman and Novak 1996), and arguably, more likelyto be familiar with the site organization, content,and advertising. Such consumers are also more likely,then, to be exposed to the same banner ads as in priorsession(s) and may be more likely to ignore thoseads.2 We would also expect these goal-directed con-sumers who return to the site relatively quickly willbe more likely to be in the wearout segment discussedearlier (i.e., their click probabilities are decreasing).On the other hand, consumers with longer interses-sions times may be more likely to forget ads fromprior exposures, making it more likely that they willattend and click on a present visit. These consumerswill be more likely to be in the wearin segment (i.e.,their click probabilities are increasing). This argues thatlonger intersession times on prior visits will lead to ahigher click probability in the current session.
2.2.2. Prior Session Exposures and Future SessionClicks. If a consumer was exposed to, but did notattend to, the banner ad in earlier sessions, the preat-tentive mere exposure effect suggests that at suffi-ciently high levels, these exposures are sufficient togenerate a feeling of familiarity and expectation thatmay be interpreted as a preference or curiosity for thead (Janiszewski 1993). This may stimulate attentionto the ad in subsequent exposures. Whether this willlead to a click in a future session depends on con-sumer motivation. Higher levels of curiosity wouldincrease the probability that click will occur.Some research suggests that if the banner ad is
repeatedly noticed (and attended) but not clicked onin earlier sessions, recognition and awareness of thead stimulus and brand name is generated (Briggs andHollis 1997). On further exposures of the same ad,if there is no additional information (or motivation)for the consumer to consider, then over-exposure,boredom, and tedium may occur, so clicks in futuresessions out of curiosity are less likely to occur. Thissuggests that ads will benefit more from repetitionwhen consumers do not attend in prior sessions.Because many consumers fail to notice banner ads,
2 However, as one reviewer pointed out, it is also possible that fre-quent visitors’ relatively greater familiarity with the content meansthey would be able to devote the cognitive resources attending tothe banner.
Marketing Science/Vol. 22, No. 4, Fall 2003 523

CHATTERJEE, HOFFMAN, AND NOVAKImplications for Web-Based Advertising Efforts
this effect is expected to be pronounced, particularlyacross sessions. Within a session, it is reasonableto assume that some consumers will be motivatedby immediate relevance. However, this becomes lesslikely across multiple sessions. In other words, acrosssessions, we expect the positive wearin effect to dom-inate over the negative wearout. Note also that thewearout effect occurs under relatively short time-frames, while wearin occurs under longer timeframes.If wearout happens, it happens quickly—typicallywithin a single session. Thus, we expect that the prob-ability of a click-through in a given session will increasethe more banner ad exposures there have been in priorsessions.3
2.2.3. Time Since Last Click in Prior Sessions.If a consumer clicks on a banner ad, is therevalue in exposing her to the banner ad again infuture sessions? Prior to the first click, a consumermay be uncertain of the usefulness or entertainmentvalue of clicking on the ad. Once a consumer hasclicked, however, some curiosity and uncertainty havebeen reduced. If click behavior is driven largely bycuriosity, then we might expect clicks in prior sessionsto be negatively related to clicks in future sessions.However, we assume consumers are motivated toattend to and click on ads and that they are awarethat online ad content, especially compared to broad-cast and print ads, is dynamic, and extensive, oftenrequiring multiple viewings to fully consume.Over time, recall of the click experience diminishes.
Additionally, there may be a renewed interest in thead content as sessions pass. Thus, given a click in aprior session, the longer the time interval since the lastclick, the more likely there will be a click on the ad in thecurrent session.
2.2.4. Repeat Visits. Individual consumer naviga-tional behavior and click response across sessionsevolves over time. Consumers behave more ritua-listically initially but become more goal-oriented asthey gain more experience online (Novak et al. 2000,Schroeder 1998). This suggests that consumers will be
3 This assumes a linear form for cumulative banner ad exposuresin prior sessions. Treating this variable as a quadratic term addedno explanatory power.
more likely to click on hyperlinks in general duringinitial visits, becoming less exploratory the more theyvisit, and hence less click prone as the number ofvisits to the site increases. This observation is alsoconsistent with Huberman et al.’s (1998) result withina session.Over time, of course, banner ad sensitivity (i.e., the
impact of each additional banner ad exposure duringthe session on click probability) is expected to declinefor all consumers. However, wearout is expected tobe fastest for repeat visitors compared to new visitors.That is, we expect click probability to decline as the numberof sessions increases.
3. Modeling the Clickstream3.1. The DataThis study uses consumer clickstream data from ahigh-traffic sponsored content (or “e-zine”) Web site4
from January 1, 1995 to August 14, 1995.5 Theseenhanced clickstream data have ad exposure informa-tion (banner ads and clicks) for sponsor ads that wereserved from the content site server. From January 1,1995 to August 13, 1995, the Web site requiredmandatory registration to enter the site. Demographicinformation was collected the first time a consumerregistered at the site and selected a user name/idand a password to be used for future visits to thesite. Once registered, the visitor simply logged in forfuture visits. Demographic information that could bemerged with the respondents’ clickstream data wasnot available.We model ad exposure data for consumers dur-
ing the mandatory registration period because it isnot possible to track and measure consumer expo-sure to advertising across visits accurately in thevoluntary registration period. Only one banner adwas displayed on each page, the best possible sit-uation for an online advertiser. Banner ads wereeither “hard-coded” or rotated in a predetermined fre-quency. Because banner delivery was not “smart” orinteractive (i.e., served according to the customer’s
4 Undisclosed at the request of the sponsoring Web site.5 See Sen et al. (1998) for an extensive discussion of data availablefrom server access logs.
524 Marketing Science/Vol. 22, No. 4, Fall 2003

CHATTERJEE, HOFFMAN, AND NOVAKImplications for Web-Based Advertising Efforts
response history), levels of banner ad exposure wereexogenously determined.Several technical characteristics of clickstream data
restrict the modeling scope.6 First, accurate demo-graphics are difficult to obtain, due to consumerreluctance to provide this information in new onlineenvironments (Hoffman et al. 1999). Second, ad exe-cution details for banner ads or active ad pages arerarely collected on an ongoing basis, if at all, owing tothe intense challenges facing online businesses oper-ating 24 hours a day, 7 days a week, 365 days a year.Third, because site-centric clickstream data do notcontain information on the consumer’s activities atexternal sites (unless the sites are part of an advertis-ing network like DoubleClick), consumer actions aftera banner ad click cannot be easily tracked. Finally,banner ad exposures and clicks may not be availablefor all advertisers at the site because some may beserved from the advertiser’s Web site server as wediscuss below. To make our problem tractable, andbecause of these data limitations, we leave for futureresearch events that occur subsequent to a click.
3.1.1. Selection of Sponsors. There were a totalof 3�810 Web pages at the Web site; 3�046 (79.95%)were editorial pages with no ads (or pure editorialpages), 307 (8.06%) were editorial pages with ban-ner ads, and 48 (1.26%) were active ad pages.7 Whilethis site had 42 advertisers, only 2 advertisers (twohigh-technology firms, identified as sponsors #15 and#34) ran banners that had no any major executionalchanges or promotional contests during the studyperiod and had banner and active ad pages on thepublisher’s Web server. The details of ad placementsand exposures generated for these two sponsors areprovided in Table 1. Total banner exposures weresignificantly higher for sponsor #15, despite fewerbanner ages. This was most likely due to that spon-sor’s banner ad placement on entry or gateway pagesthat had relatively higher traffic than the placementpages for sponsor #34.
6 Note that some of these issues may be alleviated by more con-trolled data collection in experimental laboratory environments(e.g., Lynch and Ariely 2000) or in direct marketing contexts withlarge-scale customer databases (e.g., Chen and Iyer 2002).7 The remaining 10.73% of pages (409 pages) were Web sitemanagement pages.
Table 1 Ad Placement and Exposure Details for Sponsors with FixedBanner Ads
Advertiser ⇒ #15 #34Number of banner pages 2 6Banner exposures in mandatory registration period 1,208,707 86,251Clicks in mandatory registration period 19,070 1,083Overall share of banner ad exposures at Web Site 6.87% 1.41%Overall share of clicks at Web Site 2.85% 2.71%
3.1.2. Selection of Consumers. A total of 21�783unique registered users visited the Web site from Jan-uary 1, 1995 to August 14, 1995. The daily total ofnonunique registered visitors ranged from 14�025 (on4/26/95) to 42�942 (on 7/27/95), with a daily aver-age of 21�850 (mode = 28�664). See Chatterjee (1998)for further distributional details. A sample of regis-tered consumers was selected according to the follow-ing criteria: (1) consumers must have been exposed tobanner ads either for advertiser #15 or #34 on morethan three sessions during the mandatory registra-tion period �5�326�; and (2) visited the site during thecalibration and prediction period �3�611�. This selec-tion rule yielded 3�611 consumers with 843�565 Webpage accesses (34�683 banner exposure occasions)during the seven-month mandatory registration studyperiod. Navigational activity was tracked over 227days (01.08.95–07.14.95) for model estimation andover 29 days (07.15.95–08.13.95) to test predictiveability.Preliminary analyses (details in Chatterjee 1998)
indicated a highly heterogeneous consumer popula-tion, so for example, although most consumers whoclicked on a banner ad did so early (within thefirst three exposures), others did not click followingas many as 67 banner exposures. Some consumersclicked on their first session at the site, while othersclicked for the first time after as many as 59 sessions.This suggested that the average click rate proba-bility would not be adequate to describe consumerresponse.
3.2. Modeling Click-Through
3.2.1. The Setup. We model the probability thatconsumer i′s first click-through during session s will
Marketing Science/Vol. 22, No. 4, Fall 2003 525

CHATTERJEE, HOFFMAN, AND NOVAKImplications for Web-Based Advertising Efforts
occur at the oth occasion during that session.8 Weassume that the ith consumer �i= 1� � � � � I� is exposedto a banner ad at occasions o = 1� � � � �Os , whichoccur at the sth �s = 1� � � � � Si� session at the site.For notational convenience we do not include sub-scripts to indicate consumer and session for occasion,and consumer for session: ois�i� and si. The number ofbanner exposure occasions Os will differ for sessionsSi for each consumer and will also differ across theI consumers. The number of, and spacing between,sessions to the site Si is expected to differ across the Iconsumers.The basis of our model is an unobservable, latent
variable Click∗iso, which can be interpreted as an indexrepresenting consumer i’s desire or intention to clickwhen exposed to a banner ad for a sponsor at occa-sion o during session s. In practice, the value of Click∗isois empirically unobservable; however, we observe itsdichotomous realization Clickiso, the click outcomevariable for customer i, as follows:
Clickiso =
1 if consumer i clicks atoccasion o during session s�
0 otherwise�
(1)
The observed dependent variables Clickiso =�Clickis1� � � � �Clickisos� indicate whether consumer i
clicked at occasion o �Clickiso = 1� or not �Clickiso = 0�.We develop our model for a single banner ad on eachpage. Under the model assumptions, for consumeri during occasion o in session s, the click/noclick outcomes follow a Bernoulli distribution withparameter iso:
Clickiso � iso ∼ Bernoulli� iso�� (2)
8 Alternatively, we could model the number of banner ad exposuresrequired to generate a click as following a Poisson distribution,with individual Poisson parameters following a gamma distribu-tion across consumers. Because the number of clicks is much fewercompared to no clicks, and the effects of banner exposures dur-ing a session and in prior sessions can be difficult to separate, werejected that approach. Further, it is well documented in the sta-tistical literature that in rare events data, bias in rates calculatedusing Poisson distribution (versus logistic distribution) can be sub-stantially meaningful with sample sizes in the thousands and in apredictable direction: estimated event rates are too small (King andZeng 2000).
where iso = Pr�Clickiso = 1� is the probability that theith consumer clicks after the oth banner exposurein the sth session given that the consumer has notclicked in the prior �o−1� banner exposure occasionsin the session. The click outcome is observed after thebanner ad exposure occurs. Thus, Equation (2) pre-dicts the probability that a click response will occurafter a consumer is exposed to a banner ad. Clickiso isa function of variables that varies across banner expo-sure occasions, sessions, and consumers.Using a logistic parameterization for the hazard
rate, we express the probability that consumer i willclick on the banner on a given exposure occasion o inthe session conditional on not having yet clicked as
iso = Pr�Clickiso � Clickis�o−1�� � � � � Clickis1 = 0�Xiso�Yis�
= Logit�ai+�′Xiso+�′Yis+�′Zi+�iso�� (3)
Equation (3) thus refers to the probability of the firstclick in the session and not to subsequent clicks in thesame session and includes the following terms:(i) A consumer-specific constant, ai, the intercept term
that affects clicking propensity due to unobservedindividual characteristics;(ii) Variables varying within and across sessions and
across consumers. Xiso represents K× 1 measurementsof observed variables that vary over banner exposureoccasions within the sth session of consumer i;9
(iii) Variables varying across sessions and consumers.Yis is the vector of session-specific variables, i.e., val-ues of variables that vary across sessions for each con-sumer i;10
(iv) Variables varying across consumers. Zi is the vec-tor of consumer-specific variables, i.e., those variablesthat describe consumer i and remain constant acrosssessions for each consumer.In the model, �′, �′, and �′ consist of vectors of
coefficients associated with the respective explanatory
9 Banneriso, number of banner exposure occasions so far in the ses-sion; Pagesiso , number of pages accessed so far in the session;Advertiseriso , dummy variable for advertiser. We pool data for twosponsors. See Appendix A.10 ISTis , intersession duration at session s; TBanneris , cumulativebanner exposures since first-ever visit to the site; TLClickiso , timesince last click in prior sessions (since we are modeling the firstclick in a session).
526 Marketing Science/Vol. 22, No. 4, Fall 2003
CHATTERJEE, HOFFMAN, AND NOVAKImplications for Web-Based Advertising Efforts
variables. The error term �iso is distributed Type Iextreme value across consumers, leading to a binarylogit model. For more than one banner ad on eachpage, Equation (3) would be replaced by a multino-mial logit formulation. The unit of measurement isbanner ad exposure occasion: Each consumer entersthe sample when first exposed to a banner ad for thesponsor and remains in the sample until a bannerclick or a session exit. Consumers who never click-through are included in the likelihood function, butobservations that occur after the first click-through areexcluded in the likelihood function.
3.2.2. Consumer Heterogeneity as Click Prone-ness. Because online advertising can adapt to re-spond to an individual consumer’s behavior, there isan unprecedented opportunity to segment and targetconsumers at an individual level. Consumer hetero-geneity in banner ad responsiveness arises becauseof differences in innate tendency to click on ads or“click-proneness” (Briggs and Hollis 1997), as well asfrom differences in involvement across product cat-egories/brands. In either case, an important issue iswhether responsiveness is so heterogeneous that esti-mates of sensitivities are biased if heterogeneity isignored.Different approaches have been discussed in the lit-
erature to account for consumer level heterogeneity(Allenby and Rossi 1999). We consider the conceptof unobserved heterogeneity, in which individualsmay differ in terms of some unmeasured variablesthat affect the click or no click outcome. Inclusion ofindividual-specific variables in Zi can capture part ofthis variation, but it is almost impossible to identifyall of the variables affecting response of an individ-ual at any banner exposure occasion. For instance,information on a consumer’s demographics, modemspeed, Internet access fees, and online experiencecould all play a role in affecting ad clicking behavior.Because demographic and related consumer-specificinformation is not readily accessible from click-stream data, we do not specify any consumer-levelcovariates in our model. Consequently, in this paperwe do not separately estimate ai (consumer-specificintercept) from �′Zi (consumer-specific variables).Instead, following Jones and Landwehr (1988), wecollect all the consumer-specific influences into a
single heterogeneity parameter that we term intrinsicclick-proneness, �i = ai+�′Zi.Substituting the variables that can be obtained from
the clickstream data under consideration in Equa-tion (3) we have a model capturing intraindividualchange in click probability,
Pr�Clickiso = 1 � Clickis�o−1�� � � � � Clickis1 = 0�= �1+exp��is+�1isBanneriso+�1
′is Banner
2is
+�2isPagesiso+�3isAdvertiseriso+�1i ISTis
+�2iTBanneris+�3iTLClickiso+�iso��−1 (4)
with variables Banneriso, the number of banner expo-sure occasions so far in the session, Pagesiso, the num-ber of pages accessed so far, Advertiseriso, a dummyvariable indicating advertiser, ISTis, the intersessionduration at session s, TBanneris , the cumulative ban-ner exposures since the first-ever visit to the site, andTLClickiso the time since the last click in prior sessions(see also Footnotes 6 and 7). Variable operationaliza-tions are fully described in Figure 1 and §3.3.1 below.We note from Equation (4) that the parameters
in ���, and � are consumer specific. Given enoughobservations for each consumer in each session, wecould consistently estimate these parameters. How-ever, in practice, there is not an adequate numberof observations for each consumer to accomplish thistask. We capture different levels of heterogeneity inclick response across consumers and evolution ofresponse (or learning behavior) across sessions byallowing the coefficients in � and � to evolve acrosssessions for a given individual and vary across con-sumers. Because there are multiple banner exposureoccasions for the same consumer and in each ses-sion, the variance in the unobserved customer-specificparameters induces a nonzero correlation in within-consumer outcomes.We specify that the parameter coefficients for intrin-
sic click-proneness ��is�, response to banner ad expo-sures ��1is� �
1′is �, pages browsed ��2is�, and advertiser ��
3is�
in Equation (4) are drawn from a random distribu-tion, i.e., �is ∼ N��is � �̄���� and �is ∼ N��is � �̄����.The mean gives us the average response of theexplanatory variable, while the standard deviationwill give us a measure of the heterogeneity in
Marketing Science/Vol. 22, No. 4, Fall 2003 527

CHATTERJEE, HOFFMAN, AND NOVAKImplications for Web-Based Advertising Efforts
the response coefficient. We expect the randomcomponents of the explanatory variables to covary.This assumption strikes a middle ground betweenestimating a unique set of parameter coefficients foreach consumer and assuming that all consumers arethe same, and it is the assumption behind randomparameters logit. Furthermore, as the consumer revis-its and gains experience with the website, responsesto the same variables are expected to change over ses-sions. The corresponding parameters in Equation 4are underlined with two lines.
3.2.3. Deriving the Model. To capture the evolv-ing nature of the coefficients across sessions for eachconsumer similar to growth models in the statisticsliterature (Bryk et al. 1996),
�is = �0+�1Sessioni+ �0is�
�1is = �10+�11Sessioni+ �1is�
�1′
is = �1′0+�1
′1Sessioni+ �1′
is � (5)
�2is = �20+�21Sessioni+ �2is�
�3is = �30+�31Sessioni+ �3is�
In Equation (5), the coefficients �1, �11, �1′1, �21,and �31 capture the evolution of response parametersacross sessions.Coefficients (in �) of session-invariant variables in
Equation (4) vary randomly across consumers, withdensity �f�i � ��, where � are the true parameters ofthe distribution. We use a random effects specifica-tion to characterize the population in terms of thedistribution of coefficients. As above, we expect therandom components of session-invariant parametersto covary, independent of session-varying parame-ters. Further, because there are multiple sessions forthe same consumer, the variance in the unobservedcustomer-specific parameters induces a nonzero cor-relation in within-consumer outcomes. We specifythat parameter coefficients as
�1i = �1+�1i � �2i = �2+�2i � �3i = �3+�3i � (6)
Substituting Equations (5) and (6) into Equation (4),and rearranging, we have
Pr�Clickiso = 1 � Clickis�o−1�� � � � � Clickis1 = 0�
= �1+exp��0+�1Sessionis+ ��10+�11Sessionis�
·Banneriso+ ��1′0+�1
′1Sessionis�Banner2iso
+ ��20+�21Sessionis�Pagesiso+ ��30+�31Sessionis�
·Advertiseriso+�1ISTis+�2TBanneris
+�3TClickiso+�iso+ �0i + �1i Banneriso
+ �1′
i Banner2iso+ �2i Pagesiso+ �3i Advertiseriso
+�1i ISTis+�2i TBanneris+�3i TLClickiso%�−1� (7)
In general, modeling with randomly varying coef-ficients allows us to separate within-session, within-individual (or across session), and between-individualvariation. The � and � terms in Equation (7) arenot directly observed and enter into the unobservedportion of the utility in the equation, allowing theunobserved portion of the utility to be correlatedacross occasions for the same consumer. This correla-tion allows random parameters logit to avoid the IIAproblem. The inclusion of error terms in the Equa-tion (5) makes Equation (7) difficult to estimate. If the� and � terms were excluded, this becomes a fixedeffects model and specification is through interactionterms. Unfortunately, that also implies a deterministicrelationship between click probability and the influ-ence of ad exposure variables. The statistical estima-tor must estimate a model with mixed-level errors,a random specification of coefficients, and a binarydependent variable. Details of model estimation canbe found in Appendix B.
3.2.4. Benchmark Models. We estimate and con-trast this model with three alternative models withsimpler heterogeneity structures by specifying thatthe coefficients in �, �, and � remain constant or varyacross consumers for a given individual.Alternative Model 1 (logistic model with nonrandomly
varying coefficients across session and no heterogeneity):We start with a restricted model in which all het-erogeneity has been eliminated by restricting allcoefficients in Equation (4), to nonrandomly varyacross sessions only, i.e., �i = �0 + �1Sessioni, �i =�0 + �1Sessioni, and �i = � in Equation (4) for allconsumers i. Hence, we retain all applicable inter-action terms with Sessionis for comparison purposes
528 Marketing Science/Vol. 22, No. 4, Fall 2003

CHATTERJEE, HOFFMAN, AND NOVAKImplications for Web-Based Advertising Efforts
but do not allow for heterogeneity across con-sumers. Estimation reduces to the standard binarylogit model using maximum likelihood and is equiv-alent to assuming that all consumers have similarresponse coefficients across sessions. Substituting inEquation (7) we have
Pr�Clickiso = 1 � Clickis�o−1�� � � � � Clickis1 = 0�= �1+exp��0+�1Sessionis+ ��10+�11Sessionis�
·Banneriso+ ��1′0+�1
′1Sessionis�Banner2iso
+ ��20+�21Sessionis�Pagesiso+ ��30+�31Sessionis�
·Advertiseriso+�1ISTis+�2TBanneris
+�3TLClickiso+�iso%�−1� (8)
Alternative Model 2 (intercept-specific heterogeneity orlinear probability model with random intercepts): Herewe restrict the heterogeneity of coefficients to theintercept term, intrinsic click-proneness, �is only.Chintagunta et al. (1991) notes that incorporat-ing intercept heterogeneity improves model fit andexplanatory power. We let consumers differ in theiridiosyncratic click-proneness by specifying the inter-cept term as the sum of an unobserved component �0,which represents the average click-proneness acrossall consumers; �1 which represents the change inclick-proneness in each session; and a random com-ponent �0is, which represents stochastic deviation in anindividual’s click-proneness in each session relative tothe population mean.
�is = �0+�1Sessionis+ �0is� (9)
The response parameters �ki = �k remain invari-ant across consumers. In contrast to the standardlogit in Alternative Model 1, the stochastic por-tion of the model �0is + �iso is in general correlatedacross banner exposure outcomes and across sessionsfor an individual because of the common influenceof �0is. Heterogeneity across consumers is capturedby the probability distribution of the random vari-ables exp��0is�. To maximize the likelihood functionwe specify a normal distribution for f ��0is�. Whilethis intercept-specific heterogeneity model containsjust two sources of uncertainty, the error � and ran-dom effect �0is our proposed model has eight rep-resented by terms in �, �, and � . The random
effect indicates that there is additional variation inindividual click-proneness beyond that explained byevolution in response across sessions. The equivalentspecification for Equation (7) will be
Pr�Clickiso = 1 � Clickis�o−1�� � � � � Clickis1 = 0�= �1+exp��0+�1Sessionis+ ��10+�11Sessionis�
·Banneriso+ ��1′0+�1
′1Sessionis�Banner2iso
+ ��20+�21Sessionis�Pagesiso+ ��30+�31Sessionis�
·Advertiseriso+�1ISTis+�2TBanneris
+�3TLClickiso+�iso+ �0i %�−1� (10)
Alternative Model 3 (random effects model withconsumer-specific heterogeneity but no evolution acrosssessions): We develop a random effects specifica-tion without considering across-session evolution.We treat all coefficients in Equation (4) as randomover individuals. We assume that coefficients are dis-tributed multivariate normal
�is = �+ �0is� �kis = �k+ �kis� (11)
��i� �is%∼MVN�����s�� ��'�%�
with unknown means �, �, and variance-covariancematrix �2', where the error variance �2 is con-stant across individuals. We allow the variance ofthe distributions for each intercept and parameterof the explanatory variables to be different. Thus,the parameters for consumer i vary from the meanthrough the random additive components �i and �kis.This model is a special case of our proposed modelin that, for a given consumer, the parameters remainconstant across sessions. Note that the mean of therandom components other than zero is not identi-fied, and we expect the random components of theexplanatory variables to covary. The random effectsmodel corresponding to Alternative 3 is specified bysetting terms with variable Sessionis in Equation (7)to 0:
Pr�Clickiso = 1 � Clickis�o−1�� � � � � Clickis1 = 0�= �1+exp��0+�10Banneriso+�1
′0Banner2iso
+�20Pagesiso+�30Advertiseriso+�1ISTis
Marketing Science/Vol. 22, No. 4, Fall 2003 529
CHATTERJEE, HOFFMAN, AND NOVAKImplications for Web-Based Advertising Efforts
+�2TBanneris+�3TLClickiso+�iso+ �0i
+ �1i Banneriso+ �1′
i Banner2iso+ �2i Pagesiso
+ �3i Advertiseriso+�1i ISTis+�2i TBanneris
+�3i TLClickiso%�−1� (12)
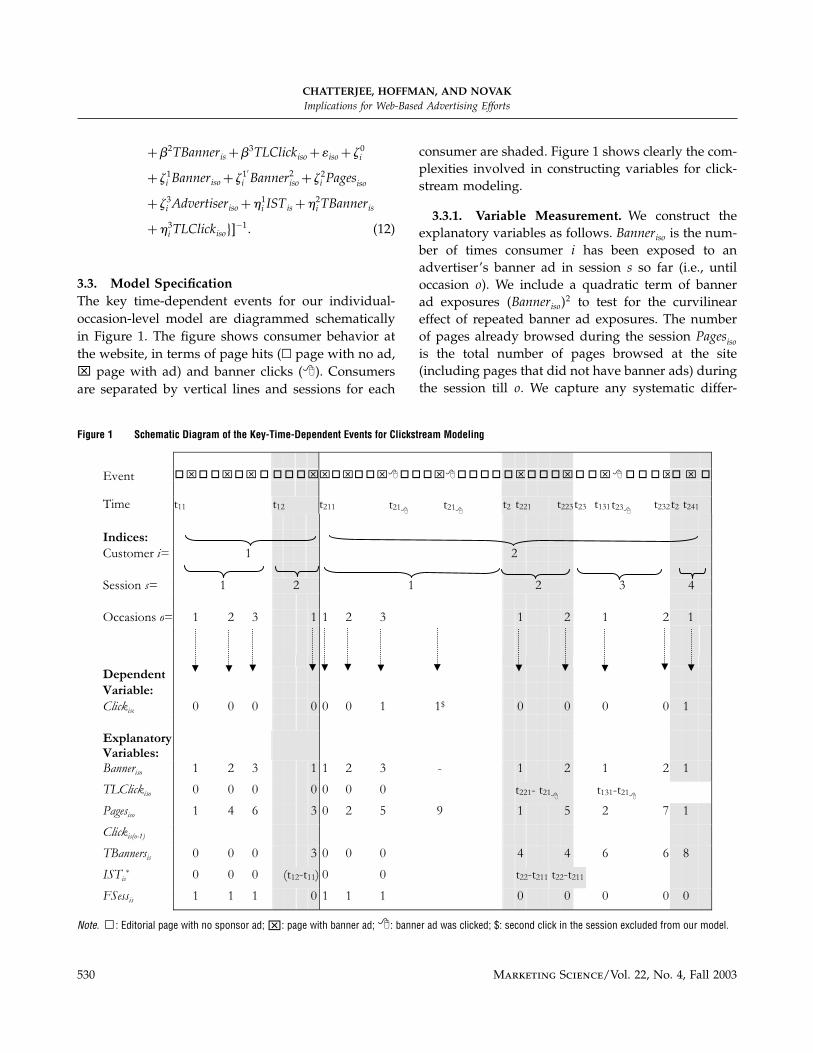
3.3. Model SpecificationThe key time-dependent events for our individual-occasion-level model are diagrammed schematicallyin Figure 1. The figure shows consumer behavior atthe website, in terms of page hits (� page with no ad,⌧ page with ad) and banner clicks (�). Consumersare separated by vertical lines and sessions for each
Figure 1 Schematic Diagram of the Key-Time-Dependent Events for Clickstream Modeling
Event
Time t11 t12 t211 t21 t21 t2 t221 t223t23 t131t23 t232t2 t241
Indices:
Customer i= 1 2
Session s= 1 2 1 2 3 4
Occasions o= 1 2 3 1 1 2 3 1 2 1 2 1
Dependent
Variable:
Clickiso 0 0 0 0 0 0 1 1$ 0 0 0 0 1
ExplanatoryVariables:
Banneriso 1 2 3 1 1 2 3 - 1 2 1 2 1
TLClickiso 0 0 0 0 0 0 0 t221- t21 t131-t21
Pagesiso 1 4 6 3 0 2 5 9 1 5 2 7 1
Clickis(o-1)
TBannersis 0 0 0 3 0 0 0 4 4 6 6 8
ISTis* 0 0 0 (t12-t11) 0 0 t22-t211 t22-t211
FSessis 1 1 1 0 1 1 1 0 0 0 0 0
Note. � : Editorial page with no sponsor ad;⌧: page with banner ad;�: banner ad was clicked; $: second click in the session excluded from our model.
consumer are shaded. Figure 1 shows clearly the com-plexities involved in constructing variables for click-stream modeling.
3.3.1. Variable Measurement. We construct theexplanatory variables as follows. Banneriso is the num-ber of times consumer i has been exposed to anadvertiser’s banner ad in session s so far (i.e., untiloccasion o). We include a quadratic term of bannerad exposures �Banneriso�2 to test for the curvilineareffect of repeated banner ad exposures. The numberof pages already browsed during the session Pagesisois the total number of pages browsed at the site(including pages that did not have banner ads) duringthe session till o. We capture any systematic differ-
530 Marketing Science/Vol. 22, No. 4, Fall 2003

CHATTERJEE, HOFFMAN, AND NOVAKImplications for Web-Based Advertising Efforts
ences in click probabilities across the two advertisersor brands by a dummy variable Advertiseriso �=1 foradvertiser #15, 0 otherwise).The session-specific variables corresponding to time
since last click in prior sessions �TLClickiso�, inters-ession time �ISTis��, number of times the consumerhas visited the site �Sessionis� and cumulative bannerexposures in prior sessions �TBanneris� are measuredfor each session and remain the same for all bannerexposure occasions in a session. The time since lastclick in prior sessions TLClickiso is the logarithm oftime since last click in previous sessions at the site.If the consumer clicked more than once in a session,then the last click could potentially be in the cur-rent session. Because we are modeling first click ina session, TLClickiso is always from the prior sessionand greater than 0 if the consumer has ever clicked,by definition. Figure 1 shows that if the consumernever clicked on an ad, TLClickiso is set to zero. Thisdoes not represent the true time since last click, but itdoes serve to eliminate this term from Equation (7).TLClickiso is the time since the last of the multipleclicks in the prior session. For example, TLClickiso for
Table 2 Descriptive Statistics
Variables Sponsor #15 Sponsor #34 Pooled Data
Occasion-Varying
Average number of banner exposures in 4�93 �7�63� 3�53 �1�19� 3.66 (6.9)session s until o: Banner iso [1–90] [1–15] [1–90]
Pages browsed so far in session: Pagesiso 3�65 �4�54� 2�17 �5�83� 3.22 (5.01)[1–132] [1–84] [1–132]
Time since last click (logarithm hour): 2�32 �1�81� 0�75 �1�46� 1.90 (1.86)TLClick iso [0–5.63] [0–0.69] [0–5.63]
Session-Varying
Average intersession time (minutes) 85�11 �96�66� 88�03 �108�24� 85.69 (99.07)AIST is [3.03–1,615] [3.15–1,454] [3.03–1,615]
Number of cumulative banner exposures 20�05 �33�4� 17�43 �30�84� 19.54 (33.01)in prior sessions: TBanner is [0–281] [0–173] [0–281]
Percentage of clicks in first session 15�51 3�48 11.17
Other Information
Number of clicks 1,107 624 1,731Number of banner exposure occasions 23,974 10,709 34,683Number of sessions with banner exposures 4,704 3,629 8,333
Note. Standard deviation is in parentheses ( ); range is in square brackets [ ].
the first banner ad exposure occasion in session 2 forconsumer 2 is t221− t21� .The number of times a consumer visited the site,
including those visits where there was no exposureto banners for the advertiser �Sessionis� and the cumu-lative number of banner exposures in prior sessions�TBanneris� is measured since the time the consumerfirst registered at the site till the occasion under con-sideration from registration records. These can be cal-culated a priori from consumer registration recordsand clickstream history at the site.
4. ResultsDescriptive statistics for the explanatory variables arein Table 2. Because click occurrences are rare events,pooling the data offers distinct advantages over mod-eling each sponsor separately. We tested for overallhomogeneity of both sponsors and concluded thatpooling was appropriate. The details are provided inAppendix A.We first tested to see if the data supported specify-
ing the explanatory variables as random. Preliminary
Marketing Science/Vol. 22, No. 4, Fall 2003 531

CHATTERJEE, HOFFMAN, AND NOVAKImplications for Web-Based Advertising Efforts
estimation of reliabilities indicated that the ran-dom effects of quadratic term of banner exposure�Banneriso�2 and advertiser �Advertiseriso� across con-sumers are not significant; hence we treat themas fixed effects. Similarly, analyses of the reliabil-ity variance estimates suggests that random effectsof session-level variables time since last click inprior sessions �TLClickiso� and total banner exposure�TBanneris� in Equation (7) should be constrained tozero, hence these variables are also specified as fixedeffects. Hence Equation (4) can now be respecified as
Pr�Clickiso = 1 � Clickis�o−1�� � � � � Clickis1 = 0�= �1+exp��is+�1isBanneriso+�1
′isBanner
2is
+�2isPagesiso+�3isAdvertiseriso+�1i ISTis
+�2iTBanneris+�3iTLClickiso+�iso��−1� (13)
4.1. Model FitTable 3 reports the fit statistics for the four mod-els. We used the log likelihood, defined as (̄2 = 1−�L−k�/L�0�, where L is the log-likelihood of the modelbeing estimated, and L�0� is the log-likelihood of themodel with only the intercept term, thus adjustingfor the number of parameters in each model (Ben-Akiva and Lerman 1985) to compare predictive perfor-
Table 3 Prediction Success Table for Click Outcomes
Predicted Outcomes
Proposed Model Alternative 1 Alternative 2 Alternative 3
Observed Choice Click No Click Click No Click Click No Click Click No Click
Click (561) 232 329 14 517 136 425 187 374No click (11,058) 64 10�994 221 10�837 272 10�785 139 10�919Total (11,619) 316 11�303 235 11�354 408 11�210 296 11�357Hit rate 41 99�4 2�4 95�4 24�2 96�2 33�3 98�7
Total hit rate 96 93 94 95.5Success index 0.279 0.170 0.213 0.256Log-likelihood −13�245�7 −14�247�8 −13�801�4 −13�598�7
Fit Statistics for Calibration SampleLog likelihood −39,166.4 −43�678�9 −41�139�7 −40�016�5AIC 39,184.4 43�689�9 41�151�7 40�030�5BIC 39�207�45 43�703�99 41�167�07 40�048�43�̄2 0.36 0.28 0.32 0.34No. of parameters estimated 18 11 12 14
mance of the proposed models. By adding heterogene-ity and evolution in the intercept, the log-likelihoodincreases by over 20% in Alternative Model 1. Theadvantages of accounting for heterogeneity only in theintercept and slope parameters in Alternative Model2 and heterogeneity and evolution in the slope andintercept coefficients in our proposed model are high-lighted by the significant improvement in fit.We also report the Akaike Information Criterion
(AIC = −LL+ k). The advantage of BIC over AICis that it penalizes for an increase in the numberof parameters and sample size. After accounting forthe increased number of parameters via the BIC(Bayesian Information Criterion; defined as −LL+0�5k log�N �, where k is the number of parameters,N is sample size, and LL is the log-likelihood),our proposed model incorporating heterogeneity andevolution across sessions in the intercept and slopeparameters is the preferred specification.Because the behavior we are trying to predict is
relatively rare (the base probability of outcome isvery low), we also calculated another measure of pre-dictive fit as described in Morrison (1969). We rankordered the 11,619 observations in the holdout sam-ple in decreasing order of their predicted probabilitiesand classified the first 561 as clicks (the total numberof clicks observed in the holdout sample). We also
532 Marketing Science/Vol. 22, No. 4, Fall 2003

CHATTERJEE, HOFFMAN, AND NOVAKImplications for Web-Based Advertising Efforts
report success indices for each of the models. Whilethe alternative models also have high hit rates, thisprediction accuracy should be interpreted with cau-tion (because it is driven by disproportionately highernumbers of no click outcomes), given that only 2.4%,24.2%, and 28% of clicks are correctly predicted. Theproposed model actually does far better in predictingclicks (41%), the gain being primarily due to incorpo-rating correlated random effects and evolution acrosssessions.Note that from a managerial standpoint, a sim-
ple linear additive model will correctly predict theaverage click rate, though this predictive accuracywill come at the expense of diagnostic ability.11
Because click-throughs on banner ads are extremelyrare events, with a large number of nonevents (i.e.,no clicks) and very few events (i.e., clicks), it is wellknown that logistic regression models can sharplyunderestimate the probability of occurrence of events(e.g., see King and Zeng 2000).Table 4 reports the analyses of consumers’ click
decisions using Equations (7), (8), (10), and (12) mod-ified according to respecifications in Equation (13).Parameter estimates and standard deviations (inparentheses) are reported for variables significantin at least one model. The parameter estimatesof the proposed model are significant and in theexpected direction. Similar patterns obtain for thealternate models, though differing parameter magni-tudes would lead to different managerial conclusions.
4.2. Model ImplicationsIn this section, we discuss our specific findings.Within a session, we expected a negative and nonlin-ear effect on click probability due to wearout; we alsotheorized that earlier ads would have a higher prob-ability of being clicked on than ads exposed later.Across sessions, we expected that longer interses-
sion times in prior sessions and more banner expo-sures in prior sessions, and more time since the lastclick in prior sessions would lead to higher clickprobabilities in the current session. Additionally, weexpected that click probability would decline as thetotal number of sessions increased. We also discuss
11 We thank the AE for suggesting this.
our results for consumer heterogeneity in terms ofclick-proneness.
4.2.1. Intrasession Effects. Both the variable ban-ner ad exposures Banneriso and its quadratic term�Banneriso�2 have a significant effect on probability offirst click in a session in all of the model specifi-cations. However, Table 4 shows that the coefficientof linear effect of banner exposures is negative andsignificantly larger than the positive quadratic termleading to a negative and nonlinear impact on clickprobability, as expected. Most consumers click on thefirst exposure to the banner ad in a session. If a con-sumer does not click on the first banner ad exposure,additional banner exposures in the session have lowerprobabilities of generating clicks initially, but this neg-ative effect levels off at very high levels of bannerad exposure. This indicates that the marginal effect ofbanner ad exposures on click probability is negativeat an increasing rate until the tenth banner exposurein the session and decreasing thereafter.In aggregate, the elasticity function reaches its min-
imum at 11 exposures, increasing thereafter indicatingthere might be incremental gain in displaying bannerads for the sponsor more than 11 times during a ses-sion. In our study, consumers were exposed to morethan 11 banner ad exposures in 21.5% of all sessions.Each additional banner ad exposure decreases theclick probability by a factor of 0.672 (on a base proba-bility of 0.043) until 11 exposures and increases there-after, within the range of our empirical data. Note thatbanner exposure coefficient is a random effect thatchanges from session to session for each consumer(however, the quadratic coefficient does not, the datasupport its specification as a fixed effect). The statisti-cal significance of the variance of the banner exposurecoefficient �Var��10�= 1�082� indicates that consumersare, as we theorized, heterogeneous in their responseto banner ad exposures.The mean of number of pages browsed in the ses-
sion s till banner exposure occasion o was not signif-icantly different from zero at 90% confidence ��20 =−0�013�; however, the standard deviation of the coef-ficient �Var��20�= 1�094� is significant and fairly large.This suggests that number of pages browsed affectsthe click decision, with some consumers preferring toclick early during the session and others clicking late
Marketing Science/Vol. 22, No. 4, Fall 2003 533

CHATTERJEE, HOFFMAN, AND NOVAKImplications for Web-Based Advertising Efforts
Table 4 Probability of First Click in a Session: Regression Coefficients
Models: Proposed Model Alternative 1 Alternative 2 Alternative 3
Evolution across sessions: Yes None Intercept only None
Heterogeneity specification: Intercept and slope None Intercept only Intercept and slope
Variables
�0 −4�123 −4�016 −4�623 −4�003Click-proneness intercept �0�379� �0�381� �0�470� �0�454�
Banneriso −0�402 −0�378 −0�266 −0�307Banner ad exposures present session �0�071� �0�074� �0�069� �0�104�
(Banneriso�2 0�018 0�016 0�014 0�0006Quadratic effect of present �0�009� �0�001� �0�004� �0�004�
session banner exposures
Pagesiso −0�013 −0�040 −0�007 −0�011Number of pages browsed �0�086� �0�016� �0�016� �0�013�
ISTis 0�131 0�113 0�276 0�035Intersession time till session s �0�073� �0�033� �0�040� �0�037�
TBannerI�s−1� 0�052 0�033 0�024 0�032Cumulative banner ad exposures �0�002� �0�002� �0�003� �0�002�
in prior sessions
TLClickiso 0�391 0�377 0�318 0�316Time since last click �0�039� �0�021� �0�021� �0�021�
Sessionis −0�006 0�020 0�018 —Number of sessions at site �0�002� �0�007� �0�005�
Banneriso ∗Sessionis −0�021 −0�014 −0�013 —�0�009� �0�006� �0�005�
Pagesiso ∗Sessionis 0�014 −0�112 −0�114 —�0�016� �0�019� �0�017�
Advertiseriso 0�002 0�019 0�045 0�003�0�005� �0�119� �0�097� �0�106�
Variance of random effect intercepts
�0 7�37 — 6�94 3�87�0�609� �0�283� �0�922�
�10 1�082 — — 2�965�0�180� �0�313�
�20 1�094 — — 0�149�0�011� �0�015�
Cov��0� �10� −2�107 — — −4�99�0�342� �0�547�
Cov��10� �20� 0�017 — — 0�111�0�034� �0�049�
Cov��0� �20� −0�311 — — −0�062�0�074� �0�100�
�1 2�014�0�037�
Notes. Data was pooled for both sponsors. The log-likelihood value for the model with only intercepts was −60�835�91. The normalization in the estimationwas with respect to advertiser #34. Boldface type indicates that probability exceeds 0�90 that coefficient is > or <0, as indicated by the sign of coefficient.
534 Marketing Science/Vol. 22, No. 4, Fall 2003

CHATTERJEE, HOFFMAN, AND NOVAKImplications for Web-Based Advertising Efforts
in the session. The mean is not significantly differ-ent from zero because the different behaviors tend tocancel each other out in the population.
4.2.2. Intersession Effects. The positive coeffi-cient of intersession time ��1 = 0�131� on click prob-ability indicates that for each consumer, click prob-ability increases with increasing duration betweenvisits, as expected. The large, statistically significantvariance �Var��1�= 2�014� suggests time between vis-its significantly impacts click behavior on ads andthat consumers differ with respect to repeat site visitbehavior. In general, new visitors and less frequentvisitors are more likely to click on ads than more reg-ular visitors. Between-session variation is large, mostlikely because consumers differ in their goals and ori-entation for visiting a site and contextual factors suchas time pressure, also differ on each visit.Also as expected, the effect of cumulative banner
exposures in prior sessions has a small positive, butsignificant, effect on click probability. Each additionalbanner ad exposure increases the click probability infuture sessions by a factor of 1.003.Consumers who clicked on a banner ad at least
once in prior sessions had a significantly higherpropensity to click after exposure to the banner ad,compared to those who never clicked (�2is = 0�391,Table 4). Additionally, consumers who have alreadyclicked in earlier sessions are more likely to click infuture sessions as time since last click increases, asexpected. For each additional day since the last click,the predicted click probability increases by a factorof 1.497 (on a base probability of 0.041, ignoring theeffect of other variables).We find that, overall, click probability decreases
with increasing visits to the site (Table 4, �1=−0�006).This negative repeat visit effect was expected dueto increases in experience and consumer learning.However, split-sample results (not reported herein the interests of space) indicate this may notalways be true. Click-through rates may increase withfamiliarity.12
4.2.3. Click-Proneness. The click-proneness inter-cept �0 = −4�123 (Table 4, second row) suggests a
12 We thank the AE for pointing this out.
click probability of 0.039, after all other explana-tory variables are set to zero, i.e., when clickprobabilities depend solely on intrinsic characteris-tics of consumers. As the click-proneness interceptbecomes increasingly negative, the consumer clickprobability decreases. The large variance of theclick-proneness intercept indicates significant disper-sion in click-proneness across consumers.The correlations among variables specified as ran-
dom effects across consumers (see Table 4) has impor-tant implications. Across consumers, the estimatedcorrelation between banner exposure coefficient andthe click-proneness coefficient �Cor��0� �10� = −0�74�is significant, providing evidence that response toeach additional banner ad exposure varies withinnate click-proneness of the consumer. Banner adswear out faster for consumers with a higher click-proneness coefficient. The small but significant nega-tive correlation between click-proneness and numberof pages browsed so far �Cor��0� �20� = −0�109� indi-cates that consumer with higher click-proneness coef-ficient browse through fewer pages than those withlower click-proneness coefficient.
5. DiscussionIn this paper, we modeled the clickstream of con-sumer responses to banner ads at an advertiser-supported Web site with mandatory visitor reg-istration. Our parsimonious, yet flexible modelingapproach allows us to decompose the variability inconsumers’ binary click responses over time anddemonstrate that the conditional probability of aclick response is heterogeneous across consumers andvaries across sessions for each consumer. Within asession, we found a negative and nonlinear effecton click probability due to wearout, and that ear-lier ads had a higher probability of being clicked onthan ads exposed later. Across sessions, we found thatlonger intersession times in prior sessions, more ban-ner exposures in prior sessions, and more time sincethe last click in prior sessions led to higher click prob-abilities in the current session. We also found thatclick probability declined as the total number of ses-sions increased.
Marketing Science/Vol. 22, No. 4, Fall 2003 535

CHATTERJEE, HOFFMAN, AND NOVAKImplications for Web-Based Advertising Efforts
5.1. Consumer Identification and the“Cookie” Problem
The lack of complete consumer identification in click-stream data poses a challenge that many advertiser-supported Web sites address by implementingidentification procedures involving “cookies” (smallfiles stored on the consumer’s hard disk that allow theclient-side browser to be tagged with a unique iden-tifier) or voluntary registration. While we use click-stream data collected at a Web site with a mandatoryregistration policy over a sufficiently long period oftime, most Web sites are reluctant to require manda-tory registration. However, because cookies operateimplicitly, most consumers are not aware13 that vir-tually all commercial Web sites use cookies to trackvisitor behavior.As a modeling solution, the use of cookies to
track consumer behavior across sessions is problem-atic. Many consumers access the Web using multiplebrowsers on multiple computers (e.g., home, school,office, friend’s house, library, and so on). Addition-ally, a single computer (e.g., at home) may havemultiple users, and each time a computer accessesthe Internet through an Internet service provider,dynamic addressing assures that each session isassigned a different IP address. Thus, using onlycookies, it becomes very difficult to assign a partic-ular consumer to a particular session, let alone linksessions together. One popular technique captures theconsumer’s name at some point through registrationor purchase and subsequently uses this informationto identify the individual and attempt to link sessions,for example by displaying something like, “Welcomeback, Jane Doe. If you are not Jane Doe, then pleaselog in here.” Yet clearly, cookies do not allow themodeler to exploit similarities in click behavior acrosssessions for each consumer and further restrict het-erogeneity at the level of each consumer session. This
13 Experienced online consumers are aware that they can changethe default settings of cookie preferences on their browsers to dis-able cookies if they so desire. In that case, using cookies becomesexplicit. However, most advertiser-supported commercial Web sitesdeny access to browsers that have disabled cookies, so in practice,the consumer has no choice but to allow cookies if Web site entryis desired.
therefore has the potential to create biased estimatesof response parameters.Our research highlights the importance of explicit
consumer identification procedures to enhance thevalue of clickstream data. Intersession click behaviorwas an important component of our model across allsegments for ads of both sponsors in this study andemployed to capture heterogeneity across consumersand model click propensity. Without such identifica-tion, the modeling effort will necessarily be limited tocross-sectional effects and may lead to considerablyweaker performance in terms of predictive ability.Although clickstream data undoubtedly represent a
powerful new source of behavioral insight for mar-keting scientists, the clickstream data we analyze inthis paper limit our modeling effort in a number ofways. First, we must be cautious generalizing fromjust two sponsors. Second, our data preclude determi-nation of whether previous clicks on any ads in priorsessions, compared to the identical or even similarads in prior sessions, increases the click rate in thecurrent session. Third, the availability of banner adexposures and click data on all advertisements at thesite would have permitted estimation of overall click-proneness for each consumer at the site, thus allow-ing the site to identify consumers who click moreon ads in general. Fourth, data on individual ban-ner executions, ad/content congruence and contentrefreshment rates would possibly yield richer insightsregarding observed wearout effects. Finally, post-clickresponse data, not available for this study, would alsohave been useful. Nevertheless, we have obtained anumber of interesting theoretical results with impor-tant implications for online advertising practice.
5.2. Key Managerial ImplicationsIn stark contrast with broadcast media, online mar-keters are able to use sophisticated technologies suchas smart ad delivery and tracking on rich clickstreamdatabases to fit models similar to the ones devel-oped here. Such individual-level models can thus helpmarketers develop more effective online advertisingstrategies.Our results tend to show that the more click-
prone consumers experience faster wearout to ban-ner ads and browse through fewer pages than less
536 Marketing Science/Vol. 22, No. 4, Fall 2003

CHATTERJEE, HOFFMAN, AND NOVAKImplications for Web-Based Advertising Efforts
click-prone consumers. The marketing implicationsare simple but important. There will be greater gainsin repeating banner ads for consumers (1) who havelow click-proneness coefficients (low click probabil-ity) in a given session and (2) who in general donot click much on average. Because additional bannerad exposures in prior sessions appear to increase theprobability of a click in future sessions, there may bebenefit to exposing consumers to banner ads even ifthey do not click on them during the current session.However, these gains will likely accrue only withrepeat visits the site. Hence, while repeating bannerads in the short run (within a session) may lead totedium effects that decrease beyond a threshold levelof exposure, over the long run (across future sessions)repetition may increase click probability.The level of banner ad exposure that leads to these
gains varies across sessions for each consumer andacross consumers. It appears that gains from rep-etition accrue earlier (and hence more) in sessionswhere consumers click more on banner ads in general.Click behavior in prior sessions predicts click behav-ior in the future with more clicks occurring when con-sumers are exposed to the banner ads again after arelatively long interval. Banner advertising exposuresin prior sessions impacts banner exposure wearout infuture sessions. Finally, we found that an increase invisit frequency appears to be associated with lowerclick probability in general. However, this implies thatdeclining click-proneness across sessions at the sitecan be mitigated if consumers visit the site less fre-quently, or if the revisit is cycle is longer. Also notethat our split-sample results indicated that an increasein visit frequency may not always be associated withlower click probability. Future modeling efforts willbe necessary to examine and build on these results.Our results also have relevance for two impor-
tant issues in the online advertising industry:(1) declining click rates and (2) exposure-based versusperformance-based pricing models.In the long run, as the Web matures as a commer-
cial medium, the results that more banner exposuresin prior sessions led to higher click probabilities in thecurrent session implies that the proportion of click-throughs generated through repetitions will increase.Because higher levels of banner exposures will be
required to generate these gains, we believe clickrates will continue to decline over time—a naturalconsequence as consumers gain experience using themedium and become more selective in how they allo-cate their cognitive resources and time online. Gener-ating excessive number of exposures in each sessionmay not be an option for some sites that attract goal-directed consumers and where consumers browsethrough few pages and then jump to other sites. Inthose cases, embedding ads within relevant contentand using executions that arouse curiosity could bethe key to inducing clicks.Because clicks are most likely to occur during ini-
tial banner ad exposures, and consumers become lessclick-prone as they become more familiar with thesite over time, our findings help support the cur-rent industry practice of higher prices for bannersplaced on entry and popular pages. Our research alsosuggests a theoretical and empirical basis to supportimpression-based pricing. Theoretically, our modelsuggests that banner exposures that do not immedi-ately lead to a click may still lead to enduring commu-nication outcomes. Empirically, we show that bannerad exposures in prior sessions have a significant pos-itive effect on click probability in future sessions.Further, in situations where banner ads are placedacross a network of sites, it is possible that bannerad exposures generated at one site may lead to clickselsewhere. Under performance-based pricing models,Web sites that generate the cumulative effect—butnot the click—are penalized. So it is not surprisingthat hybrid pricing models combining exposure andperformance are becoming increasingly important inpractice.It is important to keep in mind that our model was
built to predict click behavior over a relatively shortperiod of time (i.e., less than a year), so this mustbe considered when evaluating its ability to explainthe variance in future click-through rates over longerhorizons.The dynamic nature of the Internet market suggests
that the model may have some difficulty predictinglong-term trends in click behavior five or more yearslater. Modeling challenges in this arena include thecontinual innovation of new ad forms, a constantlychanging landscape of Web sites that sell advertising
Marketing Science/Vol. 22, No. 4, Fall 2003 537

CHATTERJEE, HOFFMAN, AND NOVAKImplications for Web-Based Advertising Efforts
space, and changes in consumer response that are notbased on consumer reaction to online advertising.Thus, future modeling efforts may wish to take
these effects into account as they attempt to cap-ture long-term trends in click-through rates. Likelymodel variable candidates include terms that capturelong-term changes in the structure of the onlineadvertising market, such as the number and type ofadvertiser-supported Web sites, number and type ofad forms (including emerging alternatives to bannerads), and consumer behavior variables.
5.3. Concluding RemarkOur research marks one of the first attempts tomodel click outcomes from advertising exposure data,but click behavior is just one measure of advertis-ing effectiveness. Increasingly, online advertisers areultimately interested in responses subsequent to theclick, such as purchase. The first challenge for model-ing such effects lies in more strategic data collection. Datalinking advertising exposure and subsequent mar-ket responses can only be collected through adver-tising networks and collaborative marketing alliancesbetween sites and advertisers.While privacy concerns and regulatory threats loom
large (Tedeschi 2000), coming broadband access andimproved measurement technology will soon make itpossible to model the entire hierarchy of effects fromadvertising exposure and information search acrossseveral sites to product trial and purchase across sev-eral product categories. Availability of actual con-tent consumption data will also make it possible todevelop targeted ad delivery methods at the level ofa paragraph on a Web page and enable the develop-ment of consumer profiles that tie content preferencesdirectly to online purchase behavior. The availabilityof rich multisite consumer identified clickstream datawill lead to more sophisticated modeling of consumeronline behavior and more effective online marketingstrategies.
AcknowledgmentsThe authors acknowledge research support from the NationalScience Foundation from an NSF Economic, Decision and Man-agement Science Grant (Number SBR 9422780) and thank an eLab(http://elab.vanderbilt.edu/) corporate sponsor, who wishes to
remain anonymous for its generous support of this project. Thisresearch is based on the doctoral dissertation of the first author.
Appendix A: Pooling Tests of DataBecause clicks on banner ads represent rare events, we tested forhomogeneity to determine if pooling the data across the two spon-sors would be appropriate. Pooling offers the major opportunity togain degrees of freedom and improve reliability of estimates, but isappropriate only if the homogeneity hypothesis can be accepted.We tested the equality of intercepts and slopes (overall homo-
geneity) for both sponsors on the basis of a comparison of the sumof the error sums of squares from the separate regressions with theerror sum of squares of the pooled estimates using iterative gener-alized least squares procedure proposed by Gatignon and Reibstein(1986). The results appear in the following table. RSS2+RSS1−Rw =18�1, whereas critical -2 with 18 df at � = 0�05 is 19.67. The testof equality of coefficients using the difference of residual sums ofsquares with 18 df indicates that the hypothesis of equal coeffi-cients is not rejected. Therefore, pooling data for the two sponsorsis appropriate.
Iteratively Reweighted Least Square Logit Results (HomogeneityTests)
Group RSS MSE df N
UnrestrictedSponsor #15 66�855�8 2�789 23,956 23,974Sponsor #34 31�464�7 2�941 10,691 10,709
98�320�5 34,647
Completely restricted 98�338�6 2�83 34,665 34,683
The homogeneity test statistic is RSS2+RSS1−Rw ∼ -2df=K , where:RSS1 = Error sums of squares obtained from the regression for
sponsor #15RSS2 = Error sums of squares obtained from regression for spon-
sor #34RSSW = Error sums of squares obtained from the pooled regres-
sionK = number of parameters estimated (K = 18 in this research).The -2 test has k degrees of freedom.
Appendix B: Model EstimationWe specify a random effects estimator to model click outcomesat each banner exposure and as a function of covariates cap-turing browsing behavior at each exposure occasion, session,and individual’s activity at the Web site. The outcome vari-able, whether a consumer i clicked on a banner ad on exposureoccasion ois in session si , is a Bernoulli event. Equations (4)–(7)specify a random-effects model to capture heterogeneity acrossconsumers and change in response parameters across sessionswhile accounting for correlation in successive measures of clickresponse variables. Because random effects are specified at twolevels—systematic response heterogeneity (variation in response
538 Marketing Science/Vol. 22, No. 4, Fall 2003

CHATTERJEE, HOFFMAN, AND NOVAKImplications for Web-Based Advertising Efforts
coefficients across sessions) and random response heterogeneity(variation across consumers)—the random-parameters logit simu-lator by Train (1995) and Revelt and Train (1998) cannot be used.Such models have been extensively studied in the multi-
level modeling literature. Both likelihood approaches (MQL andPQL: marginal and penalized quasi-likelihood) and Bayesianmethods (empirical or MCMC estimations using adaptive hybridMetropolis-Gibbs sampling) have been suggested for estimatingmodels with Bernoulli outcomes and nested or hierarchical randomeffects (see Rodriguez and Goldman 1995 for a detailed review).As Browne and Draper (2003) recommend in their comparison ofBayesian and likelihood methods for fitting random-effects logisticregression models, we use MLE for its computational speed duringthe model exploration phase and Bayesian estimation using MCMCto produce final publishable results with an appropriate diffuseprior.For ease of exposition we respecify the random-effects logistic
regression Equation (7) as
iso = f ��0+�Xiso +�Yis + �is +�I %
= �1+exp�−��0+�Xiso +�Yis + �is +�I ��%−1� (A.1)
where �is ∼N�0�� 2� � and �I ∼N�0�� 2�� and the variables Xiso and Yis
are composite scales with the model containing many variables thatvary across banner exposure occasions in a session and those thatvary across sessions. Note that the random effects of within sessionvariables and random effects of across session variables are corre-lated; however, we assume no correlations between random effectsof within and across-session variables.
Maximum Likelihood Estimation ApproachesThe conditional likelihood function has the binomial form
L������ � ����=I∏
i=1
( iso
1− iso
)Clickiso
�1− iso�� (A.2)
To obtain the unconditional likelihood we need to multiply Equa-tion (A.2) by the density of the random effects and integrate themout. However, this is intractable. Quasi-likelihood solutions addressthis by linearizing the exponential function in Equation (A.1) via aTaylor-series expansion so that it assumes the form of a standardnormal model and then apply quasi-likelihood estimation using thebinomial distribution assumption (details in Goldstein 1995).We use a first-order Taylor expansion for the fixed part about
the current estimates. For the second-order expansion for the ran-dom part we expand about zero, and we show below how this ismodified to obtain improved estimates. We obtain at the �t+ 1�thiteration of the iterative generalized least squares (IGLS) algorithm(Goldstein 1995)
f �Ht+1� = f �Ht�+Xiso��̂t+1− �̂t �f′�Ht�+Yij ��̂t+1− �̂t�f
′�Ht�
+ �isf′�Ht�+ �2isf
′′�Ht�/2� (A.3)
where f ′�H� = f �H��1+ exp�H��−1� f ′′�H� = f ′�H��1− exp�H���1+exp�H��−1. The term on the right-hand side of (A.3) updates the
fixed part of the model and is equivalent to the standard iterativelyreweighted least squares algorithm, which leads to MLE. The thirdand fifth term on the right-hand side of Equation (A.3) leads tofirst order adjustment (Goldstein 1995). Because (A.3) is essentiallya linear model, procedures for linear hierarchical models can beused.If Ht = Xiso�̂t + Yis�̂t it uses only the fixed part predictor for
the Taylor expansion and is referred to as MQL (Breslow andClayton 1993). However, Ht =Xiso�̂t+Yis�̂t+ �̂is+ �̂s uses the Taylorexpansion about the current estimated residuals, or posterior meansof random effect and is referred to as penalized quasi-likelihood(PQL) (Breslow and Clayton 1993). While the PQL estimates are lessbiased compared to MQL due to their higher order of expansion,they lead to substantial downward bias when random effects arelarge. For this reason PQL estimates are used to generate startingvalues for the Bayesian estimation.
Bayesian ApproachesTo specify a Bayesian model, priors need to be placed on the macroparameters. Without strong intuition about the macro parameters,the priors are assumed diffuse. The particular structure is
ui =(�is
�i
)I ID∼ N2�0�Vu�� Vu =
(� 2� 0
0 � 2�
)� (A.4)
The particular structure for the prior is
7 =(�
�
)∼MVN� 0�'7 �
'−17 =
0�001 0 0
0 0�001 0
0 0 0�001�
(A.5)
We use -−2�9� ��2� � and -−2�9���
2�� priors for random-effects vari-
ances � 2� and � 2� , respectively. The inclusion of these priors in Equa-tion (7) leads to the full posteriors of f �Clickiso � �����is��I � as inBrowne and Draper (2003) which we omit expressing in its entiretyhere because of its length.This distribution does not lend itself easily to direct sam-
pling. We use the Metropolis-Gibbs approach implemented in thesoftware package MlwiN in which Gibbs sampling is used forvariances and random-walk Metropolis sampling with Gaussianproposal distributions is employed for fixed effects and residuals.We use scaled versions of the estimated covariance matrices fromPQL estimates to set the initial values of the proposal distributionvariances.We define : as the vector of all unknowns ��������� ��Vu�
where each element of : is one of the elements of the unknown vec-tors. The joint posterior for : given the data and priors is the prod-uct of the conditional density of each of the elements of :, given thetrue value of every other element of : (which are unknown). Weconstruct a Markov chain whose stationary distribution is equiv-alent to the posterior distribution of :. Let :i
n represent the ith
Marketing Science/Vol. 22, No. 4, Fall 2003 539
CHATTERJEE, HOFFMAN, AND NOVAKImplications for Web-Based Advertising Efforts
iteration of unknown n, where the vector �0 is the starting valueof the chain. The chain then iterates in the following manner bydrawing successively from the distributions.In step 1, fixed effect coefficients � is updated using the random-
walk Metropolis as follows: For l = 0� � � � � m and with ��−m� signi-fying the � vector without component m
��t�m = �∗m with probability min
[1�
p��∗m � c� ������−m��
p���t−1�m � c� ������−m��
]
= �9�t−1�m otherwise,
where�∗m ∼ N��9�t−1�m �� 21m��
and
p(�m � c� ������−m�
)∝∏
iso
[1+ e−�X��iso
]−Clickiso [1+ e�X��iso]Clickiso−1� (A.6)
In step 2, Metropolis-updates the across-session residuals �is : fors = 1� � � � � si and i = 1� � � � � I
��t�is = �∗is with probability min
[1�
p��∗is � C������ 2� �
p���t−1�is � C���� 2� �]
= ��t−1�is otherwise�
where
�∗is ∼ N
(��t−1�is �� 22is
)�
and
p��is � c������ 2� �∝ �−1� exp
(− �is2� 2�
)
·∏iso
[1+ e−�X��iso
]−Clickiso [1+ e�X��iso]Clickiso−1�
(A.7)In step 3, a Metropolis update of across-consumer residuals �I
��t�i =�∗
i with probability min
[1�
p��∗i � C������ 2��
p���t−1�i � C������ 2��
]
=��t−1�i otherwise,
where
�∗i ∼ N
(��t−1�i �� 23i
)�
and
p��i � c� ����� 2��∝ �−1� exp
(− �i
2� 2�
)
·∏iso
[1+ e−�X��iso
]−Clickiso [1+ e�X��iso]Clickiso−1�
(A.8)In step 4, Gibbs update of across-session variance � 2�
�� 2� � ��∼ V −1[Nj +9�
2�12
(9�S
2� +
∑is
�2jk)]� (A.9)
where NJ =∑K
k=1 Jk is the total number of level 2 units.
Finally, step 5 is a Gibbs update of level 3 variance � 2�
�� 2� � ��∼ V −1[I +9�2
�12
(9�s
2� +
∑i
�2)]
�
where I is the number of consumers in the sample. We derive thespecification of the variances �1m��2is , and �13i , of the proposal dis-tributions from the PQL estimates.
ReferencesAllenby, Greg M., Peter E. Rossi. 1999. Marketing models of con-
sumer heterogeneity. J. Econom. 89 57–78.Ariely, Dan. 2000. Controlling the information flow: Effects on con-
sumers’ decision making and preferences. J. Consumer Res.27(2) 233–248.
Batra, Ravi, Michael L. Ray. 1986. Situational effects of advertisingrepetition: The moderating influence of motivation, ability andopportunity to respond. J. Consumer Res. 12 432–445.
Ben-Akiva, Moshe, Steven R. Lerman. 1985. Discrete Choice Analysis.MIT Press, Cambridge, MA.
Benway, J. P. 1998. Banner blindness: The irony of attentiongrabbing on the World Wide Web. Proc. Human Factors andErgonomics Soc. 42nd Annual Meeting 1 463–467.
Berlyne. 1970. Novelty, complexity, and hedonic value. PerceptionPsychophysics 8 279–286.
Bettman, James. 1979. An Information Processing Theory of ConsumerChoice. Addison Wesley, Reading, MA.
Bicknell, Craig. 1999. Net ad rates continue to fall. Wired News(January 25). http://www.wired.com/news/business/story/17520.html.
Breslow, N. E., D. G. Clayton. 1993. Approximate inference in gen-eralized linear mixed models. J. Amer. Statist. Association 889–25.
Briggs, Rex, Nigel Hollis. 1997. Advertising on the Web: Is thereresponse before click-through? J. Advertising Res. 37(2) 33–45.
Browne, W. J., D. Draper. 2003. A comparison of Bayesian and like-lihood methods for fitting multilevel models. Bayesian and Like-lihood Methods in Multilevel Modeling. Forthcoming.
Bryk, A. S., S. W. Raudenbush, R. T. Congdon. 1996. HierarchicalLinear and Nonlinear Modelling with the HLM12L and HLM13LPrograms. Scientific Software International, Inc., Chicago, IL.
Buchanan, Bruce, Donald G. Morrison. 1985. A stochastic modelof list falloff with implications for repeat mailings. J. DirectMarketing 2(3) 7–14.
Calder, Bobby J., Brian Sternthal. 1980. Television commercialwearout: An information processing view. J. Marketing Res.17(May) 173–186.
Chatterjee, Patrali. 1998. Modeling consumer network navigation atWorld Wide Web sites—Implications for advertising. Doctoraldissertation, Vanderbilt University, Nashville, TN.
540 Marketing Science/Vol. 22, No. 4, Fall 2003
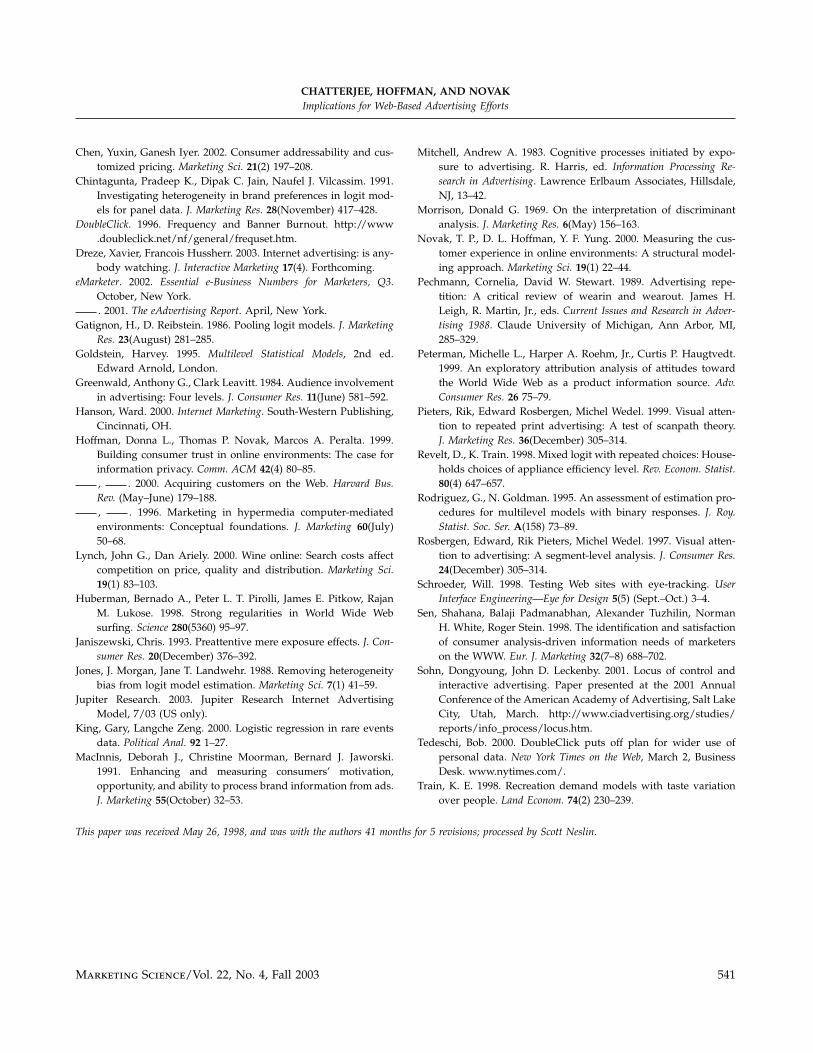
CHATTERJEE, HOFFMAN, AND NOVAKImplications for Web-Based Advertising Efforts
Chen, Yuxin, Ganesh Iyer. 2002. Consumer addressability and cus-tomized pricing. Marketing Sci. 21(2) 197–208.
Chintagunta, Pradeep K., Dipak C. Jain, Naufel J. Vilcassim. 1991.Investigating heterogeneity in brand preferences in logit mod-els for panel data. J. Marketing Res. 28(November) 417–428.
DoubleClick. 1996. Frequency and Banner Burnout. http://www.doubleclick.net/nf/general/frequset.htm.
Dreze, Xavier, Francois Hussherr. 2003. Internet advertising: is any-body watching. J. Interactive Marketing 17(4). Forthcoming.
eMarketer. 2002. Essential e-Business Numbers for Marketers, Q3.October, New York.. 2001. The eAdvertising Report. April, New York.
Gatignon, H., D. Reibstein. 1986. Pooling logit models. J. MarketingRes. 23(August) 281–285.
Goldstein, Harvey. 1995. Multilevel Statistical Models, 2nd ed.Edward Arnold, London.
Greenwald, Anthony G., Clark Leavitt. 1984. Audience involvementin advertising: Four levels. J. Consumer Res. 11(June) 581–592.
Hanson, Ward. 2000. Internet Marketing. South-Western Publishing,Cincinnati, OH.
Hoffman, Donna L., Thomas P. Novak, Marcos A. Peralta. 1999.Building consumer trust in online environments: The case forinformation privacy. Comm. ACM 42(4) 80–85., . 2000. Acquiring customers on the Web. Harvard Bus.Rev. (May–June) 179–188., . 1996. Marketing in hypermedia computer-mediatedenvironments: Conceptual foundations. J. Marketing 60(July)50–68.
Lynch, John G., Dan Ariely. 2000. Wine online: Search costs affectcompetition on price, quality and distribution. Marketing Sci.19(1) 83–103.
Huberman, Bernado A., Peter L. T. Pirolli, James E. Pitkow, RajanM. Lukose. 1998. Strong regularities in World Wide Websurfing. Science 280(5360) 95–97.
Janiszewski, Chris. 1993. Preattentive mere exposure effects. J. Con-sumer Res. 20(December) 376–392.
Jones, J. Morgan, Jane T. Landwehr. 1988. Removing heterogeneitybias from logit model estimation. Marketing Sci. 7(1) 41–59.
Jupiter Research. 2003. Jupiter Research Internet AdvertisingModel, 7/03 (US only).
King, Gary, Langche Zeng. 2000. Logistic regression in rare eventsdata. Political Anal. 92 1–27.
MacInnis, Deborah J., Christine Moorman, Bernard J. Jaworski.1991. Enhancing and measuring consumers’ motivation,opportunity, and ability to process brand information from ads.J. Marketing 55(October) 32–53.
Mitchell, Andrew A. 1983. Cognitive processes initiated by expo-sure to advertising. R. Harris, ed. Information Processing Re-search in Advertising. Lawrence Erlbaum Associates, Hillsdale,NJ, 13–42.
Morrison, Donald G. 1969. On the interpretation of discriminantanalysis. J. Marketing Res. 6(May) 156–163.
Novak, T. P., D. L. Hoffman, Y. F. Yung. 2000. Measuring the cus-tomer experience in online environments: A structural model-ing approach. Marketing Sci. 19(1) 22–44.
Pechmann, Cornelia, David W. Stewart. 1989. Advertising repe-tition: A critical review of wearin and wearout. James H.Leigh, R. Martin, Jr., eds. Current Issues and Research in Adver-tising 1988. Claude University of Michigan, Ann Arbor, MI,285–329.
Peterman, Michelle L., Harper A. Roehm, Jr., Curtis P. Haugtvedt.1999. An exploratory attribution analysis of attitudes towardthe World Wide Web as a product information source. Adv.Consumer Res. 26 75–79.
Pieters, Rik, Edward Rosbergen, Michel Wedel. 1999. Visual atten-tion to repeated print advertising: A test of scanpath theory.J. Marketing Res. 36(December) 305–314.
Revelt, D., K. Train. 1998. Mixed logit with repeated choices: House-holds choices of appliance efficiency level. Rev. Econom. Statist.80(4) 647–657.
Rodriguez, G., N. Goldman. 1995. An assessment of estimation pro-cedures for multilevel models with binary responses. J. Roy.Statist. Soc. Ser. A(158) 73–89.
Rosbergen, Edward, Rik Pieters, Michel Wedel. 1997. Visual atten-tion to advertising: A segment-level analysis. J. Consumer Res.24(December) 305–314.
Schroeder, Will. 1998. Testing Web sites with eye-tracking. UserInterface Engineering—Eye for Design 5(5) (Sept.–Oct.) 3–4.
Sen, Shahana, Balaji Padmanabhan, Alexander Tuzhilin, NormanH. White, Roger Stein. 1998. The identification and satisfactionof consumer analysis-driven information needs of marketerson the WWW. Eur. J. Marketing 32(7–8) 688–702.
Sohn, Dongyoung, John D. Leckenby. 2001. Locus of control andinteractive advertising. Paper presented at the 2001 AnnualConference of the American Academy of Advertising, Salt LakeCity, Utah, March. http://www.ciadvertising.org/studies/reports/info_process/locus.htm.
Tedeschi, Bob. 2000. DoubleClick puts off plan for wider use ofpersonal data. New York Times on the Web, March 2, BusinessDesk. www.nytimes.com/.
Train, K. E. 1998. Recreation demand models with taste variationover people. Land Econom. 74(2) 230–239.
This paper was received May 26, 1998, and was with the authors 41 months for 5 revisions; processed by Scott Neslin.
Marketing Science/Vol. 22, No. 4, Fall 2003 541