modeling the binding of neurotransmitter transporter
TRANSCRIPT

Duquesne UniversityDuquesne Scholarship Collection
Electronic Theses and Dissertations
Summer 1-1-2017
Modeling the Binding of NeurotransmitterTransporter Inhibitors with Molecular Dynamicsand Free Energy CalculationsBernandie JeanDuquesne University
Follow this and additional works at: https://dsc.duq.edu/etd
Part of the Biophysics Commons, and the Other Biochemistry, Biophysics, and StructuralBiology Commons
This One-year Embargo is brought to you for free and open access by Duquesne Scholarship Collection. It has been accepted for inclusion in ElectronicTheses and Dissertations by an authorized administrator of Duquesne Scholarship Collection. For more information, please [email protected].
Recommended CitationJean, B. (2017). Modeling the Binding of Neurotransmitter Transporter Inhibitors with Molecular Dynamics and Free EnergyCalculations (Doctoral dissertation, Duquesne University). Retrieved from https://dsc.duq.edu/etd/240

MODELING THE BINDING OF NEUROTRANSMITTER TRANSPORTER
INHIBITORS WITH MOLECULAR DYNAMICS AND FREE ENERGY
CALCULATIONS
A Dissertation
Submitted to the Bayer School of Natural and Environmental Sciences
Duquesne University
In partial fulfillment of the requirements for
the degree of Doctor of Philosophy
By
Bernandie Jean
August 2017

Copyright by
Bernandie Jean
2017
iii
MODELING THE BINDING OF NEUROTRANSMITTER TRANSPORTER
INHIBITORS WITH MOLECULAR DYNAMICS AND FREE ENERGY
CALCULATIONS
By
Bernandie Jean
Approved April 18, 2017
________________________________
Jeffrey D. Evanseck, Ph.D.
Professor of Chemistry
(Committee Chair)
________________________________
Michael Cascio, Ph.D.
Associate Professor of Chemistry
(Committee Member)
________________________________
M. Rita Mihailescu, Ph.D.
Professor of Chemistry
(Committee Member)
________________________________
Christopher K. Surratt, Ph.D.
Professor of Pharmacology
Mylan School of Pharmacy
(Outside Reader)
________________________________
Robert B. Lettan II, Ph.D.
Associate Professor of Chemistry
Chatham University
(Outside Reader)
________________________________
Ellen Gawalt, Ph.D.
Chair, Department of Chemistry
Professor of Chemistry
________________________________
Phillip P. Reeder, Ph.D.
Dean, Bayer School of Natural and
Environmental Sciences

iv
ABSTRACT
MODELING THE BINDING OF NEUROTRANSMITTER TRANSPORTER
INHIBITORS WITH MOLECULAR DYNAMICS AND FREE ENERGY
CALCULATIONS
By
Bernandie Jean
August 2017
Dissertation supervised by Jeffry D. Madura
The monoamine transporter (MAT) proteins responsible for the reuptake of the
neurotransmitter substrates, dopamine, serotonin, and norepinephrine, are drug targets for
the treatment of psychiatric disorders including depression, anxiety, and attention deficit
hyperactivity disorder. Small molecules that inhibit these proteins can serve as useful
therapeutic agents. However, some dopamine transporter (DAT) inhibitors, such as
cocaine and methamphetamine, are highly addictive and abusable. Efforts have been
made to develop small molecules that will inhibit the transporters and elucidate specific
binding site interactions. This work provides knowledge of molecular interactions
associated with MAT inhibitors by offering an atomistic perspective that can guide
designs of new pharmacotherapeutics with enhanced activity.

v
The work described herein evaluates intermolecular interactions using
computational methods to reveal the mechanistic detail of inhibitors binding in the DAT.
Because cocaine recognizes the extracellular-facing or outward-facing (OF) DAT
conformation and benztropine recognizes the intracellular-facing or inward-facing (IF)
conformation, it was postulated that behaviorally “typical” (abusable, locomotor
psychostimulant) inhibitors stabilize the OF DAT and “atypical” (little or no abuse
potential) inhibitors favor IF DAT. Indeed, behaviorally-atypical cocaine analogs have
now been shown to prefer the OF DAT conformation. Specifically, the binding
interactions of two cocaine analogs, LX10 and LX11, were studied in the OF DAT using
molecular dynamics simulations. LX11 was able to interact with residues of
transmembrane helix 8 and bind in a fashion that allowed for hydration of the primary
binding site (S1) from the intracellular space, thus impacting the intracellular interaction
network capable of regulating conformational transitions in DAT.
Additionally, a novel serotonin transporter (SERT) inhibitor previously
discovered through virtual screening at the SERT secondary binding site (S2) was
studied. Intermolecular interactions between SM11 and SERT have been assessed using
binding free energy calculations to predict the ligand-binding site and optimize ligand-
binding interactions. Results indicate the addition of atoms to the 4-chlorobenzyl moiety
were most energetically favorable.
The simulations carried out in DAT and SERT were supported by experimental
results. Furthermore, the co-crystal structures of DAT and SERT share similar ligand-
binding interactions with the homology models used in this study.

vi
DEDICATION
I dedicate this work to my mother, Lise, whose unconditional love and support
made it possible for me to pursue my doctoral degree. I also dedicate this work to my late
research advisor, Dr. Jeffry D. Madura, who passed away unexpectedly on March 14,
2017. Thank you for encouraging me to reach for the stars.

vii
ACKNOWLEDGEMENT
Thank you to everyone who helped to guide me through my education and made
this research possible. I would like to thank Dr. Jeffry D. Madura for accepting me into
his computational research group and challenging me to reach my fullest potential in both
my education and research. I am grateful for all that I was able to learn from him and am
saddened that we will no longer have the opportunity to engage in thought-provoking
scientific discussions. Dr. Madura was an excellent mentor who trained me to be
independent and critical in my scientific approach, and he was determined to push me to
be the best scientist I could be, and for that, I am forever grateful. My thanks will never
be sufficient enough for his efforts.
I would like to extend my deepest gratitude to Dr. Christopher K. Surratt. From
the beginning of my graduate career, Dr. Surratt has been a mentor and a friend. Thank
you for training me and allowing me to work in your lab. I cannot thank you enough for
your patience and support. I would like to express my appreciation to Drs. Jeffrey D.
Evanseck and Ralph A. Wheeler for offering insightful suggestions to advance my
research in our joint group meetings. I am much obliged to Dr. Jeffrey D. Evanseck for
advising me through the final weeks of my graduate studies. I am thankful to my
dissertation committee members, Drs. Michael Cascio, and Mihaela-Rita Mihailescu, for
their assistance and encouragement. Special thanks to Dr. Robert B. Lettan II for
synthesizing the SM11 analogs used in this project. I would also like to acknowledge Drs.
Jonathan L. Katz and Weimin C. Hong for helpful discussions on DAT-inhibitor
complexes.

viii
To my current and past lab members, Riley Workman, Emily Benner, Matt Srnec,
Mike Wasko, Kendy Pellegrene, and Drs. Kalyan Immadisetty and Tammy Nolan. I
appreciate all the opportunities we had to have helpful scientific discussions. I thank you
all for patiently listening to my research presentations and offering your valuable advice.
Special thanks to Scott Boesch for maintaining the computational resources utilized in
this project. Thank you to the faculty in the Department of Chemistry and Biochemistry,
the administrative staff, especially Amy Stroyne, and Margaret Cowburn, academic
advisor Heather Costello, Dean of BSNES Dr. Philip Reeder, and Assistant Dean Dr.
Phillip D. Palmer. Thank you to the Duquesne University, Department of Chemistry and
Biochemistry and the Center for Computational Sciences, and the Bayer School for
Natural and Environmental Sciences for giving me this incredible opportunity to pursue
my graduate studies. Thank you to the Chuck Cooper Foundation for their financial
support in academic scholarships from 2014 to 2017.
I would like to give special thanks to my dear friend and mentor, Jefry Rosmarin.
Indeed, I would not have completed this journey if not for the unconditional love and
support of my family and most beloved friends. Though I was far from home, they were
never far from my heart.
ix
TABLE OF CONTENTS
Page
Abstract .............................................................................................................................. iv
Dedication .......................................................................................................................... vi
Acknowledgement ............................................................................................................ vii
List of Tables .................................................................................................................... xii
List of Figures .................................................................................................................. xiii
List of Abbreviations ....................................................................................................... xvi
CHAPTER 1 ................................................................................................................. 1
ROLE OF MONOAMINE TRANSPORTERS ............................................................ 1
1.1 Neurotransmitter transporters as therapeutic targets ............................................ 1
1.2 Computational study of DAT and SERT inhibitor binding .................................. 8
1.2.1 Modeling the binding of DAT inhibitors....................................................... 8
1.2.2 Lead optimization of a novel SERT inhibitor ............................................. 11
1.3 Computational methods for studying inhibitor binding ...................................... 13
1.3.1 Binding free energy calculations ................................................................. 15
1.4 Conclusions ........................................................................................................ 28
1.5 References .......................................................................................................... 29
CHAPTER 2 ............................................................................................................... 42
METHODS ................................................................................................................. 42
2.1 Modeling the binding of DAT inhibitors ............................................................ 42
2.1.1 DAT homology models ............................................................................... 42
2.1.2 System preparation and simulation details .................................................. 43
2.1.3 Solvent accessibility surface area analysis .................................................. 45

x
2.2 Lead optimization of a SERT inhibitor............................................................... 46
2.2.1 Relative free energy calculations of ethane to methanol ............................. 46
2.2.2 Free energy calculation of T4 lysozyme to FK5 ......................................... 48
2.2.3 Free energy calculation of LeuT substrates ................................................. 51
2.2.4 Free energy calculation of fluoxetine in SERT ........................................... 54
2.2.5 Free energy calculation of SM11 in SERT .................................................. 57
2.2.6 Measuring the affinity of SERT inhibitors .................................................. 62
2.3 References .......................................................................................................... 64
CHAPTER 3 ............................................................................................................... 68
MODELING THE BINDING OF DAT INHIBITORS IN DISCRETE DAT
CONFORMATIONS ............................................................................................ 68
3.1 Introduction ........................................................................................................ 68
3.2 Results and Discussion ....................................................................................... 70
3.3 Conclusions ........................................................................................................ 93
3.4 References .......................................................................................................... 95
CHAPTER 4 ............................................................................................................... 97
LEAD OPTIMIZATION OF A NOVEL SERT INHIBITOR ................................... 97
4.1 Introduction ........................................................................................................ 97
4.2 Results and Discussion ..................................................................................... 100
4.2.1 Validating the free energy calculations ..................................................... 100
4.2.2 Determining the SERT SM11 binding site ................................................ 104
4.2.3 Measuring affinity of SERT inhibitors ...................................................... 106
4.2.4 Relative binding free energy calculations of SM11 analogs ..................... 108
4.3 Conclusions ...................................................................................................... 115

xi
4.4 References ........................................................................................................ 116
CHAPTER 5 ............................................................................................................. 120
FUTURE DIRECTIONS .......................................................................................... 120
5.1 Modeling the binding of DAT inhibitors .......................................................... 120
5.2 Lead optimization of a SERT inhibitor............................................................. 122
5.3 References ........................................................................................................ 126

xii
LIST OF TABLES
Page
Table 3.1: DAT affinity for cocaine and two 3β-aryltropane analogs ............................. 70
Table 4.1: ABFE calculations of T4 lysozyme bound to FK5 ....................................... 102
Table 4.2: ABFE calculations of leucine in LeuT ......................................................... 103
Table 4.3: ABFE calculations of R-fluoxetine in the S2 binding site in SERT ............. 104
Table 4.4: ABFE calculations of SM11 in the S1 binding site in SERT ....................... 105
Table 4.5: ABFE calculations of SM11 in the S2 binding site in SERT ....................... 105
Table 4.6: RBFE results of SM11 analogs in SERT ...................................................... 111
xiii
LIST OF FIGURES
Page
Figure 1.1: Mechanism of action of monoamine neurotransmitters .................................. 2
Figure 1.2: The tertiary structure of monoamine transporters (MAT) protein .................. 4
Figure 1.3: Alternating access mechanism of substrate transport ..................................... 6
Figure 1.4: DAT inhibitors, cocaine (COC) and benztropine (BZT) ................................ 9
Figure 1.5: The extracellular-facing and intracellular-facing MAT ............................... 10
Figure 1.6: Structures of DAT inhibitors, LX10 and LX11 ........................................... 11
Figure 1.7: Hypothesized interactions of SM11 in the S2 site of SERT ......................... 12
Figure 1.8: Structure-based drug design scheme of a hit-to-lead compound .................. 13
Figure 1.9: Forming a protein and ligand complex ......................................................... 16
Figure 1.10: Alchemical transformation as a function of the coupling parameter (λ) ..... 17
Figure 1.11: Gibbs binding free energy calculation: the relative binding free energy
(RBFE) change.......................................................................................................... 20
Figure 1.12: Gibbs binding free energy calculation: the absolute binding free energy
(ABFE) ...................................................................................................................... 22
Figure 1.13: Geometric restraints applied to the ligand with respect to the protein.. ...... 24
Figure 2.1: Alchemical transformation of ethane to methanol ........................................ 47
Figure 2.2: Structure of K506 (FK5) ligand from PDB entry 1FKJ ................................ 49
Figure 2.3: Reference frame defining the binding of leucine in LeuT ............................ 53
Figure 2.4: Binding interactions of R-fluoxetine within the S2 binding site of SERT.... 55
Figure 2.5: SM11 in S2 of SERT overlapped with S-citalopram in SERT co-crystal .... 58
Figure 2.6: SM11 in S1 of SERT. .................................................................................... 59

xiv
Figure 2.7: Groups of atoms to define the reference frame of SM11 to SERT ............... 61
Figure 3.1: The OF DAT and IF DAT structures ............................................................ 69
Figure 3.2: The Drosophila DAT superposed with the rat DAT homology model ......... 71
Figure 3.3: RMSD measured for each DAT-inhibitor system after 100 ns MD ............. 73
Figure 3.4: RMSF measured for Cα of DAT inhibitor-bound OF and IF DAT .............. 74
Figure 3.5: Distances measured for D79 and Y156 for the OF and IF DAT ................... 75
Figure 3.6: Water molecules within the outer and inner cavities of OF and IF DAT ..... 76
Figure 3.7: Distances measured for the external and internal gate residue pairs ............. 78
Figure 3.8: SASA measurements for OF DAT and IF DAT ........................................... 80
Figure 3.9: LX10 and LX11 in OF DAT ......................................................................... 82
Figure 3.10: Inner gate R60-D435 disposition in the OF DAT-LX10 bound system ..... 83
Figure 3.11: The number of water molecules analyzed in OF and IF DAT .................... 84
Figure 3.12: Intracellular interaction network in OF DAT .............................................. 86
Figure 3.13: Comparison of cocaine binding in OF DAT to LX10 and LX11 ................ 89
Figure 3.14: Comparison of OF APO DAT superposed with inhibitor-bound OF DAT 91
Figure 3.15: Binding site interactions in OF DAT superposed with IF DAT. ................ 92
Figure 4.1: Schematic representation of SM11 binding in SERT ................................... 99
Figure 4.2: Free energy change for the transformation of ethane to methanol. ............. 101
Figure 4.3: Competitive membrane binding assay of citalopram in SERT ................... 106
Figure 4.4: Competitive membrane binding assay of SM11 in SERT .......................... 107
Figure 4.5: 2D ligand interaction map of SM11 in SERT S2 binding site .................... 108
Figure 4.6: SM11 analogs in the S2 binding site of SERT ............................................ 109
Figure 4.7: Modifications proposed for the 4-chlorobenzyl moiety of SM11. .............. 110
xv
Figure 4.8: Modeling the binding of BJ11 in SERT ...................................................... 112
Figure 4.9: Binding site interactions with BJ12 in the SERT S2 binding site ............... 113
Figure 4.10: Binding site interactions with BJ13 in the SERT S2 binding site ............. 114
Figure 4.11: Binding site interactions with BJ14 in the SERT S2 binding site. ............ 115
Figure 5.1: 2-substituted aryltropane cocaine analogs ................................................... 121
Figure 5.2: Proposed modifications to SM11 for future analogs ................................... 124

xvi
LIST OF ABBREVIATIONS
5-HT serotonin
ABFE absolute binding free energy
APO apoprotein
BAR Bennett acceptance ratio
BZT benztropine
CGenFF CHARMM General Force Field
CHARMM Chemistry at HARvard Macromolecular Mechanics
CNS central nervous system
COC cocaine
COMT catechol-o-methyltransferase
DA dopamine
DAT dopamine transporter
dDAT Drosophila melanogaster dopamine transporter
FEP free energy perturbation
fs femtosecond
GCMC grand canonical Monte Carlo
HEK Human embryonic kidney
hSERT human serotonin transporter
IF inward-facing
LeuT leucine transporter
LeuTAa Aquifex aeolicus leucine transporter

xvii
LX10 2β-Ph2-COCH2-3β-4-Cl-Ph cocaine analog
LX11 2α-Ph2-COCH2-3β-4-Cl-Ph cocaine analog
MAO monoamine oxidase
MAT monoamine transporter
MD molecular dynamics
MOE Molecular Operating Environment
NAMD Nanoscale Molecular Dynamics
NE norepinephrine
NET norepinephrine transporter
NPT isobaric-isothermal
ns nanosecond
NSS neurotransmitter sodium symporters
OF outward-facing
PBC periodic boundary conditions
PDB Protein Data Bank
PME particle mesh Ewald
PMF potential of mean force
ps picosecond
RMSD root-mean-square deviation
RMSF root-mean-square fluctuation
SBP solvent boundary potential
SERT serotonin transporter
SLC6 solute carrier 6
xviii
SM11 6-((4-(4-chlorobenzyl)piperazin-1-yl)methyl)-1,3,5-triazine-2,4-diamine
SNRI Serotonin norepinephrine reuptake inhibitor
SSBP spherical solvent boundary potential
SSRI selective serotonin reuptake inhibitor
TCA tricyclic antidepressant
TI thermodynamic integration
TM transmembrane
US umbrella sampling
WHAM weighted histogram analysis method
XSEDE Extreme Science and Engineering Discovery Environment

1
CHAPTER 1
1 ROLE OF MONOAMINE TRANSPORTERS
1.1 Neurotransmitter transporters as therapeutic targets
The serotonin transporter (SERT), dopamine transporter (DAT) and norepinephrine
transporter (NET) exist as integral membrane proteins that belong to the family of
neurotransmitter sodium symporters (NSS).1 These monoamine transporters (MATs) and
other members of the solute carrier 6 (SLC6) transporter family are characterized by the
Na+-dependent symport of their native substrates along with Cl− across a biomembrane.2-7
MATs are regulated through several signal transduction mechanisms to maintain
appropriate levels of neurotransmitter in the synaptic cleft (Figure 1.1).8 During
signaling, the neurotransmitter is released into the synaptic cleft and binds to receptors
found on the post-synaptic membrane. Following neurotransmission, the
neurotransmitters are trafficked into the neuron via the transporters (Figure 1.1).9 MATs
are also recognized for their role as therapeutic targets for treating neurologic disorders,
including depression, anxiety, and attention deficit hyperactivity disorder (ADHD), and
in the abuse of psychostimulants.9-12 Specific inhibitors for these transporters exert their
physiological effects by interfering with synaptic uptake and thus prolonging the actions
of the monoamine.2 The small molecules that inhibit these proteins can serve as useful
and effective therapeutic agents; however, some inhibitors are highly addictive and
possess an abuse potential, such as cocaine and amphetamine derivatives.13-15
2
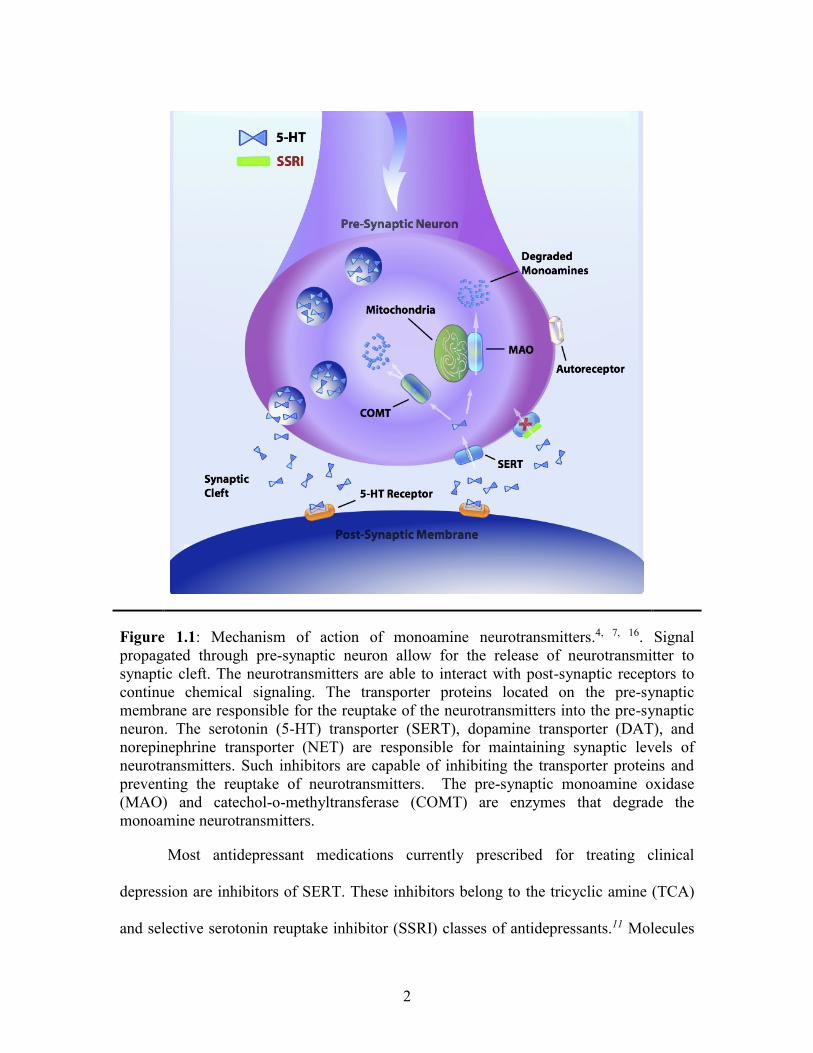
Figure 1.1: Mechanism of action of monoamine neurotransmitters.4, 7, 16. Signal
propagated through pre-synaptic neuron allow for the release of neurotransmitter to
synaptic cleft. The neurotransmitters are able to interact with post-synaptic receptors to
continue chemical signaling. The transporter proteins located on the pre-synaptic
membrane are responsible for the reuptake of the neurotransmitters into the pre-synaptic
neuron. The serotonin (5-HT) transporter (SERT), dopamine transporter (DAT), and
norepinephrine transporter (NET) are responsible for maintaining synaptic levels of
neurotransmitters. Such inhibitors are capable of inhibiting the transporter proteins and
preventing the reuptake of neurotransmitters. The pre-synaptic monoamine oxidase
(MAO) and catechol-o-methyltransferase (COMT) are enzymes that degrade the
monoamine neurotransmitters.
Most antidepressant medications currently prescribed for treating clinical
depression are inhibitors of SERT. These inhibitors belong to the tricyclic amine (TCA)
and selective serotonin reuptake inhibitor (SSRI) classes of antidepressants.11 Molecules
3
that can selectively interact with two or more transporters and selectively interact with 5-
HT receptors are of interest to improve the effectiveness of antidepressants and reduce
the side effects.17-22 Adverse side effects may include sexual dysfunction, nausea,
vomiting, weight gain, and sleep disturbance.12, 23-26 The selective serotonin-
norepinephrine reuptake inhibitors (SNRIs) include venlafaxine (Effexor™),
desvenlafaxine (Pristiq™), and duloxetine (Cymbalta™).11, 25, 27-30 There are FDA-
approved medications that target NET and DAT to increase levels of NE and DA in the
synapse.30-32 Triple reuptake inhibitors such as tesofensine inhibit SERT, NET, and
DAT.33
Unfortunately, 30 to 40 % of depressed patients are unable to experience the full
benefits of their antidepressant medications.11, 25, 34, 35 Understanding the mechanism of
action of drugs inhibiting MATs is critical to adequately treating the neurological
disorders associated with these systems.32, 35-39 Therefore, MATs remain a target for the
development and design of novel small molecules that are capable of effectively
inhibiting the uptake of monoamine neurotransmitters.
The MATs are characterized by 12 transmembrane (TM) helices with
intracellular N- and C-termini.2 There are at least two binding pockets present, the
substrate/inhibitor primary binding pocket, or the S1 site, and an allosteric S2 binding
pocket in the “extracellular vestibule”, the space between the S1 pocket and the outside
of the cell (Figure 1.2).1, 2, 16, 40-45 The transport process is believed to follow an
“alternating access” mechanism.2, 3, 46 The opening of an outer, relatively extracellular
gate allows the ions and substrate to enter S1, a chamber central to the bilayer. Upon
binding of substrate in S1, the outer gate closes, and an inner, relatively cytoplasmic gate

4
opens, allowing ions and substrate to exit S1 and enter the cell. Off-loading of ions and
substrate allows the transporter protein to reset, shifting from an inward-facing
conformation, which is open to the cytoplasm, back to an outward-facing conformation,
open to the extracellular side of the synapse (Figure 1.3).2, 46, 47
Figure 1.2: The tertiary structure of MAT protein. The 12 transmembrane helices are
shown using ribbon rendering (red) with the primary binding site (S1) highlighted in
purple and an allosteric binding site (S2) in green is highlighted.1
Crystallization of the homologous Aquifex aeolicus bacterium leucine transporter
(LeuT),2, 16, 40, 41, 48, 49 the Drosophila melanogaster dopamine transporter (dDAT),42, 44, 45
and recently the human serotonin transporter (hSERT)50 has elucidated MAT topology
and conformational states (Figure 1.2). The LeuT crystal structure 2A652 served as a
5
useful template for developing homology models of MAT 3-D structure despite only
sharing 20-25% sequence identity with MATs.1, 51-56 Additional structures of LeuT in the
substrate-free, inward-open, and outward-open conformations have offered insight into
the mechanism of MAT translocation of substrates and its inhibition.16, 41
A limitation of the available crystal structures, in general, is that the structures only
offer a static image of the protein. Often mutations are made to the protein residues and
detergents are used to facilitate crystal formation. To extract reasonable crystallographic
structures, the temperature of the system may be reduced below physiological conditions
to prevent atomic fluctuation.57-59 Despite advancements in uncovering MAT mechanism
of transport, efforts continue to characterize the mechanistic aspects of these transporters,
the structural changes that facilitate transport by allowing access to the central binding
site, and the mechanism of drug inhibition.3, 8, 60-65
6
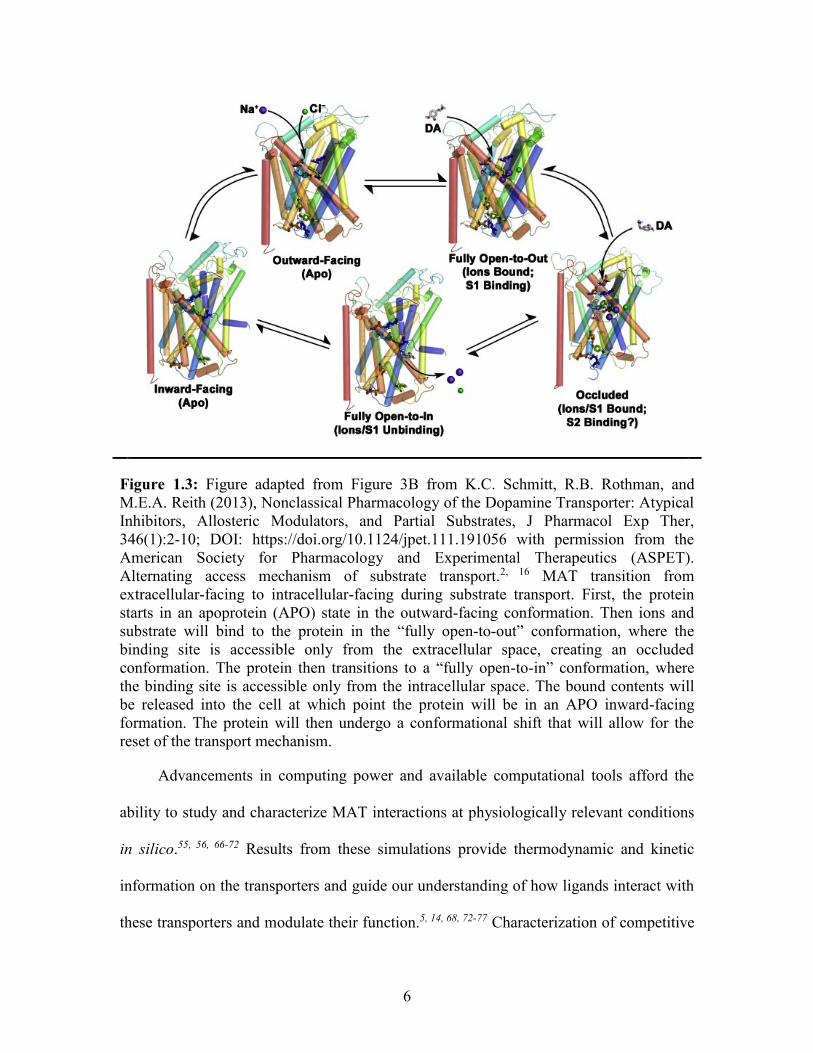
Figure 1.3: Figure adapted from Figure 3B from K.C. Schmitt, R.B. Rothman, and
M.E.A. Reith (2013), Nonclassical Pharmacology of the Dopamine Transporter: Atypical
Inhibitors, Allosteric Modulators, and Partial Substrates, J Pharmacol Exp Ther,
346(1):2-10; DOI: https://doi.org/10.1124/jpet.111.191056 with permission from the
American Society for Pharmacology and Experimental Therapeutics (ASPET).
Alternating access mechanism of substrate transport.2, 16 MAT transition from
extracellular-facing to intracellular-facing during substrate transport. First, the protein
starts in an apoprotein (APO) state in the outward-facing conformation. Then ions and
substrate will bind to the protein in the “fully open-to-out” conformation, where the
binding site is accessible only from the extracellular space, creating an occluded
conformation. The protein then transitions to a “fully open-to-in” conformation, where
the binding site is accessible only from the intracellular space. The bound contents will
be released into the cell at which point the protein will be in an APO inward-facing
formation. The protein will then undergo a conformational shift that will allow for the
reset of the transport mechanism.
Advancements in computing power and available computational tools afford the
ability to study and characterize MAT interactions at physiologically relevant conditions
in silico.55, 56, 66-72 Results from these simulations provide thermodynamic and kinetic
information on the transporters and guide our understanding of how ligands interact with
these transporters and modulate their function.5, 14, 68, 72-77 Characterization of competitive

7
and allosteric inhibitor binding sites have aided in designing new molecules to treat the
disorders associated with the dysfunction of MATs.77 The primary binding site (S1) and
allosteric binding site (S2) have been the target of computational drug design strategies
such as virtual screening and lead optimization.78-84 In several LeuT crystal structures,
TCAs are bound in the allosteric S2 site formed by residues from TM1 (L25, L29, R30,
V33, E37), TM3 (Y107, I111, W114), TM6 (F253), and TM10 (K398, L400, D401,
D404).48, 85
Even though binding of TCAs in the S2 site of LeuT may not fully support
antidepressant binding in SERT based on later studies,86 modeling the binding of
antidepressants in the S2 site of SERT can reveal details about interaction in the allosteric
binding site.87 Moreover, the recent crystal structure of SERT with S-citalopram (PDB
entry 5I73) shows two inhibitor molecules in the S1 and S2 binding sites of SERT,50
supporting the likelihood for a second molecule to engage in the allosteric site in addition
to occupying the primary binding site. Novel SERT ligands have been discovered by
Manepalli et al. through a virtual screening of the ZINC database at the S2 site of a SERT
homology model based on LeuT.78 Research efforts have also been made by Larsen et al.
and Topiol et al. to modify the structure of citalopram (Celexa™), a high affinity S1
SERT inhibitor, to bind specifically in S2 with high-affinity.67, 88
A second allosteric site in SERT was targeted by Mortensen and colleagues for the
development of novel lead allosteric modulators of SERT that interact at a site previously
referred to as A1, comprised of residues Q111, N112, I327, D328, A331, Q332, K490,
E494, R564, Y568, and Y572.89, 90 A four-point receptor pharmacophore using the
residues D328, K490, E494 and Y568 was developed based on molecular dynamics

8
(MD) simulations and comparative genomics techniques to identify the allosteric pocket
outside the translocation pathway.89
1.2 Computational study of DAT and SERT inhibitor binding
The work discussed herein studies the important interactions between novel
inhibitors found to interact in DAT and SERT; specifically, studying the structural
changes that occur upon inhibitors binding to the DAT and the interactions of an inhibitor
in the allosteric (S2) site in SERT. This work intends to elucidate the appropriate drug
binding pockets and improve the rational drug design by employing computational
methods to study how the ligands are interacting with these proteins. Several
computational tools were used to model protein and ligand binding and the
conformational changes that occur in the protein. MD was used to simulate the physical
movements of atoms and molecules to visualize the process of the ligands interacting
with the protein residues. This allows the systems to equilibrate and sample a relatively
small time frame for any changes in protein structure due to ligand binding. Free energy
calculations were used as a quantitative tool to estimate the binding free energies of
ligands in the protein and probe the significant interactions in the binding site. This
approach reveals key interactions for MAT molecular recognition, toward developing
more effective inhibitors.
1.2.1 Modeling the binding of DAT inhibitors
Illicit psychostimulants, such as cocaine, methamphetamine, and ecstasy target
DAT.4, 44, 91 The non-abusable cocaine analogs benztropine and GBR12909 interact with

9
the DAT in a manner that differs from cocaine (Figure 1.4).92, 93 Experimental assays
have determined cocaine and benztropine prefer different conformations of DAT, and the
crystal structure of cocaine and DAT (4XP4) indicates cocaine can stabilize the outward-
facing conformation (Figure 1.5).44 Conformational studies on DAT-inhibitor complexes
spawned the popular hypothesis that the non-abusable DAT inhibitors stabilize the
inward-facing conformation of DAT (Figure 1.5).94 The hypothesis is in doubt, as
several analogs of cocaine and benztropine have been synthesized and shown to prefer
the outward-facing DAT conformation in cysteine accessibility assays, yet mirror
benztropine’s lack of abuse potential.53
Figure 1.4: DAT inhibitors, cocaine (COC) and benztropine (BZT). Affinity (𝐾𝑖)
measured for DAT (mean ± s.e.m.) obtained by displacement of the cocaine analog
radioligand [3H]-WIN 35,428.53
10
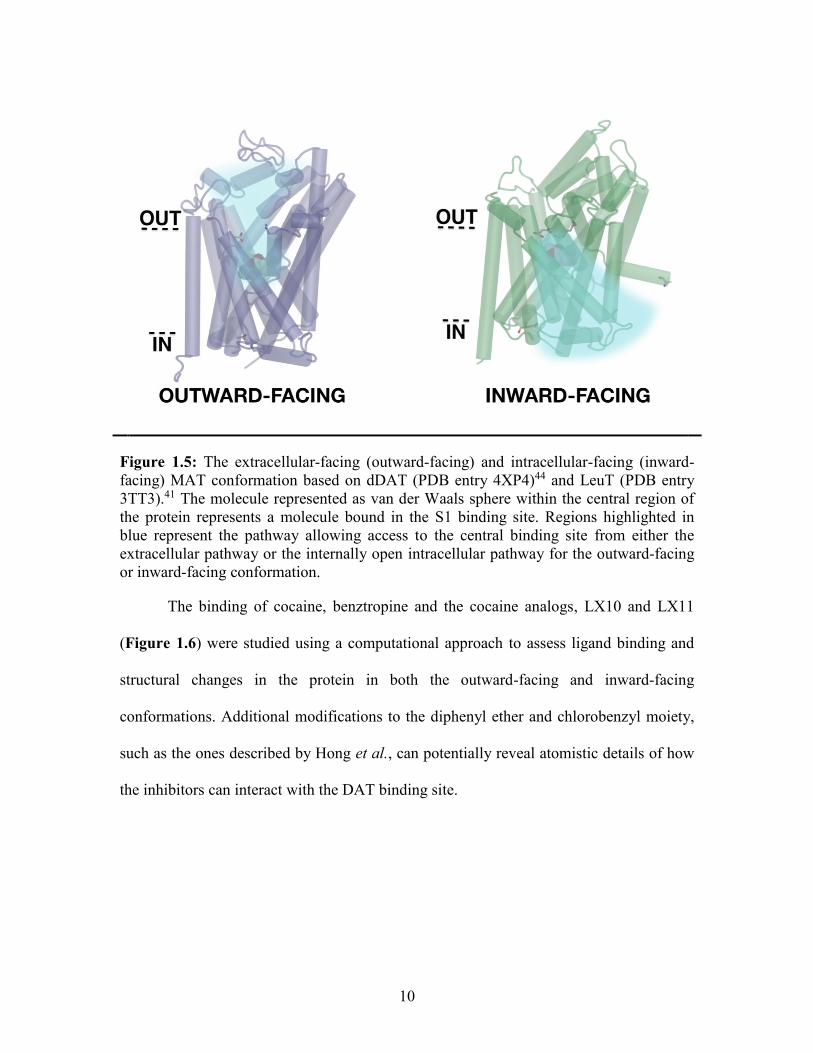
Figure 1.5: The extracellular-facing (outward-facing) and intracellular-facing (inward-
facing) MAT conformation based on dDAT (PDB entry 4XP4)44 and LeuT (PDB entry
3TT3).41 The molecule represented as van der Waals sphere within the central region of
the protein represents a molecule bound in the S1 binding site. Regions highlighted in
blue represent the pathway allowing access to the central binding site from either the
extracellular pathway or the internally open intracellular pathway for the outward-facing
or inward-facing conformation.
The binding of cocaine, benztropine and the cocaine analogs, LX10 and LX11
(Figure 1.6) were studied using a computational approach to assess ligand binding and
structural changes in the protein in both the outward-facing and inward-facing
conformations. Additional modifications to the diphenyl ether and chlorobenzyl moiety,
such as the ones described by Hong et al., can potentially reveal atomistic details of how
the inhibitors can interact with the DAT binding site.

11
Figure 1.6: Structures of DAT inhibitors, the 3𝛽-aryltropane cocaine analogs, LX10 (2𝛽)
and LX11 (2𝛼). The analogs stereochemically differ at the tropane C-2 position. Affinity
(𝐾𝑖) measured for DAT (mean ± s.e.m.) obtained by displacement of the cocaine analog
radioligand [3H]-WIN 35,428.53
1.2.2 Lead optimization of a novel SERT inhibitor
A novel SERT inhibitor, SM11, was discovered through a virtual screening
(docking) with the S2 allosteric binding site in the SERT.78 SM11 was hypothesized to
interact with the S2 binding site with observed interactions including hydrophobic with
Trp103, Ile179, and Phe335 and hydrogen bond with Tyr107, Asp328, and Lys490
(Figure 1.7). The objective of this work involves a lead optimization of SM11 performed
using free energy calculations to reveal critical interactions for probing ligand
interactions in S2, and for developing more potent inhibitors with nanomolar SERT
affinity.
12
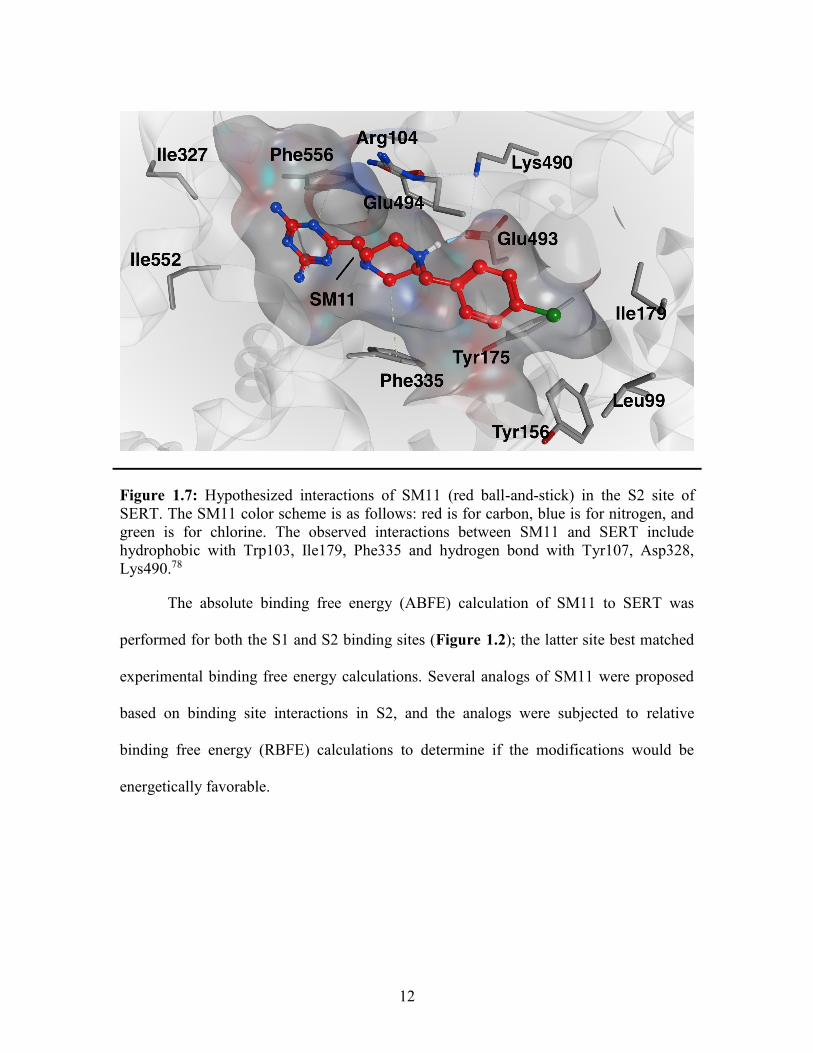
Figure 1.7: Hypothesized interactions of SM11 (red ball-and-stick) in the S2 site of
SERT. The SM11 color scheme is as follows: red is for carbon, blue is for nitrogen, and
green is for chlorine. The observed interactions between SM11 and SERT include
hydrophobic with Trp103, Ile179, Phe335 and hydrogen bond with Tyr107, Asp328,
Lys490.78
The absolute binding free energy (ABFE) calculation of SM11 to SERT was
performed for both the S1 and S2 binding sites (Figure 1.2); the latter site best matched
experimental binding free energy calculations. Several analogs of SM11 were proposed
based on binding site interactions in S2, and the analogs were subjected to relative
binding free energy (RBFE) calculations to determine if the modifications would be
energetically favorable.

13
Figure 1.8: Structure-based drug design scheme of a hit-to-lead compound. The free
energy perturbation (FEP) method was used to calculate the absolute binding free energy
(ABFE) of a hit-to-lead compound, SM11, binding to SERT. The binding pose is
determined based on the comparison of the ABFE calculation to the experimental
measurement of the ligand affinity from a cell-based assay. Analogs of the lead
compound are developed to probe drug recognition and optimize interactions within the
transporter binding site.
1.3 Computational methods for studying inhibitor binding
The ability to predict the binding affinity of a ligand to a protein is an important
computational tool in computer-aided drug design. Scoring functions are often used in
virtual screening and docking simulations because this approach offers a quick estimate
of the ligand binding affinity.95 Scoring functions allow ligands to be compared and
ranked based on an estimated free energy value96-98 beneficial for screening molecular
14
libraries containing millions of compounds. However, scoring of docked poses may not
directly correlate with experimental affinity. A limitation of this approach is the treatment
of the protein as a rigid system with implicit solvation.99 This is a fast method, but it can
produce an inaccurate prediction of binding affinity.100 Explicit methods used for
estimation of binding affinity account for specific properties of the protein-ligand
complexes. Accurate calculations of binding affinity take into account protein flexibility
and explicit solvent interactions, especially the interactions of water at the binding site.55,
101-105
Classical MD simulations calculate thermodynamic properties (e.g., potential
energy) based on the molecular forces acting on the system as a function of time. These
simulations have helped to close the gap between the static images provided by
experimentally acquired crystal structures and the dynamic nature of macromolecules.
Classical MD is currently unable to simulate biological processes that occur on
millisecond-to-second timescales, such as the time for transitions between MAT
extracellular-facing and intracellular-facing conformations. It is difficult to overcome the
large free energy barrier; however, supercomputers such as ANTON and those available
at the Extreme Science and Engineering Discovery Environment (XSEDE) have
expanded the ability to study biologically relevant timescales.106, 107
Modifications of classical MD methods increase sampling of protein dynamics.
MD has been paired with other computational methods to overcome the free energy
barriers, toward reconstructing the free energy landscape from shorter timescale
simulations. The thermodynamics calculation of Gibbs free energy uses statistical
mechanics to determine the probability of finding the system in a given state.103, 108-111

15
Free energy methods coupled with MD simulations account for the protein, ligand, and
solvent interactions and more accurately estimate binding affinity because of the explicit
treatment of the atomic force fields that drive molecular interactions.112
Challenges of this approach include the insufficient sampling of the degrees of
freedom of a system.101, 103, 104, 109, 113-116 Several methods exist to improve estimation of
the binding free energy. These methods include free energy perturbation
(FEP)/thermodynamic integration (TI), and umbrella sampling (US).117, 118 The use of
well-defined and polarizable force fields can increase the accuracy of free energy
calculations.119-122 The application and limitations of these methods are reviewed below.
1.3.1 Binding free energy calculations
Helmholtz free energy and the partition function allow for thermodynamic
calculations of the binding free energy. Gibbs free energy allows the use of Helmholtz
free energy at constant volume and pressure
𝑍 = ∑ 𝑒−𝐸𝑖/𝑘𝑏𝑇
𝑖
(1.1)
∆𝐺 = −𝑘𝑏𝑇𝑙𝑛 (𝑍
𝑍𝑜) (1.2)
where 𝑍 represents the final bound state, and 𝑍0 presents the unbound state in bulk
solvent. All configurations between these two states are taken into account in the
calculations of Gibbs free energy.108, 123 The changes in equilibrium between these states
is also dependent on changes in the heat, enthalpy and the disorder of the system:
16
∆𝐺0 = 𝛥𝐻0 − 𝑇𝛥𝑆0 = −𝑅𝑇𝑙𝑛(𝐾𝑒𝑞𝐶𝑜) (1.3)
At chemical equilibrium, ∆H0 is the change in enthalpy, ∆S0 is the change in entropy of
the reaction, R is the gas constant, T is the temperature, and 𝐶𝑜 = 1/ 1661 Å3 at 1 M
standard concentration to account for the translational freedom of a single solute
molecule in explicit solvent.103, 123, 124
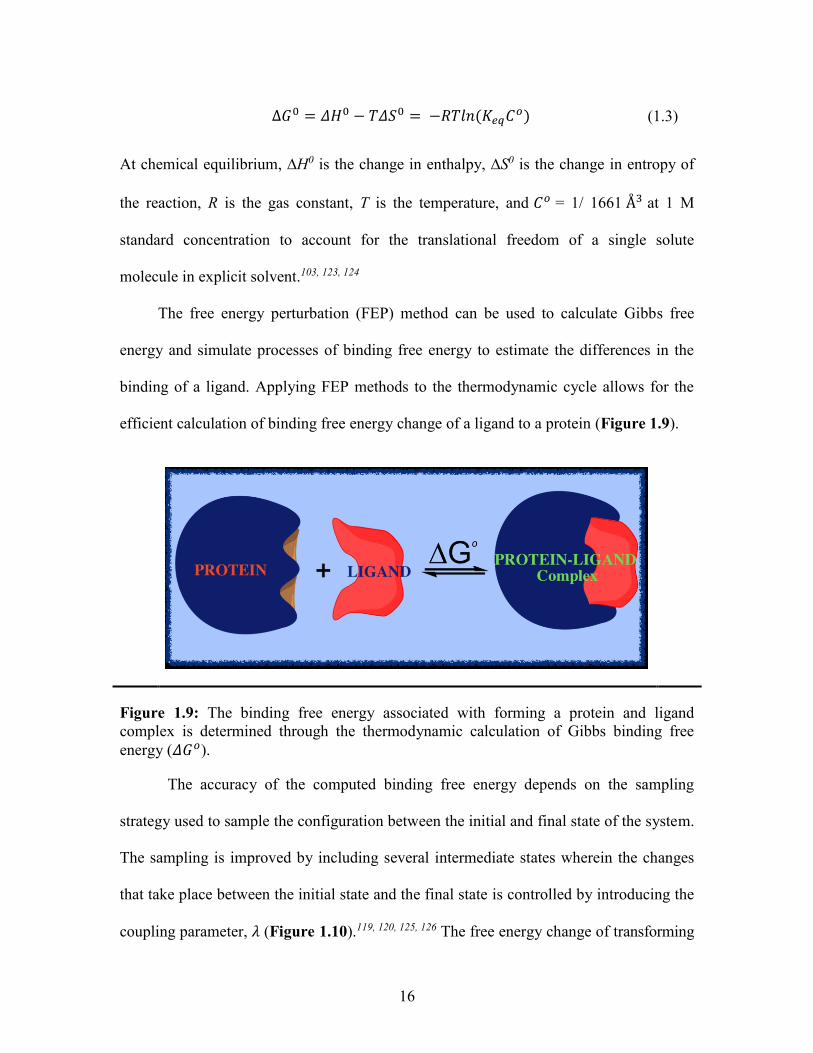
The free energy perturbation (FEP) method can be used to calculate Gibbs free
energy and simulate processes of binding free energy to estimate the differences in the
binding of a ligand. Applying FEP methods to the thermodynamic cycle allows for the
efficient calculation of binding free energy change of a ligand to a protein (Figure 1.9).
Figure 1.9: The binding free energy associated with forming a protein and ligand
complex is determined through the thermodynamic calculation of Gibbs binding free
energy (𝛥𝐺𝑜).
The accuracy of the computed binding free energy depends on the sampling
strategy used to sample the configuration between the initial and final state of the system.
The sampling is improved by including several intermediate states wherein the changes
that take place between the initial state and the final state is controlled by introducing the
coupling parameter, 𝜆 (Figure 1.10).119, 120, 125, 126 The free energy change of transforming

17
a system from state A (𝜆=0) to state B (𝜆=1) becomes a function of the coupling
parameter so that the free energy change is measured between the initial state and final
state as λ goes from 0 to1.
Figure 1.10: The alchemical transformation of a molecule in bulk water represented as a
function of the coupling parameter (𝜆). As 𝜆 goes from 0 to 1, the molecule is perturbed
from an initial state (𝜆 = 0) to a final state (𝜆 = 1).
The potential energy (U) of the bonds, angles, torsion and non-bonded terms is
measured as a function of λ.
𝑈(𝜆) = (1 − 𝜆)𝑈0 + 𝜆𝑈1 (1.4)
The potential energy of the complex includes the energies of hydrogen bond formations,
electrostatic interactions, dispersion, and charge-transfer interactions. An ensemble
average of all the time steps is then used to measure the change in binding free energy,
⟨∆𝐺𝜆→𝜆+∆𝜆⟩ = −𝑘𝐵𝑇𝑙𝑛 ⟨exp [−(𝑈(𝜆 + ∆𝜆) – 𝑈(𝜆))
𝑘𝐵𝑇]⟩
𝜆
(1.5)
where 𝑘𝐵 is Boltzmann constant, 𝑇 is the absolute temperature and < . . . > represents the
ensemble average at the specified 𝜆 state. The convergence of the simulation must be
monitored during the small changes between the two states (𝜆0→1). This will improve the
18
accuracy of the ensemble average by effectively sampling the degrees of freedom of the
system.
1.3.1.1 Relative binding free energy calculations
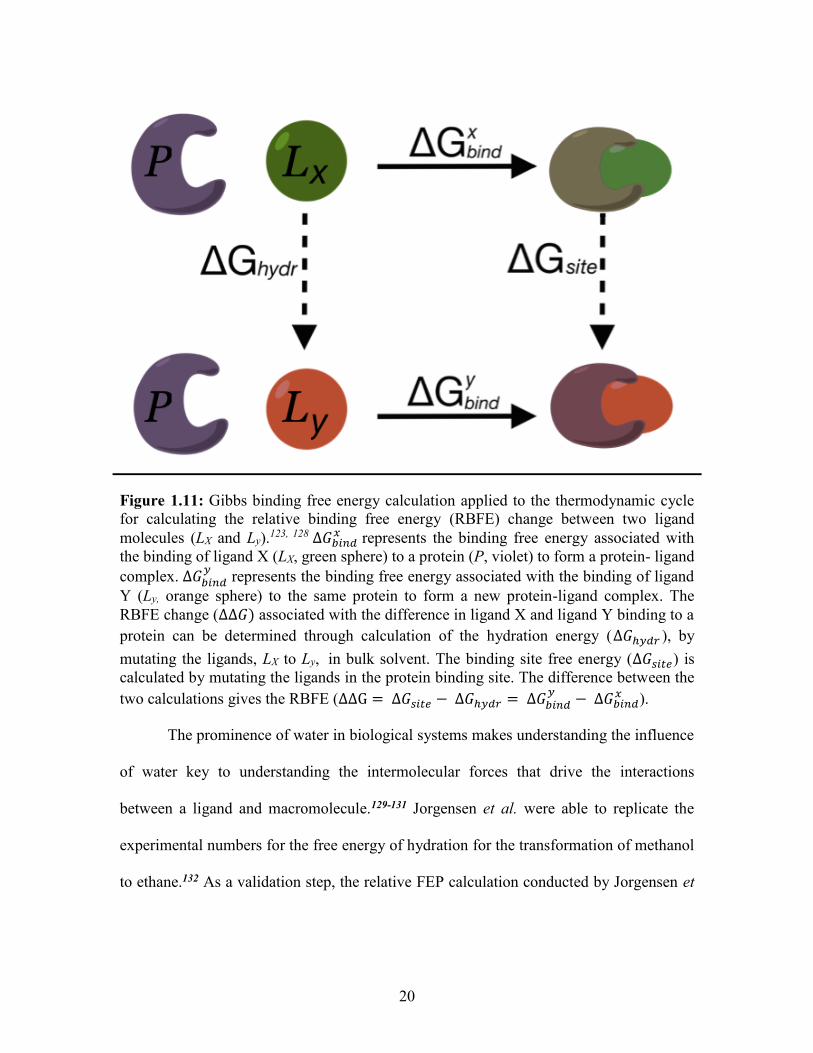
The relative change in binding free energy (∆∆𝐺) between two different ligands
for the same protein is determined by applying FEP calculations to the thermodynamic
cycle, where the two ligands can be represented as the initial and final states (Figure
1.11).109, 123 The relative binding free energy is given by
∆∆G = ∆Gsite − ∆Ghydr = ∆Gbind
y− ∆Gbind
x (1.6)
where ∆𝐺𝑏𝑖𝑛𝑑𝑥
and ∆𝐺𝑏𝑖𝑛𝑑𝑦
represent the change in binding free energy of the ligand in the
protein, which is measured indirectly by taking the difference between ∆𝐺ℎ𝑦𝑑𝑟 and
∆𝐺𝑠𝑖𝑡𝑒. The value of ∆𝐺ℎ𝑦𝑑𝑟 represents the change in hydration energy of the ligand in
bulk solvent, and ∆𝐺𝑠𝑖𝑡𝑒 represents the change in binding energy of the ligand at the
binding site of a solvated protein-ligand complex. The functional groups that are being
modified are slowly perturbed as a function of the coupling parameter (𝜆). At State A
(𝜆 =0), only the interaction of the initial ligand 𝐿𝑥 is being measured. Once the system
reaches State B (𝜆 =1), only the potential energy from the interactions of ligand 𝐿𝑦 is
measured. Outgoing atoms will see their electrostatic interactions with the environment
dissociate during 𝜆 = 0 to 0.5 while the interactions involving incoming atoms are
gradually introduced during 𝜆 = 0.5 to 1. The van der Waals (vdW) interactions of
outgoing atoms are gradually decoupled during 𝜆 = 0 to 1 and the interactions of
incoming atoms with the environment are incorporated during 𝜆 =1 to 0.109, 113, 119, 120, 127
19
The calculated relative binding free energy can be compared to experimental
affinity measurements of both ligands,
𝛥𝛥𝐺(𝐿𝑥 → 𝐿𝑦) = 𝑅𝑇𝑙𝑛 (𝐾
𝑖
𝐿𝑦
𝐾𝑖𝐿𝑥
) (1.7)
where 𝐾𝑖𝐿𝑥 and 𝐾
𝑖
𝐿𝑦 are the respective affinity measurements for each ligand to the
target.
Relative binding free energy calculations were previously applied for the lead
optimization of an anti-HIV agent.109 The free energy calculations helped guide the
molecular design of lead compounds to improve initial leads with activities at low-
micromolar concentrations to low-nanomolar inhibitors.109
20
Figure 1.11: Gibbs binding free energy calculation applied to the thermodynamic cycle
for calculating the relative binding free energy (RBFE) change between two ligand
molecules (LX and Ly).123, 128 ∆𝐺𝑏𝑖𝑛𝑑
𝑥 represents the binding free energy associated with
the binding of ligand X (LX, green sphere) to a protein (P, violet) to form a protein- ligand
complex. ∆𝐺𝑏𝑖𝑛𝑑𝑦
represents the binding free energy associated with the binding of ligand
Y (Ly, orange sphere) to the same protein to form a new protein-ligand complex. The
RBFE change (∆∆𝐺) associated with the difference in ligand X and ligand Y binding to a
protein can be determined through calculation of the hydration energy (∆𝐺ℎ𝑦𝑑𝑟 ), by
mutating the ligands, LX to Ly, in bulk solvent. The binding site free energy (∆𝐺𝑠𝑖𝑡𝑒) is
calculated by mutating the ligands in the protein binding site. The difference between the
two calculations gives the RBFE (∆∆G = ∆𝐺𝑠𝑖𝑡𝑒 − ∆𝐺ℎ𝑦𝑑𝑟 = ∆𝐺𝑏𝑖𝑛𝑑𝑦
− ∆𝐺𝑏𝑖𝑛𝑑𝑥 ).
The prominence of water in biological systems makes understanding the influence
of water key to understanding the intermolecular forces that drive the interactions
between a ligand and macromolecule.129-131 Jorgensen et al. were able to replicate the
experimental numbers for the free energy of hydration for the transformation of methanol
to ethane.132 As a validation step, the relative FEP calculation conducted by Jorgensen et
21
al. was replicated to calculate the relative free energies of hydration for the
transformation of methanol to ethane.
1.3.1.2 Absolute binding free energy calculations
The binding free energy (∆𝐺𝑏𝑖𝑛𝑑) of a ligand (L) to a protein (P) is difficult to
calculate directly.123 Instead, the ABFE (∆𝐺𝑎𝑏𝑠) calculations involve the ligand being
mutated to a dummy molecule ( 𝐷 ), which represents the alchemical annihilation
transformation of the ligand to a molecule with no interactions with its environment
(Figure 1.12). Two systems are used, wherein the first is a solvent water box with a
ligand (L) that is replaced by a dummy molecule (𝐷) to calculate the hydration energy of
the ligand (∆𝐺ℎ𝑦𝑑𝑟 ). The second system includes a solvated protein-ligand complex
(𝑃: 𝐿), wherein the ligand (L) is replaced by a dummy molecule (𝐷) to calculate the
binding free energy (∆𝐺𝑠𝑖𝑡𝑒) of the ligand to the protein. The difference between the
systems containing the perturbed dummy molecule in the bulk solvent and at the binding
site has a binding free energy (∆𝐺0) equal to zero with the assumption that the free
energy difference is negligible between the bound and unbound dummy molecules.
22
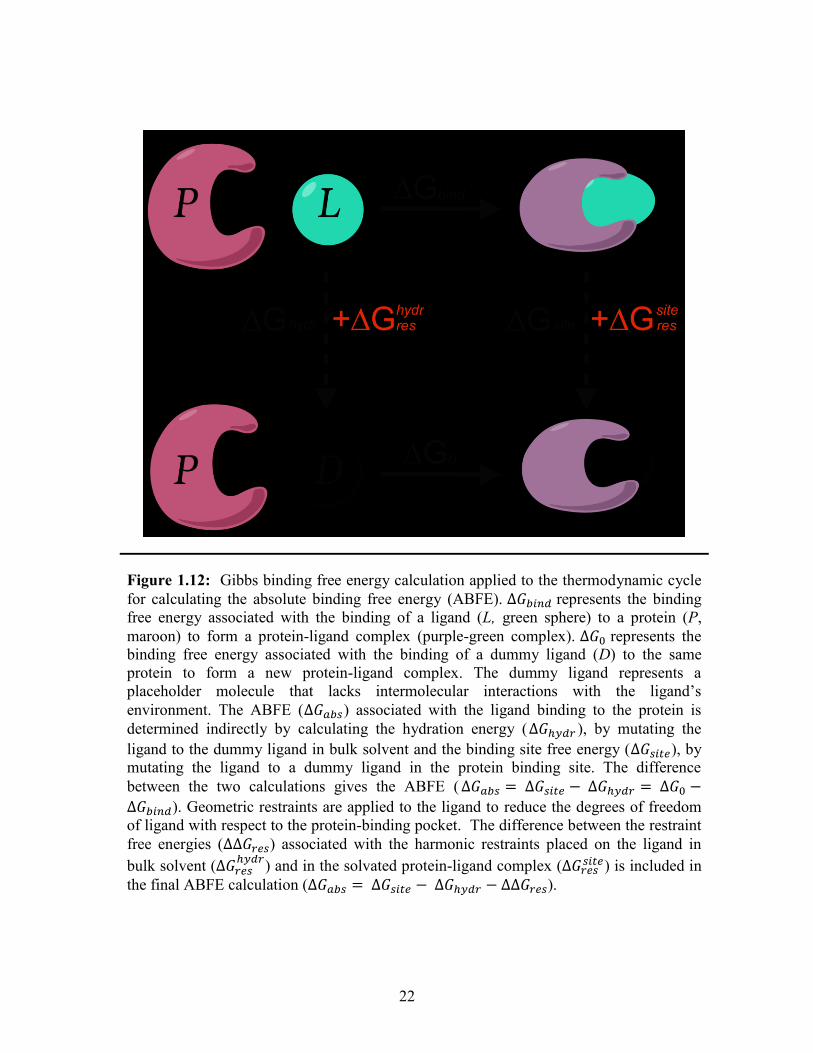
Figure 1.12: Gibbs binding free energy calculation applied to the thermodynamic cycle
for calculating the absolute binding free energy (ABFE). ∆𝐺𝑏𝑖𝑛𝑑 represents the binding
free energy associated with the binding of a ligand (L, green sphere) to a protein (P,
maroon) to form a protein-ligand complex (purple-green complex). ∆𝐺0 represents the
binding free energy associated with the binding of a dummy ligand (D) to the same
protein to form a new protein-ligand complex. The dummy ligand represents a
placeholder molecule that lacks intermolecular interactions with the ligand’s
environment. The ABFE (∆𝐺𝑎𝑏𝑠) associated with the ligand binding to the protein is
determined indirectly by calculating the hydration energy (∆𝐺ℎ𝑦𝑑𝑟 ), by mutating the
ligand to the dummy ligand in bulk solvent and the binding site free energy (∆𝐺𝑠𝑖𝑡𝑒), by
mutating the ligand to a dummy ligand in the protein binding site. The difference
between the two calculations gives the ABFE ( ∆𝐺𝑎𝑏𝑠 = ∆𝐺𝑠𝑖𝑡𝑒 − ∆𝐺ℎ𝑦𝑑𝑟 = ∆𝐺0 −
∆𝐺𝑏𝑖𝑛𝑑). Geometric restraints are applied to the ligand to reduce the degrees of freedom
of ligand with respect to the protein-binding pocket. The difference between the restraint
free energies (∆∆𝐺𝑟𝑒𝑠) associated with the harmonic restraints placed on the ligand in
bulk solvent (∆𝐺𝑟𝑒𝑠ℎ𝑦𝑑𝑟
) and in the solvated protein-ligand complex (∆𝐺𝑟𝑒𝑠𝑠𝑖𝑡𝑒) is included in
the final ABFE calculation (∆𝐺𝑎𝑏𝑠 = ∆𝐺𝑠𝑖𝑡𝑒 − ∆𝐺ℎ𝑦𝑑𝑟 − ∆∆𝐺𝑟𝑒𝑠).
23
1.3.1.3 Binding free energy calculations with harmonic restraints
Insufficient sampling during these calculations can lead to inaccurate estimation
of loss of conformational freedom upon ligand binding.101, 108, 113, 114, 133, 134 This can be
improved by limiting the degrees of freedom of the system by applying a series of
geometrical restraints to improve the efficiency of sampling during simulations. The
harmonic restraints act on a set of collective variables to reduce the conformational
entropy of the system. The method proposed by Gumbart et al.110 was considered to
prevent the ligand from wandering when the electrostatic and vdW interactions are scaled
to zero (Figure 1.12).
Geometric restraints based on collective variables are applied to reduce the
conformational, translational, and rotational entropies of the ligand (Figure 1.13).
Harmonic restraints are applied to the translation (𝑟, 𝜃, 𝜙), and the rotation (Θ, Φ, Ψ) of
the ligand with respect to the protein (Figure 1.13).110 Groups of atoms are defined to
form the reference structure of the ligand (L1, L2, L3) and the protein (P1, P2, P3) and
harmonic restraints are applied to the root-mean-square deviation (RMSD) with respect
to the native conformation of the protein-ligand complex. The thermodynamic cycle is
utilized to calculate the ABFE (∆𝐺𝑎𝑏𝑠𝑜 ) of a ligand to a protein with the energy associated
with the harmonic restraint potentials (Figure 1.12).

24
Figure 1.13: Geometric restraints used to reduce the conformational, translational
(𝑟, 𝜃, 𝜙), and rotational (Θ, Φ, Ψ) entropies of the ligand with respect to the protein.103, 110
Groups of atoms are defined to form the reference structure of the ligand (L1, L2, L3) and
the protein (P1, P2, P3) and harmonic restraints are applied to the root-mean-square
deviation (RMSD) with respect to the native conformation of the protein-ligand complex.
For the translational restraints, 𝑟 is the distance between P1 and L1, 𝜃 is the angle formed
by P2 – P1 – L1, and 𝜙 is the dihedral angle of P3 – P2 – P1 – L1. For the rotational
restraints, 𝛩 is the angle of P1 – L1 – L2, 𝛷 is the dihedral angle of P2 – P1 – L1 – L2, and
𝛹 is the dihedral angle of P1 – L1 – L2 – L3.

25
The calculations with harmonic restraints are applied in the bound state of ligand
interacting in the protein binding pocket as well as the unbound state of the ligand
interacting with its environment in bulk aqueous solvent. The translational restraint (𝑈𝑡)
is defined as
𝑈𝑡 =1
2[𝑘𝑡(𝑟 − 𝑟0)2 + 𝑘𝑎(𝜃 − 𝜃0)2 + 𝑘𝑑(𝜙 − 𝜙0)2] (1.9)
where 𝑟 is the distance between 𝑃1 and 𝐿1, 𝜃 is the angle formed by 𝑃2 − 𝑃1 − 𝐿1, and 𝜙
is the dihedral angle of 𝑃3 − 𝑃2 − 𝑃1 − 𝐿1. The force constants applied for the distance,
angle, and dihedral angle restraints are represented by 𝑘𝑡, 𝑘𝑎, and 𝑘𝑑, respectively. 𝑟0, 𝜃0,
and 𝜙0 are the reference restraint values taken from the equilibration simulation at the
binding site. The rotational restraint (𝑈𝑟) is defined as
𝑈𝑟 =1
2[𝑘𝑎(𝛩 − 𝛩0)2 + 𝑘𝑑(𝛷 − 𝛷0)2 + 𝑘𝑑(𝛹 − 𝛹0)2] (1.10)
where Θ is the angle of 𝑃1 − 𝐿1 − 𝐿2, Φ is the dihedral angle of 𝑃2 − 𝑃1 − 𝐿1 − 𝐿2, and
Ψ is the dihedral angle of 𝑃1 − 𝐿1 − 𝐿2 − 𝐿3.
The free energy contribution associated with the harmonic restraints are used to
calculate the ABFE of the ligand bound to the protein where ∆𝐺𝑟𝑒𝑠ℎ𝑦𝑑𝑟
represents the
binding free energy contributions from harmonic restraints placed on the conformational
(∆𝐺𝑐𝑜𝑛𝑓ℎ𝑦𝑑𝑟
), translational and rotational (∆𝐺𝑡,𝑟ℎ𝑦𝑑𝑟
) degrees of freedom of the ligand in bulk
solvent with respect to the binding pose within the protein binding pocket (Figure 1.12).
The same is applied to the binding site to give ∆𝐺𝑟𝑒𝑠𝑠𝑖𝑡𝑒, which represents the free energy
contribution from the removal of the harmonic restraint potentials placed on the ligand
within the solvated protein binding pocket.103, 119, 123 The sum of all the free energy
contributions (∆𝐺𝑖) is used to determine the equilibrium binding constant 𝐾𝑒𝑞, where

26
𝐾𝑒𝑞 = 𝑒−𝛽[∑∆𝐺𝑖] (1.11)
and the final binding free energy (∆𝐺𝑎𝑏𝑠𝑜 ) is given by,
∆𝐺𝑎𝑏𝑠𝑜 = −𝑅𝑇𝑙𝑛(𝐾𝑒𝑞𝐶𝑜) (1.12)
where 𝑅 is the gas constant, 𝑇 is the absolute temperature, and 𝐶𝑜 = 1/ 1661 Å3 at 1 M
standard concentration to account for the translational freedom of a single solute
molecule in explicit solvent.135
Gumbart et al. performed the alchemical transformation of p41 (APSYSPPPPP)
bound to Abl-SH3 to reproduce the experimental ABFE of ∆𝐺𝑒𝑥𝑝 = −7.99 kcal/mol.110
This approach allows for improved sampling of the protein-ligand complex because of
the reduced configurational degrees of freedom, especially for more dynamic systems.
However, these calculations require a significant amount of setup, especially of the
geometric restraints. Additionally, if the system is not properly equilibrated then the
reference frame used to define the bound state will inaccurately capture the free energy
associated with the binding interactions.
Implementing the ABFE calculations was simplified by the Ligand Binder web
server, which provides standardized CHARMM (Chemistry at HARvard Macromolecular
Mechanics) input files for performing ABFE calculations.105, 136 The ABFE is expressed
in terms of specific intermediate steps in which the ligand-surrounding environment
interactions, as well as the orientational, translational, and conformational sampling of
the ligand, is reduced.
Jo et al. tested this method with the ABFE calculation of three nonpolar aromatic
ligands to the L99A mutant of T4 lysozyme and three FK506-related ligands to FKBP12.
The protein-ligand systems were prepared using the Ligand Binder web server. The free

27
energy calculations proceeded in general with two systems: the bound state, with the
solvated protein-ligand complex, and the unbound state, with the ligand in bulk solvent.
A conformational restraint potential, calculated using the average ligand structure from
the bound state, was applied to keep the reference conformation.
Calculation of the conformational free energy was estimated by calculating the
PMF as a function of ligand RMSD wherein the ligand conformational sampling is
explicitly taken into account by umbrella sampling (US) of the ligand RMSD from the
bound state in the protein-ligand complex. An offset value is applied to the ligand RMSD
to create several intermediate states that define the reaction coordinate between the initial
and final state of the system. The US examines how the system’s energy changes as a
function of a reaction coordinate parameter. Within each specific window or state of the
system, a harmonic restraint is applied using an umbrella biasing potential. The
restraining potentials help to reduce the degrees of freedom of the protein-ligand system
and improve the sampling of the configurational space within the specific window or
state of the system. Then a weighted histogram analysis method (WHAM) is used to
reconstruct the potential of mean force (PMF) from the sorted trajectories of the umbrella
sampling.118 The convergence of the simulations is examined by taking into account the
statistical error measured in block-averaging and determining if there is an overlap of the
free energy profiles in neighboring windows.
The translational and rotational free energy contributions were calculated as
follows: 3 translational (1 distance, 1 angle, 1 dihedral) and 3 rotational (1 angle, 2
dihedral). The translational and rotational restraints were gradually turned on via the

28
linear coupling parameters, 𝜆 , with restraints applied to values from the reference
structure.
The final absolute binding free energy (∆𝐺𝑎𝑏𝑠𝑜 ) is given by,
∆𝐺𝑎𝑏𝑠𝑜 = ∆∆𝐺𝑖𝑛𝑡 + ∆∆𝐺𝑐𝑜𝑛𝑓 + ∆∆𝐺𝑡,𝑟 (1.13)
where ∆∆𝐺𝑖𝑛𝑡 represents the free energy change due to nonbonded interactions between
the ligand and its environment at the binding site (∆𝐺𝑖𝑛𝑡𝑠𝑖𝑡𝑒) and in the bulk solvent
(∆𝐺𝑖𝑛𝑡ℎ𝑦𝑑𝑟
) and ∆∆𝐺𝑡,𝑟 represents free energy change due to the loss of
translational/rotational freedom, and (∆∆𝐺𝑐𝑜𝑛𝑓) represents the free energy change due to
the loss of conformational freedom.
Statistical errors within individual calculations performed by Jo et al. were
approximately 1 kcal/mol and the calculated binding free energies were within an
approximate 2 kcal/mol agreement of the experimental measurements and previous
computational studies.105 An additional benefit of this calculation approach is the ability
to calculate the binding free energy of charged ligands.105
1.4 Conclusions
Relative binding free energy (RBFE) calculation for qualitative comparison
provides an accurate estimate of the relative change in binding free energy ( ∆∆𝐺 )
between two different ligands, without the intensive prep work needed to set up the
calculations. However, the accuracy of RBFE calculations is limited by the size of the
molecule that is being modified.55, 101 Larger modifications require longer simulations in
order to properly sample the free energy of the system. Another limitation of RBFE

29
calculations is the inability to directly translate to an experimental measurement of
affinity (𝐾𝑖).
Absolute binding free energy (ABFE) calculations provide an estimate of the ligand
affinity through the decoupling of a ligand binding to a protein. The accuracy of sampling
can be improved by including intermediate (𝜆) states during the process of coupling or
decoupling. The end-points of the simulation can also be divided into smaller windows to
reduce the change in free energy between 𝜆 -values. The statistical data accrued in the
coupling and decoupling simulations can be combined using the Bennett acceptance ratio
(BAR)137 and offer insight into the state of convergence for each 𝜆 -window.
During ABFE calculations, choosing the appropriate geometric restraints is key to
sample the binding free energy accurately. Decomposition of free energy calculations
provides an accurate depiction of free energy contributions. The setup of these
calculations is very time-consuming however the CHARMM-GUI Ligand Binder offers a
user-friendly web interface that makes it convenient to set up these calculations. The use
of this tool with a well-defined, properly equilibrated reference structure of the protein-
ligand system can result in an accurate ABFE calculation of a ligand to a protein. The
next chapter discusses in detail the parameters used for performing the RBFE and ABFE
calculations on SERT inhibitors.
1.5 References
1. Penmatsa, A., and Gouaux, E. (2014) How LeuT shapes our understanding of the
mechanisms of sodium-coupled neurotransmitter transporters. J Physiol 592, 863-869.
2. Yamashita, A., Singh, S. K., Kawate, T., Jin, Y., and Gouaux, E. (2005) Crystal
structure of a bacterial homologue of Na+/Cl--dependent neurotransmitter transporters.
Nature 437, 215-223.
30
3. Kristensen, A. S., Andersen, J., Jorgensen, T. N., Sorensen, L., Eriksen, J., Loland, C.
J., Stromgaard, K., and Gether, U. (2011) SLC6 neurotransmitter transporters: structure,
function, and regulation. Pharmacol Rev 63, 585-640.
4. Pramod, A. B., Foster, J., Carvelli, L., and Henry, L. K. (2013) SLC6 transporters:
structure, function, regulation, disease association and therapeutics. Mol Aspects Med 34,
197-219.
5. Colas, C., Ung, P. M., and Schlessinger, A. (2016) SLC Transporters: Structure,
Function, and Drug Discovery. MedChemComm 7, 1069-1081.
6. Schlessinger, A., Matsson, P., Shima, J. E., Pieper, U., Yee, S. W., Kelly, L., Apeltsin,
L., Stroud, R. M., Ferrin, T. E., Giacomini, K. M., and Sali, A. (2010) Comparison of
human solute carriers. Protein Sci 19, 412-428.
7. Rudnick, G., Kramer, R., Blakely, R. D., Murphy, D. L., and Verrey, F. (2014) The
SLC6 transporters: perspectives on structure, functions, regulation, and models for
transporter dysfunction. Pflugers Arch 466, 25-42.
8. Forrest, L. R., Tavoulari, S., Zhang, Y. W., Rudnick, G., and Honig, B. (2007)
Identification of a chloride ion binding site in Na+/Cl -dependent transporters. Proc Natl
Acad Sci U S A 104, 12761-12766.
9. Torres, G. E., Gainetdinov, R. R., and Caron, M. G. (2003) Plasma membrane
monoamine transporters: structure, regulation and function. Nat Rev Neurosci 4, 13-25.
10. Lieberman, J. A., Kane, J. M., and Alvir, J. (1987) Provocative tests with
psychostimulant drugs in schizophrenia. Psychopharmacology 91, 415-433.
11. Anderson, I. M. (2000) Selective serotonin reuptake inhibitors versus tricyclic
antidepressants: a meta-analysis of efficacy and tolerability. J Affect Disord 58, 19-36.
12. Best, J., Nijhout, H. F., and Reed, M. (2011) Bursts and the Efficacy of Selective
Serotonin Reuptake Inhibitors. Pharmacopsychiatry 44, S76-S83.
13. Amara, S. G., and Sonders, M. S. (1998) Neurotransmitter transporters as molecular
targets for addictive drugs. Drug Alcohol Depend 51, 87-96.
14. Cheng, M. H., Block, E., Hu, F., Cobanoglu, M. C., Sorkin, A., and Bahar, I. (2015)
Insights into the Modulation of Dopamine Transporter Function by Amphetamine,
Orphenadrine, and Cocaine Binding. Front Neurol 6, 134.
15. Rothman, R. B., and Baumann, M. H. (2003) Monoamine transporters and
psychostimulant drugs. Eur J Pharmacol 479, 23-40.
31
16. Krishnamurthy, H., Piscitelli, C. L., and Gouaux, E. (2009) Unlocking the molecular
secrets of sodium-coupled transporters. Nature 459, 347-355.
17. Torrado, A., Lamas, C., Agejas, J., Jimenez, A., Diaz, N., Gilmore, J., Boot, J.,
Findlay, J., Hayhurst, L., Wallace, L., Broadmore, R., and Tomlinson, R. (2004) Novel
selective and potent 5-HT reuptake inhibitors with 5-HT1D antagonist activity: chemistry
and pharmacological evaluation of a series of thienopyran derivatives. Bioorg Med Chem
12, 5277-5295.
18. Herold, F., Chodkowski, A., Izbicki, L., Turlo, J., Dawidowski, M., Kleps, J.,
Nowak, G., Stachowicz, K., Dybala, M., Siwek, A., Mazurek, A. P., Mazurek, A., and
Plucinski, F. (2011) Novel 4-aryl-pyrido[1,2-c]pyrimidines with dual SSRI and 5-
HT(1A) activity. part 3. Eur J Med Chem 46, 142-149.
19. Zhu, X. Y., Etukala, J. R., Eyunni, S. V. K., Setola, V., Roth, B. L., and
Ablordeppey, S. Y. (2012) Benzothiazoles as probes for the 5HT1A receptor and the
serotonin transporter (SERT): a search for new dual-acting agents as potential
antidepressants. Eur J Med Chem 53, 124-132.
20. Artigas, F. (2013) Serotonin receptors involved in antidepressant effects. Pharmacol
Ther 137, 119-131.
21. Lin, H., Sassano, M. F., Roth, B. L., and Shoichet, B. K. (2013) A pharmacological
organization of G protein-coupled receptors. Nature methods 10, 140-146.
22. Darras, F. H., Pockes, S., Huang, G., Wehle, S., Strasser, A., Wittmann, H. J.,
Nimczick, M., Sotriffer, C. A., and Decker, M. (2014) Synthesis, biological evaluation,
and computational studies of Tri- and tetracyclic nitrogen-bridgehead compounds as
potent dual-acting AChE inhibitors and hH3 receptor antagonists. ACS Chem Neurosci 5,
225-242.
23. Larsen, M. B., Elfving, B., and Wiborg, O. (2004) The chicken serotonin transporter
discriminates between serotonin-selective reuptake inhibitors. A species-scanning
mutagenesis study. J Biol Chem 279, 42147-42156.
24. Richelson, E. (1996) Synaptic effects of antidepressants. J Clin Psychopharmacol
16, 1S-7S; discussion 7S-9S.
25. Ferguson, J. M. (2001) SSRI Antidepressant Medications: Adverse Effects and
Tolerability. Prim Care Companion J Clin Psychiatry 3, 22-27.
26. Aan Het Rot, M., Zarate, C. A., Jr., Charney, D. S., and Mathew, S. J. (2012)
Ketamine for depression: where do we go from here? Biol Psychiatry 72, 537-547.
27. Vu, A. T., Cohn, S. T., Zhang, P., Kim, C. Y., Mahaney, P. E., Bray, J. A., Johnston,
G. H., Koury, E. J., Cosmi, S. A., Deecher, D. C., Smith, V. A., Harrison, J. E.,
32
Leventhal, L., Whiteside, G. T., Kennedy, J. D., and Trybulski, E. J. (2010) 1-(Indolin-1-
yl)-1-phenyl-3-propan-2-olamines as Potent and Selective Norepinephrine Reuptake
Inhibitors. J Med Chem 53, 2051-2062.
28. Eildal, J. N. N., Andersen, J., Kristensen, A. S., Jørgensen, A. M., Bang-Andersen,
B., Jørgensen, M., and Strømgaard, K. (2008) From the selective serotonin transporter
inhibitor citalopram to the selective norepinephrine transporter inhibitor talopram:
synthesis and structure-activity relationship studies. J Med Chem 51, 3045-3048.
29. Surratt, C. K., Ukairo, O. T., and Ramanujapuram, S. (2005) Recognition of
psychostimulants, antidepressants, and other inhibitors of synaptic neurotransmitter
uptake by the plasma membrane monoamine transporters. AAPS J 7, E739-751.
30. Levinstein, M. R., and Samuels, B. A. (2014) Mechanisms underlying the
antidepressant response and treatment resistance. Front Behav Neurosci 8, 208.
31. Larsen, M. B., Sonders, M. S., Mortensen, O. V., Larson, G. a., Zahniser, N. R., and
Amara, S. G. (2011) Dopamine transport by the serotonin transporter: a mechanistically
distinct mode of substrate translocation. J Neurosci 31, 6605-6615.
32. Daws, L. C. (2009) Unfaithful neurotransmitter transporters: focus on serotonin
uptake and implications for antidepressant efficacy. Pharmacol Ther 121, 89-99.
33. Astrup, A., Madsbad, S., Breum, L., Jensen, T. J., Kroustrup, J. P., and Larsen, T. M.
Effect of tesofensine on bodyweight loss, body composition, and quality of life in obese
patients: a randomised, double-blind, placebo-controlled trial. The Lancet 372, 1906-
1913.
34. Hanson, N. D., Owens, M. J., and Nemeroff, C. B. (2011) Depression,
antidepressants, and neurogenesis: a critical reappraisal. Neuropsychopharmacology 36,
2589-2602.
35. Crisafulli, C., Fabbri, C., Porcelli, S., Drago, A., Spina, E., De Ronchi, D., and
Serretti, A. (2011) Pharmacogenetics of antidepressants. Front Pharmacol 2, 6.
36. Cryan, J. F., Valentino, R. J., and Lucki, I. (2005) Assessing substrates underlying
the behavioral effects of antidepressants using the modified rat forced swimming test.
Neurosci Biobehav Rev 29, 547-569.
37. Cryan, J. F., and Holmes, A. (2005) The ascent of mouse: advances in modeling
human depression and anxiety. Nat Rev Drug Discov 4.
38. Cryan, J. F., Mombereau, C., and Vassout, A. (2005) The tail suspension test as a
model for assessing antidepressant activity: review of pharmacological and genetic
studies in mice. Neurosci Biobehav Rev 29, 571-625.

33
39. Cryan, J. F., Page, M. E., and Lucki, I. (2005) Differential behavioral effects of the
antidepressants reboxetine, fluoxetine, and moclobemide in a modified forced swim test
following chronic treatment. Psychopharmacology 182, 335-344.
40. Piscitelli, C. L., Krishnamurthy, H., and Gouaux, E. (2010) Neurotransmitter/sodium
symporter orthologue LeuT has a single high-affinity substrate site. Nature 468, 1129-
1132.
41. Krishnamurthy, H., and Gouaux, E. (2012) X-ray structures of LeuT in substrate-free
outward-open and apo inward-open states. Nature 481, 469-474.
42. Penmatsa, A., Wang, K. H., and Gouaux, E. (2013) X-ray structure of dopamine
transporter elucidates antidepressant mechanism. Nature 503, 85-90.
43. Wang, H., Goehring, A., Wang, K. H., Penmatsa, A., Ressler, R., and Gouaux, E.
(2013) Structural basis for action by diverse antidepressants on biogenic amine
transporters. Nature 503, 141-145.
44. Wang, K. H., Penmatsa, A., and Gouaux, E. (2015) Neurotransmitter and
psychostimulant recognition by the dopamine transporter. Nature 521, 322-327.
45. Penmatsa, A., Wang, K. H., and Gouaux, E. (2015) X-ray structures of Drosophila
dopamine transporter in complex with nisoxetine and reboxetine. Nat Struct Mol Biol 22,
506-508.
46. Forrest, L. R., Zhang, Y. W., Jacobs, M. T., Gesmonde, J., Xie, L., Honig, B. H., and
Rudnick, G. (2008) Mechanism for alternating access in neurotransmitter transporters.
Proc Natl Acad Sci U S A 105, 10338-10343.
47. Kazmier, K., Sharma, S., Quick, M., Islam, S. M., Roux, B., Weinstein, H., Javitch,
J. A., and McHaourab, H. S. (2014) Conformational dynamics of ligand-dependent
alternating access in LeuT. Nat Struct Mol Biol 21, 472-479.
48. Singh, S. K., Yamashita, A., and Gouaux, E. (2007) Antidepressant binding site in a
bacterial homologue of neurotransmitter transporters. Nature 448, 952-956.
49. Singh, S. K., Piscitelli, C. L., Yamashita, A., and Gouaux, E. (2008) A competitive
inhibitor traps LeuT in an open-to-out conformation. Science 322, 1655-1661.
50. Coleman, J. A., Green, E. M., and Gouaux, E. (2016) X-ray structures and
mechanism of the human serotonin transporter. Nature 532, 334-339.
51. Indarte, M., Liu, Y., Madura, J. D., and Surratt, C. K. (2010) Receptor-Based
Discovery of a Plasmalemmal Monoamine Transporter Inhibitor via High-Throughput
Docking and Pharmacophore Modeling. ACS Chem Neurosci 1, 223-233.
34
52. Thomas, J. R., Gedeon, P. C., and Madura, J. D. (2014) Structural dynamics of the
monoamine transporter homologue LeuT from accelerated conformational sampling and
channel analysis. Proteins 82, 2289-2302.
53. Hong, W. C., Kopajtic, T. A., Xu, L., Lomenzo, S. A., Jean, B., Madura, J. D.,
Surratt, C. K., Trudell, M. L., and Katz, J. L. (2016) 2-Substituted 3β-Aryltropane
Cocaine Analogs Produce Atypical DAT Inhibitor Effects Without Inducing Inward-
Facing DAT Conformations. J Pharmacol Exp Ther, 624-634.
54. Gedeon, P. C., et al. (2010) Molecular dynamics of leucine and dopamine transporter
proteins in a model cell membrane lipid layer. Proteins 78, 797-811.
55. Zhao, C., Caplan, D. A., and Noskov, S. Y. (2010) Evaluations of the Absolute and
Relative Free Energies for Antidepressant Binding to the Amino Acid Membrane
Transporter LeuT with Free Energy Simulations. J Chem Theory Comput 6, 1900-1914.
56. Zhao, Y., Terry, D., Shi, L., Weinstein, H., Blanchard, S. C., and Javitch, J. A.
(2010) Single-molecule dynamics of gating in a neurotransmitter transporter homologue.
Nature 465, 188-193.
57. Chang, Y.-W., Chen, S., Tocheva, E. I., Treuner-Lange, A., Löbach, S., Søgaard-
Andersen, L., and Jensen, G. J. (2014) Correlated cryogenic photoactivated localization
microscopy and cryo-electron tomography. Nature methods 11, 737-739.
58. Fujiyoshi, Y., and Unwin, N. (2008) Electron crystallography of proteins in
membranes. Curr Opin Struct Biol 18, 587-592.
59. Raman, P., Cherezov, V., and Caffrey, M. (2006) The Membrane Protein Data Bank.
Cell Mol Life Sci 63, 36-51.
60. Zomot, E., Bendahan, A., Quick, M., Zhao, Y., Javitch, J. A., and Kanner, B. I.
(2007) Mechanism of chloride interaction with neurotransmitter:sodium symporters.
Nature 449, 726-730.
61. Beuming, T., Kniazeff, J., Bergmann, M. L., Shi, L., Gracia, L., Raniszewska, K.,
Newman, A. H., Javitch, J. A., Weinstein, H., Gether, U., and Loland, C. J. (2008) The
binding sites for cocaine and dopamine in the dopamine transporter overlap. Nat
Neurosci 11, 780-789.
62. Malinauskaite, L., Quick, M., Reinhard, L., Lyons, J. A., Yano, H., Javitch, J. A.,
and Nissen, P. (2014) A mechanism for intracellular release of Na+ by
neurotransmitter/sodium symporters. Nat Struct Mol Biol 21, 1006-1012.
63. Bisgaard, H., Larsen, M. A., Mazier, S., Beuming, T., Newman, A. H., Weinstein,
H., Shi, L., Loland, C. J., and Gether, U. (2011) The binding sites for benztropines and
dopamine in the dopamine transporter overlap. Neuropharmacology 60, 182-190.

35
64. Kantcheva, A. K., Quick, M., Shi, L., Winther, A. M., Stolzenberg, S., Weinstein, H.,
Javitch, J. A., and Nissen, P. (2013) Chloride binding site of neurotransmitter sodium
symporters. Proc Natl Acad Sci U S A 110, 8489-8494.
65. Kniazeff, J., Shi, L., Loland, C. J., Javitch, J. A., Weinstein, H., and Gether, U.
(2008) An intracellular interaction network regulates conformational transitions in the
dopamine transporter. J Biol Chem 283, 17691-17701.
66. Stolzenberg, S., Quick, M., Zhao, C., Gotfryd, K., Khelashvili, G., Gether, U.,
Loland, C. J., Javitch, J. A., Noskov, S., Weinstein, H., and Shi, L. (2015) Mechanism of
the Association between Na+ Binding and Conformations at the Intracellular Gate in
Neurotransmitter:Sodium Symporters. J Biol Chem 290, 13992-14003.
67. Larsen, M. A., Plenge, P., Andersen, J., Eildal, J. N., Kristensen, A. S., Bogeso, K.
P., Gether, U., Stromgaard, K., Bang-Andersen, B., and Loland, C. J. (2016) Structure-
activity relationship studies of citalopram derivatives: examining substituents conferring
selectivity for the allosteric site in the 5-HT transporter. Br J Pharmacol 173, 925-936.
68. Zhen, J., and Reith, M. E. (2016) Impact of disruption of secondary binding site S2
on dopamine transporter function. J Neurochem 138, 694-699.
69. LeVine, M. V., Cuendet, M. A., Khelashvili, G., and Weinstein, H. (2016) Allosteric
Mechanisms of Molecular Machines at the Membrane: Transport by Sodium-Coupled
Symporters. Chem Rev 116, 6552-6587.
70. Gur, M., Cheng, M. H., Zomot, E., and Bahar, I. (2017) Effect of Dimerization on
the Dynamics of Neurotransmitter:Sodium Symporters. J Phys Chem B.
71. Razavi, A. M., Khelashvili, G., and Weinstein, H. (2017) A Markov State-based
Quantitative Kinetic Model of Sodium Release from the Dopamine Transporter.
Scientific reports 7, 40076.
72. Chavent, M., Duncan, A. L., and Sansom, M. S. (2016) Molecular dynamics
simulations of membrane proteins and their interactions: from nanoscale to mesoscale.
Curr Opin Struct Biol 40, 8-16.
73. Bahar, I., Cheng, M. H., Lee, J. Y., Kaya, C., and Zhang, S. (2015) Structure-
Encoded Global Motions and Their Role in Mediating Protein-Substrate Interactions.
Biophys J 109, 1101-1109.
74. Andersen, J., Ladefoged, L. K., Wang, D., Kristensen, T. N., Bang-Andersen, B.,
Kristensen, A. S., Schiott, B., and Stromgaard, K. (2015) Binding of the multimodal
antidepressant drug vortioxetine to the human serotonin transporter. ACS Chem Neurosci
6, 1892-1900.

36
75. Cheng, M. H., and Bahar, I. (2015) Molecular Mechanism of Dopamine Transport by
Human Dopamine Transporter. Structure 23, 2171-2181.
76. Bisha, I., and Magistrato, A. (2016) The molecular mechanism of secondary sodium
symporters elucidated through the lens of the computational microscope. RSC Adv 6,
9522-9540.
77. Grouleff, J., Koldso, H., Miao, Y., and Schiott, B. (2017) Ligand Binding in the
Extracellular Vestibule of the Neurotransmitter Transporter Homologue LeuT. ACS
Chem Neurosci 8, 619-628.
78. Manepalli, S., Geffert, L. M., Surratt, C. K., and Madura, J. D. (2011) Discovery of
novel selective serotonin reuptake inhibitors through development of a protein-based
pharmacophore. J Chem Inf Model 51, 2417-2426.
79. Schlessinger, A., Geier, E., Fan, H., Irwin, J. J., Shoichet, B. K., Giacomini, K. M.,
and Sali, A. (2011) Structure-based discovery of prescription drugs that interact with the
norepinephrine transporter, NET. Proc Natl Acad Sci U S A 108, 15810-15815.
80. Nolan, T. L., Lapinsky, D. J., Talbot, J. N., Indarte, M., Liu, Y., Manepalli, S.,
Geffert, L. M., Amos, M. E., Taylor, P. N., Madura, J. D., and Surratt, C. K. (2011)
Identification of a novel selective serotonin reuptake inhibitor by coupling monoamine
transporter-based virtual screening and rational molecular hybridization. ACS Chem
Neurosci 2, 544-552.
81. Nolan, T. L., Geffert, L. M., Kolber, B. J., Madura, J. D., and Surratt, C. K. (2014)
Discovery of novel-scaffold monoamine transporter ligands via in silico screening with
the S1 pocket of the serotonin transporter. ACS Chem Neurosci 5, 784-792.
82. Gabrielsen, M., Ravna, A. W., Kristiansen, K., and Sylte, I. (2012) Substrate binding
and translocation of the serotonin transporter studied by docking and molecular dynamics
simulations. J Mol Model 18, 1073-1085.
83. Gabrielsen, M., Kurczab, R., Ravna, A. W., Kufareva, I., Abagyan, R., Chilmonczyk,
Z., Bojarski, A. J., and Sylte, I. (2012) Molecular mechanism of serotonin transporter
inhibition elucidated by a new flexible docking protocol. Eur J Med Chem 47, 24-37.
84. Gabrielsen, M., Kurczab, R., Siwek, A., Wolak, M., Ravna, A. W., Kristiansen, K.,
Kufareva, I., Abagyan, R., Nowak, G., Chilmonczyk, Z., Sylte, I., and Bojarski, A. J.
(2014) Identification of novel serotonin transporter compounds by virtual screening. J
Chem Inf Model 54, 933-943.
85. Zhou, Z., Zhen, J., Karpowich, N. K., Goetz, R. M., Law, C. J., Reith, M. E. A., and
Wang, D.-N. N. (2007) LeuT-desipramine structure reveals how antidepressants block
neurotransmitter reuptake. Science 317, 1390-1393.

37
86. Sinning, S., Musgaard, M., Jensen, M., Severinsen, K., Celik, L., Koldsø, H., Meyer,
T., Bols, M., Jensen, H. H., Schiøtt, B., and Wiborg, O. (2010) Binding and orientation of
tricyclic antidepressants within the central substrate site of the human serotonin
transporter. J Biol Chem 285, 8363-8374.
87. Zhou, Z., Zhen, J., Karpowich, N. K., Law, C. J., Reith, M. E. a., and Wang, D.-n. N.
(2009) Antidepressant specificity of serotonin transporter suggested by three LeuT-SSRI
structures. Nat Struct Mol Biol 16, 652-657.
88. Topiol, S., Bang-Andersen, B., Sanchez, C., Plenge, P., Loland, C. J., Juhl, K.,
Larsen, K., Bregnedal, P., and Bogeso, K. P. (2017) X-ray structure based evaluation of
analogs of citalopram: Compounds with increased affinity and selectivity compared with
R-citalopram for the allosteric site (S2) on hSERT. Bioorg Med Chem Lett 27, 470-478.
89. Kortagere, S., Fontana, A. C. K., Renée Rose, D., and Mortensen, O. V. (2013)
Identification of an allosteric modulator of the serotonin transporter with novel
mechanism of action. Neuropharmacology 72, 282-290.
90. Mortensen, O. V., and Kortagere, S. (2015) Designing modulators of monoamine
transporters using virtual screening techniques. Front Pharmacol 6, 223.
91. Schmitt, K. C., and Reith, M. E. (2010) Regulation of the dopamine transporter:
aspects relevant to psychostimulant drugs of abuse. Ann N Y Acad Sci 1187, 316-340.
92. Liang, Y. J., Zhen, J., Chen, N., and Reith, M. E. (2009) Interaction of catechol and
non-catechol substrates with externally or internally facing dopamine transporters. J
Neurochem 109, 981-994.
93. Schmitt, K. C., Zhen, J., Kharkar, P., Mishra, M., Chen, N., Dutta, A. K., and Reith,
M. E. A. (2008) Interaction of cocaine-, benztropine-, and GBR12909-like compounds
with wild-type and mutant human dopamine transporters: molecular features that
differentially determine antagonist-binding properties. J Neurochem 107, 928-940.
94. Loland, C. J., Desai, R. I., Zou, M. F., Cao, J., Grundt, P., Gerstbrein, K., Sitte, H.
H., Newman, A. H., Katz, J. L., and Gether, U. (2008) Relationship between
conformational changes in the dopamine transporter and cocaine-like subjective effects of
uptake inhibitors. Mol Pharmacol 73, 813-823.
95. Schneider, G., and Bohm, H. J. (2002) Virtual screening and fast automated docking
methods. Drug Discov Today 7, 64-70.
96. Seifert, M. H., and Lang, M. (2008) Essential factors for successful virtual screening.
Mini Rev Med Chem 8, 63-72.
97. Seifert, M. H. (2009) Targeted scoring functions for virtual screening. Drug Discov
Today 14, 562-569.

38
98. Chen, Z., Li, H.-l., Zhang, Q.-j., Bao, X.-g., Yu, K.-q., Luo, X.-m., Zhu, W.-l., and
Jiang, H.-l. (2009) Pharmacophore-based virtual screening versus docking-based virtual
screening: a benchmark comparison against eight targets. Acta Pharmacol Sin 30, 1694-
1708.
99. Wei, B. Q., Weaver, L. H., Ferrari, A. M., Matthews, B. W., and Shoichet, B. K.
(2004) Testing a Flexible-receptor Docking Algorithm in a Model Binding Site. J Mol
Biol 337, 1161-1182.
100. Eldridge, M. D., Murray, C. W., Auton, T. R., Paolini, G. V., and Mee, R. P. (1997)
Empirical scoring functions: I. The development of a fast empirical scoring function to
estimate the binding affinity of ligands in receptor complexes. J Comput Aided Mol Des
11, 425-445.
101. Wang, J., Deng, Y., and Roux, B. (2006) Absolute binding free energy calculations
using molecular dynamics simulations with restraining potentials. Biophys J 91, 2798-
2814.
102. Singh, N., and Warshel, A. (2010) Absolute binding free energy calculations: on the
accuracy of computational scoring of protein-ligand interactions. Proteins 78, 1705-1723.
103. Mobley, D. L., and Klimovich, P. V. (2012) Perspective: Alchemical free energy
calculations for drug discovery. J Chem Phys 137, 230901.
104. Gapsys, V., Seeliger, D., and de Groot, B. L. (2012) New Soft-Core Potential
Function for Molecular Dynamics Based Alchemical Free Energy Calculations. J Chem
Theory Comput 8, 2373-2382.
105. Jo, S., Jiang, W., Lee, H. S., Roux, B., and Im, W. (2013) CHARMM-GUI Ligand
Binder for Absolute Binding Free Energy Calculations and Its Application. J Chem Inf
Model 53, 267-277.
106. Shaw, D. E., Chao, J. C., Eastwood, M. P., Gagliardo, J., Grossman, J. P., Ho, C.
R., Lerardi, D. J., Kolossváry, I., Klepeis, J. L., Layman, T., McLeavey, C., Deneroff, M.
M., Moraes, M. A., Mueller, R., Priest, E. C., Shan, Y., Spengler, J., Theobald, M.,
Towles, B., Wang, S. C., Dror, R. O., Kuskin, J. S., Larson, R. H., Salmon, J. K., Young,
C., Batson, B., and Bowers, K. J. (2008) Anton, a special-purpose machine for molecular
dynamics simulation. Communications of the ACM 51, 91-97.
107. Towns, J., Cockerill, T., Dahan, M., Foster, I., Gaither, K., Grimshaw, A.,
Hazlewood, V., Lathrop, S., Lifka, D., Peterson, G. D., Roskies, R., Scott, J. R., and
Wilkens-Diehr, N. (2014) XSEDE: Accelerating Scientific Discovery. Comput Sci Eng
16, 62-74.
39
108. Gilson, M. K., Given, J. a., Bush, B. L., and McCammon, J. a. (1997) The
statistical-thermodynamic basis for computation of binding affinities: a critical review.
Biophys J 72, 1047-1069.
109. Jorgensen, W. L. (2009) Efficient drug lead discovery and optimization. Acc Chem
Res 42, 724-733.
110. Gumbart, J. C., Roux, B., and Chipot, C. (2013) Standard binding free energies
from computer simulations: What is the best strategy? J Chem Theory Comput 9, 794-
802.
111. Rocklin, G. J., Boyce, S. E., Fischer, M., Fish, I., Mobley, D. L., Shoichet, B. K.,
and Dill, K. a. (2013) Blind prediction of charged ligand binding affinities in a model
binding site. J Mol Biol 425, 4569-4583.
112. Zhou, H. X., and Gilson, M. K. (2009) Theory of free energy and entropy in
noncovalent binding. Chem Rev 109, 4092-4107.
113. Woo, H. J., and Roux, B. (2005) Calculation of absolute protein-ligand binding free
energy from computer simulations. Proc Natl Acad Sci U S A 102, 6825-6830.
114. Mobley, D. L., Chodera, J. D., and Dill, K. a. (2006) On the use of orientational
restraints and symmetry corrections in alchemical free energy calculations. J Chem Phys
125, 084902.
115. General, I. J., Dragomirova, R., and Meirovitch, H. (2011) Calculation of the
Absolute Free Energy of Binding and Related Entropies with the HSMD-TI Method: The
FKBP12-L8 Complex. J Chem Theory Comput 7, 4196-4207.
116. Wang, L., Berne, B. J., and Friesner, R. A. (2012) On achieving high accuracy and
reliability in the calculation of relative protein-ligand binding affinities. Proc Natl Acad
Sci U S A 109, 1937-1942.
117. Kumar, S., Rosenberg, J. M., Bouzida, D., Swendsen, R. H., and Kollman, P. A.
(1992) The weighted histogram analysis method for free-energy calculations on
biomolecules. I. The method. J Comput Chem 13, 1011-1021.
118. Souaille, M., and Roux, B. t. (2001) Extension to the weighted histogram analysis
method: combining umbrella sampling with free energy calculations. Comput Phys
Comm 135, 40-57.
119. Chipot, C., Pohorille, A. (2007) Free Energy Calculations: Theory and
Applications in Chemistry and Biology, Springer Berlin Heidelberg New York.
120. Pohorille, A., Jarzynski, C., and Chipot, C. (2010) Good practices in free-energy
calculations. J Phys Chem B 114, 10235-10253.
40
121. Illingworth, C. J., Morris, G. M., Parkes, K. E., Snell, C. R., and Reynolds, C. A.
(2008) Assessing the Role of Polarization in Docking. J Phys Chem A 112, 12157-12163.
122. Davis, J. E., and Patel, S. (2010) Revised Charge Equilibration Parameters for More
Accurate Hydration Free Energies of Alkanes. Chem Phys Lett 484, 173.
123. Miyamoto, S., and Kollman, P. A. (1993) Absolute and relative binding free energy
calculations of the interaction of biotin and its analogs with streptavidin using molecular
dynamics/free energy perturbation approaches. Proteins 16, 226-245.
124. Page, M. I., and Jencks, W. P. (1971) Entropic contributions to rate accelerations in
enzymic and intramolecular reactions and the chelate effect. Proc Natl Acad Sci U S A
68, 1678-1683.
125. Liu, P., Dehez, F., Cai, W., and Chipot, C. (2012) A Toolkit for the Analysis of
Free-Energy Perturbation Calculations. J Chem Theory Comput 8, 2606-2616.
126. Gumbart, J. C., Roux, B., and Chipot, C. (2013) Efficient determination of protein-
protein standard binding free energies from first principles. J Chem Theory Comput 9,
3789−3798.
127. Jorgensen, W. L. (1989) Free energy calculations: a breakthrough for modeling
organic chemistry in solution. Acc Chem Res 22, 184-189.
128. Kollman, P. (1993) Free energy calculations: Applications to chemical and
biochemical phenomena. Chem Rev 93, 2395-2417.
129. Jorgensen, W. L., Chandrasekhar, J., Madura, J. D., Impey, R. W., and Klein, M. L.
(1983) Comparison of simple potential functions for simulating liquid water. J Chem
Phys 79, 926-935.
130. Maréchal, Y. (2007) The Hydrogen Bond: Formation, Thermodynamic Properties,
Classification. In The Hydrogen Bond and the Water Molecule, pp 3-24, Elsevier,
Amsterdam.
131. Maréchal, Y. (2007) The Water Molecule in (Bio)Macromolecules. In The
Hydrogen Bond and the Water Molecule, pp 249-275, Elsevier, Amsterdam.
132. Jorgensen, W. L., and Ravimohan, C. (1985) Monte Carlo simulation of differences
in free energies of hydration. J Chem Phys 83, 3050-3054.
133. Yu, Y. B., Privalov, P. L., and Hodges, R. S. (2001) Contribution of translational
and rotational motions to molecular association in aqueous solution. Biophys J 81, 1632-
1642.
41
134. Deng, Y., and Roux, B. (2009) Computations of standard binding free energies with
molecular dynamics simulations. J Phys Chem B 113, 2234-2246.
135. Swanson, J. M. J., Henchman, R. H., and McCammon, J. A. (2004) Revisiting free
energy calculations: a theoretical connection to MM/PBSA and direct calculation of the
association free energy. Biophys J 86, 67-74.
136. Im, W., Bernèche, S., and Roux, B. (2001) Generalized solvent boundary potential
for computer simulations. J Chem Phys 114, 2924-2937.
137. Bennett, C. H. (1976) Efficient estimation of free energy differences from Monte
Carlo data. J Comp Phys 22, 245-268.
42
CHAPTER 2
2 METHODS
2.1 Modeling the binding of DAT inhibitors
2.1.1 DAT homology models
The FASTA sequence of rat dopamine transporter (DAT) protein (SwissProt
locus SC6A3_RAT; accession number P23977; NCBI accession number AAB21099)
was used and aligned to template the homologous, bacterial, Aquifex aeolicus leucine
transporter (LeuTAa) from Protein Data Bank (PDB) entry 2A65.1, 2 The best model
obtained using the Robetta server (http://robetta.bakerlab.org), a full-chain protein
structure prediction server, was chosen based on docking energies for dopamine and
amphetamine in the Molecular Operating Environment (MOE) software (v2008.10).3-5
Hydrogen atoms were added and partial charges assigned using the AMBER996 all-atom
force field, and the model was minimized followed by 35 ns of classical MD on the
model before the protein was embedded in a membrane.4 The final protein model
represented an outward-facing conformation lacking the DAT N-terminal cytoplasmic
tail (residues 1 – 59).
The newly constructed DAT model was embedded in a 1-palmitoyl-2-oleoyl-sn-
glycero-3-phosphoethanolamine (POPE) bilayer created with the Membrane Builder
plugin of VMD.7 The system was solvated with approximately 32,000 TIP3P water

43
molecules distributed on either side of the membrane. 0.2 M NaCl was added using the
Autoionize plugin of VMD to achieve an overall neutral system. The single bilayer
system was duplicated, reflected, and translated in the z-direction to be merged with the
original to create a dual bilayer system. One DAT model was in a bound state (two
sodium ions, one dopamine molecule) and the other represented an unbound apoprotein
(APO) state. Additionally, two dopamine molecules were added to the extracellular bath.
The final system size was 118 Å x 118 Å x 227 Å with 274,292 atoms.
The complete dual bilayer system was minimized for 40,000 steps with a 1
femtosecond (fs) timestep. The system was equilibrated from 100 K to 300 K in 10 K
increments over a period of 50,000 steps. The equilibrated DAT system was simulated
using the Nanoscale Molecular Dynamics (NAMD) (v2.10b1) to produce 600
nanoseconds (ns) of production time with a 2 fs timestep. The Langevin thermostat was
utilized and set to 300 K; the Langevin piston was used for an isobaric-isothermal (NPT)
ensemble with periodic boundary conditions. Particle mesh Ewald (PME)8 was used for
electrostatics, with a grid spacing of 1.0 Å.
2.1.2 System preparation and simulation details
The trajectory of DAT was superposed with the coordinates of the inward-facing
(IF) LeuT (PDB entry 3TT3)9 and outward-facing (OF) dDAT (PDB entry 4M48)10
crystal structures. The root-mean-square deviation (RMSD) was measured for the C𝛼
atoms of TM1- 12 with reference to the outward-facing crystal structure of dDAT10 and
the inward-facing crystal structure of LeuT9 (Figure 1.5). N- and C-terminal tails, as well
as the extracellular and intracellular loops, were excluded from the RMSD calculations.
44
Sodium and chloride ions (2 Na+, 1 Cl-) were included in the DAT homology models
based on ion coordinates within the crystal structures of LeuT9 and dDAT.10-12 Each
protein system was inserted into a 110 Å x 110 Å POPE lipid membrane using the
CHARMM-GUI Membrane Builder.13-18 The system was solvated with the TIP3P19 water
model and ion concentration of 0.15 M NaCl. The final system size was 123 Å x 123 Å x
105 Å and with approximately 110,000 atoms.
A 50 picosecond (ps) energy minimization was performed on the APO DAT
models to eliminate steric clashes. A 10 ns equilibration was carried out with harmonic
restraints placed on the protein backbone atoms (C𝛼, N) with a force constant of 1.0
kcal/mol/Å. MD was performed without the harmonic restraints for an additional 10 ns.
The MD was conducted with the NPT ensemble in NAMD (v2.10b1) with PBC.
Langevin dynamics and the damping Langevin piston were utilized to maintain 310 K
temperature and 1 atm pressure, respectively, with a damping coefficient of 10.0 ps-1. The
Langevin piston was assigned a target pressure of 1 atm, an oscillation period of 100 fs,
and a damping timescale of 50 fs. A cutoff distance of 12.0 Å was applied for short-range
electrostatic, and a switch distance of 8.0 Å was used for van der Waals (vdW)
interactions. The PME algorithm was used to estimate the long-range electrostatic
interactions with, a grid spacing of 1.0 Å.8 A time step of 2 fs was utilized for the
integration of motion for short- and long-range interactions.
The OF and IF DAT systems were used for modeling the binding of the DAT
inhibitors (cocaine, benztropine (BZT), LX10, and LX11). MOE (v2013.0802)3 was used
to generate docked poses of cocaine, BZT, LX10 or LX11 within the primary binding site
(S1) of the OF and IF DAT models. The docking site was defined with the placement of

45
dummy atoms using the Site Finder tool of MOE. The induced fit docking protocol was
implemented using the Triangle Matcher placement method and refined with the
Amber10: EHT force field. The docked poses for each molecule were London dG-scored
(MOE)3 and the top scoring poses were evaluated for intermolecular interactions with
DAT residues similar to those seen in the 4M48 crystal structure with dDAT bound to
nortriptyline.10
To generate the DAT-inhibitor systems, first cocaine was docked into S1 of APO
OF DAT and BZT docked into S1 of APO IF DAT and the systems were simulated for 5
ns with MD. In the OF DAT, cocaine was replaced by BZT, LX10, and LX11 for each
subsequent DAT-inhibitor complex in the outward-facing conformation. In the IF DAT,
BZT was replaced by cocaine, LX10, and LX11 to create DAT-inhibitor complexes in
the IF DAT conformation.
The CHARMM36 force field was used for parameterizing the protein, lipid, and
water molecules in all MD simulations.16, 18, 20, 21 Force field parameters previously
developed for cocaine were used, and force field parameters for BZT, LX10 and LX11
were obtained from the ParamChem web server (v0.9.7.1) with the v2b8 CHARMM
General Force Field (CGenFF), which is compatible with the CHARMM36 force field.20,
22 The 8 DAT-inhibitor systems and two APO DAT systems were subjected to 100 ns of
MD.
2.1.3 Solvent accessibility surface area analysis
Solvent accessibility surface area (SASA) for DAT residues was measured using
VMD.7 Residues for the external cavity were defined by DAT residues lining the
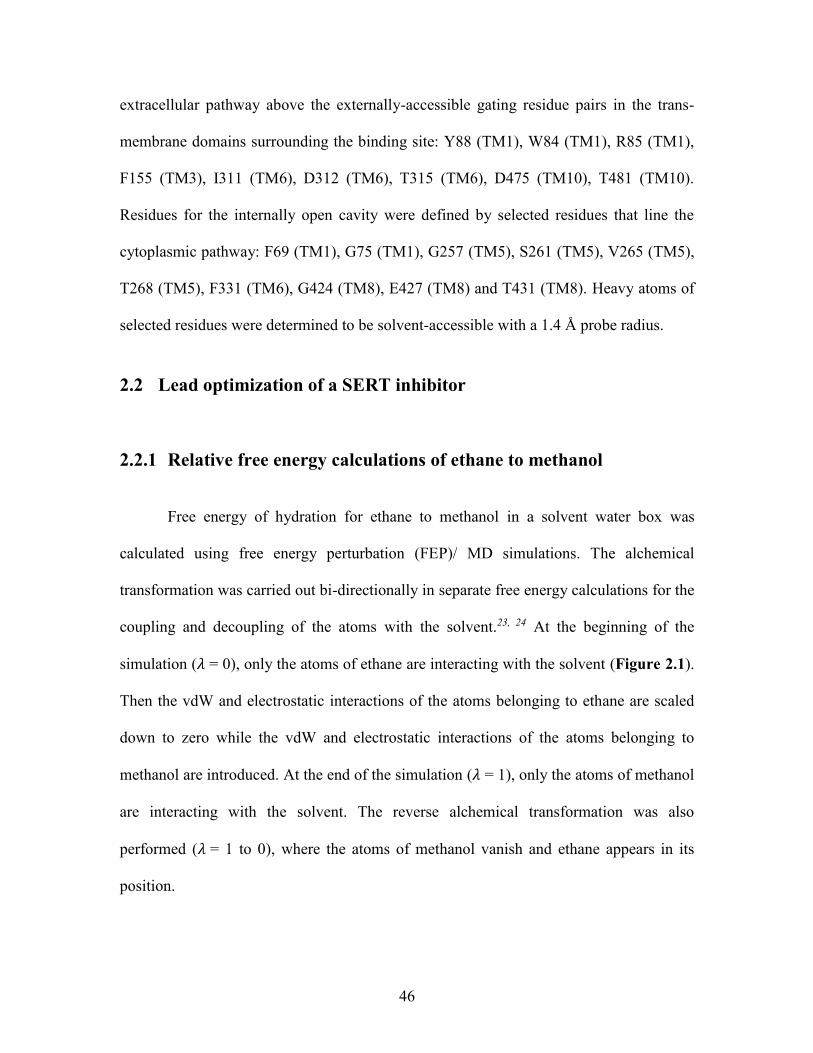
46
extracellular pathway above the externally-accessible gating residue pairs in the trans-
membrane domains surrounding the binding site: Y88 (TM1), W84 (TM1), R85 (TM1),
F155 (TM3), I311 (TM6), D312 (TM6), T315 (TM6), D475 (TM10), T481 (TM10).
Residues for the internally open cavity were defined by selected residues that line the
cytoplasmic pathway: F69 (TM1), G75 (TM1), G257 (TM5), S261 (TM5), V265 (TM5),
T268 (TM5), F331 (TM6), G424 (TM8), E427 (TM8) and T431 (TM8). Heavy atoms of
selected residues were determined to be solvent-accessible with a 1.4 Å probe radius.
2.2 Lead optimization of a SERT inhibitor
2.2.1 Relative free energy calculations of ethane to methanol
Free energy of hydration for ethane to methanol in a solvent water box was
calculated using free energy perturbation (FEP)/ MD simulations. The alchemical
transformation was carried out bi-directionally in separate free energy calculations for the
coupling and decoupling of the atoms with the solvent.23, 24 At the beginning of the
simulation (𝜆 = 0), only the atoms of ethane are interacting with the solvent (Figure 2.1).
Then the vdW and electrostatic interactions of the atoms belonging to ethane are scaled
down to zero while the vdW and electrostatic interactions of the atoms belonging to
methanol are introduced. At the end of the simulation (𝜆 = 1), only the atoms of methanol
are interacting with the solvent. The reverse alchemical transformation was also
performed (𝜆 = 1 to 0), where the atoms of methanol vanish and ethane appears in its
position.

47
Figure 2.1: Alchemical transformation of ethane to methanol. Charges for the atoms
are listed under each atom group. Atom charges are assigned from Jorgensen et al.21, 25
For ethane: each methyl group is given a charge of 0.000; for methanol: the methyl
group has a charge of 0.265, the oxygen atom is given a charge of -0.700, and the
hydrogen atom is given a charge of 0.435. At 𝜆 =0 only the atoms of ethane are
interacting with its environment. The vdW and electrostatic interactions of the methyl
group belonging to ethane are scaled down to zero while the vdW and electrostatic
interactions of the hydroxyl group belonging to methanol are introduced. At 𝜆 =1 only
the atoms of methanol are interacting with its environment. 25 𝜆 -windows of even
distribution (∆𝜆 = 0.04) were used for the transformation.
A dual topology was used to generate the coordinate file with atoms of ethane and
methanol represented. Charges used by Jorgensen et al.25 were assigned to the atoms of
ethane and methanol (Figure 2.1). The molecule was solvated with 340 TIP3P water
molecules using VMD.7, 19 A series of free energy perturbation (FEP)/ MD simulations
were carried out to perform the alchemical transformation. The bi-directional FEP
simulation was performed over a reaction pathway stratified in 25 𝜆 -windows of even
distribution (∆𝜆 = 0.04). The system was energy minimized for 25 ps followed by 800 ps
FEP simulation in NAMD v2.9 in the NPT ensemble with periodic boundary conditions
at 300 K and 1 atm.26 The statistical data accrued in the coupling and decoupling
simulations were combined using the Bennett acceptance ratio (BAR).27 The BAR was
used as part of the ParseFEP plugin in VMD to provide a maximum-likelihood estimator
of the free energy change.26, 28, 29
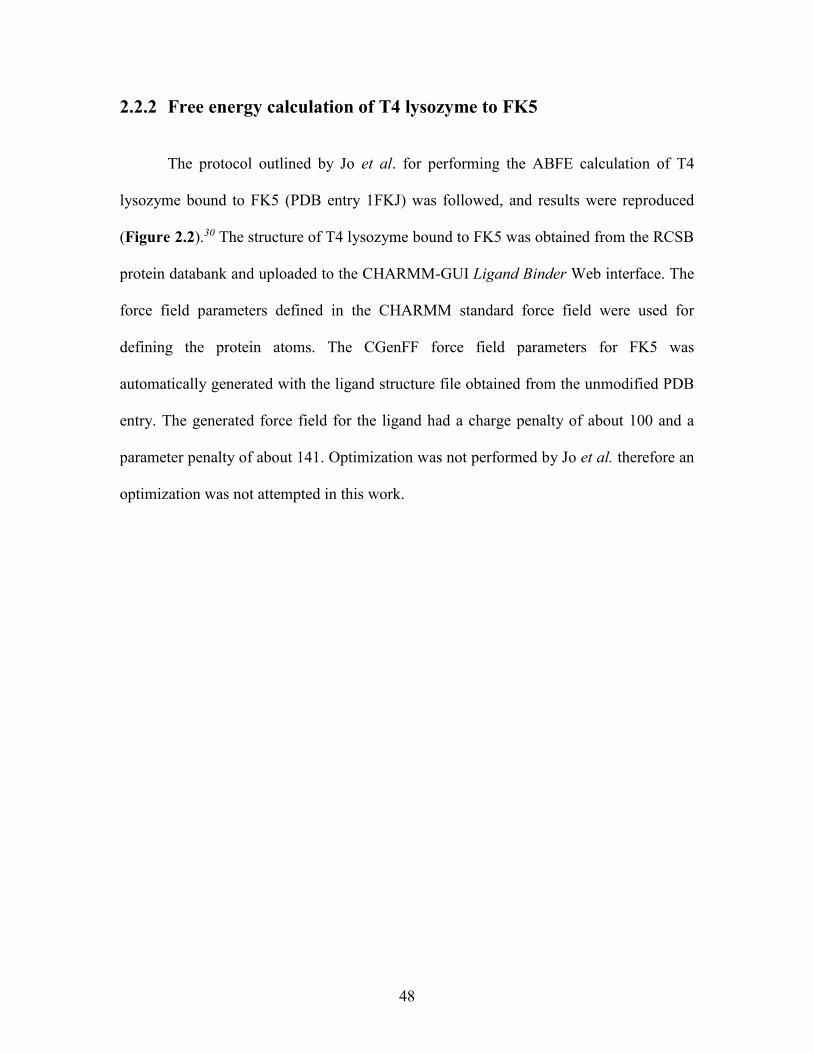
48
2.2.2 Free energy calculation of T4 lysozyme to FK5
The protocol outlined by Jo et al. for performing the ABFE calculation of T4
lysozyme bound to FK5 (PDB entry 1FKJ) was followed, and results were reproduced
(Figure 2.2).30 The structure of T4 lysozyme bound to FK5 was obtained from the RCSB
protein databank and uploaded to the CHARMM-GUI Ligand Binder Web interface. The
force field parameters defined in the CHARMM standard force field were used for
defining the protein atoms. The CGenFF force field parameters for FK5 was
automatically generated with the ligand structure file obtained from the unmodified PDB
entry. The generated force field for the ligand had a charge penalty of about 100 and a
parameter penalty of about 141. Optimization was not performed by Jo et al. therefore an
optimization was not attempted in this work.

49
Figure 2.2: Structure of K506 (FK5) ligand.30 The force field for FK5 was automatically
generated by CGenFF v2b8 with the ligand structure files obtained from the PDB entry
1FKJ.
The protein-ligand complex was solvated in a spherical water box for a reduced
system. The extent of the ligand was determined by the interface, and the size of the
spherical water box was created for the bound and unbound states with an additional 10
Å and 5 Å from the extent of the ligand. The inner region was then extended by 3 Å to
define a smooth spherical dielectric cavity. Water molecules within the outer region were
treated implicitly with a dielectric constant of 1 inside the protein as well as the inner and
extended regions, and 80 otherwise.31 The grand canonical Monte Carlo (GCMC) method
was used to hydrate and equilibrate the inner regions. During the hydration 20 cycles of
MC and MD simulation were used where each cycle consisted of 10,000 MC moves
followed by 10,000 MD steps with a 2 fs time step. A harmonic restraint potential with a
50
force constant of 5.0 kcal/ (mol·Å2) was applied to the protein and the ligand molecule
throughout the MD simulations. The simulations were carried out using Langevin
dynamics at 300 K with a friction coefficient of 5 ps−1 assigned to all non-hydrogen
atoms. After 20 cycles of GCMC/MD simulations, the protein−ligand complex was
equilibrated for 200 ps at 300 K using Langevin dynamics without the positional
harmonic restraint. The anchoring atoms for defining the protein-ligand translational and
rotational restraints were chosen automatically by the Web server. The procedure for
assigning the anchoring atoms are detailed by Jo et al.30 The last 190 ps of equilibration
was used to calculate the average reference distances, angles, and dihedrals for the
translational/rotational restraints. The averaged and minimized ligand structure was used
as the reference configuration for the conformational restraint. In the bulk solvent, the
ligand molecule was equilibrated for 200 ps at 300 K using the SSBP (spherical solvent
boundary potential) and Langevin dynamics.
The free energies associated with restriction of ligand conformation to the
reference conformation (∆𝐺𝑐𝑜𝑛𝑓), restriction of ligand orientation and translation (∆𝐺𝑡,𝑟),
and interactions with surrounding environments (∆𝐺𝑖𝑛𝑡) were calculated with FEP/MD
simulations. The FEP/MD simulations were divided into 137 independent windows.
During the simulations, the perturbation energies for each state were collected.
The conformational free energies (∆𝐺𝑐𝑜𝑛𝑓𝑠𝑖𝑡𝑒 and ∆𝐺𝑐𝑜𝑛𝑓
ℎ𝑦𝑑𝑟) associated with restricting
the ligand conformation in the bound state were estimated by calculating the potential of
mean force (PMF) as a function of ligand RMSD using umbrella sampling simulations.30
Twenty-one biasing windows were used with the RMSD offset value from 0.0 to 5.0 Å in

51
steps of 0.25 Å. Each window was simulated using a force constant of 10 kcal/(mol·Å2)
for 110 ps.
The CHARMM input files for the simulation generated by the CHARMM-GUI
Ligand Binder tool were unchanged.14, 17, 18, 30 The reproduced calculations were
compared to the results reported by Jo et al. and to the experimental binding free energy
of T4 lysozyme bound to FK5.30
2.2.3 Free energy calculation of LeuT substrates
The protocol outlined by Gumbart et al. was followed to perform the ABFE
calculation of leucine in LeuT.32 The crystal structure of LeuT with leucine (PDB entry
3F3A)33 was solvated using the TIP3P19 water model (71,000 and 8,000 for bound and
unbound, respectively). The CHARMM36 force field was used to define all the atoms in
the system.16, 20, 22, 34 The bound and unbound systems underwent an isobaric-isothermal
(NPT) MD for 100 ps of minimization and thermalization followed by 300 ps of
equilibration.
The coupling and decoupling of leucine binding in LeuT was performed in a bi-
directional (forward/backward) alchemical transformation. A harmonic potential was
placed on the orientation, position, and conformation of the ligand binding to bias the
ligand-protein complex toward the bound state from the crystal structure (Figure 2.3).
Harmonic restraints were applied to the translation (𝑟, 𝜃, 𝜙) and the rotation (Θ,Φ, Ψ) of
the ligand with respect to the protein (Figure 1.13). The introduced restraining potentials
were used to maintain the position and orientation of the ligand around the adopted pose
in the bound complex. The restraining potentials are intended to help enhance
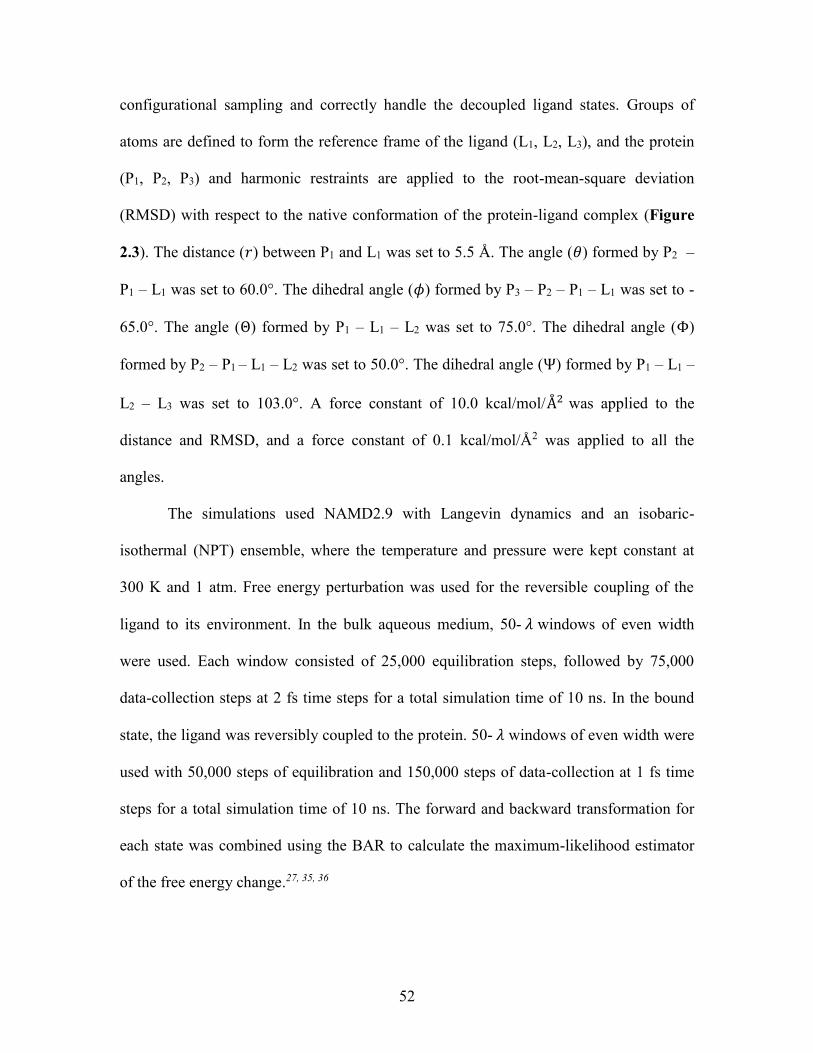
52
configurational sampling and correctly handle the decoupled ligand states. Groups of
atoms are defined to form the reference frame of the ligand (L1, L2, L3), and the protein
(P1, P2, P3) and harmonic restraints are applied to the root-mean-square deviation
(RMSD) with respect to the native conformation of the protein-ligand complex (Figure
2.3). The distance (𝑟) between P1 and L1 was set to 5.5 Å. The angle (𝜃) formed by P2 –
P1 – L1 was set to 60.0°. The dihedral angle (𝜙) formed by P3 – P2 – P1 – L1 was set to -
65.0°. The angle (Θ) formed by P1 – L1 – L2 was set to 75.0°. The dihedral angle (Φ)
formed by P2 – P1 – L1 – L2 was set to 50.0°. The dihedral angle (Ψ) formed by P1 – L1 –
L2 – L3 was set to 103.0°. A force constant of 10.0 kcal/mol/Å2 was applied to the
distance and RMSD, and a force constant of 0.1 kcal/mol/Å2 was applied to all the
angles.
The simulations used NAMD2.9 with Langevin dynamics and an isobaric-
isothermal (NPT) ensemble, where the temperature and pressure were kept constant at
300 K and 1 atm. Free energy perturbation was used for the reversible coupling of the
ligand to its environment. In the bulk aqueous medium, 50- 𝜆 windows of even width
were used. Each window consisted of 25,000 equilibration steps, followed by 75,000
data-collection steps at 2 fs time steps for a total simulation time of 10 ns. In the bound
state, the ligand was reversibly coupled to the protein. 50- 𝜆 windows of even width were
used with 50,000 steps of equilibration and 150,000 steps of data-collection at 1 fs time
steps for a total simulation time of 10 ns. The forward and backward transformation for
each state was combined using the BAR to calculate the maximum-likelihood estimator
of the free energy change.27, 35, 36

53
Figure 2.3: Reference frame defining the binding of leucine in LeuT (PDB entry 3F3A).
Groups of atoms are defined to form the reference frame of the ligand (L1, L2, L3) and the
protein (P1, P2, P3). Restraints are placed on the position (𝑟, P1-L1 distance; 𝜃, P1-P2-L1
angle; 𝜙, P3 – P2 – P1 – L1 dihedral angle) and the translation (Θ, P1 – L1 – L2 angle; Φ,
P1 – L1 – L2 – L3 dihedral angle; Ψ, P2 – P1 – L1 – L2 dihedral angle) of leucine (green)
with respect to LeuT (yellow), as well as restraints on its RMSD with respect to its
binding conformation.
Calculation of the free energy contributions was carried out in the framework of
thermodynamic integration (TI), within the collective variables (colvars) module of
NAMD, where the free energy change is determined with numerical integration methods.
The free energy contribution from the restraint potential acting on a collective variable
was determined alchemically, by decreasing the force constant in a stepwise fashion from
its nominal value to zero (similarly in the opposite direction using the coupling
parameter). The nominal value of the force constant (k) represents the value of the force

54
constant at 𝜆 = 1, i.e., 𝑘1. At 𝜆= 0, the force constant, 𝑘0, is equal to 0 kcal/mol/Å2. The
restraint potentials were scaled over 6 ns using 14 -𝜆 windows. For each value of 𝜆 and
for each defined collective variable, dG/d𝜆 was computed. The free energy contribution
due to the respective harmonic restraint is obtained by integrating the gradient profile.
This allowed for calculations of the individual contributions from the restraint potentials.
2.2.4 Free energy calculation of fluoxetine in SERT
The SERT homology model previously developed by Manepalli et al. was used
for all docking and free energy calculations performed in SERT. 37 R-fluoxetine was
docked into the S2 binding site of SERT using the induced fit protocol in MOE (Figure
2.4). Triangle Matcher was the docking placement method, London dG was the initial
scoring method, and the Amber10: EHT force field was used to refine the interactions.
GBVI/WSA dG was used as the final scoring method. A maximum of 30 poses was
retained during the docking simulations (with duplicates removed). The top-scoring pose
was selected for free energy calculations. The protein-ligand complex was used for
ABFE calculations following the protocol outlined by Jo et al. The CHARMM-GUI
Ligand Binder web server was used to generate the CHARMM input files used to
calculate the ABFE of R-fluoxetine in SERT (Figure 2.4). The force field for R-
fluoxetine and SERT were defined using CHARMM CGenFF v2b8.20, 22 Optimization
was not performed on force field parameters. The input files from Ligand Binder were
unmodified.
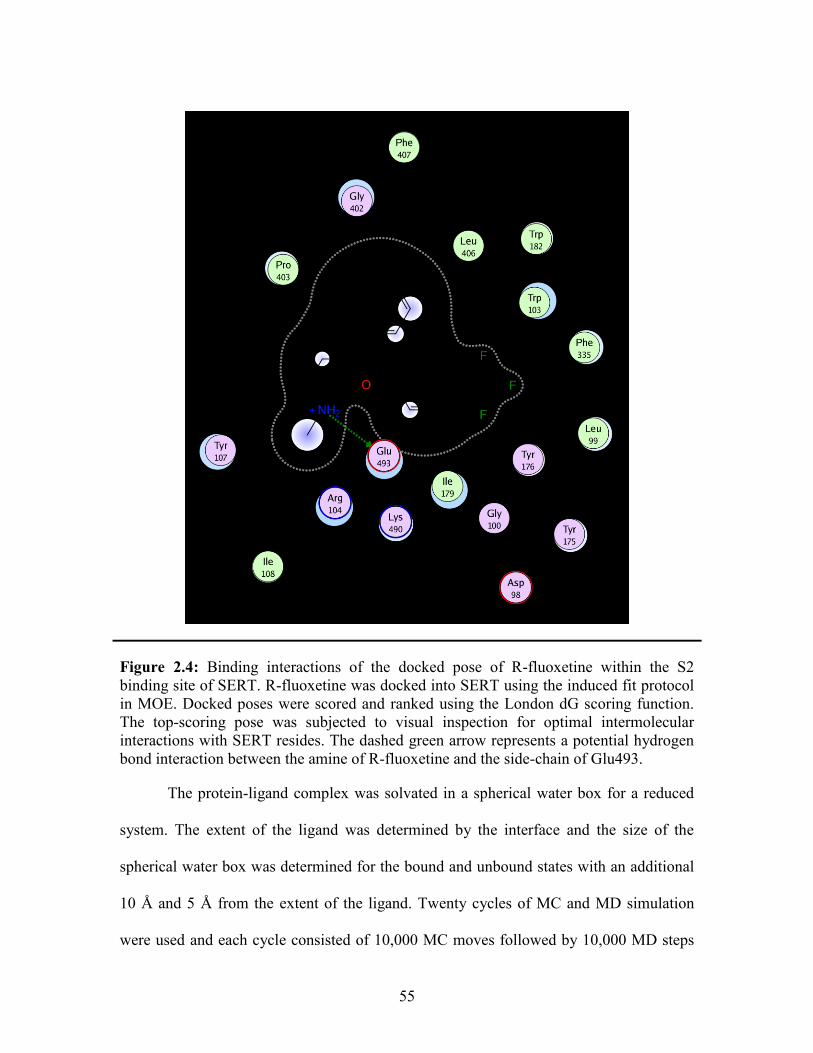
55
Figure 2.4: Binding interactions of the docked pose of R-fluoxetine within the S2
binding site of SERT. R-fluoxetine was docked into SERT using the induced fit protocol
in MOE. Docked poses were scored and ranked using the London dG scoring function.
The top-scoring pose was subjected to visual inspection for optimal intermolecular
interactions with SERT resides. The dashed green arrow represents a potential hydrogen
bond interaction between the amine of R-fluoxetine and the side-chain of Glu493.
The protein-ligand complex was solvated in a spherical water box for a reduced
system. The extent of the ligand was determined by the interface and the size of the
spherical water box was determined for the bound and unbound states with an additional
10 Å and 5 Å from the extent of the ligand. Twenty cycles of MC and MD simulation
were used and each cycle consisted of 10,000 MC moves followed by 10,000 MD steps

56
with a 2 fs time step to hydrate and equilibrate the inner regions. A harmonic restraint
potential with a force constant of 5.0 kcal/ (mol·Å2) was applied to the protein and the
ligand molecule throughout the MD simulations. The simulations were carried out using
Langevin dynamics at 300 K with a friction coefficient of 5 ps−1 assigned to all non-
hydrogen atoms. Then the protein−ligand complex was equilibrated for 200 ps at 300 K
using Langevin dynamics without the positional harmonic restraint. The anchoring atoms
for defining the protein-ligand translational and orientational restraints were chosen
automatically by the Ligand Binder Web server. The procedure for assigning the
anchoring atoms are detailed by Jo et al.30 The last 190 ps of equilibration was used to
calculate the average reference distances, angles, and dihedrals for the
translational/orientational restraints. The averaged and minimized ligand structure was
used as the reference configuration for the conformational restraint. In the bulk solvent,
the ligand molecule was equilibrated for 200 ps at 300 K using the SSBP and Langevin
dynamics.
The free energies associated with restriction of the ligand conformation to the
reference conformation (∆𝐺𝑐𝑜𝑛𝑓 ), restriction of the ligand orientation and translation
(∆𝐺𝑡,𝑟), and interactions with surrounding environments (∆𝐺𝑖𝑛𝑡) were calculated with
FEP/MD simulations. The FEP/MD simulations were divided into 137 independent
windows. The conformational free energies (∆ 𝐺𝑐𝑜𝑛𝑓𝑠𝑖𝑡𝑒 and ∆𝐺𝑐𝑜𝑛𝑓
ℎ𝑦𝑑𝑟) associated with
restricting the ligand conformation in the bound state was estimated by calculating the
potential of mean force (PMF) as a function of ligand RMSD using umbrella sampling
simulations.30 Twenty-one biasing windows were used with the RMSD offset value from
0.0 to 5.0 Å in steps of 0.25 Å. Each window was simulated using a force constant of 10

57
kcal/(mol·Å2) for 110 ps. Then the perturbation energies associated with the bound and
unbound was calculated.
2.2.5 Free energy calculation of SM11 in SERT
SM11 was docked into the S1 and S2 pockets of SERT using an induced fit
docking protocol with the MOE software (v2013.0802) (Figure 2.5, Figure 2.6).3
Triangle Matcher was the docking placement method, London dG was the initial scoring
method, and the Amber10: EHT force field was used to refine the interactions.
GBVI/WSA dG was used as the final scoring method. A maximum of 30 poses was
retained during the docking simulations (with duplicates removed). The top-scoring pose
was subjected to visual inspection for optimal intermolecular interactions with SERT
residues. One pose in S1 was found to bind with similar orientation to the pharmacophore
developed based on the proposed binding in MAT crystal structures (Figure 2.6).38 The
final docked binding pose of SM11 in SERT overlapped with the binding of the S-
citalopram molecule in the S2 site of the crystal structure of SERT (Figure 2.5).39
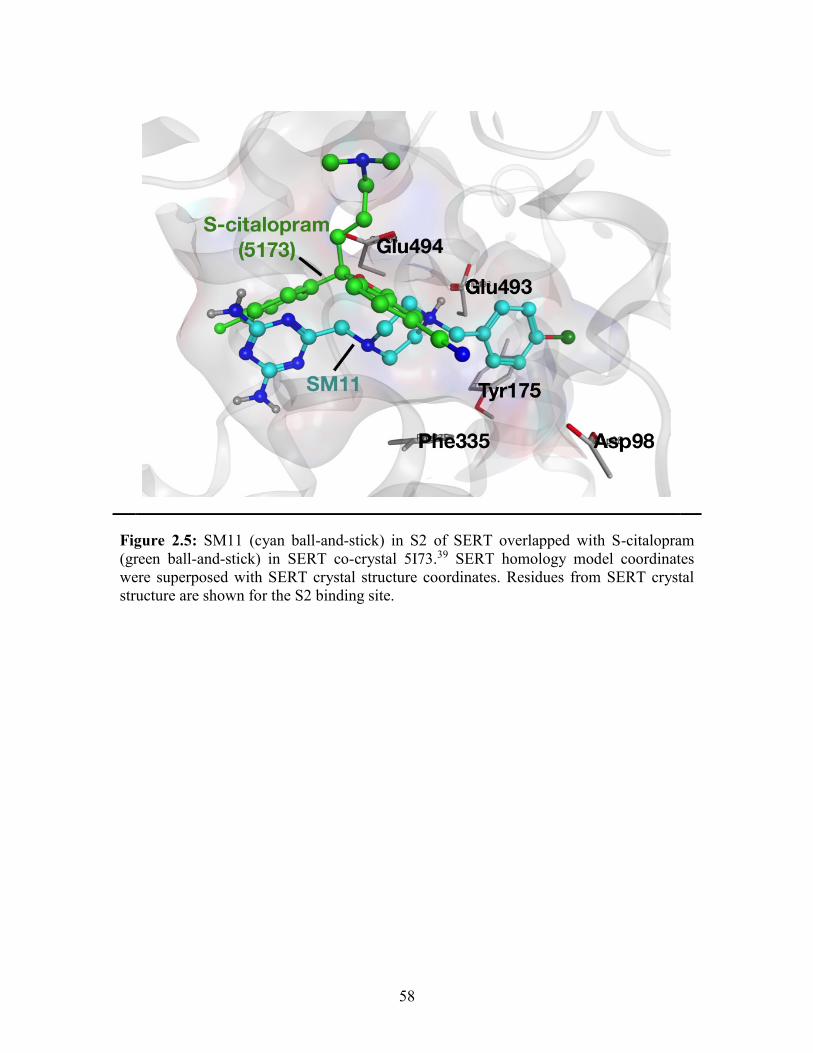
58
Figure 2.5: SM11 (cyan ball-and-stick) in S2 of SERT overlapped with S-citalopram
(green ball-and-stick) in SERT co-crystal 5I73.39 SERT homology model coordinates
were superposed with SERT crystal structure coordinates. Residues from SERT crystal
structure are shown for the S2 binding site.

59
Figure 2.6: SM11 (cyan ball-and-stick) in S1 of SERT. S1 residues are colored in yellow
sticks and S2 residues are colored in green sticks. Color spheres represent pharmacophore
features used to dock SM11 in S1 with MOE.3 F1: Donor (green), F2: Acceptor
(magenta), and F3: Acceptor (magenta) each with a radius of 1 Å.
The Nanoscale Molecular Dynamics (NAMD) program (v2.9b1) was used for
performing the free energy calculations.26 The Langevin dynamics was used with an
isobaric-isothermal ensemble (NPT), where the temperature and pressure were kept
constant at 300 K and 1 atm. Free energy perturbation (FEP) was used for the reversible
coupling of the ligand with its environment in the bound and unbound state. During the

60
alchemical transformation in the bound state, several harmonic restraints were placed on
the ligand to prevent deviation from the binding pocket once the electrostatic and vdW
interactions were turned off.6, 32, 40, 41 Groups of heavy atoms were defined to form the
reference frame of the ligand (L1, L2, L3) and the protein (P1, P2, P3). For the ligand, the
methylene bridge connecting the 4-chlorobenzyl to the 6-4-piperazine, and the 6-4-
piperazine to the 1,3,5-triazine-2,4-diamine were used to define L1, and L2. L3 was
defined by the cyclic amine at the 1-position of the 1,3,5-triazine-2,4-diamine. For the
protein, the center of mass for the backbone atoms (C𝛼 , N, O) of residues Phe335,
Tyr175, Tyr176 were used to define P1, P2, P3, respectively. Harmonic restraints were
applied on the position (𝑟, 𝜃, 𝜙), and the translation (Θ,Φ, Ψ) of the ligand with respect to
the protein (Figure 2.7). Harmonic restraints were also applied on the ligand RMSD with
respect to the native conformation in the protein-ligand complex. The distance ( 𝑟 )
between P1 and L1 was set to 5.5 Å. The angle (𝜃) formed by P2 – P1 – L1 was set to
42.0°. The dihedral angle (𝜙) formed by P3 – P2 – P1 – L1 was set to 111.0°. The angle
(Θ) formed by P1 – L1 – L2 was set to 31.0°. The dihedral angle (Φ) formed by P2 – P1 –
L1 – L2 was set to -111.0°. The dihedral angle (Ψ) formed by P1 – L1 – L2 – L3 was set to
-32.0°. A force constant of 10.0 kcal/mol/Å2 was applied to the distance and RMSD, and
a force constant of 0.1 kcal/mol/Å2 was applied to all the angles. The free energies
associated with the translational, rotational ( ∆∆𝐺𝑡,𝑟 ) and conformational ( ∆∆𝐺𝑐𝑜𝑛𝑓 )
restraints were calculated for contribution to the standard binding free energy of the
ligand to the protein.30 Calculations were applied in the bound state of ligand interacting
in the protein binding pocket as well as in the unbound state of the ligand interacting in
bulk aqueous solvent.
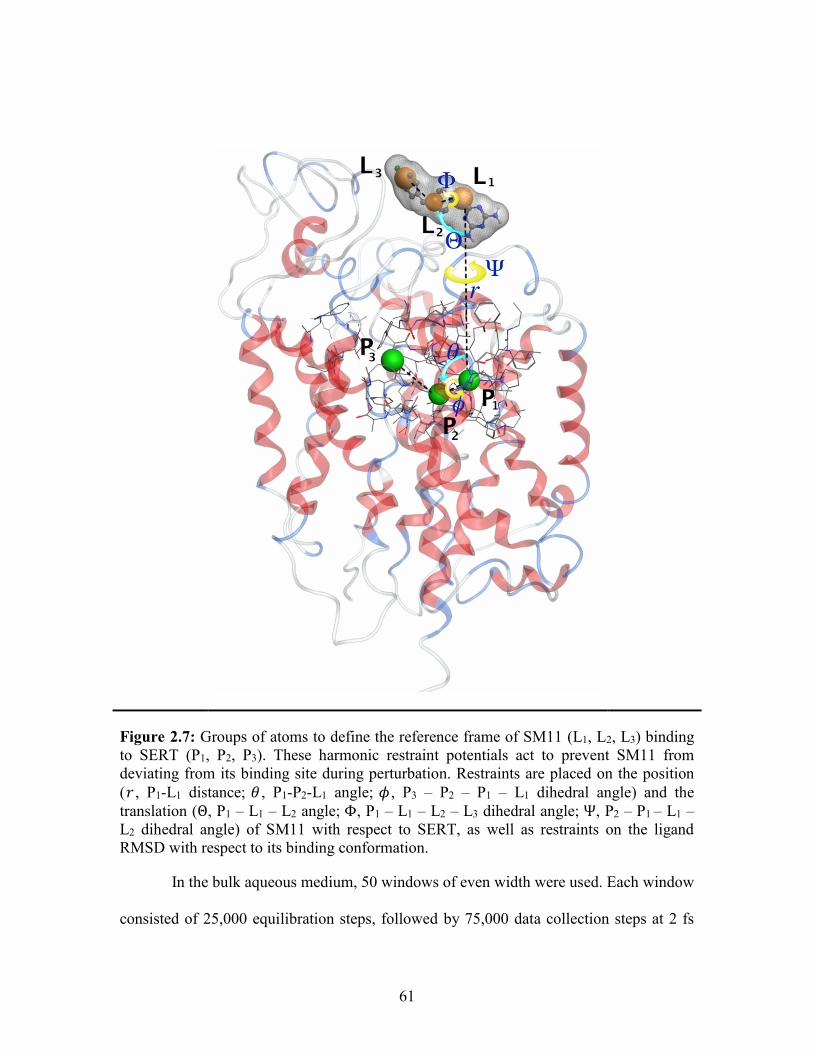
61
Figure 2.7: Groups of atoms to define the reference frame of SM11 (L1, L2, L3) binding
to SERT (P1, P2, P3). These harmonic restraint potentials act to prevent SM11 from
deviating from its binding site during perturbation. Restraints are placed on the position
(𝑟 , P1-L1 distance; 𝜃 , P1-P2-L1 angle; 𝜙 , P3 – P2 – P1 – L1 dihedral angle) and the
translation (Θ, P1 – L1 – L2 angle; Φ, P1 – L1 – L2 – L3 dihedral angle; Ψ, P2 – P1 – L1 –
L2 dihedral angle) of SM11 with respect to SERT, as well as restraints on the ligand
RMSD with respect to its binding conformation.
In the bulk aqueous medium, 50 windows of even width were used. Each window
consisted of 25,000 equilibration steps, followed by 75,000 data collection steps at 2 fs
62
time steps for a total simulation time of 10 ns. In the bound state, the ligand was
reversibly coupled to the protein. 50 windows of even width were used with 50,000 steps
of equilibration and 150,000 steps of data collection at 1 fs time steps for a total
simulation time of 10 ns. The bidirectional transformation was performed for both the
bound and unbound states, where the data for the coupling and decoupling of the ligand
were combined using the Bennett acceptance ratio (BAR) to calculate the maximum-
likelihood estimate of the free energy change.27
The Ligand Binder web server was also used to generate CHARMM input files
for calculating the absolute binding free energy of SM11 in SERT with harmonic
restraints placed on the ligand.14, 18, 30 The CHARMM input files generated by Ligand
Binder were not modified.
2.2.6 Measuring the affinity of SERT inhibitors
Stably-transfected human embryonic kidney (HEK)-293-hSERT cells were
previously prepared in collaboration with Dr. Mads Larsen and Dr. Susan Amara
(University of Pittsburgh, Pittsburgh, PA).37 The HEK293-hSERT were incubated at 37
℃ in a 5% CO2 environment. Once the cells reached approximately 90% confluence, the
culture was washed with 10 mL cold phosphate-buffered saline (DPBS) before being
scraped from the culture plates and transferred to 15 mL culture tubes. The solution was
centrifuged at low speed (700 g) for 10 min. The supernatant was removed and 500 µL
cold TE buffer (50 mM Tris, pH 7.5, 1mM EDTA) was added to the cell pellet for
resuspension. Homogenate was transferred to cold 1.5 mL microcentrifuge tubes and
centrifuged at 100 000g at 4 °C for 30 min (Sorvall Discovery M150 centrifuge). The
63
supernatant was discarded, and the pellet was resuspended in cold binding buffer (50 mM
Tris, pH 7.5, 100 mM NaCl) for competitive membrane binding.
The competitive membrane binding assay was used to measure the affinity of
citalopram, SM11 and SM11 analogs (BJ11, BJ12, BJ13, and BJ14) for SERT. SM11
and BJ11 were purchased from Enamine.37 BJ12, BJ13, and BJ14 were synthesized by
Dr. Robert B. Lettan II (Chatham University). The affinity for SERT was determined by
the ligand’s ability to displace [125I]-RTI-55, a radiolabeled cocaine analog with high-
affinity for SERT, from binding to SERT as a function of increasing concentrations of the
non-radioactive drug. Increasing concentrations of citalopram (10 µM to 1 nM), SM11
and SM11 analogs (1 nM to 1 mM) were used for the binding assays, which were
performed in triplicate (n=3). [125I]-RTI-55 inhibition was measured using a gamma-
radiation counter to measure how much of [125I]-RTI-55 was present at different
concentrations of the non-radioactive drugs. [125I]-RTI-55 was purchased from
PerkinElmer (Foster City, CA).42
The membranes were placed in solution with 0.1 nM concentration of [125I]-RTI-
55. A serial dilution of non-radioactive drugs was added to the membrane solution.
Paroxetine at 10 µM concentration was used to measure nonspecific binding. The
solutions were incubated at room temperature for one hour with gentle shaking followed
by filtration through GF/B filters (presoaked in 0.5% polyethyleneimine solution (v/v)).
A Beckman gamma counter was used to measure the presence of [125I]-RTI-55 to
determine how much citalopram was able to compete with radioligand binding. The
measured affinity (𝐾𝑖) was analyzed using GraphPad Prism 5.0. The 𝐾𝑖 of the inhibitor
was determined using the Cheng-Prusoff equation,

64
𝐾𝑖 =
𝐼𝐶50
1 + [[125I] − RTI − 55]
𝐾𝑑
(2.1)
where 𝐼𝐶50 is the inhibitor concentration required to displace 50% of the radioligand,
[[125I]-RTI-55] is the radioligand concentration, and 𝐾𝑑 is the dissociation constant of the
radioligand.
2.3 References
1. Yamashita, A., Singh, S. K., Kawate, T., Jin, Y., and Gouaux, E. (2005) Crystal
structure of a bacterial homologue of Na+/Cl--dependent neurotransmitter transporters.
Nature 437, 215-223.
2. Berman, H. M., Battistuz, T., Bhat, T. N., Bluhm, W. F., Bourne, P. E., Burkhardt, K.,
Feng, Z., Gilliland, G. L., Iype, L., Jain, S., Fagan, P., Marvin, J., Padilla, D.,
Ravichandran, V., Schneider, B., Thanki, N., Weissig, H., Westbrook, J. D., and
Zardecki, C. (2002) The Protein Data Bank. Acta Crystallogr D Biol Crystallogr 58, 899-
907.
3. MOE (The Molecular Operating Environment). (2017) 2015.08 ed., Chemical
Computing Group Inc., 1010 Sherbrooke St. W, Suite 910 Montreal, Quebec, Canada
H3A 2R7.
4. Gedeon, P. C., et al. (2010) Molecular dynamics of leucine and dopamine transporter
proteins in a model cell membrane lipid layer. Proteins 78, 797-811.
5. Indarte, M., Madura, J. D., and Surratt, C. K. (2008) Dopamine transporter
comparative molecular modeling and binding site prediction using the LeuT(Aa) leucine
transporter as a template. Proteins 70, 1033-1046.
6. Wang, J., Cieplak, P., and Kollman, P. A. (2000) How well does a restrained
electrostatic potential (RESP) model perform in calculating conformational energies of
organic and biological molecules? J Comput Chem 21, 1049-1074.
7. W Dalke, A., and Schulten, K. (1996) VMD: Visual Molecular Dynamics. J Mol
Graph 14, 33-38, 27-38.
8. Essmann, U., Perera, L., Berkowitz, M. L., Darden, T., Lee, H., and Pedersen, L. G.
(1995) A smooth particle mesh Ewald method. J Chem Phys 103, 8577-8593.

65
9. Krishnamurthy, H., and Gouaux, E. (2012) X-ray structures of LeuT in substrate-free
outward-open and apo inward-open states. Nature 481, 469-474.
10. Penmatsa, A., Wang, K. H., and Gouaux, E. (2013) X-ray structure of dopamine
transporter elucidates antidepressant mechanism. Nature 503, 85-90.
11. Pramod, A. B., Foster, J., Carvelli, L., and Henry, L. K. (2013) SLC6 transporters:
structure, function, regulation, disease association and therapeutics. Mol Aspects Med 34,
197-219.
12. Forrest, L. R., Tavoulari, S., Zhang, Y. W., Rudnick, G., and Honig, B. (2007)
Identification of a chloride ion binding site in Na+/Cl -dependent transporters. Proc Natl
Acad Sci U S A 104, 12761-12766.
13. Jo, S., Kim, T., and Im, W. (2007) Automated builder and database of
protein/membrane complexes for molecular dynamics simulations. PLoS One 2, e880.
14. Jo, S., Kim, T., Iyer, V. G., and Im, W. (2008) CHARMM-GUI: a web-based
graphical user interface for CHARMM. J Comput Chem 29, 1859-1865.
15. Jo, S., Lim, J. B., Klauda, J. B., and Im, W. (2009) CHARMM-GUI Membrane
Builder for mixed bilayers and its application to yeast membranes. Biophys J 97, 50-58.
16. Klauda, J. B., Venable, R. M., Freites, J. A., O'Connor, J. W., Tobias, D. J.,
Mondragon-Ramirez, C., Vorobyov, I., MacKerell, A. D., Jr., and Pastor, R. W. (2010)
Update of the CHARMM all-atom additive force field for lipids: validation on six lipid
types. J Phys Chem B 114, 7830-7843.
17. Wu, E. L., Cheng, X., Jo, S., Rui, H., Song, K. C., Davila-Contreras, E. M., Qi, Y.,
Lee, J., Monje-Galvan, V., Venable, R. M., Klauda, J. B., and Im, W. (2014) CHARMM-
GUI Membrane Builder toward realistic biological membrane simulations. J Comput
Chem 35, 1997-2004.
18. Lee, J., Cheng, X., Swails, J. M., Yeom, M. S., Eastman, P. K., Lemkul, J. A., Wei,
S., Buckner, J., Jeong, J. C., Qi, Y., Jo, S., Pande, V. S., Case, D. A., Brooks, C. L., 3rd,
MacKerell, A. D., Jr., Klauda, J. B., and Im, W. (2016) CHARMM-GUI Input Generator
for NAMD, GROMACS, AMBER, OpenMM, and CHARMM/OpenMM Simulations
Using the CHARMM36 Additive Force Field. J Chem Theory Comput 12, 405-413.
19. Jorgensen, W. L., Chandrasekhar, J., Madura, J. D., Impey, R. W., and Klein, M. L.
(1983) Comparison of simple potential functions for simulating liquid water. J Chem
Phys 79, 926-935.
20. Vanommeslaeghe, K., Hatcher, E., Acharya, C., Kundu, S., Zhong, S., Shim, J.,
Darian, E., Guvench, O., Lopes, P., Vorobyov, I., and Mackerell, A. D., Jr. (2010)
66
CHARMM general force field: A force field for drug-like molecules compatible with the
CHARMM all-atom additive biological force fields. J Comput Chem 31, 671-690.
21. Best, R. B., Zhu, X., Shim, J., Lopes, P. E., Mittal, J., Feig, M., and Mackerell, A. D.,
Jr. (2012) Optimization of the additive CHARMM all-atom protein force field targeting
improved sampling of the backbone phi, psi and side-chain chi(1) and chi(2) dihedral
angles. J Chem Theory Comput 8, 3257-3273.
22. Yu, W., He, X., Vanommeslaeghe, K., and MacKerell, A. D., Jr. (2012) Extension of
the CHARMM General Force Field to sulfonyl-containing compounds and its utility in
biomolecular simulations. J Comput Chem 33, 2451-2468.
23. Kollman, P. (1993) Free energy calculations: Applications to chemical and
biochemical phenomena. Chem Rev 93, 2395-2417.
24. Miyamoto, S., and Kollman, P. A. (1993) Absolute and relative binding free energy
calculations of the interaction of biotin and its analogs with streptavidin using molecular
dynamics/free energy perturbation approaches. Proteins 16, 226-245.
25. Jorgensen, W. L., and Ravimohan, C. (1985) Monte Carlo simulation of differences
in free energies of hydration. J Chem Phys 83, 3050-3054.
26. Phillips, J. C., Braun, R., Wang, W., Gumbart, J., Tajkhorshid, E., Villa, E., Chipot,
C., Skeel, R. D., Kale, L., and Schulten, K. (2005) Scalable molecular dynamics with
NAMD. J Comput Chem 26, 1781-1802.
27. Bennett, C. H. (1976) Efficient estimation of free energy differences from Monte
Carlo data. J Comp Phys 22, 245-268.
28. Liu, P., Dehez, F., Cai, W., and Chipot, C. (2012) A Toolkit for the Analysis of Free-
Energy Perturbation Calculations. J Chem Theory Comput 8, 2606-2616.
29. Hénin, J., Harrison, C., and Chipot, C. (2012) In Silico alchemy: A tutorial for
alchemical free-energy perturbation calculations with NAMD.
30. Jo, S., Jiang, W., Lee, H. S., Roux, B., and Im, W. (2013) CHARMM-GUI Ligand
Binder for Absolute Binding Free Energy Calculations and Its Application. J Chem Inf
Model 53, 267-277.
31. Im, W., Beglov, D., and Roux, B. (1998) Continuum Solvation Model: computation
of electrostatic forces from numerical solutions to the Poisson-Boltzmann equation.
Computer Physics Communications 111, 59-75.
32. Gumbart, J. C., Roux, B., and Chipot, C. (2013) Standard binding free energies from
computer simulations: What is the best strategy? J Chem Theory Comput 9, 794-802.
67
33. Singh, S. K., Piscitelli, C. L., Yamashita, A., and Gouaux, E. (2008) A competitive
inhibitor traps LeuT in an open-to-out conformation. Science 322, 1655-1661.
34. Mackerell, A. D., Jr., Feig, M., and Brooks, C. L., 3rd. (2004) Extending the
treatment of backbone energetics in protein force fields: limitations of gas-phase quantum
mechanics in reproducing protein conformational distributions in molecular dynamics
simulations. J Comput Chem 25, 1400-1415.
35. Shirts, M. R., and Chodera, J. D. (2008) Statistically optimal analysis of samples
from multiple equilibrium states. J Chem Phys 129, 124105.
36. Mobley, D. L., and Klimovich, P. V. (2012) Perspective: Alchemical free energy
calculations for drug discovery. J Chem Phys 137, 230901.
37. Manepalli, S., Geffert, L. M., Surratt, C. K., and Madura, J. D. (2011) Discovery of
novel selective serotonin reuptake inhibitors through development of a protein-based
pharmacophore. J Chem Inf Model 51, 2417-2426.
38. Zhou, Z., Zhen, J., Karpowich, N. K., Goetz, R. M., Law, C. J., Reith, M. E. A., and
Wang, D.-N. N. (2007) LeuT-desipramine structure reveals how antidepressants block
neurotransmitter reuptake. Science 317, 1390-1393.
39. Coleman, J. A., Green, E. M., and Gouaux, E. (2016) X-ray structures and
mechanism of the human serotonin transporter. Nature 532, 334-339.
40. Gumbart, J. C., Roux, B., and Chipot, C. (2013) Efficient determination of protein-
protein standard binding free energies from first principles. J Chem Theory Comput 9,
3789−3798.
41. Wang, J., Deng, Y., and Roux, B. (2006) Absolute binding free energy calculations
using molecular dynamics simulations with restraining potentials. Biophys J 91, 2798-
2814.
42. Manepalli, S., Surratt, C. K., Madura, J. D., and Nolan, T. L. (2012) Monoamine
transporter structure, function, dynamics, and drug discovery: a computational
perspective. AAPS J 14, 820-831.

68
CHAPTER 3
3 MODELING THE BINDING OF DAT INHIBITORS IN
DISCRETE DAT CONFORMATIONS
3.1 Introduction
The recreational psychostimulant cocaine inhibits dopamine reuptake from the
synapse, resulting in excessive stimulation of postsynaptic dopamine receptors in brain
areas associated with reward and addiction.1 Cocaine binds to and stabilizes the outward-
(extracellular-) facing conformation of the dopamine transporter (DAT) protein, while the
low abuse potential DAT inhibitor benztropine prefers the inward- (cytoplasmic-) facing
conformation (Figure 3.1). A correlation has been previously postulated between
psychostimulant abuse potential and preference for the outward-facing DAT
conformation.2

69
Figure 3.1: A) The outward- (extracellular-) facing (OF) conformation of the dopamine
transporter (DAT) protein and B) the inward- (cytoplasmic-) facing (IF) conformation.
OF DAT and IF DAT structures are expected to have different intramolecular
interactions. For example, the salt bridge interaction between D475 and R85 is
destabilized in the OF conformation and stabilized in the IF conformation. Regions
highlighted in blue represent the pathway allowing access to the central binding site from
either the extracellular pathway or the internally open intracellular pathway for the
outward-facing or inward-facing conformation.
The phenylpiperazine groups have been related to the reward effects of DAT
inhibitors such as cocaine,3 while a diphenylether moiety is a feature of the less abusable
DAT inhibitor benztropine and its analogs (Figure 1.4).4 However, the 3𝛽-aryltropane
cocaine analogs LX10 and LX11 (Figure 1.6), differing only in stereochemistry and
sharing a preference for the outward-facing DAT, are reported to vary widely in abuse
potential in an animal model.5 Furthermore, LX10 has 10-fold greater affinity than LX11
(Table 3.1). In search of the molecular basis for DAT conformation preference,
complexes of cocaine, benztropine, LX10 or LX11 bound to each DAT conformation
were subjected to 100 ns of all-atom molecular dynamics simulation. Computational
methods were employed to detect subtle differences in binding of LX10 and LX11 to the

70
OF DAT. Results were consistent with previous findings from cysteine accessibility
assays used to assess an inhibitor’s DAT conformation preference.5
The binding interactions between the inhibitors and DAT were examined and
structural analysis of the protein-ligand system revealed distinct differences in the
binding of the LX10 and LX11 in the outward-facing conformation. The respective 2𝛽-
and 2 𝛼 -substituted phenyltropanes of LX10 and LX11 interacted with hydrophobic
regions of the DAT S1 binding site that were inaccessible to cocaine. Solvent
accessibility measurements also revealed subtle differences in inhibitor positioning
within a given DAT conformation. This work serves to advance our understanding of the
conformational selectivity of DAT inhibitors and suggests that MD may be useful in
antipsychostimulant therapeutic design.
Table 3.1: DAT affinity 𝐾𝑖 values (mean ± s.e.m.) for cocaine and two 3𝛽-aryltropane
analogs.5 Affinity measured for DAT obtained by displacement of the cocaine analog
radioligand [3H]-WIN 35,428.
Compound DAT 𝑲𝒊 (nM)
Cocaine 98 ± 6.6
LX10 19 ± 0.2
LX11 352 ± 44
3.2 Results and Discussion
All-atom MD simulations were performed to evaluate the binding of four DAT
inhibitors that have been shown through cysteine accessibility assays to stabilize
particular DAT conformations.5 Previous studies of DAT conformations after 35 ns MD
suggested that cocaine, LX10 and LX11 prefer the OF DAT conformation and BZT
prefers the IF DAT conformation.5 The present study examines differences in the OF
DAT conformations of the four inhibitors after 100 ns MD.

71
This work began prior to the availability of the cocaine-Drosophila DAT (dDAT)
co-crystal 4XP4;6 thus, the cocaine-bound OF rat DAT (rDAT) homology model was
superposed with the 4XP4 coordinates (Figure 3.2) to ensure that the present system was
experimentally relevant.6 Furthermore, the rDAT homology model was used instead of
the hDAT because the pharmacological assays performed by Hong et al. were conducted
in the rat.5 The rat and human amino acids sequences are 92% conserved,7 and identical
with respect to the S1 binding site.
Figure 3.2: PDB coordinates of the Drosophila DAT co-crystalized with cocaine (cyan),6
superposed with the rat DAT homology model bound to cocaine (red). Essential S1
pocket side chains are annotated and color-coordinated with the ligand for a given model.
The RMSD (Figure 3.3) and RMSF (Figure 3.4) were measured for the backbone
atoms of DAT after 100 ns of MD to assess the stability of the system. Additionally, the
key residues that are in the binding site were inspected for comparison. For the cocaine-
bound OF DAT, a cocaine-D79 (TM1) residue ion pair was observed, as was a shift in

72
the TM3 – TM8 extracellular gate residue pair Y156-F319 characteristic of the outward-
occluded conformation.8 Although the D79-Y156 distance is reported to be too large for a
hydrogen bond interaction,9 100 ns of MD indicated a stable H-bond (Figure 3.5). In the
dDAT co-crystal, cocaine was found to have a face-to-edge interaction with F325 (TM6);
however, after 100 ns of MD the F325 side chain had disengaged from cocaine (Figure
3.2). Overall, the rDAT homology model was sufficient to reproduce the experimentally
determined binding orientation of cocaine in OF dDAT.6
RMSD was measured after minimization for 100 ns of MD for each DAT-
inhibitor system (Figure 3.3). The initial structure of cocaine bound to OF DAT was used
as a reference structure for measurements in the OF conformation. The RMSD measured
in IF DAT was made with reference to the initial structure of BZT bound to DAT. The
movement of the inhibitors in the binding site was evaluated in OF and IF DAT after
each system was aligned to DAT TM1-12.

73
Figure 3.3: RMSD measured for each DAT-inhibitor system after 100 ns MD. A) RMSD
measured in OF DAT with initial structure of cocaine bound to DAT was used as a
reference structure for measurements. B) RMSD measured in IF DAT with initial
structure of BZT bound to DAT was used as a reference structure for measurements. C-
D) Ligand RMSD in OF and IF DAT binding site.
The RMSF of the protein residues in OF and IF DAT were measured for each
inhibitor-bound complex (Figure 3.4). The extracellular and intracellular loops are
expected to experience greater fluctuation than the transmembrane (TM) helices.
Cocaine, benztropine, and LX10 share similar fluctuation in the respective OF and IF
conformations. The binding of LX11 indicates there is greater stability of TM2, TM4,
TM6, TM8 and TM10.

74
Figure 3.4: RMSF measured for C𝛼 of DAT inhibitor-bound OF and IF conformations.
E) BZT; F) COC; G) LX10; H) LX11. Black lines represent inhibitors bound in IF DAT
superposed with the respective inhibitors bound systems in OF DAT.
For OF DAT, D79 - Y156 separation was greater than 4 Å, indicating a loss of
interaction. At t=85 ns, however, the interaction formed intermittently. For IF DAT, D79
- Y156 separation was less than 3.5 A, suggesting an interaction. At t=50 ns, fluctuations
appeared in this distance, and at t=80 ns, an interaction was no longer observed. For
cocaine and BZT OF and IF DAT complexes, the D79-Y156 interaction was stable
throughout the 100 ns simulation. A slight fluctuation was seen in the LX11-bound IF
DAT. In the IF DAT-LX10 complex, the interaction was lost at t=30 ns.
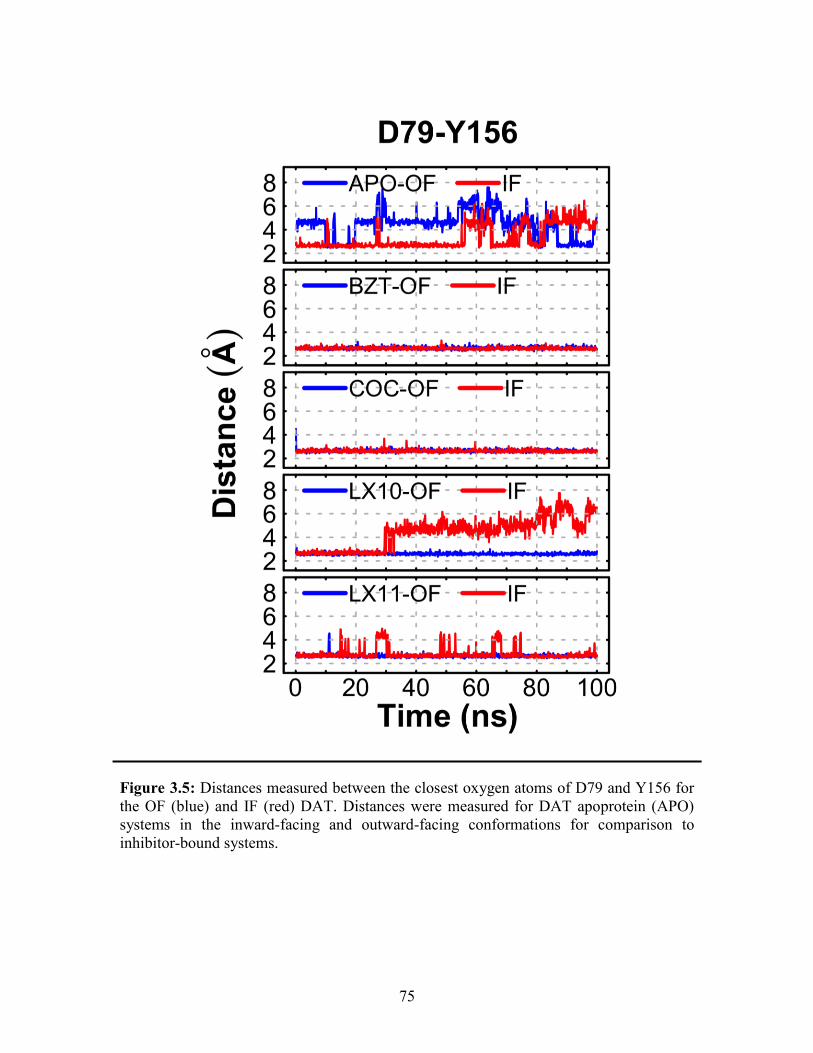
75
Figure 3.5: Distances measured between the closest oxygen atoms of D79 and Y156 for
the OF (blue) and IF (red) DAT. Distances were measured for DAT apoprotein (APO)
systems in the inward-facing and outward-facing conformations for comparison to
inhibitor-bound systems.
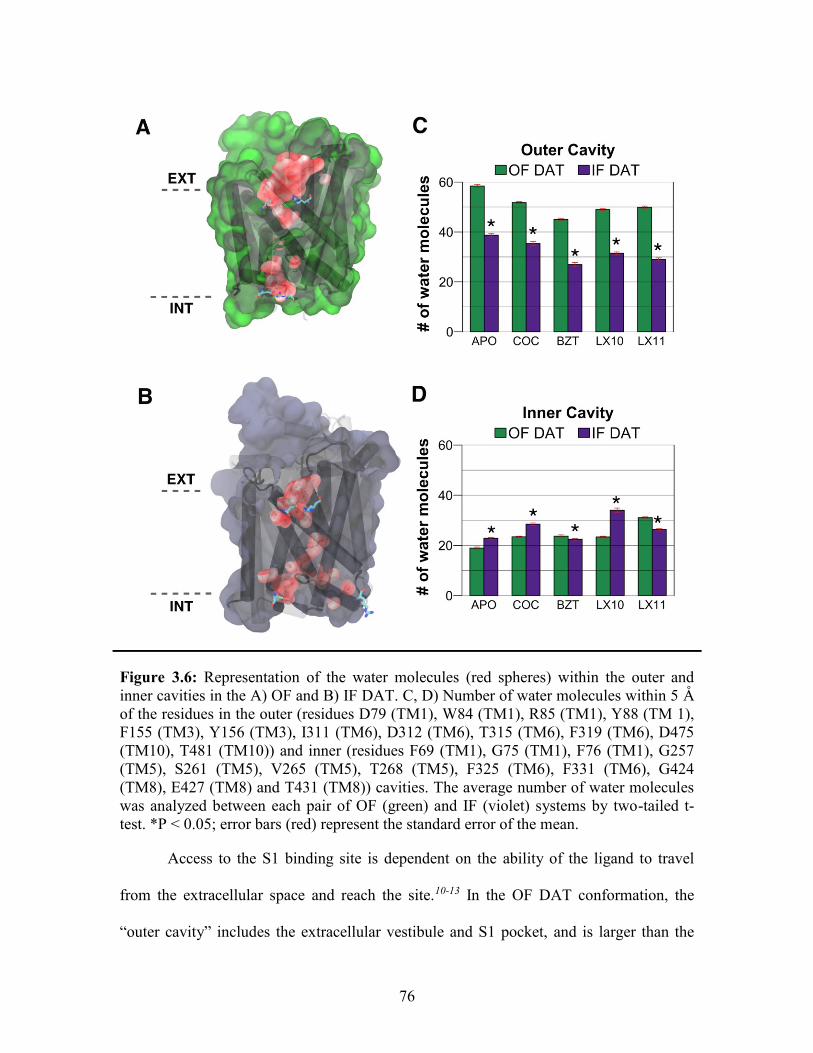
76
Figure 3.6: Representation of the water molecules (red spheres) within the outer and
inner cavities in the A) OF and B) IF DAT. C, D) Number of water molecules within 5 A
of the residues in the outer (residues D79 (TM1), W84 (TM1), R85 (TM1), Y88 (TM 1),
F155 (TM3), Y156 (TM3), I311 (TM6), D312 (TM6), T315 (TM6), F319 (TM6), D475
(TM10), T481 (TM10)) and inner (residues F69 (TM1), G75 (TM1), F76 (TM1), G257
(TM5), S261 (TM5), V265 (TM5), T268 (TM5), F325 (TM6), F331 (TM6), G424
(TM8), E427 (TM8) and T431 (TM8)) cavities. The average number of water molecules
was analyzed between each pair of OF (green) and IF (violet) systems by two-tailed t-
test. *P < 0.05; error bars (red) represent the standard error of the mean.
Access to the S1 binding site is dependent on the ability of the ligand to travel
from the extracellular space and reach the site.10-13 In the OF DAT conformation, the
“outer cavity” includes the extracellular vestibule and S1 pocket, and is larger than the

77
“inner cavity” delineated by the internal gate residues. The two external gate residue pairs
R85-D475 and Y156-F319, when disrupted, allow accessibility to the S1 pocket from the
extracellular space. In contrast, the IF DAT intact external gate interactions and
disruption of the internal gate residue pair R60-D435 yield an internally open cavity that
reaches into S1.10-13 Thus, the hydration of the outer and inner cavities differs for the
outward- and inward-facing conformations (Figure 3.6).
The hydration of the two cavities was evaluated for the final 50 ns of MD. Outer
cavity hydration was greater for all OF DAT simulations than for IF DAT (Figure 3.6C).
The number of water molecules in the inner cavity was less for OF DAT than IF DAT in
the APO, cocaine and LX10 systems. Interestingly, the accumulation of water molecules
in the inner cavity for the BZT- and LX11-bound systems was greater in OF DAT than in
IF DAT (Figure 3.6D), which would suggest the binding of these ligands stabilizes a
DAT conformation that allows for increased solvation of the inner cavity.
Salt bridge side chain interactions for the external and internal gates were
evaluated to determine the accessibility of the binding site from the extracellular and
intracellular spaces (Figure 3.7A, Figure 3.7B). The distance was measured between the
residues comprising the extracellular (R85-D475) gate salt bridge (Figure 3.7A) as well
as the intracellular (R60-D435) gate salt bridge (Figure 3.7B). Interactions were
evaluated using the shortest distance measured between an arginine nitrogen atom and an
aspartic acid carboxylate oxygen. Distances greater than 3.5 A indicated loss of
interaction between the gating residues. Thus, for the IF DAT, one would expect to see
distances that are ≤ 3.5 A.
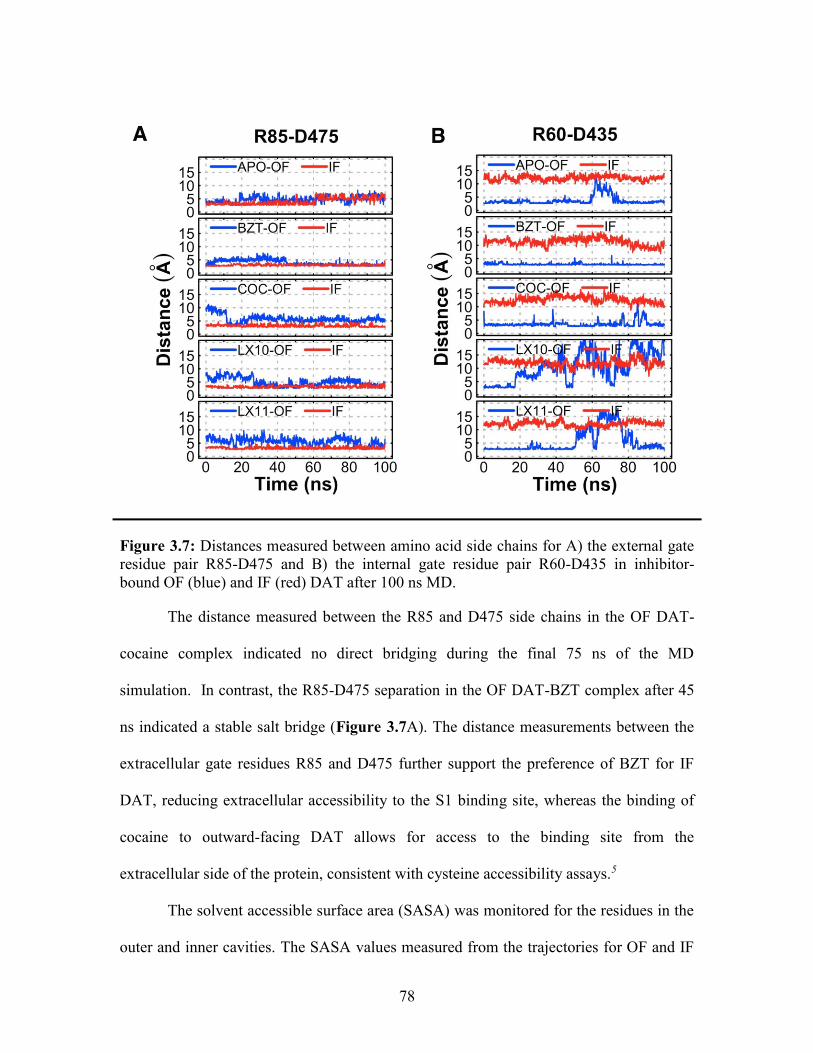
78
Figure 3.7: Distances measured between amino acid side chains for A) the external gate
residue pair R85-D475 and B) the internal gate residue pair R60-D435 in inhibitor-
bound OF (blue) and IF (red) DAT after 100 ns MD.
The distance measured between the R85 and D475 side chains in the OF DAT-
cocaine complex indicated no direct bridging during the final 75 ns of the MD
simulation. In contrast, the R85-D475 separation in the OF DAT-BZT complex after 45
ns indicated a stable salt bridge (Figure 3.7A). The distance measurements between the
extracellular gate residues R85 and D475 further support the preference of BZT for IF
DAT, reducing extracellular accessibility to the S1 binding site, whereas the binding of
cocaine to outward-facing DAT allows for access to the binding site from the
extracellular side of the protein, consistent with cysteine accessibility assays.5
The solvent accessible surface area (SASA) was monitored for the residues in the
outer and inner cavities. The SASA values measured from the trajectories for OF and IF
79
DAT conformations differed substantially and revealed details of which conformation
was being sampled with inhibitors bound (Figure 3.8C, Figure 3.8D).14, 15 SASA
measured in the defined outer cavity in the OF DAT conformation (Figure 3.8C, blue
lines) should offer a larger outer cavity, allowing for greater water penetration compared
to that of the IF DAT (Figure 3.8C, red lines). The SASAs of the inner cavity of OF and
IF DAT were measured to determine the extent of IF DAT and the intracellular
accessibility. The inner cavity is defined here by accessibility to the cytoplasm-proximate
residues previously determined to line the cytoplasmic half of the substrate permeation
pathway, plus the S1 pocket in the case of IF DAT (Figure 3.8D). A larger inner cavity is
expected for the IF DAT conformation (Figure 3.8D, red lines) relative to that of the OF
DAT conformation (Figure 3.8D, blue lines).

80
Figure 3.8: SASA measurements for OF DAT (blue) or IF DAT (red) after 100 ns
simulation for C) the outer cavity and D) the inner cavity.
In the BZT-bound system, the distance between R85 and D475 in OF DAT
decreased from approximately 5 A to 3.1 A during the last 50 ns of the simulation
(Figure 3.7A, blue line). There was also a decrease in SASA to an average value of 195
A2 at t=45 ns (Figure 3.8C, blue line). A similar SASA value was found for IF DAT.
This is an indication of reduced accessibility from the extracellular space and is
characteristic of the inward-facing conformation. The measured values in both OF and IF
DAT further support the expected binding of BZT to reduce external accessibility. The
distance measured between internal gate residues R60 and D435 in IF DAT was greater
than 10 A, indicating no salt bridge; however, in OF DAT the salt bridge remains intact
throughout the entire 100 ns.

81
Conversely, cocaine, LX10 and LX11 are expected to stabilize the outward-facing
conformation.5 In the OF DAT cocaine-bound system, there was a significant decrease
from 10 A to 3 A in the first 10 ns of the simulation, followed by an increase in the
distance between the residues during the last 50 ns. The distance averaged 5.3 A,
suggesting breakage of the external gate R85-D475 bridge (Figure 3.7A), whereas the
internal R60-D435 bridge was intact for OF DAT (Figure 3.7B).
The measured distance between R85-D475 in the LX10- and LX11-bound OF DAT
fluctuated mildly but fairly constantly. Notably, the LX10-DAT complex appeared to
allow the salt bridge to form starting at t=25 ns, which correlates with the loss of the
intracellular gate bridge R60-D435 (Figure 3.7A, Figure 3.7B, blue lines). The inter-
residue distance then fluctuates wildly for LX10 starting at approximately 18 ns, forming
intermittent interactions for the remainder of the simulation, whereas the distance
measured in IF DAT between R60 and D435 had stabilized. There are also measured
fluctuations for LX11-DAT; however, the interaction is eventually stabilized.
Fluctuations measured for this internal gate in OF DAT are likely due to the size of the
LX ligands within the S1 binding site, and in increased interaction with TM8, causing a
displacement of D435 (Figure 3.9A, Figure 3.10).

82
Figure 3.9: A) LX10 (blue) and LX11 (green) in OF DAT are superposed for
comparison of the inhibitors in the S1 binding pocket. The ligands (vdW spheres) and
DAT residues (sticks) are color-coded. The tropane C3 chlorophenyl ring and a ring
portion of the C2 diphenyl ether moiety of LX11 are oriented toward the intracellular
space after 100 ns of MD. The red arrows indicate regions of structural differences seen
after 100 ns. B) LX10 and C) LX11 bound in IF DAT, with water molecules solvating the
inner cavity. Surfaces (gray) surrounding the water molecules show regions of solvation.
The snapshots represent the last frame of the simulation. Average values are given in
Figure 2D.
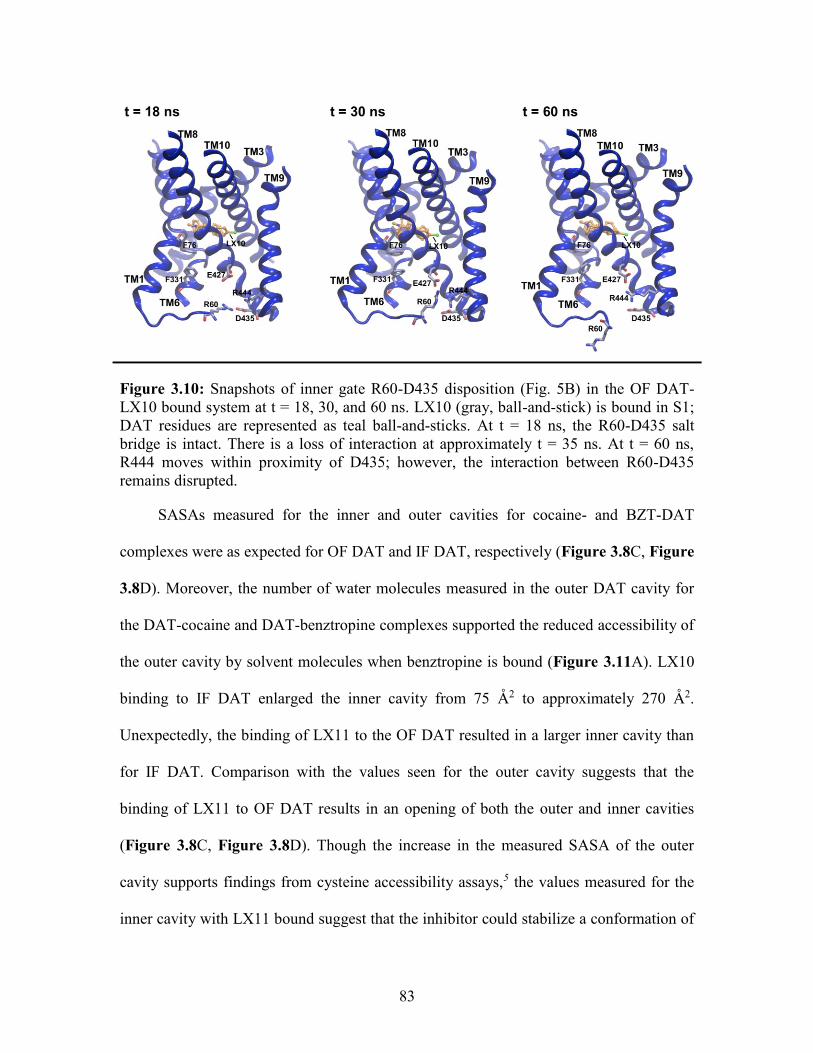
83
Figure 3.10: Snapshots of inner gate R60-D435 disposition (Fig. 5B) in the OF DAT-
LX10 bound system at t = 18, 30, and 60 ns. LX10 (gray, ball-and-stick) is bound in S1;
DAT residues are represented as teal ball-and-sticks. At t = 18 ns, the R60-D435 salt
bridge is intact. There is a loss of interaction at approximately t = 35 ns. At t = 60 ns,
R444 moves within proximity of D435; however, the interaction between R60-D435
remains disrupted.
SASAs measured for the inner and outer cavities for cocaine- and BZT-DAT
complexes were as expected for OF DAT and IF DAT, respectively (Figure 3.8C, Figure
3.8D). Moreover, the number of water molecules measured in the outer DAT cavity for
the DAT-cocaine and DAT-benztropine complexes supported the reduced accessibility of
the outer cavity by solvent molecules when benztropine is bound (Figure 3.11A). LX10
binding to IF DAT enlarged the inner cavity from 75 A2 to approximately 270 A2.
Unexpectedly, the binding of LX11 to the OF DAT resulted in a larger inner cavity than
for IF DAT. Comparison with the values seen for the outer cavity suggests that the
binding of LX11 to OF DAT results in an opening of both the outer and inner cavities
(Figure 3.8C, Figure 3.8D). Though the increase in the measured SASA of the outer
cavity supports findings from cysteine accessibility assays,5 the values measured for the
inner cavity with LX11 bound suggest that the inhibitor could stabilize a conformation of

84
the transporter that is simultaneously open to some extent to the external and internal
spaces.
Figure 3.11: The number of water molecules analyzed between each pair of OF (green)
and IF (violet) systems for the 100 ns trajectory. The plots represent the number of water
molecules within 5 Å of the residues in the A) outer (residues D79 (TM1), W84 (TM1),
R85 (TM1), Y88 (TM 1), F155 (TM3), Y156 (TM3), I311 (TM6), D312 (TM6), T315
(TM6), F319 (TM6), D475 (TM10), T481 (TM10)) and B) inner (residues F69 (TM1),
G75 (TM1), F76 (TM1), G257 (TM5), S261 (TM5), V265 (TM5), T268 (TM5), F325
(TM6), F331 (TM6), G424 (TM8), E427 (TM8) and T431 (TM8)) cavities.
Differences in inner cavity hydration were observed for OF DAT bound to LX10
and LX11 (Figure 3.9). The LX10 interaction with TM1 and TM6 resulted in breakage
of the internal R60-D435 gate (Figure 3.9A, blue), in agreement with the distance
measured for this gate pair (Figure 3.8B). Unlike LX10, DAT binding of LX11 caused a
TM8 shift that increased inner cavity space, enhancing hydration of the inner cavity

85
(Figure 3.9B, Figure 3.9C). The binding of LX11 in OF DAT sustained a shift within
the binding site (Figure 3.3C.) Relative to LX10-DAT, there are approximately 15 more
water molecules in the LX11- DAT inner cavity that approach the cytoplasmic interface
(Figure 3.6D).
A network of ionic interactions at the cytoplasmic interface maintains a DAT
conformation closed to the cytoplasm.16 The distances between the charged residues in
the inner cavity were measured to provide quantitative differences between LX10 and
LX11 DAT complexes (Figure 3.12). Residue pairs included R60 (TM1) – E427 (TM8),
D435 (TM8) – R444 (TM9), E61 (TM1) – R444 (TM9), and D435 (TM8) – K133 (IL2,
connecting TM2 and TM3). The interactions were measured at the shortest distance
possible between the arginine/lysine side chain nitrogen atoms and the
aspartate/glutamate carboxylate oxygen atoms.16, 17

86
Figure 3.12: For the A, B) LX10 or C, D) LX11 complex with OF DAT, distances
between amino acid residue side chains at the TM-cytoplasm interface: R60-D435
(orange), R60- E427 (blue), D435-R444 (pink), E61-R444 (red) and D435-K133 (green).
Values represent the shortest possible distance between the nitrogen atoms of
arginine/lysine side chains and carboxylate oxygen atoms of aspartate/glutamate side
chains.
For LX10-bound DAT (Figure 3.12A), D435 is interacting with both R60 (orange)
and R444 (pink) until 18 ns into the simulation. R60 – D435 is disrupted at that point,
followed by breakage of the D435 – R444 interaction at 30 ns and alignment of D435
with K133 (green). R60 trades its D435 interaction for a brief interaction with E427
(blue), lasting about 20 ns, before this bond distance fluctuates. Upon loss of the D435
interaction (pink), R444 forms a bridge with E61 (red) at approximately 40 ns, lasting
until the 75 ns mark. During this time frame D435 makes brief contact with R60, but
never regains a stable interaction with either R60 or R444. For LX11-bound DAT
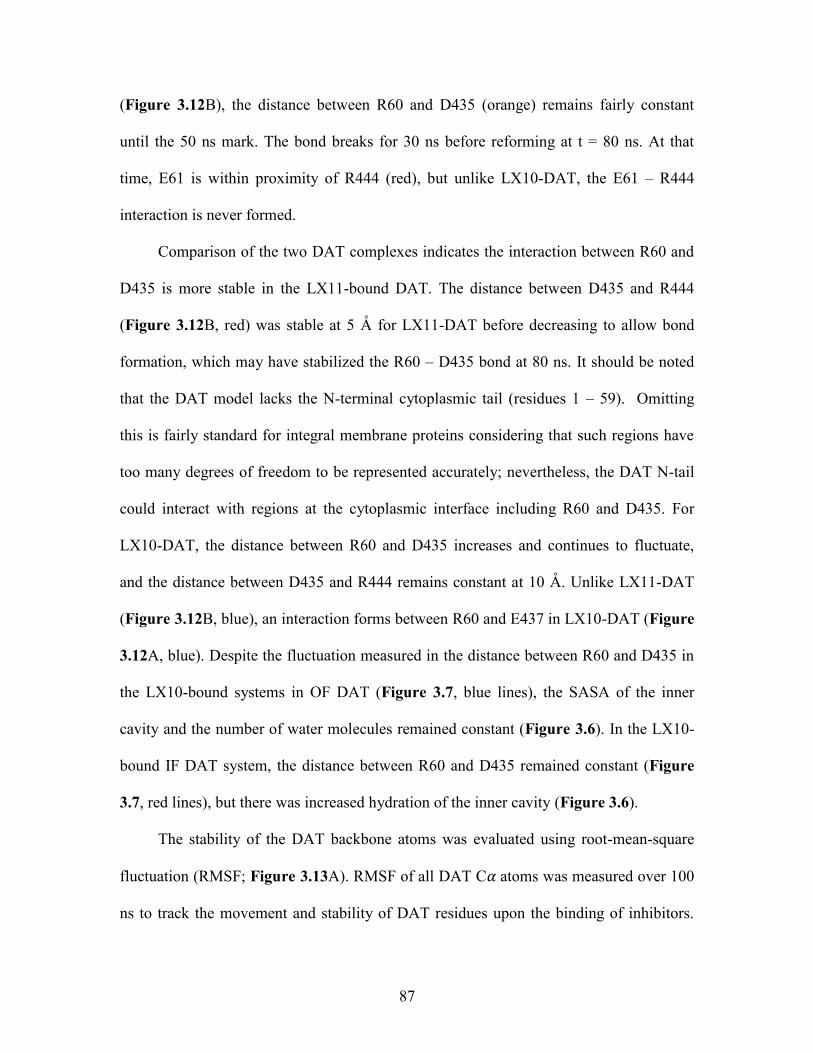
87
(Figure 3.12B), the distance between R60 and D435 (orange) remains fairly constant
until the 50 ns mark. The bond breaks for 30 ns before reforming at t = 80 ns. At that
time, E61 is within proximity of R444 (red), but unlike LX10-DAT, the E61 – R444
interaction is never formed.
Comparison of the two DAT complexes indicates the interaction between R60 and
D435 is more stable in the LX11-bound DAT. The distance between D435 and R444
(Figure 3.12B, red) was stable at 5 A for LX11-DAT before decreasing to allow bond
formation, which may have stabilized the R60 – D435 bond at 80 ns. It should be noted
that the DAT model lacks the N-terminal cytoplasmic tail (residues 1 – 59). Omitting
this is fairly standard for integral membrane proteins considering that such regions have
too many degrees of freedom to be represented accurately; nevertheless, the DAT N-tail
could interact with regions at the cytoplasmic interface including R60 and D435. For
LX10-DAT, the distance between R60 and D435 increases and continues to fluctuate,
and the distance between D435 and R444 remains constant at 10 A. Unlike LX11-DAT
(Figure 3.12B, blue), an interaction forms between R60 and E437 in LX10-DAT (Figure
3.12A, blue). Despite the fluctuation measured in the distance between R60 and D435 in
the LX10-bound systems in OF DAT (Figure 3.7, blue lines), the SASA of the inner
cavity and the number of water molecules remained constant (Figure 3.6). In the LX10-
bound IF DAT system, the distance between R60 and D435 remained constant (Figure
3.7, red lines), but there was increased hydration of the inner cavity (Figure 3.6).
The stability of the DAT backbone atoms was evaluated using root-mean-square
fluctuation (RMSF; Figure 3.13A). RMSF of all DAT C𝛼 atoms was measured over 100
ns to track the movement and stability of DAT residues upon the binding of inhibitors.

88
RMSF comparison of cocaine-DAT with LX10- and LX11-DAT showed that LX10
(blue) is similar to cocaine (orange) in measured fluctuations, with a variation seen in
EL4. In contrast, LX11-DAT (green) displayed a greater RMSF difference relative to
cocaine- DAT in the extracellular and intracellular loops. RMSF traces for LX10- and
LX11-OF DAT complexes were superposed for comparison. The fluctuations were very
similar for these two systems except in TM6, TM7, EL1, EL4, and IL5.
89
Figure 3.13: A) RMSF calculations for the Cα atoms of OF DAT residues. RMSF values
are plotted against residue number. RMSF traces are superposed to better compare the
inhibitor-bound systems: Cocaine (orange) and LX10 (blue), cocaine (orange) and LX11
(green), and LX10 (blue) and LX11 (green). B, C) The final snapshot of the 100 ns
simulation is represented and the OF DAT bound to cocaine (orange) was superposed
with the OF DAT bound to LX10 (blue) or LX11 (green). The final structure of OF DAT
bound to cocaine (orange) after 100 ns MD was used as the reference structure in RMSD
measurements for the Cα atoms of residues in TM1, TM3, TM6, TM8, and TM10 for the
100 ns trajectory of LX10 and LX11 bound in OF DAT. D-F) Binding site interactions in
OF DAT superposed after 100 ns simulation. Ligands are represented as ball-and-stick;
colored side chains corresponding to the inhibitor-bound systems are represented as lines.
D) COC (orange) and LX10 (blue); E) COC (orange) and LX11 (green); F) LX10 (blue)
and LX11 (green).
The RMSD was measured for the backbone atoms in TM1, TM3, TM6, TM8 and
TM10 to assess the effect of inhibitor binding on the transmembrane helices surrounding
the binding site (Figure 3.13B, Figure 3.13C). OF DAT bound to cocaine (orange) was
used as the reference structure to compare the outward-facing DAT complexes with
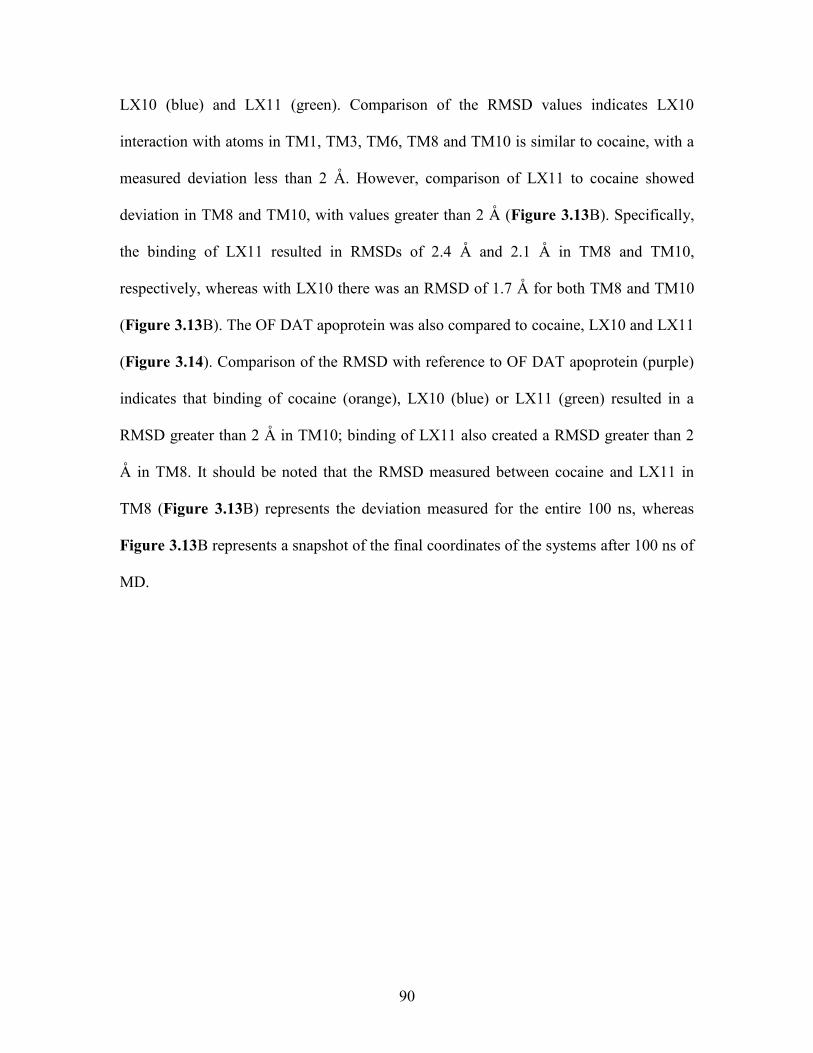
90
LX10 (blue) and LX11 (green). Comparison of the RMSD values indicates LX10
interaction with atoms in TM1, TM3, TM6, TM8 and TM10 is similar to cocaine, with a
measured deviation less than 2 A. However, comparison of LX11 to cocaine showed
deviation in TM8 and TM10, with values greater than 2 A (Figure 3.13B). Specifically,
the binding of LX11 resulted in RMSDs of 2.4 A and 2.1 A in TM8 and TM10,
respectively, whereas with LX10 there was an RMSD of 1.7 A for both TM8 and TM10
(Figure 3.13B). The OF DAT apoprotein was also compared to cocaine, LX10 and LX11
(Figure 3.14). Comparison of the RMSD with reference to OF DAT apoprotein (purple)
indicates that binding of cocaine (orange), LX10 (blue) or LX11 (green) resulted in a
RMSD greater than 2 A in TM10; binding of LX11 also created a RMSD greater than 2
A in TM8. It should be noted that the RMSD measured between cocaine and LX11 in
TM8 (Figure 3.13B) represents the deviation measured for the entire 100 ns, whereas
Figure 3.13B represents a snapshot of the final coordinates of the systems after 100 ns of
MD.
91
Figure 3.14: The OF structure of APO DAT (purple) superposed with OF DAT bound to
A) cocaine (orange), B) LX10 (blue) or C) LX11 (green). RMSD (Å) was measured for
the backbone atoms in TM1, TM3, TM6, TM8, and TM10 after 100 ns. APO OF DAT
(purple) was used as the reference structure for all RMSD measurements.
Inspection of the binding revealed that in all cases, the inhibitors were found to
interact favorably with the charged aspartate D79 residue of the S1 pocket (Figure 3.15).

92
In the OF DAT systems, all inhibitors were similarly wedged between TM6a and TM6b
(Figure 3.13D-F), and the respective 2𝛽- and 2𝛼-substituted phenyltropanes of LX10
and LX11 interacted with hydrophobic regions of the binding site that were inaccessible
to cocaine (Figure 3.13D, Figure 3.13E).
Figure 3.15: Binding site interactions in OF DAT superposed with IF DAT after 100 ns
simulation. Ligands are represented as ball-and-stick; colored side chains corresponding
to the inhibitor-bound systems are represented as lines. A) BZT; B) COC; C) LX10; D)
LX11.
The chlorophenyl groups of LX10 and LX11 interacted with TM8. For LX10, these
substituents share the same DAT region as the benzene ring of cocaine, although the
chlorophenyl group penetrated deeper into the S1 pocket, situated between Phe319
(TM6a) and Phe325 (TM6b) (Figure 3.13D). However, the interaction of LX11 with
TM8 occurred on the other side of the helix (Figure 3.13F), with the chlorophenyl ring
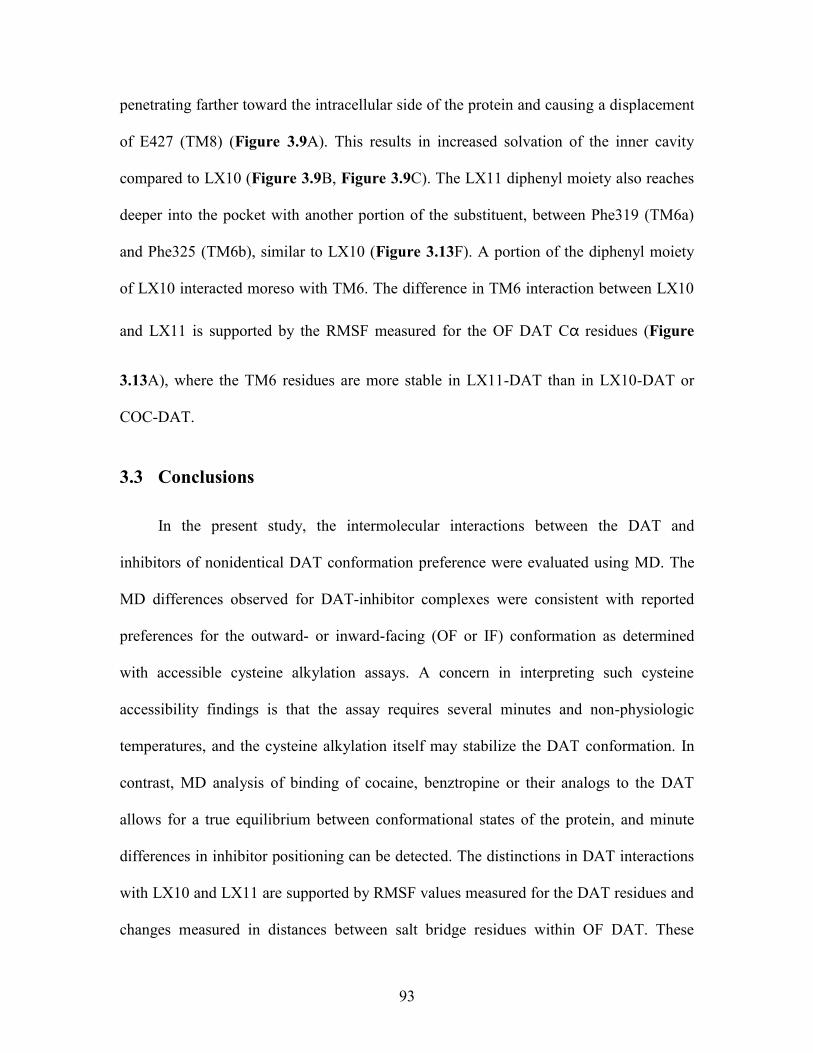
93
penetrating farther toward the intracellular side of the protein and causing a displacement
of E427 (TM8) (Figure 3.9A). This results in increased solvation of the inner cavity
compared to LX10 (Figure 3.9B, Figure 3.9C). The LX11 diphenyl moiety also reaches
deeper into the pocket with another portion of the substituent, between Phe319 (TM6a)
and Phe325 (TM6b), similar to LX10 (Figure 3.13F). A portion of the diphenyl moiety
of LX10 interacted moreso with TM6. The difference in TM6 interaction between LX10
and LX11 is supported by the RMSF measured for the OF DAT Cα residues (Figure
3.13A), where the TM6 residues are more stable in LX11-DAT than in LX10-DAT or
COC-DAT.
3.3 Conclusions
In the present study, the intermolecular interactions between the DAT and
inhibitors of nonidentical DAT conformation preference were evaluated using MD. The
MD differences observed for DAT-inhibitor complexes were consistent with reported
preferences for the outward- or inward-facing (OF or IF) conformation as determined
with accessible cysteine alkylation assays. A concern in interpreting such cysteine
accessibility findings is that the assay requires several minutes and non-physiologic
temperatures, and the cysteine alkylation itself may stabilize the DAT conformation. In
contrast, MD analysis of binding of cocaine, benztropine or their analogs to the DAT
allows for a true equilibrium between conformational states of the protein, and minute
differences in inhibitor positioning can be detected. The distinctions in DAT interactions
with LX10 and LX11 are supported by RMSF values measured for the DAT residues and
changes measured in distances between salt bridge residues within OF DAT. These
94
results further reinforce the hypothesized similarity in DAT binding interactions for
cocaine and LX10,5 and provide molecular insight into possible differences in LX10 and
LX11 positioning in the OF DAT conformation.
While the need for an inhibitor to stabilize the OF DAT conformation in order to be
an abusable drug appears unlikely, it is possible that certain DAT-inhibitor complexes
adopt a 3D structure that is conducive to eliciting (or blocking) euphoria. This might be
somewhat analogous to the phenomenon of “biased agonism”, in which the signal
transduction pathway employed by G protein-coupled receptors is dictated by the
agonist.18 For example, subtle 3-D differences between mu opioid receptor complexes
with morphine versus TRV130 afford the latter drug powerful analgesic properties
without sharing morphine’s abuse potential and other adverse effects.19 Similarly,
changes in DAT conformation may promote interactions with selected intracellular
macromolecules that provoke discrete signaling mechanisms, manifested as behavioral
differences such as seen with cocaine and benztropine. A better understanding of the
intricacies of DAT-inhibitor interactions may provide the next lead compounds in the
elusive search for an effective therapeutic for psychostimulant abuse.
The future work of this research should involve the use of multiple computational
models to simulate the binding of the inhibitors, including a system where the starting
coordinates for the ligand is outside of the primary binding site.15 Furthermore, the DAT
N-terminal cytoplasmic tail (residues 1 – 59) should be modeled for both potential
intramolecular interactions with other DAT residues and impact on protein-protein
interaction upon inhibitor binding.20 Certainly, using an enhanced sampling method such
as an accelerated MD approach would offer the ability to run longer timescale

95
simulations that will allow for more sampling of the system’s degrees of freedom,21 thus
capturing distinct changes in DAT conformation that are stabilized by inhibitor binding.
3.4 References
1. Lieberman, J. A., Kane, J. M., and Alvir, J. (1987) Provocative tests with
psychostimulant drugs in schizophrenia. Psychopharmacology 91, 415-433.
2. Loland, C. J., Desai, R. I., Zou, M. F., Cao, J., Grundt, P., Gerstbrein, K., Sitte, H. H.,
Newman, A. H., Katz, J. L., and Gether, U. (2008) Relationship between conformational
changes in the dopamine transporter and cocaine-like subjective effects of uptake
inhibitors. Mol Pharmacol 73, 813-823.
3. Arbo, M. D., Bastos, M. L., and Carmo, H. F. (2012) Piperazine compounds as drugs
of abuse. Drug Alcohol Depend 122, 174-185.
4. Ukairo, O. T., Bondi, C. D., Newman, A. H., Kulkarni, S. S., Kozikowski, A. P., Pan,
S., and Surratt, C. K. (2005) Recognition of benztropine by the dopamine transporter
(DAT) differs from that of the classical dopamine uptake inhibitors cocaine,
methylphenidate, and mazindol as a function of a DAT transmembrane 1 aspartic acid
residue. J Pharmacol Exp Ther 314, 575-583.
5. Hong, W. C., Kopajtic, T. A., Xu, L., Lomenzo, S. A., Jean, B., Madura, J. D., Surratt,
C. K., Trudell, M. L., and Katz, J. L. (2016) 2-Substituted 3β-Aryltropane Cocaine
Analogs Produce Atypical DAT Inhibitor Effects Without Inducing Inward-Facing DAT
Conformations. J Pharmacol Exp Ther, 624-634.
6. Wang, K. H., Penmatsa, A., and Gouaux, E. (2015) Neurotransmitter and
psychostimulant recognition by the dopamine transporter. Nature 521, 322-327.
7. Giros, B., el Mestikawy, S., Godinot, N., Zheng, K., Han, H., Yang-Feng, T., and
Caron, M. G. (1992) Cloning, pharmacological characterization, and chromosome
assignment of the human dopamine transporter. Mol Pharmacol 42, 383-390.
8. Celik, L., Schiøtt, B., Tajkhorshid, E., and Schiott, B. (2008) Substrate Binding and
Formation of an Occluded State in the Leucine Transporter. Biophys J 94, 1600-1612.
9. Beuming, T., Kniazeff, J., Bergmann, M. L., Shi, L., Gracia, L., Raniszewska, K.,
Newman, A. H., Javitch, J. A., Weinstein, H., Gether, U., and Loland, C. J. (2008) The
binding sites for cocaine and dopamine in the dopamine transporter overlap. Nat
Neurosci 11, 780-789.

96
10. Gouaux, E. (2009) Review. The molecular logic of sodium-coupled neurotransmitter
transporters. Philos Trans R Soc Lond B Biol Sci 364, 149-154.
11. Krishnamurthy, H., Piscitelli, C. L., and Gouaux, E. (2009) Unlocking the molecular
secrets of sodium-coupled transporters. Nature 459, 347-355.
12. Penmatsa, A., and Gouaux, E. (2014) How LeuT shapes our understanding of the
mechanisms of sodium-coupled neurotransmitter transporters. J Physiol 592, 863-869.
13. Piscitelli, C. L., and Gouaux, E. (2012) Insights into transport mechanism from LeuT
engineered to transport tryptophan. EMBO J 31, 228-235.
14. Shaikh, S. A., and Tajkhorshid, E. (2010) Modeling and dynamics of the inward-
facing state of a Na+/Cl- dependent neurotransmitter transporter homologue. PLoS
Comput Biol 6.
15. Koldso, H., Autzen, H. E., Grouleff, J., and Schiott, B. (2013) Ligand induced
conformational changes of the human serotonin transporter revealed by molecular
dynamics simulations. PLoS One 8, e63635.
16. Kniazeff, J., Shi, L., Loland, C. J., Javitch, J. A., Weinstein, H., and Gether, U.
(2008) An intracellular interaction network regulates conformational transitions in the
dopamine transporter. J Biol Chem 283, 17691-17701.
17. Malinauskaite, L., Quick, M., Reinhard, L., Lyons, J. A., Yano, H., Javitch, J. A.,
and Nissen, P. (2014) A mechanism for intracellular release of Na+ by
neurotransmitter/sodium symporters. Nat Struct Mol Biol 21, 1006-1012.
18. Rankovic, Z., Brust, T. F., and Bohn, L. M. (2016) Biased agonism: An emerging
paradigm in GPCR drug discovery. Bioorg Med Chem Lett 26, 241-250.
19. Violin, J. D., Crombie, A. L., Soergel, D. G., and Lark, M. W. (2014) Biased ligands
at G-protein-coupled receptors: promise and progress. Trends Pharmacol Sci 35, 308-
316.
20. Khelashvili, G., Stanley, N., Sahai, M. A., Medina, J., LeVine, M. V., Shi, L., De
Fabritiis, G., and Weinstein, H. (2015) Spontaneous inward opening of the dopamine
transporter is triggered by PIP2-regulated dynamics of the N-terminus. ACS Chem
Neurosci 6, 1825-1837.
21. Pang, Y. T., Miao, Y., Wang, Y., and Mccammon, J. A. (2016) Gaussian Accelerated
Molecular Dynamics in NAMD. J Chem Theory Comput 13, 9-19.

97
CHAPTER 4
4 LEAD OPTIMIZATION OF A NOVEL SERT
INHIBITOR
4.1 Introduction
Increasing levels of the monoamine neurotransmitter, serotonin (5-HT), have been
found to alleviate depressive symptoms.1-8 As a result, the serotonin transporter (SERT)
has become a primary target for treating depression because of its role in maintaining the
balance of 5-HT in the synapse.9-11 Fluoxetine (Prozac™) is well known as one of the
first approved selective serotonin reuptake inhibitors (SSRIs), discovered in 1986. The
molecular mechanism of binding of antidepressants to monoamine transporters remains
of interest to further elucidate how such drugs modulate protein function. The crystal
structures of LeuT were the first to offer insight into the allosteric binding site of MATs
with the binding of SSRIs and tricyclic antidepressants (TCAs) in the S2 site.4, 12, 13 The
LeuT co-crystal structure with R-fluoxetine bound in S2 (PDB entry 3GWV) was used
for modeling the binding of R-fluoxetine in the previously developed hSERT homology
model (Figure 2.4) followed by absolute binding free energy (ABFE) calculations for
comparison to experimental affinity.4 Modeling the binding of existing antidepressants in
the S2 site of SERT can offer insight into the allosteric binding site interactions.
A novel SERT inhibitor, SM11, was discovered through virtual screening of the
ZINC molecular library using the S2 binding pocket in SERT (Figure 4.1).14 The
98
proposed SM11 binding pose within S2 includes hydrophobic interactions with Trp103,
Ile179 and Phe335 and hydrogen bond interactions with Tyr107, Asp328, and Lys490
(Figure 1.7). The objective of this work is to apply free energy perturbation (FEP)
calculations to determine which SERT binding site is employed by SM11, as well as the
specific ligand-protein interactions, followed by a lead optimization based on potential
binding site interactions. The binding site was identified by comparing the ABFE
calculations of SM11 in the SERT S1 and S2 binding sites (Figure 4.1) to the
experimental binding free energy, which is based on the ligand’s binding affinity (𝐾𝑖) for
SERT.15-19
The ABFE method was validated based on the protocols described by Gumbart et
al.17 and Jo et al.18 The systems used for validating the ABFE method include the crystal
structure of leucine in LeuT (PDB entry 3F3A)20 and T4 lysozyme bound to FK5 (PDB
entry 1FKJ).18
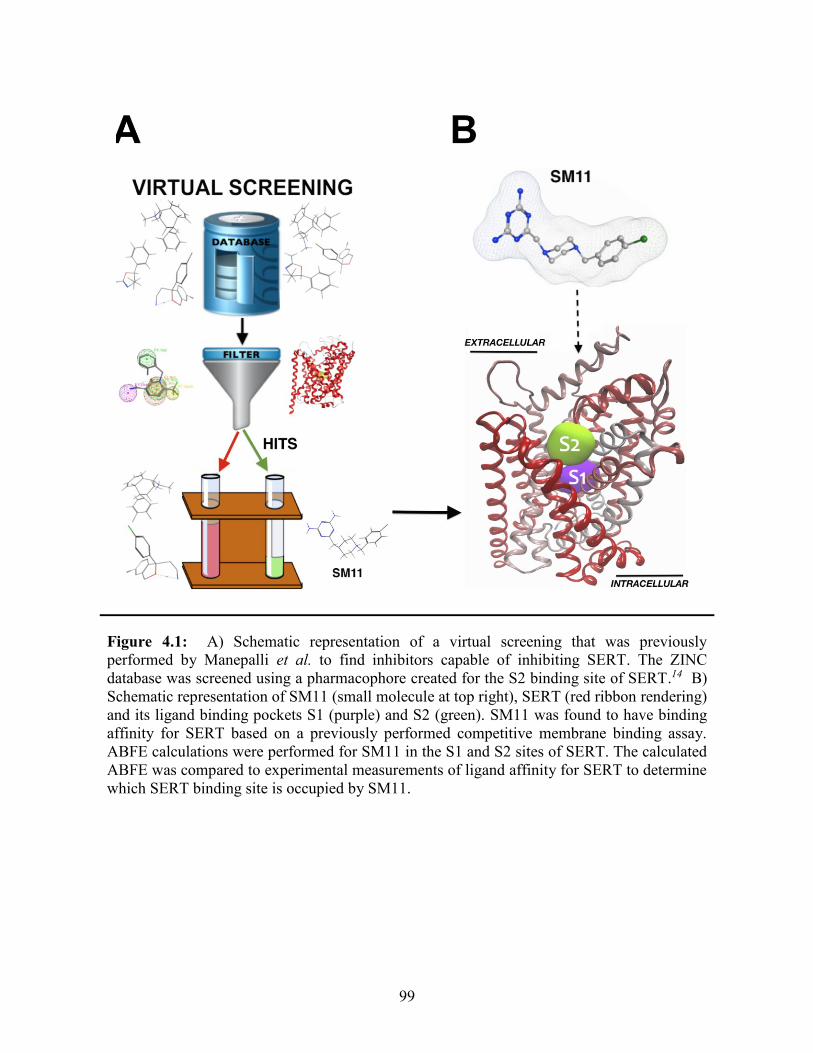
99
Figure 4.1: A) Schematic representation of a virtual screening that was previously
performed by Manepalli et al. to find inhibitors capable of inhibiting SERT. The ZINC
database was screened using a pharmacophore created for the S2 binding site of SERT.14 B)
Schematic representation of SM11 (small molecule at top right), SERT (red ribbon rendering)
and its ligand binding pockets S1 (purple) and S2 (green). SM11 was found to have binding
affinity for SERT based on a previously performed competitive membrane binding assay.
ABFE calculations were performed for SM11 in the S1 and S2 sites of SERT. The calculated
ABFE was compared to experimental measurements of ligand affinity for SERT to determine
which SERT binding site is occupied by SM11.
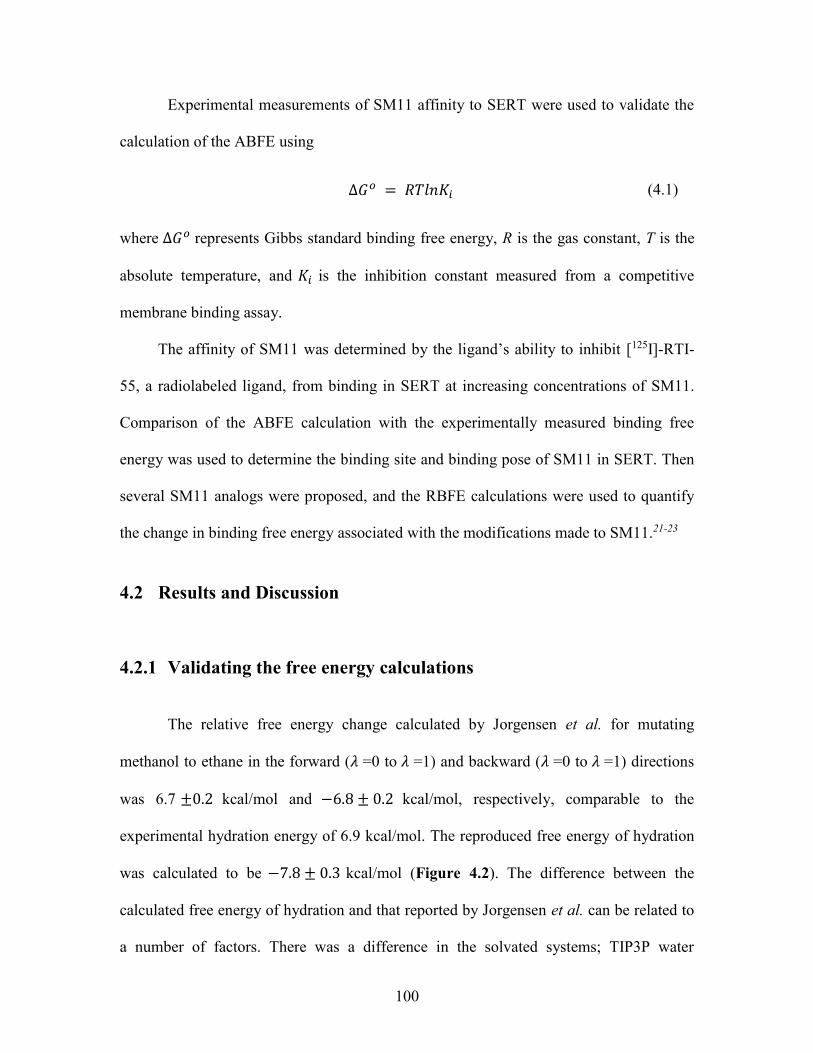
100
Experimental measurements of SM11 affinity to SERT were used to validate the
calculation of the ABFE using
∆𝐺𝑜 = 𝑅𝑇𝑙𝑛𝐾𝑖 (4.1)
where ∆𝐺𝑜 represents Gibbs standard binding free energy, R is the gas constant, T is the
absolute temperature, and 𝐾𝑖 is the inhibition constant measured from a competitive
membrane binding assay.
The affinity of SM11 was determined by the ligand’s ability to inhibit [125I]-RTI-
55, a radiolabeled ligand, from binding in SERT at increasing concentrations of SM11.
Comparison of the ABFE calculation with the experimentally measured binding free
energy was used to determine the binding site and binding pose of SM11 in SERT. Then
several SM11 analogs were proposed, and the RBFE calculations were used to quantify
the change in binding free energy associated with the modifications made to SM11.21-23
4.2 Results and Discussion
4.2.1 Validating the free energy calculations
The relative free energy change calculated by Jorgensen et al. for mutating
methanol to ethane in the forward (𝜆 =0 to 𝜆 =1) and backward (𝜆 =0 to 𝜆 =1) directions
was 6.7 ±0.2 kcal/mol and −6.8 ± 0.2 kcal/mol, respectively, comparable to the
experimental hydration energy of 6.9 kcal/mol. The reproduced free energy of hydration
was calculated to be −7.8 ± 0.3 kcal/mol (Figure 4.2). The difference between the
calculated free energy of hydration and that reported by Jorgensen et al. can be related to
a number of factors. There was a difference in the solvated systems; TIP3P water

101
molecules were used for the systems calculated here instead of TIP4P, which affects the
number of possible intermolecular interactions between the ligand with each water
molecule.24, 25 CHARMM27 force field with dihedral cross-term corrections (CMAP)
was used and as oppose to the OPLS parameters.26 Finally, specific intermolecular
potential functions were assigned to the atoms in the system. In the reproduced
calculations, no additional modifications were made to the system.
Figure 4.2: Free energy change (∆𝐺ℎ𝑦𝑑𝑟𝑐𝑎𝑙𝑐 ) for the forward (black) and backward (red)
alchemical transformation of ethane to methanol. The ParseFEP plugin in VMD was used
to generate the FEP plot,27 where ∆𝐺 was calculated as a function of 𝜆 . ∆𝐺ℎ𝑦𝑑𝑟𝑐𝑎𝑙𝑐 was
calculated using free energy perturbation and molecular dynamics. The charge
parameters assigned by Jorgensen et al. were used.28 The experimental free energy,
∆𝐺ℎ𝑦𝑑𝑟𝑒𝑥𝑝
= -6.9 kcal/mol was comparable to the calculated free energy, ∆𝐺ℎ𝑦𝑑𝑟𝑐𝑎𝑙𝑐 = -7.8 ±
0.3 kcal/mol (mean ± s.d.). The statistical error was not reported for ∆𝐺ℎ𝑦𝑑𝑟𝑒𝑥𝑝
.
The protocol outlined by Jo et al. was followed to perform the alchemical
transformation of T4 lysozyme bound to FK5 using the CHARMM-GUI Ligand Binder
tool.18 Table 4.1 summarizes the calculations performed by Jo et al. of T4 lysozyme
bound to FK5. The same system was used to reproduce the absolute binding free energy
of the T4 lysozyme to FK5 using the input files generated the Ligand Binder tool (Table
4.1). The reproduced calculations were comparable to the results reported by Jo et al. and
to the experimental binding free energy. The differences in the calculated ∆𝐺𝑖𝑛𝑡𝑠𝑖𝑡𝑒 and

102
∆∆𝐺𝑡,𝑟 are likely due to the difference in the atoms chosen for the assignment of the
harmonic restraints in the protein-ligand complex. The benefit of the Ligand Binder web
server is the ability to perform these calculations without the tedious setup required in the
simulation input files. The atoms that define the reference frame for the translational and
rotational restraints are automatically chosen. However, if the atom sets do not properly
anchor the ligand to the protein, the results may vary due to ineffective geometric
restraints that are unable to maintain the appropriate orientation of the ligand to the
protein. This may even lead to instabilities in the simulation and inaccurate outcome of
the calculations. Therefore, these calculations still require monitoring because of the
reassignments of the restraints.
Table 4.1: A) Absolute binding free energy (ABFE) calculations of T4 lysozyme bound
to FK5 performed by Jo et al., using the CHARMM-GUI Ligand Binder input files, was
compared to B) the reproduced ABFE calculations of T4 lysozyme bound to FK5 using
the CHARMM-GUI Ligand Binder input files.18 ∆𝐺𝑖𝑛𝑡𝑠𝑖𝑡𝑒 is the binding free energy
associated with intermolecular interactions of the ligand in the binding site. ∆𝐺𝑖𝑛𝑡ℎ𝑦𝑑𝑟
is the
binding free energy associated with the ligand in bulk solvent. ∆∆𝐺𝑐𝑜𝑛𝑓 is the change in
conformational free energy associated with the harmonic restraints applied to the ligand.
∆∆𝐺𝑡,𝑟 is the free energy change associated with the translational and rotational restraints
placed on the ligand. ∆𝐺𝑏𝑖𝑛𝑑𝑜 is the calculated standard ABFE, which is compared to the
experimental ABFE (∆𝐺𝑒𝑥𝑝).
∆𝐺𝑏𝑖𝑛𝑑𝑜 = ∆𝐺𝑖𝑛𝑡
ℎ𝑦𝑑𝑟− ∆𝐺𝑖𝑛𝑡
𝑠𝑖𝑡𝑒 − ∆∆𝐺𝑐𝑜𝑛𝑓 − ∆∆𝐺𝑡,𝑟
∆𝐆𝐢𝐧𝐭𝐬𝐢𝐭𝐞 ∆𝐆𝐢𝐧𝐭
𝐡𝐲𝐝𝐫 ∆∆𝐆𝐜𝐨𝐧𝐟 ∆∆𝐆𝐭,𝐫 ∆𝐆𝐛𝐢𝐧𝐝
𝐨 ∆𝐆𝐞𝐱𝐩
A) -60.0 ± 1.3 -35.0 ± 1.9 2.3 ± 0.7 9.8 ± 0.0 -12.9 ± 2.4 -12.7 ± 0.2
B) -49.0 ± 2.2 -34.2 ± 1.9 3.6 ± 1.0 -2.0 ± 0.2 -13.3 ± 2.9 -12.7 ± 0.2
All energies in kcal/mol
The protocol outlined by Gumbart et al.17 was followed to perform the alchemical
transformation of leucine in the LeuT co-crystal structure. Table 4.3 summarizes the
results from the free energy calculation of leucine in LeuT. The difference between the
binding free energy within the binding site and in the bulk solvent is only 0.5 kcal/mol.
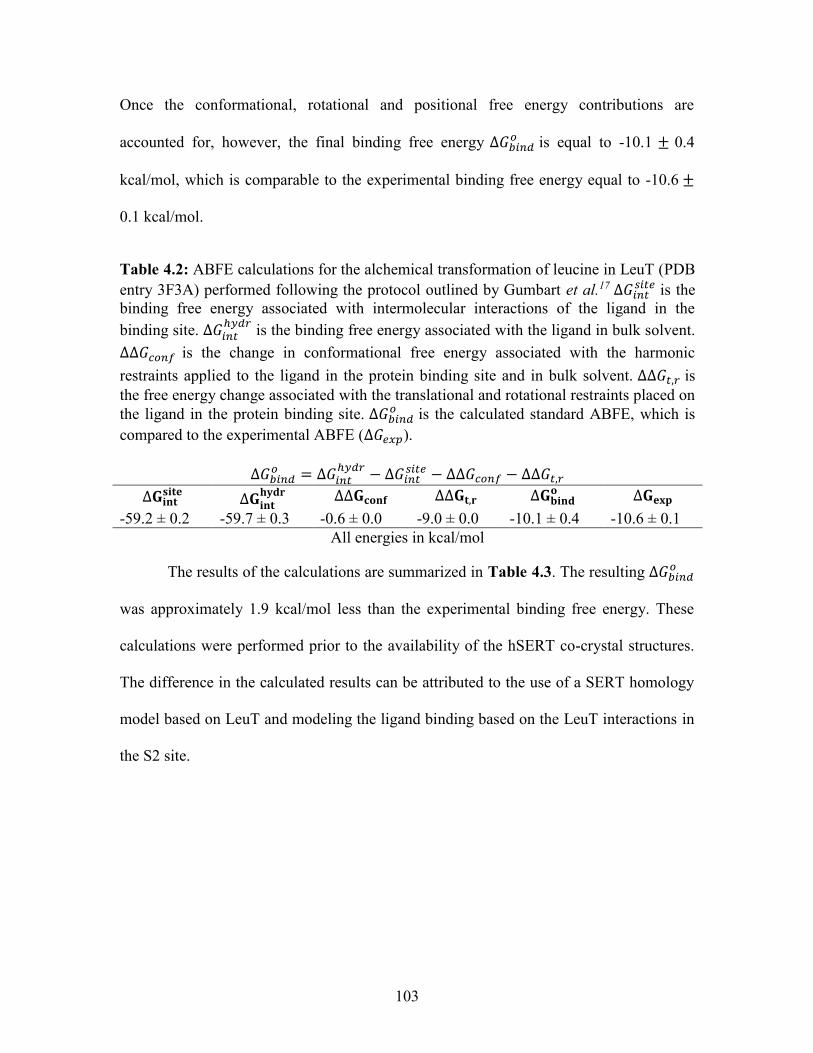
103
Once the conformational, rotational and positional free energy contributions are
accounted for, however, the final binding free energy ∆𝐺𝑏𝑖𝑛𝑑𝑜
is equal to -10.1 ± 0.4
kcal/mol, which is comparable to the experimental binding free energy equal to -10.6 ±
0.1 kcal/mol.
Table 4.2: ABFE calculations for the alchemical transformation of leucine in LeuT (PDB
entry 3F3A) performed following the protocol outlined by Gumbart et al.17 ∆𝐺𝑖𝑛𝑡𝑠𝑖𝑡𝑒 is the
binding free energy associated with intermolecular interactions of the ligand in the
binding site. ∆𝐺𝑖𝑛𝑡ℎ𝑦𝑑𝑟
is the binding free energy associated with the ligand in bulk solvent.
∆∆𝐺𝑐𝑜𝑛𝑓 is the change in conformational free energy associated with the harmonic
restraints applied to the ligand in the protein binding site and in bulk solvent. ∆∆𝐺𝑡,𝑟 is
the free energy change associated with the translational and rotational restraints placed on
the ligand in the protein binding site. ∆𝐺𝑏𝑖𝑛𝑑𝑜 is the calculated standard ABFE, which is
compared to the experimental ABFE (∆𝐺𝑒𝑥𝑝).
∆𝐺𝑏𝑖𝑛𝑑𝑜 = ∆𝐺𝑖𝑛𝑡
ℎ𝑦𝑑𝑟− ∆𝐺𝑖𝑛𝑡
𝑠𝑖𝑡𝑒 − ∆∆𝐺𝑐𝑜𝑛𝑓 − ∆∆𝐺𝑡,𝑟
∆𝐆𝐢𝐧𝐭𝐬𝐢𝐭𝐞 ∆𝐆𝐢𝐧𝐭
𝐡𝐲𝐝𝐫 ∆∆𝐆𝐜𝐨𝐧𝐟 ∆∆𝐆𝐭,𝐫 ∆𝐆𝐛𝐢𝐧𝐝
𝐨 ∆𝐆𝐞𝐱𝐩
-59.2 ± 0.2 -59.7 ± 0.3 -0.6 ± 0.0 -9.0 ± 0.0 -10.1 ± 0.4 -10.6 ± 0.1
All energies in kcal/mol
The results of the calculations are summarized in Table 4.3. The resulting ∆𝐺𝑏𝑖𝑛𝑑𝑜
was approximately 1.9 kcal/mol less than the experimental binding free energy. These
calculations were performed prior to the availability of the hSERT co-crystal structures.
The difference in the calculated results can be attributed to the use of a SERT homology
model based on LeuT and modeling the ligand binding based on the LeuT interactions in
the S2 site.
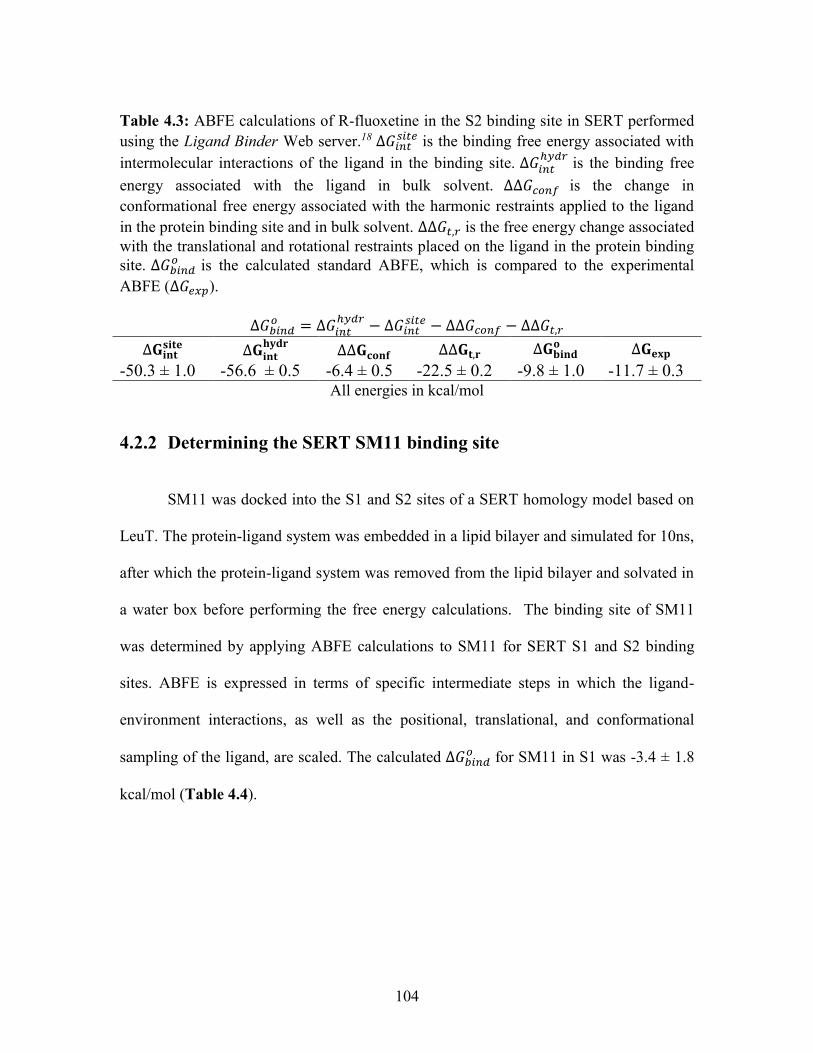
104
Table 4.3: ABFE calculations of R-fluoxetine in the S2 binding site in SERT performed
using the Ligand Binder Web server.18 ∆𝐺𝑖𝑛𝑡𝑠𝑖𝑡𝑒 is the binding free energy associated with
intermolecular interactions of the ligand in the binding site. ∆𝐺𝑖𝑛𝑡ℎ𝑦𝑑𝑟
is the binding free
energy associated with the ligand in bulk solvent. ∆∆𝐺𝑐𝑜𝑛𝑓 is the change in
conformational free energy associated with the harmonic restraints applied to the ligand
in the protein binding site and in bulk solvent. ∆∆𝐺𝑡,𝑟 is the free energy change associated
with the translational and rotational restraints placed on the ligand in the protein binding
site. ∆𝐺𝑏𝑖𝑛𝑑𝑜 is the calculated standard ABFE, which is compared to the experimental
ABFE (∆𝐺𝑒𝑥𝑝).
∆𝐺𝑏𝑖𝑛𝑑𝑜 = ∆𝐺𝑖𝑛𝑡
ℎ𝑦𝑑𝑟− ∆𝐺𝑖𝑛𝑡
𝑠𝑖𝑡𝑒 − ∆∆𝐺𝑐𝑜𝑛𝑓 − ∆∆𝐺𝑡,𝑟
∆𝐆𝐢𝐧𝐭𝐬𝐢𝐭𝐞 ∆𝐆𝐢𝐧𝐭
𝐡𝐲𝐝𝐫 ∆∆𝐆𝐜𝐨𝐧𝐟 ∆∆𝐆𝐭,𝐫 ∆𝐆𝐛𝐢𝐧𝐝
𝐨 ∆𝐆𝐞𝐱𝐩
-50.3 ± 1.0 -56.6 ± 0.5 -6.4 ± 0.5 -22.5 ± 0.2 -9.8 ± 1.0 -11.7 ± 0.3
All energies in kcal/mol
4.2.2 Determining the SERT SM11 binding site
SM11 was docked into the S1 and S2 sites of a SERT homology model based on
LeuT. The protein-ligand system was embedded in a lipid bilayer and simulated for 10ns,
after which the protein-ligand system was removed from the lipid bilayer and solvated in
a water box before performing the free energy calculations. The binding site of SM11
was determined by applying ABFE calculations to SM11 for SERT S1 and S2 binding
sites. ABFE is expressed in terms of specific intermediate steps in which the ligand-
environment interactions, as well as the positional, translational, and conformational
sampling of the ligand, are scaled. The calculated ∆𝐺𝑏𝑖𝑛𝑑𝑜 for SM11 in S1 was -3.4 ± 1.8
kcal/mol (Table 4.4).
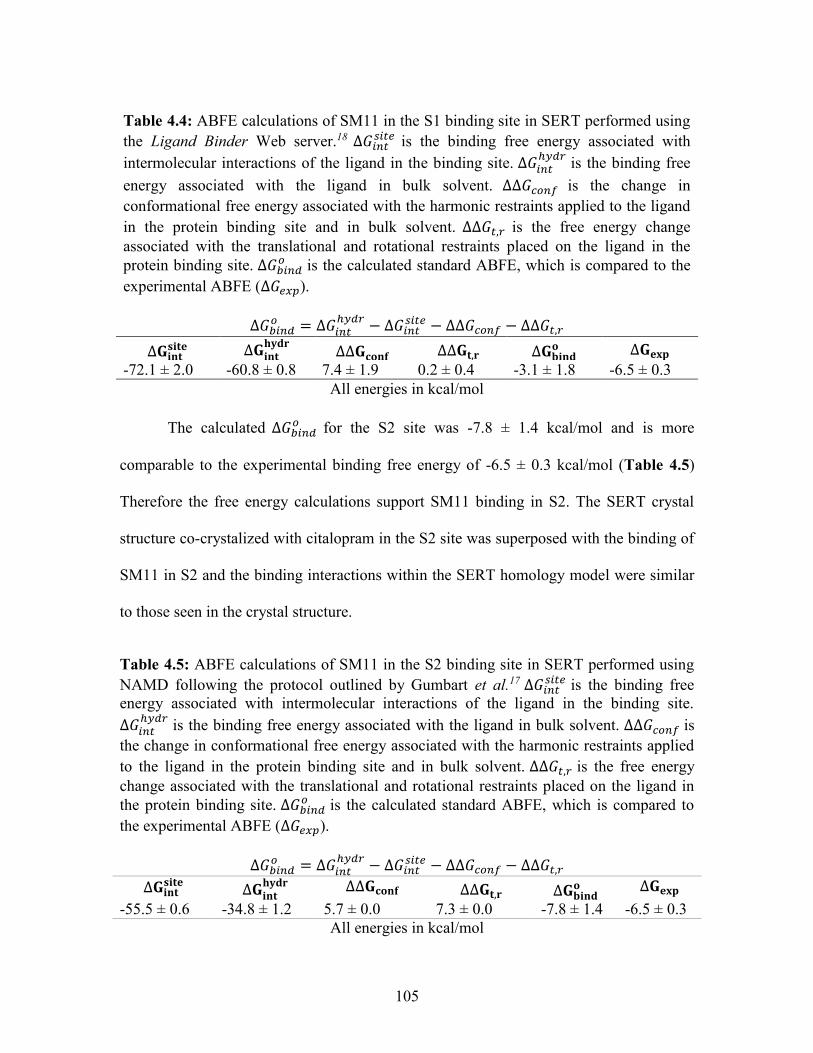
105
Table 4.4: ABFE calculations of SM11 in the S1 binding site in SERT performed using
the Ligand Binder Web server.18 ∆𝐺𝑖𝑛𝑡𝑠𝑖𝑡𝑒 is the binding free energy associated with
intermolecular interactions of the ligand in the binding site. ∆𝐺𝑖𝑛𝑡ℎ𝑦𝑑𝑟
is the binding free
energy associated with the ligand in bulk solvent. ∆∆𝐺𝑐𝑜𝑛𝑓 is the change in
conformational free energy associated with the harmonic restraints applied to the ligand
in the protein binding site and in bulk solvent. ∆∆𝐺𝑡,𝑟 is the free energy change
associated with the translational and rotational restraints placed on the ligand in the
protein binding site. ∆𝐺𝑏𝑖𝑛𝑑𝑜 is the calculated standard ABFE, which is compared to the
experimental ABFE (∆𝐺𝑒𝑥𝑝).
∆𝐺𝑏𝑖𝑛𝑑𝑜 = ∆𝐺𝑖𝑛𝑡
ℎ𝑦𝑑𝑟− ∆𝐺𝑖𝑛𝑡
𝑠𝑖𝑡𝑒 − ∆∆𝐺𝑐𝑜𝑛𝑓 − ∆∆𝐺𝑡,𝑟
∆𝐆𝐢𝐧𝐭𝐬𝐢𝐭𝐞 ∆𝐆𝐢𝐧𝐭
𝐡𝐲𝐝𝐫 ∆∆𝐆𝐜𝐨𝐧𝐟 ∆∆𝐆𝐭,𝐫 ∆𝐆𝐛𝐢𝐧𝐝
𝐨 ∆𝐆𝐞𝐱𝐩
-72.1 ± 2.0 -60.8 ± 0.8 7.4 ± 1.9 0.2 ± 0.4 -3.1 ± 1.8 -6.5 ± 0.3
All energies in kcal/mol
The calculated ∆𝐺𝑏𝑖𝑛𝑑
𝑜 for the S2 site was -7.8 ± 1.4 kcal/mol and is more
comparable to the experimental binding free energy of -6.5 ± 0.3 kcal/mol (Table 4.5)
Therefore the free energy calculations support SM11 binding in S2. The SERT crystal
structure co-crystalized with citalopram in the S2 site was superposed with the binding of
SM11 in S2 and the binding interactions within the SERT homology model were similar
to those seen in the crystal structure.
Table 4.5: ABFE calculations of SM11 in the S2 binding site in SERT performed using
NAMD following the protocol outlined by Gumbart et al.17 ∆𝐺𝑖𝑛𝑡𝑠𝑖𝑡𝑒 is the binding free
energy associated with intermolecular interactions of the ligand in the binding site.
∆𝐺𝑖𝑛𝑡ℎ𝑦𝑑𝑟
is the binding free energy associated with the ligand in bulk solvent. ∆∆𝐺𝑐𝑜𝑛𝑓 is
the change in conformational free energy associated with the harmonic restraints applied
to the ligand in the protein binding site and in bulk solvent. ∆∆𝐺𝑡,𝑟 is the free energy
change associated with the translational and rotational restraints placed on the ligand in
the protein binding site. ∆𝐺𝑏𝑖𝑛𝑑𝑜 is the calculated standard ABFE, which is compared to
the experimental ABFE (∆𝐺𝑒𝑥𝑝).
∆𝐺𝑏𝑖𝑛𝑑𝑜 = ∆𝐺𝑖𝑛𝑡
ℎ𝑦𝑑𝑟− ∆𝐺𝑖𝑛𝑡
𝑠𝑖𝑡𝑒 − ∆∆𝐺𝑐𝑜𝑛𝑓 − ∆∆𝐺𝑡,𝑟
∆𝐆𝐢𝐧𝐭𝐬𝐢𝐭𝐞 ∆𝐆𝐢𝐧𝐭
𝐡𝐲𝐝𝐫 ∆∆𝐆𝐜𝐨𝐧𝐟 ∆∆𝐆𝐭,𝐫 ∆𝐆𝐛𝐢𝐧𝐝
𝐨 ∆𝐆𝐞𝐱𝐩
-55.5 ± 0.6 -34.8 ± 1.2 5.7 ± 0.0 7.3 ± 0.0 -7.8 ± 1.4 -6.5 ± 0.3
All energies in kcal/mol

106
4.2.3 Measuring affinity of SERT inhibitors
The competitive membrane binding assay was performed to measure the affinity
of SERT inhibitors. A serial dilution of citalopram in binding buffer was prepared from
10 µM to 1nM and incubated with HEK293-hSERT membranes and [125I]-RTI-55 with
paroxetine (10 µM) used for non- specific binding. The affinity of citalopram was
determined, in triplicate, to be 𝐾𝑖 = 2.4 ± 1.2 nM, and is comparable to the previously
measured experimental affinity of 1.4 nM (Figure 4.3).29
Figure 4.3: Competitive membrane binding assay used to determine the affinity (𝐾𝑖) of
citalopram for SERT using the HEK293-hSERT cell line. Serial dilution of citalopram
was prepared from 10μM to 1 nM and incubated with HEK293-hSERT membranes and
[125I]-RTI-55. Paroxetine (10 µM) was used for non- specific binding.

107
The affinity of SM11 for SERT was determined using the competitive membrane
binding assay. The average 𝐾𝑖 value of 17 ± 7 µM14 was then converted to ∆𝐺𝑒𝑥𝑝𝑜 =
−6.5 ± 0.3 kcal/mol (Figure 4.4).
Figure 4.4: Competitive membrane binding assay of SM11 in HEK293-hSERT cell line.
The affinity (𝐾𝑖) was determined by SM11’s ability to competitively bind with SERT
against [125I]-RTI-55. Experimental affinity of SM11 for SERT was 17 ± 7 µM.14
SM11 had been assumed to prefer the S2 binding site of SERT because the
compound was found by S2 pocket virtual screening of a structural library of small
molecules. The ABFE calculations were applied to both S1 and S2 binding sites to
compare the calculated binding free energy of SM11 to experimental measurements of
binding free energy. The calculations support SM11 binding in the S2 site and not in the
S1 site of SERT. Evaluation of SM11 binding in the S2 site suggests an opportunity to
improve interactions with SERT residues, such as a potential hydrogen bond with Glu493
(Figure 4.5). Several analogs have been proposed as modifications to SM11 that would
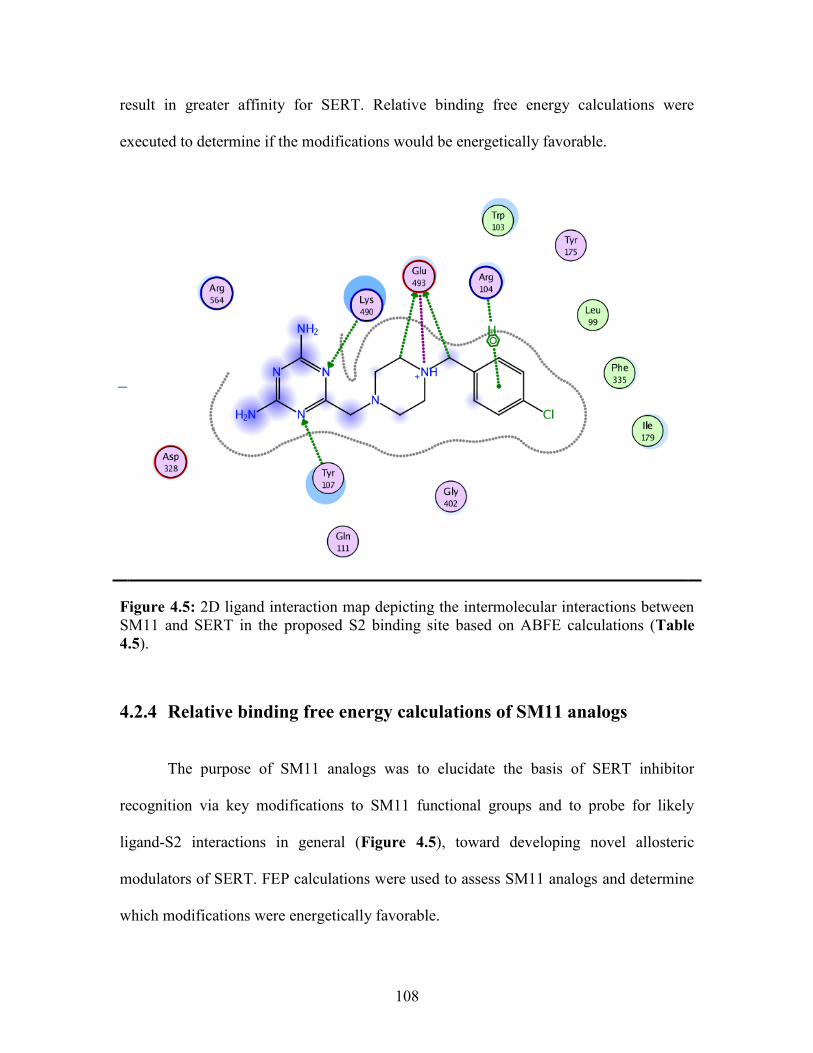
108
result in greater affinity for SERT. Relative binding free energy calculations were
executed to determine if the modifications would be energetically favorable.
Figure 4.5: 2D ligand interaction map depicting the intermolecular interactions between
SM11 and SERT in the proposed S2 binding site based on ABFE calculations (Table
4.5).
4.2.4 Relative binding free energy calculations of SM11 analogs
The purpose of SM11 analogs was to elucidate the basis of SERT inhibitor
recognition via key modifications to SM11 functional groups and to probe for likely
ligand-S2 interactions in general (Figure 4.5), toward developing novel allosteric
modulators of SERT. FEP calculations were used to assess SM11 analogs and determine
which modifications were energetically favorable.
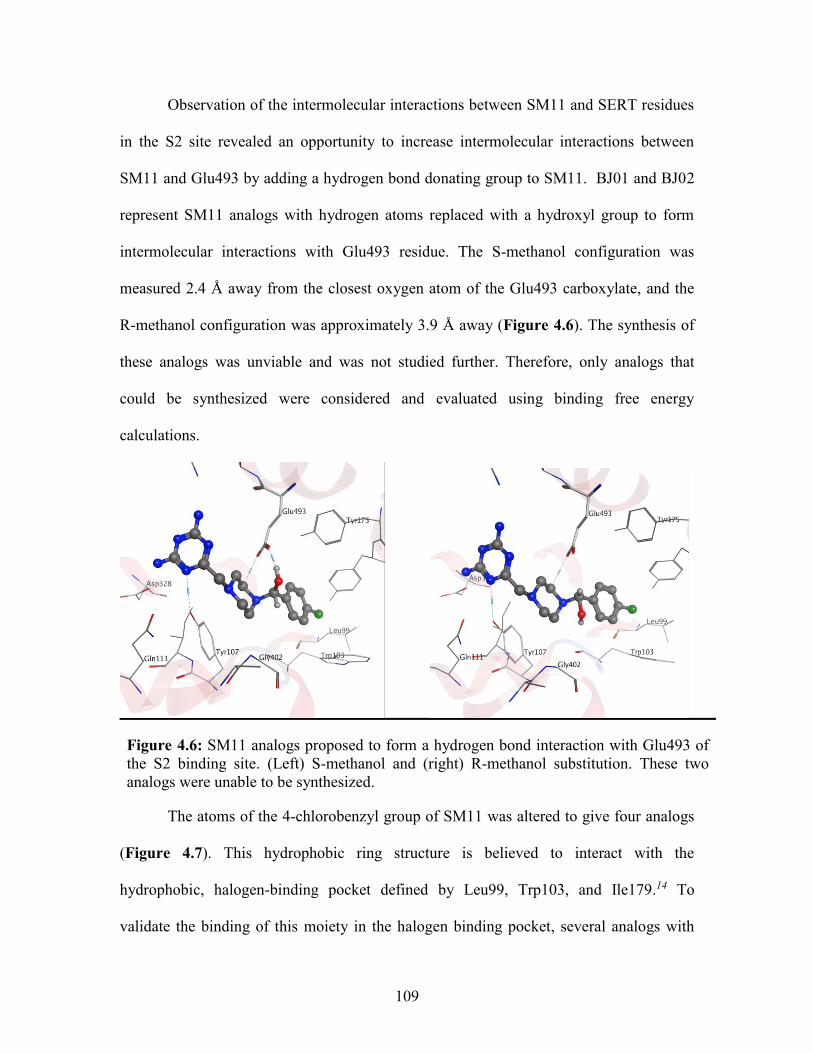
109
Observation of the intermolecular interactions between SM11 and SERT residues
in the S2 site revealed an opportunity to increase intermolecular interactions between
SM11 and Glu493 by adding a hydrogen bond donating group to SM11. BJ01 and BJ02
represent SM11 analogs with hydrogen atoms replaced with a hydroxyl group to form
intermolecular interactions with Glu493 residue. The S-methanol configuration was
measured 2.4 Å away from the closest oxygen atom of the Glu493 carboxylate, and the
R-methanol configuration was approximately 3.9 Å away (Figure 4.6). The synthesis of
these analogs was unviable and was not studied further. Therefore, only analogs that
could be synthesized were considered and evaluated using binding free energy
calculations.
Figure 4.6: SM11 analogs proposed to form a hydrogen bond interaction with Glu493 of
the S2 binding site. (Left) S-methanol and (right) R-methanol substitution. These two
analogs were unable to be synthesized.
The atoms of the 4-chlorobenzyl group of SM11 was altered to give four analogs
(Figure 4.7). This hydrophobic ring structure is believed to interact with the
hydrophobic, halogen-binding pocket defined by Leu99, Trp103, and Ile179.14 To
validate the binding of this moiety in the halogen binding pocket, several analogs with
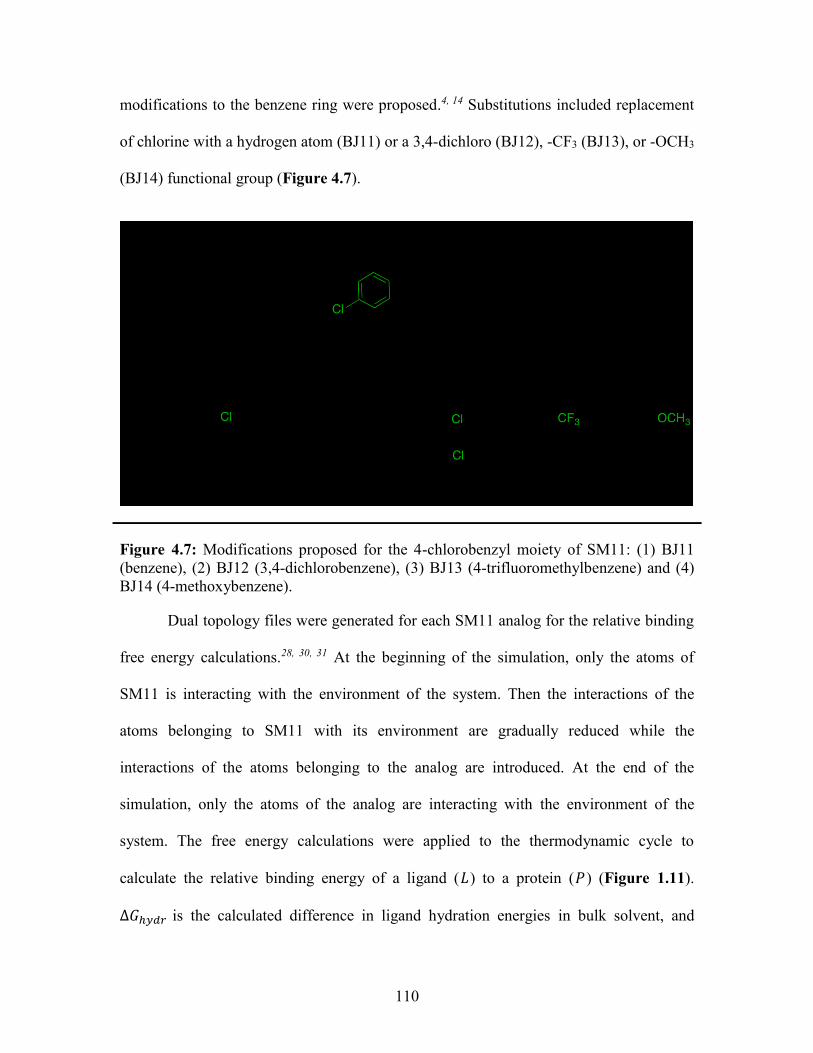
110
modifications to the benzene ring were proposed.4, 14 Substitutions included replacement
of chlorine with a hydrogen atom (BJ11) or a 3,4-dichloro (BJ12), -CF3 (BJ13), or -OCH3
(BJ14) functional group (Figure 4.7).
Figure 4.7: Modifications proposed for the 4-chlorobenzyl moiety of SM11: (1) BJ11
(benzene), (2) BJ12 (3,4-dichlorobenzene), (3) BJ13 (4-trifluoromethylbenzene) and (4)
BJ14 (4-methoxybenzene).
Dual topology files were generated for each SM11 analog for the relative binding
free energy calculations.28, 30, 31 At the beginning of the simulation, only the atoms of
SM11 is interacting with the environment of the system. Then the interactions of the
atoms belonging to SM11 with its environment are gradually reduced while the
interactions of the atoms belonging to the analog are introduced. At the end of the
simulation, only the atoms of the analog are interacting with the environment of the
system. The free energy calculations were applied to the thermodynamic cycle to
calculate the relative binding energy of a ligand (𝐿) to a protein (𝑃) (Figure 1.11).
∆𝐺ℎ𝑦𝑑𝑟 is the calculated difference in ligand hydration energies in bulk solvent, and
111
∆𝐺𝑠𝑖𝑡𝑒 is the difference in ligand binding energies in a solvated protein-ligand complex
(𝑃: 𝐿). The difference between these two values represents the relative change in binding
free energy ( ∆∆𝐺 ), which is used to determine if the atomic transformation is
energetically favorable.31-33
Relative free energy calculations were applied to SM11 to calculate the relative
change in free energy based on the modified structural group. Several analogs of SM11
were proposed to improve the interactions of SM11 in S2. The relative binding free
energy calculations were performed to determine if the proposed modifications would be
energetically favorable. Results from these calculations helped to determine which atom
modifications would play a key role in improving the SM11 binding in SERT. SM11
analogs were purchased or synthesized to validate the computational calculations using
experimental measurements of the ligand’s affinity for SERT. Table 4.6 summarizes the
results of the relative binding free energy calculations.
Table 4.6: RBFE (∆∆𝐺) calculation of SM11 analogs in SERT. The change in binding
free energy was calculated for modifying SM11 to one of the new ligands in SERT
(Figure 4.7). ∆𝐺𝑠𝑖𝑡𝑒 is the change in binding free energy associated with intermolecular
interactions of the ligand in the binding site. ∆𝐺ℎ𝑦𝑑𝑟 is the change in free energy
associated with the ligand in bulk solvent.
∆∆𝐺 = ∆𝐺𝑠𝑖𝑡𝑒 − ∆𝐺ℎ𝑦𝑑𝑟
Ligand ∆Ghydr ∆Gsite ∆∆G
BJ11 2.4 ± 0.2 5.2 ± 0.2 2.8 ± 0.3
BJ12 (pose A) 12.7 ± 0.3 0.6 ± 0.2 -12.1 ± 0.4
BJ12 (pose B) 12.7 ± 0.3 0.4 ± 0.2 -12.3 ± 0.4
BJ13 30.9 ± 0.3 32.5 ± 0.3 -1.6 ± 0.4
BJ14 -7.7 ± 0.2 -5.0 ± 0.3 -12.7 ± 0.4
All energies in kcal/mol
The ∆∆𝐺 calculations for BJ11 resulted in a significant reduction in interaction
energy at the binding site. The calculated relative binding free energy was supported by
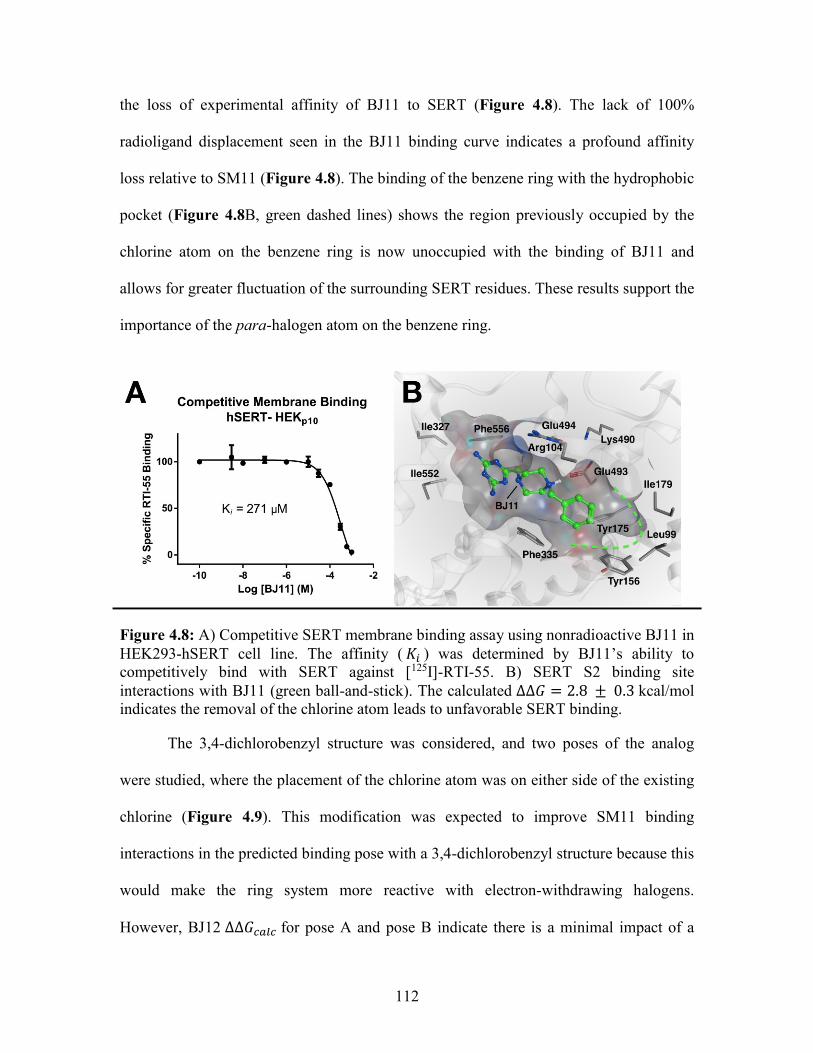
112
the loss of experimental affinity of BJ11 to SERT (Figure 4.8). The lack of 100%
radioligand displacement seen in the BJ11 binding curve indicates a profound affinity
loss relative to SM11 (Figure 4.8). The binding of the benzene ring with the hydrophobic
pocket (Figure 4.8B, green dashed lines) shows the region previously occupied by the
chlorine atom on the benzene ring is now unoccupied with the binding of BJ11 and
allows for greater fluctuation of the surrounding SERT residues. These results support the
importance of the para-halogen atom on the benzene ring.
Figure 4.8: A) Competitive SERT membrane binding assay using nonradioactive BJ11 in
HEK293-hSERT cell line. The affinity ( 𝐾𝑖 ) was determined by BJ11’s ability to
competitively bind with SERT against [125I]-RTI-55. B) SERT S2 binding site
interactions with BJ11 (green ball-and-stick). The calculated ∆∆𝐺 = 2.8 ± 0.3 kcal/mol
indicates the removal of the chlorine atom leads to unfavorable SERT binding.
The 3,4-dichlorobenzyl structure was considered, and two poses of the analog
were studied, where the placement of the chlorine atom was on either side of the existing
chlorine (Figure 4.9). This modification was expected to improve SM11 binding
interactions in the predicted binding pose with a 3,4-dichlorobenzyl structure because this
would make the ring system more reactive with electron-withdrawing halogens.
However, BJ12 ∆∆𝐺𝑐𝑎𝑙𝑐 for pose A and pose B indicate there is a minimal impact of a

113
3,4-dichloro modification in the binding site (pose A, ∆𝐺ℎ𝑦𝑑𝑟 = 0.6 ± 0.2 kcal/mol and
pose B, ∆𝐺ℎ𝑦𝑑𝑟 = 0.4 ± 0.2 kcal/mol). There appears to be a potential driving factor that
could force the ligand out of solution and into the binding site. ∆∆𝐺 = -12.1 ± 0.4
kcal/mol and -12.3 ± 0.4 kcal/mol indicates BJ12 is an energetically favorable
modifications.
Figure 4.9: SERT S2 binding site interactions with BJ12. The rotation of 3, 4
chlorobenzyl moiety is labeled pose A and B (orange). The calculated ∆∆𝐺 = −12.1 ± 0.4 kcal/mol (pose A) and = −12.3 ± 0.4 kcal/mol (pose B).
The trifluoromethyl substitution to the benzene ring has an increased
electronegativity and is expected to be more electron withdrawing from the ring. The
relative binding free energy change calculated for BJ13 suggested that the trifluoromethyl
addition would be a favorable modification. However, the ∆∆𝐺 was less favorable than
the ∆∆𝐺 for BJ12A, BJ12B, and BJ14. The ∆∆𝐺 = -1.6 ± 0.4kcal/mol suggests the
trifluoromethyl modification of BJ13 would result in similar binding affinity to SM11.
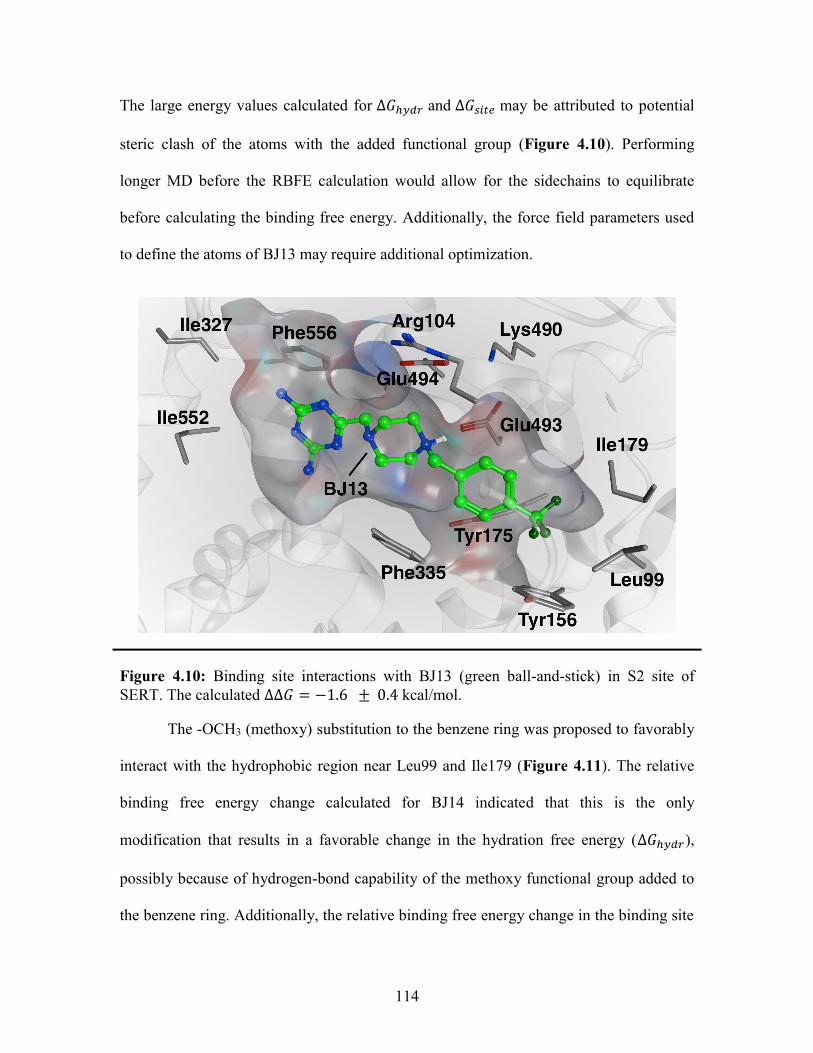
114
The large energy values calculated for ∆𝐺ℎ𝑦𝑑𝑟 and ∆𝐺𝑠𝑖𝑡𝑒 may be attributed to potential
steric clash of the atoms with the added functional group (Figure 4.10). Performing
longer MD before the RBFE calculation would allow for the sidechains to equilibrate
before calculating the binding free energy. Additionally, the force field parameters used
to define the atoms of BJ13 may require additional optimization.
Figure 4.10: Binding site interactions with BJ13 (green ball-and-stick) in S2 site of
SERT. The calculated ∆∆𝐺 = −1.6 ± 0.4 kcal/mol.
The -OCH3 (methoxy) substitution to the benzene ring was proposed to favorably
interact with the hydrophobic region near Leu99 and Ile179 (Figure 4.11). The relative
binding free energy change calculated for BJ14 indicated that this is the only
modification that results in a favorable change in the hydration free energy (∆𝐺ℎ𝑦𝑑𝑟),
possibly because of hydrogen-bond capability of the methoxy functional group added to
the benzene ring. Additionally, the relative binding free energy change in the binding site
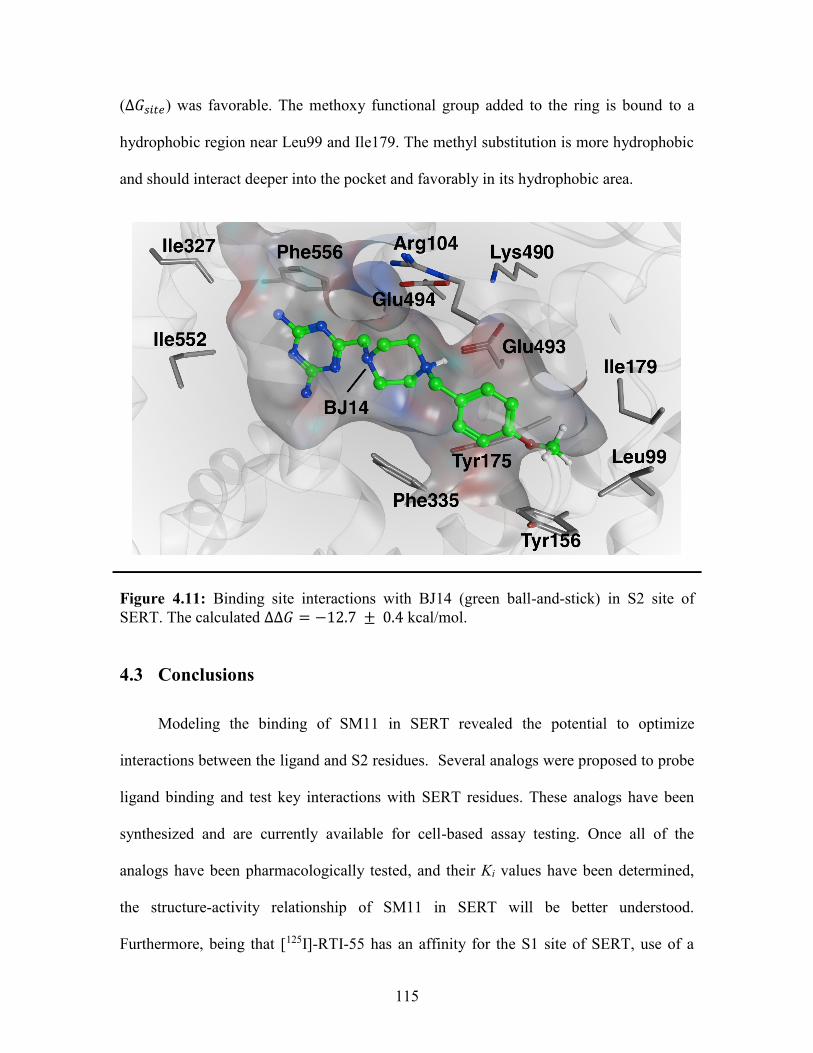
115
(∆𝐺𝑠𝑖𝑡𝑒) was favorable. The methoxy functional group added to the ring is bound to a
hydrophobic region near Leu99 and Ile179. The methyl substitution is more hydrophobic
and should interact deeper into the pocket and favorably in its hydrophobic area.
Figure 4.11: Binding site interactions with BJ14 (green ball-and-stick) in S2 site of
SERT. The calculated ∆∆𝐺 = −12.7 ± 0.4 kcal/mol.
4.3 Conclusions
Modeling the binding of SM11 in SERT revealed the potential to optimize
interactions between the ligand and S2 residues. Several analogs were proposed to probe
ligand binding and test key interactions with SERT residues. These analogs have been
synthesized and are currently available for cell-based assay testing. Once all of the
analogs have been pharmacologically tested, and their Ki values have been determined,
the structure-activity relationship of SM11 in SERT will be better understood.
Furthermore, being that [125I]-RTI-55 has an affinity for the S1 site of SERT, use of a

116
radioligand with an affinity for the S2 site of SERT would offer more accurate insight
into the ligand’s ability to compete for binding in the transporter.
It should be noted that the crystal structure of TCAs and SSRIs in the S2 site of
LeuT may not represent similar antidepressant binding in SERT based on later studies.34
However modeling the binding of R-fluoxetine in the S2 site of SERT based on the LeuT
crystal structure (PDB entry 3GWV) can offer insight into the allosteric binding site
interactions in SERT. Furthermore, the recent crystal structure of SERT with S-
citalopram (PDB entry 5I73) shows two inhibitor molecules bound to the S1 and S2
binding sites of SERT, indicating there is a possibility for a second molecule to occupy
both the allosteric site and the primary binding site. Additionally, applying the ABFE
calculations to S-citalopram in both binding sites would determine if a direct correlation
exists between the measured affinity and approach used to calculate ABFE of the
inhibitors. For future work, running longer MD equilibration before calculating the
binding free energy should be considered to reduce statistical error and improve
convergence.
4.4 References
1. Best, J., Nijhout, H. F., and Reed, M. (2011) Bursts and the Efficacy of Selective
Serotonin Reuptake Inhibitors. Pharmacopsychiatry 44, S76-S83.
2. Lemonde, S., Turecki, G., Bakish, D., Du, L., Hrdina, P. D., Bown, C. D., Sequeira,
A., Kushwaha, N., Morris, S. J., Basak, A., Ou, X.-M., and Albert, P. R. (2003) Impaired
Repression at a 5-Hydroxytryptamine 1A Receptor Gene Polymorphism Associated with
Major Depression and Suicide. J Neurosci 23, 8788-8799.
3. von Wolff, A., Holzel, L. P., Westphal, A., Harter, M., and Kriston, L. (2013)
Selective serotonin reuptake inhibitors and tricyclic antidepressants in the acute treatment
of chronic depression and dysthymia: a systematic review and meta-analysis. J Affect
Disord 144, 7-15.

117
4. Zhou, Z., Zhen, J., Karpowich, N. K., Law, C. J., Reith, M. E. a., and Wang, D.-n. N.
(2009) Antidepressant specificity of serotonin transporter suggested by three LeuT-SSRI
structures. Nat Struct Mol Biol 16, 652-657.
5. Hanson, N. D., Owens, M. J., and Nemeroff, C. B. (2011) Depression, antidepressants,
and neurogenesis: a critical reappraisal. Neuropsychopharmacology 36, 2589-2602.
6. Owens, M. J., Knight, D. L., and Nemeroff, C. B. (2001) Second-generation SSRIs:
human monoamine transporter binding profile of escitalopram and R-fluoxetine. Biol
Psychiatry 50, 345-350.
7. Owens, M. J., Morgan, W. N., Plott, S. J., and Nemeroff, C. B. (1997)
Neurotransmitter receptor and transporter binding profile of antidepressants and their
metabolites. J Pharmacol Exp Ther 283, 1305-1322.
8. Kos, T., Popik, P., Pietraszek, M., Schafer, D., Danysz, W., Dravolina, O., Blokhina,
E., Galankin, T., and Bespalov, A. Y. (2006) Effect of 5-HT3 receptor antagonist MDL
72222 on behaviors induced by ketamine in rats and mice. Eur Neuropsychopharmacol
16, 297-310.
9. Kristensen, A. S., Andersen, J., Jorgensen, T. N., Sorensen, L., Eriksen, J., Loland, C.
J., Stromgaard, K., and Gether, U. (2011) SLC6 neurotransmitter transporters: structure,
function, and regulation. Pharmacol Rev 63, 585-640.
10. Pramod, A. B., Foster, J., Carvelli, L., and Henry, L. K. (2013) SLC6 transporters:
structure, function, regulation, disease association and therapeutics. Mol Aspects Med 34,
197-219.
11. Bisha, I., and Magistrato, A. (2016) The molecular mechanism of secondary sodium
symporters elucidated through the lens of the computational microscope. RSC Adv 6,
9522-9540.
12. Singh, S. K., Yamashita, A., and Gouaux, E. (2007) Antidepressant binding site in a
bacterial homologue of neurotransmitter transporters. Nature 448, 952-956.
13. Zhou, Z., Zhen, J., Karpowich, N. K., Goetz, R. M., Law, C. J., Reith, M. E. A., and
Wang, D.-N. N. (2007) LeuT-desipramine structure reveals how antidepressants block
neurotransmitter reuptake. Science 317, 1390-1393.
14. Manepalli, S., Geffert, L. M., Surratt, C. K., and Madura, J. D. (2011) Discovery of
novel selective serotonin reuptake inhibitors through development of a protein-based
pharmacophore. J Chem Inf Model 51, 2417-2426.
15. General, I. J., Dragomirova, R., and Meirovitch, H. (2012) Absolute free energy of
binding of avidin/biotin, revisited. J Phys Chem B 116, 6628-6636.
118
16. Genheden, S. (2012) Are homology models sufficiently good for free-energy
simulations? J Chem Inf Model 52, 3013-3021.
17. Gumbart, J. C., Roux, B., and Chipot, C. (2013) Standard binding free energies from
computer simulations: What is the best strategy? J Chem Theory Comput 9, 794-802.
18. Jo, S., Jiang, W., Lee, H. S., Roux, B., and Im, W. (2013) CHARMM-GUI Ligand
Binder for Absolute Binding Free Energy Calculations and Its Application. J Chem Inf
Model 53, 267-277.
19. Soderhjelm, P., Tribello, G. A., and Parrinello, M. (2012) Locating binding poses in
protein-ligand systems using reconnaissance metadynamics. Proc Natl Acad Sci U S A
109, 5170-5175.
20. Singh, S. K., Piscitelli, C. L., Yamashita, A., and Gouaux, E. (2008) A competitive
inhibitor traps LeuT in an open-to-out conformation. Science 322, 1655-1661.
21. Jorgensen, W. L. (2009) Efficient drug lead discovery and optimization. Acc Chem
Res 42, 724-733.
22. Kim, J. T., Hamilton, A. D., Bailey, C. M., Domaoal, R. a., Domoal, R. a., Wang, L.,
Anderson, K. S., and Jorgensen, W. L. (2006) FEP-guided selection of bicyclic
heterocycles in lead optimization for non-nucleoside inhibitors of HIV-1 reverse
transcriptase. J Am Chem Soc 128, 15372-15373.
23. Ruiz-Caro, J., Basavapathruni, A., Kim, J. T., Bailey, C. M., Wang, L., Anderson, K.
S., Hamilton, A. D., and Jorgensen, W. L. (2006) Optimization of diarylamines as non-
nucleoside inhibitors of HIV-1 reverse transcriptase. Bioorg Med Chem Lett 16, 668-671.
24. Jorgensen, W. L. (1982) Revised TIPS for simulations of liquid water and aqueous
solutions. J Chem Phys 77, 4156-4163.
25. Jorgensen, W. L., and Madura, J. D. (1985) Temperature and size dependence for
Monte Carlo simulations of TIP4P water. Mol Phys 56, 1381-1392.
26. Best, R. B., Zhu, X., Shim, J., Lopes, P. E., Mittal, J., Feig, M., and Mackerell, A. D.,
Jr. (2012) Optimization of the additive CHARMM all-atom protein force field targeting
improved sampling of the backbone phi, psi and side-chain chi(1) and chi(2) dihedral
angles. J Chem Theory Comput 8, 3257-3273.
27. Liu, P., Dehez, F., Cai, W., and Chipot, C. (2012) A Toolkit for the Analysis of Free-
Energy Perturbation Calculations. J Chem Theory Comput 8, 2606-2616.
28. Jorgensen, W. L., and Ravimohan, C. (1985) Monte Carlo simulation of differences
in free energies of hydration. J Chem Phys 83, 3050-3054.
119
29. Goodman, L. S., Brunton, L., Chabner, B., and Knollman, B. (2011) Goodman and
Gilman's The Pharmacological Basis of Therapeutics, 12th ed., New York: McGraw-
Hill, 2011.
30. Reddy, M. R., Viswanadhan, V. N., and Weinstein, J. N. (1991) Relative differences
in the binding free energies of human immunodeficiency virus 1 protease inhibitors: a
thermodynamic cycle-perturbation approach. Proc Natl Acad Sci U S A 88, 10287-10291.
31. Miyamoto, S., and Kollman, P. A. (1993) Absolute and relative binding free energy
calculations of the interaction of biotin and its analogs with streptavidin using molecular
dynamics/free energy perturbation approaches. Proteins 16, 226-245.
32. Mobley, D. L., Chodera, J. D., and Dill, K. a. (2006) On the use of orientational
restraints and symmetry corrections in alchemical free energy calculations. J Chem Phys
125, 084902.
33. Mobley, D. L., and Klimovich, P. V. (2012) Perspective: Alchemical free energy
calculations for drug discovery. J Chem Phys 137, 230901.
34. Sinning, S., Musgaard, M., Jensen, M., Severinsen, K., Celik, L., Koldsø, H., Meyer,
T., Bols, M., Jensen, H. H., Schiøtt, B., and Wiborg, O. (2010) Binding and orientation of
tricyclic antidepressants within the central substrate site of the human serotonin
transporter. J Biol Chem 285, 8363-8374.
120
CHAPTER 5
5 FUTURE DIRECTIONS
5.1 Modeling the binding of DAT inhibitors
All-atom molecular dynamics simulations were previously employed to evaluate
the DAT structural changes caused by inhibitor binding. The next step of this project
involves applying an enhanced sampling method to capture the distinct conformational
changes of DAT that are stabilized by inhibitor binding.1 This project aims to gain a
deeper understanding of DAT structural changes and the interactions responsible for
inhibitor binding and disruption of substrate uptake. Results from this study can aid in the
development of novel therapeutics to treat, various psychological disorders, such as
psychostimulant addiction, Parkinson’s disease, and depression.2-12

121
Figure 5.1: 2-substituted aryltropane cocaine analogs to study in future simulations with
DAT using an accelerated MD method.1, 13 The ligand modifications have been studied in
vitro and in vivo by Hong et al. The ligands would be simulated in the OF and IF DAT
conformations followed by structural analysis of the transporter.
The next step in this research project can apply an accelerated MD (aMD) method,
such as Gaussian accelerated molecular dynamics (GaMD), with additional cocaine
analogs (2β-(4-XPh)-(4-YPh)-COCH2-3β-4-R-Ph and 2α-(4-XPh)-(4-YPh)-COCH
2-3β-
4-R-Ph) of those that were previously tested (Figure 5.1).13
The advantage of aMD is the ability to run longer timescale simulations that will
allow for more sampling of the system’s degrees of freedom.1, 14 GaMD enhances the
conformational sampling by adding a harmonic boost potential to the potential energy
surface. The GaMD can be performed with a “dual-boost” to both the dihedral and total
potential energetic terms following the protocol outlined by Pang et al.1 The LX10 and
LX11 systems can also be subjected to an additional 100 ns of GaMD using NAMD 2.11,
starting from the previous coordinates that were simulated for 100 ns using classical
molecular dynamics.
122
In the absence of a DAT co-crystal structure bound to the cocaine analogs,
performing GaMD simulations of DAT bound to additional cocaine analogs will reveal
details of the discrete conformational changes in DAT and the intermolecular
interactions that stabilize either the outward- or inward-facing conformation of DAT
(Figure 5.1).1, 13-15 Applying GaMD for enhanced sampling of DAT will aid to create
an accurate reference frame for the protein-ligand systems.16-21
Additionally, the coordinates from the GaMD simulations can be used in future
binding free energy calculations of cocaine, benztropine, and the additional cocaine
analogs in the DAT homology models. Performing the absolute binding free energy
calculations of distinct conformations of the transporter should correlate with the
experimental affinity of the inhibitors for DAT if the inhibitors can form the favorable
interactions contributing to DAT affinity.22-26 The observed molecular interactions within
the transporter can potentially lead to a class of high affinity DAT inhibitors that can bind
similarly to cocaine while resulting in behavioral effects that differ from cocaine.15, 27
5.2 Lead optimization of a SERT inhibitor
Performing the competitive membrane binding assay will validate the relative
binding free energy calculations for modifications made SM11 (Figure 5.2, analogs 1-4).
The calculated relative binding free energies can be compared to the experimental affinity
measurements of both ligands,
∆∆𝐺(𝐿𝑥 → 𝐿𝑦) = 𝑅𝑇𝑙𝑛 (𝐾
𝑖
𝐿𝑦
𝐾𝑖𝐿𝑥
) (5.1)

123
where 𝐾𝑖𝐿𝑥 and 𝐾
𝑖
𝐿𝑦 are the respective affinity measurements for each ligand to the target.
The competitive membrane-binding assay will validate the relative binding free energy
calculations.
Binding interactions of SM11 can be optimized for the S2 binding site by functional
group replacements. The 4-6-piperazine functional and 1,3,5-triazine-2,4-diamine groups
of SM11 can be modified to probe the interactions of the ligand in the binding site
(Figure 5.2).
124
Figure 5.2: Proposed modifications to SM11 for future analogs. 1) benzene; 2) 3,4-
dichloro; 3) 4-(trifluoromethyl)benzene; 4) 4-methoxybenzene; 5-6) 4-6-piperidine; 7)
benzene-2,4-diamine; 8) pyrimidine-2,4-diamine; 9) pyrimidine-4,6-diamine; 10) 4-
(aminomethyl)-1,3,5-triazin-2-amine.
Modifying the 6-4-piperazine (Figure 5.2, analogs 5-6). This structure contains two
tertiary amines in its ring system. Only one of the two tertiary amines will be protonated
and capable of ionic or ion-dipole interaction with a SERT residue. The ionized amine
will be able to interact favorably with the side-chain of Glu493 and will be the most

125
significant interaction for the ligand binding. To determine which of the tertiary amines
should be protonated upon drug binding, the two proposed analogs (5-6) will determine
which would be more favorable. The first tertiary amine would be replaced with CH (5)
forcing the other amine to become positively charged. Then the second amine will be
replaced with CH (6), and comparison of the two binding affinities will help determine
which tertiary amine is involved in the ionic interaction. This will increase the
concentration of the bioactive molecule, which should result in increased potency. This
will also support the ionic interaction with the Glu493 side-chain.
Modifying the 1,3,5-triazine-2,4-diamine (Figure 5.2, analogs 7-10). This structure is
capable of forming several hydrogen bond interactions within the S2 binding pocket
(Figure 4.5). The proposed binding pose shows that one of the two amine functional
groups attached to the ring is interacting as a hydrogen bond donor to the side-chain of
the Gln111 residue. This heterocyclic ring also contains π-electrons. One interaction that
could occur between SM11 and SERT is the formation of cation-π interactions with the
protonated side-chain of Lys490. Additionally, the side-chain of Tyr107, which also
contains π-electrons, could form a π-π stacking interaction between the ring systems. A
benzene substitution analog (7) could test the π –bonding interactions with these
residues. The π- electrons should interact similarly to the lead compound; however, there
is a loss of hydrogen bond-accepting capability with the removal of the heterocyclic
nitrogen atoms. This change may result in lower binding affinity, which could indicate
that one or more the nitrogen atoms are interacting as a hydrogen bond acceptor. To test

126
if the heterocyclic nitrogen atoms are involved in hydrogen bonding, each nitrogen atom
should be replaced with a carbon atom (7-9) in separate analogs to see how binding
affinity is affected. With an understanding of the structure-activity relationship of the
1,3,5-triazine-2,4-diamine ring, there is an opportunity to improve the binding of this ring
system. By performing a chain extension (10) with the amine functional groups, this will
introduce an ionizable functional group. In addition to the interactions that are present,
there is an opportunity to introduce new interaction with the ionized side-chain of
Asp328. Improved binding affinity of this analog will validate the proposed binding
interactions and introduce a new favorable interaction, making SM11 a stronger inhibitor
of SERT.
Once the functional groups that are key to SM11 binding in SERT have been
determined, the design of new molecules can proceed to find a new candidate with
improved binding interactions with SERT residues. The completion of this study will
elucidate the S2 binding pocket of SERT and allow for development of new SSRIs with
high affinity to inhibit the protein at the allosteric site.
5.3 References
1. Pang, Y. T., Miao, Y., Wang, Y., and Mccammon, J. A. (2016) Gaussian Accelerated
Molecular Dynamics in NAMD. J Chem Theory Comput 13, 9-19.
2. Wang, C., Jiang, Y., Ma, J., Wu, H., Wacker, D., Katritch, V., Han, G. W., Liu, W.,
Huang, X. P., Vardy, E., McCorvy, J. D., Gao, X., Zhou, X. E., Melcher, K., Zhang, C.,
Bai, F., Yang, H., Yang, L., Jiang, H., Roth, B. L., Cherezov, V., Stevens, R. C., and Xu,
H. E. (2013) Structural basis for molecular recognition at serotonin receptors. Science
340, 610-614.
3. Wang, H., Goehring, A., Wang, K. H., Penmatsa, A., Ressler, R., and Gouaux, E.
(2013) Structural basis for action by diverse antidepressants on biogenic amine
transporters. Nature 503, 141-145.

127
4. Wang, K. H., Penmatsa, A., and Gouaux, E. (2015) Neurotransmitter and
psychostimulant recognition by the dopamine transporter. Nature 521, 322-327.
5. Andersen, J., Taboureau, O., Hansen, K. B., Olsen, L., Egebjerg, J., Stromgaard, K.,
and Kristensen, A. S. (2009) Location of the antidepressant binding site in the serotonin
transporter: importance of Ser-438 in recognition of citalopram and tricyclic
antidepressants. J Biol Chem 284, 10276-10284.
6. Andersen, J., Kristensen, A. S., Bang-Andersen, B., and Stromgaard, K. (2009) Recent
advances in the understanding of the interaction of antidepressant drugs with serotonin
and norepinephrine transporters. Chem Commun, 3677-3692.
7. Andersen, J., Olsen, L., Hansen, K. B., Taboureau, O., Jorgensen, F. S., Jorgensen, A.
M., Bang-Andersen, B., Egebjerg, J., Stromgaard, K., and Kristensen, A. S. (2010)
Mutational mapping and modeling of the binding site for (S)-citalopram in the human
serotonin transporter. J Biol Chem 285, 2051-2063.
8. Kristensen, A. S., Andersen, J., Jorgensen, T. N., Sorensen, L., Eriksen, J., Loland, C.
J., Stromgaard, K., and Gether, U. (2011) SLC6 neurotransmitter transporters: structure,
function, and regulation. Pharmacol Rev 63, 585-640.
9. Andersen, J., Stuhr-Hansen, N., Zachariassen, L., Toubro, S., Hansen, S. M. R.,
Eildal, J. N. N., Bond, A. D., Bogeso, K. P., Bang-Andersen, B., Kristensen, A. S.,
Stromgaard, K., Bøgesø, K. P., and Strømgaard, K. (2011) Molecular determinants for
selective recognition of antidepressants in the human serotonin and norepinephrine
transporters. Proc Natl Acad Sci U S A 108, 12137-12142.
10. Sørensen, L., Andersen, J., Thomsen, M., Hansen, S. M. R., Zhao, X., Sandelin, A.,
Strømgaard, K., and Kristensen, A. S. (2012) Interaction of antidepressants with the
serotonin and norepinephrine transporters: mutational studies of the S1 substrate binding
pocket. J Biol Chem 287, 43694-43707.
11. Andersen, J., Stuhr-Hansen, N., Zachariassen, L. G., Koldso, H., Schiott, B.,
Stromgaard, K., and Kristensen, A. S. (2014) Molecular basis for selective serotonin
reuptake inhibition by the antidepressant agent fluoxetine (Prozac). Mol Pharmacol 85,
703-714.
12. Andersen, J., Ladefoged, L. K., Wang, D., Kristensen, T. N., Bang-Andersen, B.,
Kristensen, A. S., Schiott, B., and Stromgaard, K. (2015) Binding of the multimodal
antidepressant drug vortioxetine to the human serotonin transporter. ACS Chem Neurosci
6, 1892-1900.
13. Hong, W. C., Kopajtic, T. A., Xu, L., Lomenzo, S. A., Jean, B., Madura, J. D.,
Surratt, C. K., Trudell, M. L., and Katz, J. L. (2016) 2-Substituted 3β-Aryltropane
Cocaine Analogs Produce Atypical DAT Inhibitor Effects Without Inducing Inward-
Facing DAT Conformations. J Pharmacol Exp Ther, 624-634.

128
14. Miao, Y., Feher, V. A., and McCammon, J. A. (2015) Gaussian Accelerated
Molecular Dynamics: Unconstrained Enhanced Sampling and Free Energy Calculation. J
Chem Theory Comput 11, 3584-3595.
15. Reith, M. E., Blough, B. E., Hong, W. C., Jones, K. T., Schmitt, K. C., Baumann, M.
H., Partilla, J. S., Rothman, R. B., and Katz, J. L. (2015) Behavioral, biological, and
chemical perspectives on atypical agents targeting the dopamine transporter. Drug
Alcohol Depend 147, 1-19.
16. Wang, J., Deng, Y., and Roux, B. (2006) Absolute binding free energy calculations
using molecular dynamics simulations with restraining potentials. Biophys J 91, 2798-
2814.
17. Koldso, H., Autzen, H. E., Grouleff, J., and Schiott, B. (2013) Ligand induced
conformational changes of the human serotonin transporter revealed by molecular
dynamics simulations. PLoS One 8, e63635.
18. Koldso, H., Noer, P., Grouleff, J., Autzen, H. E., Sinning, S., and Schiott, B. (2011)
Unbiased simulations reveal the inward-facing conformation of the human serotonin
transporter and Na(+) ion release. PLoS Comput Biol 7, e1002246.
19. General, I. J., Dragomirova, R., and Meirovitch, H. (2012) Absolute free energy of
binding of avidin/biotin, revisited. J Phys Chem B 116, 6628-6636.
20. General, I. J., Dragomirova, R., and Meirovitch, H. (2011) Calculation of the
Absolute Free Energy of Binding and Related Entropies with the HSMD-TI Method: The
FKBP12-L8 Complex. J Chem Theory Comput 7, 4196-4207.
21. Ho, B. K., and Agard, D. a. (2009) Probing the flexibility of large conformational
changes in protein structures through local perturbations. PLoS Comput Biol 5, e1000343.
22. Miyamoto, S., and Kollman, P. A. (1993) Absolute and relative binding free energy
calculations of the interaction of biotin and its analogs with streptavidin using molecular
dynamics/free energy perturbation approaches. Proteins 16, 226-245.
23. Jorgensen, A. M., Tagmose, L., Jorgensen, A. M., Bogeso, K. P., and Peters, G. H.
(2007) Molecular dynamics simulations of Na+/Cl(-)-dependent neurotransmitter
transporters in a membrane-aqueous system. ChemMedChem 2, 827-840.
24. Jorgensen, A. M., Tagmose, L., Jorgensen, A. M., Topiol, S., Sabio, M., Gundertofte,
K., Bogeso, K. P., and Peters, G. H. (2007) Homology modeling of the serotonin
transporter: insights into the primary escitalopram-binding site. ChemMedChem 2, 815-
826.

129
25. Jorgensen, W. L. (1989) Free energy calculations: a breakthrough for modeling
organic chemistry in solution. Acc Chem Res 22, 184-189.
26. Gumbart, J. C., Roux, B., and Chipot, C. (2013) Standard binding free energies from
computer simulations: What is the best strategy? J Chem Theory Comput 9, 794-802.
27. Rudnick, G., Kramer, R., Blakely, R. D., Murphy, D. L., and Verrey, F. (2014) The
SLC6 transporters: perspectives on structure, functions, regulation, and models for
transporter dysfunction. Pflugers Arch 466, 25-42.