modeling student choice of stem fields of study
TRANSCRIPT
This study is based on work supported by the Association for Institutional Research, the National Center for Education Statistics, the National Science Foundation, and the National Postsecondary Education Cooperative.
Modeling Student Choice of STEM Fields of Study:
Testing a Conceptual Framework of Motivation, High School Learning, and Postsecondary Context of Support
Xueli Wang
Department of Educational Leadership and Policy Analysis Wisconsin Center for the Advancement of Postsecondary Education
University of Wisconsin–Madison
February 2012
Address correspondence to:
Xueli Wang Department of Educational Leadership and Policy Analysis
University of Wisconsin–Madison 251 Education Building
1000 Bascom Mall Madison, WI 53706-1326
Phone: (608) 263-5451 E-mail: [email protected]
1
Abstract
This study draws upon social cognitive career theory and higher education literature to propose
and test a conceptual framework for understanding the selection of postsecondary STEM fields
of study by recent high school graduates who attend four-year institutions. Results suggest that
high school math achievement, exposure to math and science courses, and math self-efficacy
beliefs all affect students’ intent to major in STEM fields, which in turn influences entrance into
STEM majors. Entrance into STEM majors also is directly influenced by students’ high school
math achievement, graduate degree aspirations, and initial postsecondary experiences, such as
academic interaction, and financial aid receipt. Multiple-group structural equation modeling
analyses based on gender, race, and socioeconomic status indicate that the proposed theoretical
model fits the data well; however, the effects of high school math achievement and exposure to
math and science on students’ intent to major in STEM fields differ significantly among racial-
ethnic groups.
2
Introduction
Without question, America’s ability to maintain its global competitiveness within science,
technology, engineering, and mathematics (STEM) fields is an issue of national importance.
Often framed in the context of human capital (National Science Board, 2010), discussions of the
critical issues facing the nation’s STEM infrastructure center on a recognized need for building
STEM workforce capacity (National Academies 2005 "Rising Above the Gathering Storm"
Committee, 2010). Support for this cause has been levied through investments in educational
programming, many of which are focused on postsecondary education.
The demand for graduates in STEM fields continues to grow at a relatively rapid rate.
According to the National Science Foundation (2010), the employment rate in science and
engineering fields rose an average of 3.3% annually between 2004 and 2008 compared to an
average 1.3% annual increase in employment in all occupations. This estimated growth ratio is
consistent with long-term national trends but trails international increases (U.S. Department of
Labor, 2007). Meanwhile, the national demand for motivated high school graduates to enter
postsecondary STEM fields is at its highest, but high school seniors’ interest in and readiness for
STEM fields have been declining (ACT, 2006). American postsecondary institutions are
therefore facing an unprecedented need to increase the number of students who study in STEM
disciplines.
Although these rising calls have generated a fair amount of empirical interest, most research
centers on persistence and attainment among students who have already entered the STEM fields.
Not as much empirical attention has been paid to factors relevant to interest in, and entrance into,
STEM fields, which are arguably the first critical steps into the STEM pipeline. Given the
pressing national concerns facing STEM education, it is pivotal to provide rigorous academic
3
programs and support mechanisms that prepare students to enter these challenging and important
fields of postsecondary study. Needless to say, this educational endeavor will rely on collective,
concerted, and well-informed efforts by the nation’s secondary schools and postsecondary
institutions. As such, theoretically based work from a K-16 perspective is needed to better
understand boosters and barriers to students’ entrance into STEM fields of study. Towards that
end, this study proposes and tests a theoretical model of STEM participation that examines
factors shaping the decision to pursue STEM fields of study, using a nationally representative
sample of high school graduates from 2004. Particular attention also is given to the potentially
varying effects of high school and postsecondary factors by utilizing multiple-group structural
equation modeling analyses based on gender, race, and socioeconomic status (SES).
Background Literature and Theoretical Framework
Research on STEM Education
STEM education has garnered close scholarly attention. Numerous studies have revealed the
disproportionally high attrition rates for women and minorities and the bachelor’s degree
completion gap in STEM disciplines at four-year institutions across the nation (e.g., Anderson &
Kim, 2006; Higher Education Research Institute, 2010; Hilton & Lee, 1988; Huang & Brainard,
2001; Huang, Taddese, & Walter, 2000; Hughes, 2000; Seymour & Hewitt, 1997; Wyer, 2003).
In addition to the gender and racial disparities in STEM persistence and completion, researchers
also have highlighted theoretical reasons that students persist or leave a STEM field of study,
such as early exposure to and proficiency in math and science (Adelman 1998, 1999, 2006;
Anderson & Kim, 2006; Hagedorn & DuBray, 2010); high school curriculum (Elliott, Strenta,
Adair, Matier, & Scott, 1996); advanced courses in math and science (Ellington, 2006);

4
information early in the career search process (Holland, 1992); the types of opportunities,
experiences, and support students receive in college (e.g., Chang, Sharkness, Newman, &
Hurtado, 2010; Seymour & Hewitt 1997; Shuman, Delaney, Scalise, Wolfe, & Besterfield-Sacre,
1999); institutional selectivity (Chang, Cerna, Han, & Sáenz, 2008; Eagan, 2009); faculty quality
and diversity (Brainard, Metz, & Gillmore, 1993; Leach, 2010); and classroom experiences
(Cabrera, Colbeck, & Terenzini, 2001).
Despite the wealth of research on persistence and completion in STEM fields, less focus has
been given to entrance into a postsecondary STEM discipline. Existing research does reveal that
the choice to pursue STEM fields is affected by math- and science-related interest and self-
assessment (Halpern, Benbow, Geary, Gur, Hyde, & Gernsbacher, 2007; Marsh, Trautwein,
Lüdtke, Köller, & Baumert, 2005; Seymour & Hewitt, 1997), math and science completed during
high school (e.g., Ethington & Wolfle, 1988; Maple & Stage, 1991), social background (Ware &
Lee, 1988), and parental education (Gruca, Ethington, & Pascarella, 1988). The most
comprehensive national study to date on students who enter STEM was conducted by Chen and
Weko (2009). Utilizing three Institute of Education Sciences (IES) longitudinal datasets, the
authors found that the percentage of students entering STEM fields was higher among male
students; younger and dependent students; Asian/Pacific Islander students; foreign students, or
those who spoke a language other than English as a child; and students with more advantaged
family background characteristics and stronger academic preparation than their counterparts.
However, given the descriptive nature of the study, factors influencing STEM entrance beyond
demographics were barely examined. Another recent study (Crisp, Nora, & Taggart, 2009) found
that students’ decisions to declare a STEM major and earn a STEM degree at a Hispanic-serving
institution were uniquely influenced by their gender, ethnicity, SAT math score, and high school

5
class rank percentile. Despite these commendable empirical efforts, relatively less is known
about why students enter STEM fields.
Overall, the state of research on STEM education represents substantial efforts by
researchers to form a better understanding of the underlying factors that influence student
success along the STEM pipeline. However, too few studies, especially those using nationally
representative samples, have focused on understanding entrance into STEM fields of study. The
boosters and barriers to students choosing STEM majors are unclear. As a result, knowledge is
scant on how to broaden STEM participation, which is essentially the first critical step toward
building a viable STEM pipeline. This study addresses these limitations by focusing on entrance
into STEM fields and identifying the characteristics and factors associated with student decision
to pursue STEM majors in four-year institutions.
Theoretical Framework
Utilizing a longitudinal, nationally representative sample, this study proposes a conceptual
framework for understanding the decision to choose postsecondary STEM fields of study among
recent high school graduates. Integrating prior literature and the Social Cognitive Career Theory
(SCCT), the theoretical model hypothesizes that students’ high school exposure to math and
science courses, math self-efficacy beliefs, and high school math achievement influence their
intent to major in STEM fields, which in turn affects their actual choice of STEM fields of study.
In addition, the model theorizes that entrance into STEM fields also is directly influenced by
students’ high school math achievement and initial postsecondary experience. This theoretical
model is depicted in the following graphic representation.

6
[Insert Figure 1 about here.]
Based on Bandura’s (1986) general social cognitive theory, SCCT underscores the
interrelationship among individual, environmental, and behavioral variables that are assumed to
undergird academic and career choice (Lent & Brown, 2006). Key factors in SCCT include self-
efficacy beliefs, outcome expectations, interests, environmental support and barriers, as well as
choice actions (Lent, Sheu, Gloster, & Wilkins, 2010). SCCT offers an appropriate theoretical
lens to study the issue of STEM choice (Lent, Brown, & Hackett, 1994, 2000) and has been
applied in a small number of studies on STEM-related academic choice intentions (e.g., Betz &
Hackett, 1983; Fouad & Smith, 1996; Gainor & Lent, 1998; Hackett, Betz, Casas, & Rocha-
Singh, 1992; Lent, Lopez, & Bieschke, 1993; Lent, Lopez, Lopez, & Sheu, 2008). Although this
set of studies suggest the validity of SCCT as an explanatory framework for understanding
STEM interests and choices, they are largely limited by cross-sectional designs and single-
institution data (Lent et al., 2010). Based on a national longitudinal database, this study
incorporates the key constructs of SCCT to build a conceptual model of STEM participation and
capture the nature of the relationships between the theoretical variables over time.
SCCT posits that the determination to produce a particular choice can be explained as a
result of interests and self-reference beliefs. Based on prior studies (e.g., Adelman, 1999), high
school math preparation has evolved as a particularly promising factor influencing choice of
STEM fields of study. Therefore, this study theorizes that students’ math self-efficacy beliefs
and high school math preparation, while influencing each other, both give rise to students’ intent
to pursue STEM fields upon postsecondary entry, which is also influenced by the amount of
academic exposure to math and science courses during high school.

7
SCCT also highlights the role of environmental support and barriers in determining student
choices. In a postsecondary setting, students’ pursuit of STEM as an academic goal responds to
contextual support and barriers—social, academic, or financial. In particular, because K-12
assessments and the academic requirements of postsecondary institutions are often at odds
(Goldrick-Rab, 2007), students transitioning into postsecondary education need to navigate a
series of demands, such as the need for financial resources, academic integration into college,
and various external demands. The outcomes of this process might present either barriers or
support and thus impact academic choice behavior of STEM-aspiring students. A number of
factors in this transition process that are particularly relevant for this study are discussed below.
Student interaction with faculty and academic advisors positively influences numerous
student outcomes (Astin, 1993; Chang, 2005; Lamport, 1993; Terenzini, Pascarella, & Blimling,
1999). Given the focus of this study, such interactions may provide necessary support for
students to clarify and confirm their choice of major field of study. For many students,
remediation is a necessary part of the curriculum (Pascarella & Terenzini, 2005). However,
research on the effect of enrolling in remedial courses has produced mixed results (Adelman,
1999; Bahr, 2008; Bailey & Alfonso, 2005; Long, 2005). In examining the relationship between
remediation and student choice of STEM, this study will provide targeted, context-based
research evidence regarding the effectiveness of remediation in sustaining students’ academic
aspirations. The receipt of financial aid also affects students’ academic choices (e.g., DesJardins,
Ahlburg, & McCall, 2006; Ishitani & DesJardins, 2002), and the external demands that students
may need to deal with, such as having dependent children and working long hours, may redirect
them from pursuing challenging fields of study, such as math and science. These initial college

8
experiences at students’ first postsecondary institution are presumed to directly shape their
decisions to pursue STEM fields of study.
Research Questions
The purpose of this study is to understand the direct and indirect influences of high school
exposure to courses in math and science, math self-efficacy beliefs, math test scores, and initial
postsecondary experiences on entrance into STEM fields of study in college. An a priori path
analysis model based on relevant research literature and the SCCT is developed and tested in this
study. Specifically, the following interlocking questions guide the design and analyses of this
research:
1. What are the relationships among high school exposure to math and science courses, math
achievement, math self-efficacy beliefs, intent to pursue STEM upon entry into postsecondary
education, and entrance into STEM fields of study?
2. Taking into account the relationships described in question 1, how are students’ initial
postsecondary education experiences, such as remediation, receipt of financial aid, academic
interaction, perceived level of adequacy of high school preparation for college, and external
demands related to choice of STEM fields?
3. How do these relationships vary by gender, race/ethnicity, and socioeconomic status
(SES)?
9
Methods
Data Source and Sample
Data for this study come from the Education Longitudinal Study of 2002 (ELS: 2002),
which was designed to study the transition of young people from high school into postsecondary
education and the workplace. ELS: 2002 started with a nationally representative cohort of high
school sophomores. The sample was then augmented in the first follow-up study in 2004 to
represent high school seniors. In 2006, roughly two years after high school, the second follow-up
study collected data on access to postsecondary institutions, choices of enrollment and college
major, and some other aspects of college experience. Given its focus on the transition from high
school to postsecondary education, ELS: 2002 is an appropriate dataset for this study; to fully
understand student learning, motivation, interest, and choice as related to STEM fields, it is
necessary to follow the same individuals from high school into college. The longitudinal data
from ELS: 2002 provide a thorough empirical description of student experiences relevant to
STEM education in high school and the early years of college. This study focuses on the spring
2004 high school seniors who participated in the second follow-up interview and who had
enrolled in a postsecondary institution by 2006. Of approximately 14,000 members of the 2004
senior cohort, about 12,500 (89.3%) responded to the second follow-up interview. For the
purpose of this study, I retained an initial total of 6,304 (out of 12,500 eligible) students who had
reported postsecondary attendance at a four-year institution by 2006. All analyses were weighted
using the appropriate panel weight (F2F1WT). Therefore, results of this study can be generalized
to the spring 2004 high school graduates who started their postsecondary education at a four-year
institution within two years of high school graduation.
10
Measures
Based on the theoretical model, the following variables are included in the study:
The outcome variable of the study, entrance into a STEM field of study, is a dichotomous
variable, recoded from the survey item that asks respondents’ field of study during the 2006 ELS
second follow-up interview. The focal mediating variable is intent to pursue a STEM field,
measured by whether the most likely postsecondary field of study students consider upon
postsecondary entry is in the STEM disciplines.
The independent variables include three exogenous variables at the high school level: (a)
exposure to math and science courses, measured by the number of units in mathematics and
science technologies that students take; (b) high school math achievement, measured by high
school math standardized test scores; and (c) math self-efficacy beliefs, measured by five items—
each on a four-point Likert scale—that represent students’ self-efficacy beliefs in areas such as
taking math tests, mastering math skills, and completing math assignments.
Although these variables measured during high school offer some insight into student
learning in math and science, they do not indicate fully how well such learning prepares students
for college-level work. In an attempt to provide a more comprehensive picture that goes beyond
course-taking and achievement, a latent variable is included that measures how students already
enrolled in college believe that their high school math and science courses prepared them for
college-level work. ELS’s second follow-up study contains this information and, because these
data were collected during the first year of college, this latent variable of high school math and
science preparation for college is depicted at the postsecondary level in the structural model.
In addition, the following variables are used to represent postsecondary context of support
and barriers: academic interaction, remediation, receipt of financial aid, and external demands.

11
Academic interaction is measured by the frequency of interacting with faculty about academic
matters and the frequency of meeting with advisors about academic plans. This study also
includes three dichotomous variables measuring remediation; that is, whether students took
remedial courses to improve reading, writing, and math skills. ELS: 2002 specifies the financial
aid status (loan, grant, and work-study) of students; thus, the receipt of financial aid is a
dichotomous variable based on students’ first-year aid status. Representing external demands are
one dichotomous variable measuring whether students had dependent children and a continuous
variable measuring the number of hours students worked per week during the first two years of
college. This study also includes enrollment intensity and graduate degree expectations as
control variables. Figure 2 is a depiction of the structural equation modeling (SEM) diagram
based on the theoretical model (Figure 1).
[Insert Figure 2 about here.]
Table 1 lists the names, descriptions, and ELS labels of all variables used in the study. In the
table, each latent construct and its corresponding indicators also are specified. Each latent
construct also is denoted by an asterisk sign (*) at the beginning of the variable name.
[Insert Table 1 about here.]
Analytical Approaches
First, I computed descriptive statistics of the sample and disaggregated the data by
background characteristics. These descriptive statistics provide a general profile of the ELS 2004

12
high school senior cohort’s participation in STEM fields of study two years after high school
graduation and help identify any variation in experiences across socio-demographic variables.
Following the descriptive analysis, I tested the proposed conceptual model using structural
equation modeling (SEM) (Kaplan, 2009). The measurement part of SEM is to perform
confirmatory factor analysis (CFA) based on the proposed measurement models. Four latent
constructs were measured at this step: math self-efficacy, high school exposure to math and
science, perceived adequacy of high school preparation for college, and academic interaction.
The path structure in this study is postulated by two regression analyses in the model. The first
equation investigates how students’ intent to major in STEM upon entering college was affected
by their high school exposure to math and science courses, high school math achievement as
measured by math standardized scores, and math self-efficacy beliefs. The second regression
analysis examines how students’ decisions to enter into STEM fields of postsecondary study
were affected by their intent to major in STEM fields, adequacy of high school math and science
preparation for college, and postsecondary context of support and barriers (such as academic
interaction, remediation experience, external demands, and receipt of financial aid). In addition,
two other exogenous independent control variables— enrollment intensity and post-
baccalaureate educational expectations—were included in this second regression equation.
Moreover, students’ high school math standardized scores are included in the second equation
again because math ability might have a direct effect on students’ entrance into STEM fields.
Although SEM traditionally is suited for analyzing continuous variables, recent software and
methodological developments have extended the application of SEM into analysis of all types of
variables—continuous, ordinal, or nominal—as present in this study. I conducted the analyses
using Mplus 6.1, a statistical software package capable of SEM analysis that uses a mixture of

13
different types of variables (Kupek, 2006; Muthén & Muthén, 1998-2010). In addition, Mplus
contains statistical tools that accommodate complex survey design features such as survey
weights and the clustering nature of ELS: 2002. Another attractive feature of Mplus is its default
procedure in handling missing data of dependent variables, which is based on the maximum
likelihood estimation (Muthén & Muthén, 1998-2010).
Following Byrne (1998), I relied on the following fit indices to assess overall model fit: chi-
square (χ2), comparative fit index (CFI), Tucker-Lewis Fit Index (TLI), and root-mean-square
error of approximation (RMSEA).
Testing for structural invariance across gender, race, and SES groups. As previously
discussed, socio-demographic differences are of critical importance in STEM-related research
(Crisp, Nora, & Taggart, 2009; Towers, 2008) and persistent gender and racial gaps in the STEM
pipeline remain (Anderson & Kim, 2006; Clewell & Campbell, 2002; Dowd, Malcom, &
Bensimon, 2009), thus warranting the need for STEM-related analyses to take such background
differences into consideration. Therefore, after I conducted the SEM analysis based on the whole
sample and obtained its overall fit, I resorted to multiple-group SEM analyses to examine
whether the hypothesized model is equivalent across different gender, racial, and SES groups.
Specifically, this part of the study drew upon three sets of multiple-group SEM analyses
respectively based on gender (females and males), race (Whites, Asians, and underrepresented
minorities), and SES (quartiles) and tested for structural weight invariance across subgroups
within each of these three socio-demographic categories. Because this study focuses on the
structural pattern of the model (i.e., the underlying mechanism affecting students’ entrance into
STEM fields of study), the model invariance tests focused on the equivalence of structural
parameters across different groups. To illustrate, in the gender-based multiple-group analysis, I

14
first fitted a baseline model—a multiple-group model with only factorial equality constraints
across gender, where the structural weights (i.e., regression coefficients) were freely estimated
across the male and female groups. I then estimated another multiple-group model with cross-
group constraints where all structural weights across males and females were constrained to be
equal. Next, I conducted a structural invariance test based on the chi-square difference (Δχ2) test
that compared the baseline model with the constrained-equal model. Through this test, if the chi-
square difference statistic does not reveal a significant difference between the models, then it can
be concluded that the model has structural weight invariance across gender groups. However, if
non-invariance is indicated by a significant chi-square difference, then structural weights (i.e.,
regression coefficients) are gradually constrained to be equal across gender groups to determine
whether group differences can be attributable to any of the structural weights. If any constrained
parameters (i.e., structural weights) are found to be gender-invariant as suggested by
insignificant Δχ2 statistics, then they will be constrained, cumulatively, in subsequently more
restrictive models. On the contrary, a significant Δχ2 statistic suggests that the given parameter is
not equivalent across gender groups; therefore, it will be freely estimated in the subsequent
models for invariance tests (Byrne, 2010). Race- and SES-based multiple-group analyses were
carried out in the same fashion.
Missing Data
As inherent with survey research, some of the variables included in the study have missing
data. In this study, I applied Mplus’ s full information Maximum Likelihood (FIML) to handle
missing data in the variables that are treated as dependent by the software. Listwise deletion was
used to deal with the missingness in the exogenous observed variables. Before performing

15
listwise deletion, the dataset that contains cases to be deleted was compared with the dataset that
contains cases not subject to listwise deletion; it was observed that the distributions of variables
in both are quite similar. As a result, 415 cases were removed from the analysis, resulting in the
final analytic sample size of 5,889.
Results
Descriptive statistics are presented in Table 2 to provide a comprehensive picture of
entrance into STEM fields based on student background characteristics. Overall model fit indices
of the proposed model are examined. A discussion of the results from multiple-group analyses
follows. This section concludes with a description of various direct and indirect effects of the
independent variables.
[Insert Table 2 about here.]
Overall Model Fit
Overall model fit indices based on the whole-sample SEM analysis are displayed in Table 3.
Researchers generally hope that the null hypothesis (i.e., that the hypothesized model holds in
the population), is not rejected in SEM. However, the chi-square test is sensitive to sample size.
With a sample size greater than 400 cases, the chi-square value is almost always statistically
significant (Kenny, 2011; Schumacker & Lomax, 2004). In this single sample SEM analysis, the
chi-square value of the proposed model is equal to 1960.548, df = 163, p = 0.000. Due to the
study’s large sample size, the chi-square test might erroneously reject the null hypothesis by
indicating a near-zero p-value.

16
The Comparative Fit Index (CFI) is 0.964 and the Tucker-Lewis Index (TLI) is 0.957. Heck
& Thomas (2000) asserted that CFI and TLI values above 0.90 indicate acceptable model fit,
while a higher cutoff standard at 0.95 has been suggested by the other researchers (Newsom,
2010; Schreiber, Stage, King, Nora, & Barlow, 2006 ). In this whole-sample SEM analysis, both
CFI and TLI indicate that the model fit is adequate based on the more stringent cutoff standard.
The Root Mean Square Error of Approximation (RMSEA) proposed by Steiger and Lind
(1980) is yet another measure of model fit. Respectively, 0.01, 0.05, and 0.08 suggest excellent,
good, and mediocre fit (MacCallum, Browne, & Sugawara, 1996; Newsom, 2010). In this study,
the proposed model has a RMSEA value of 0.042, which suggests that the model is a good fit.
[Insert Table 3 about here.]
Results of Multiple-Group Invariance Tests
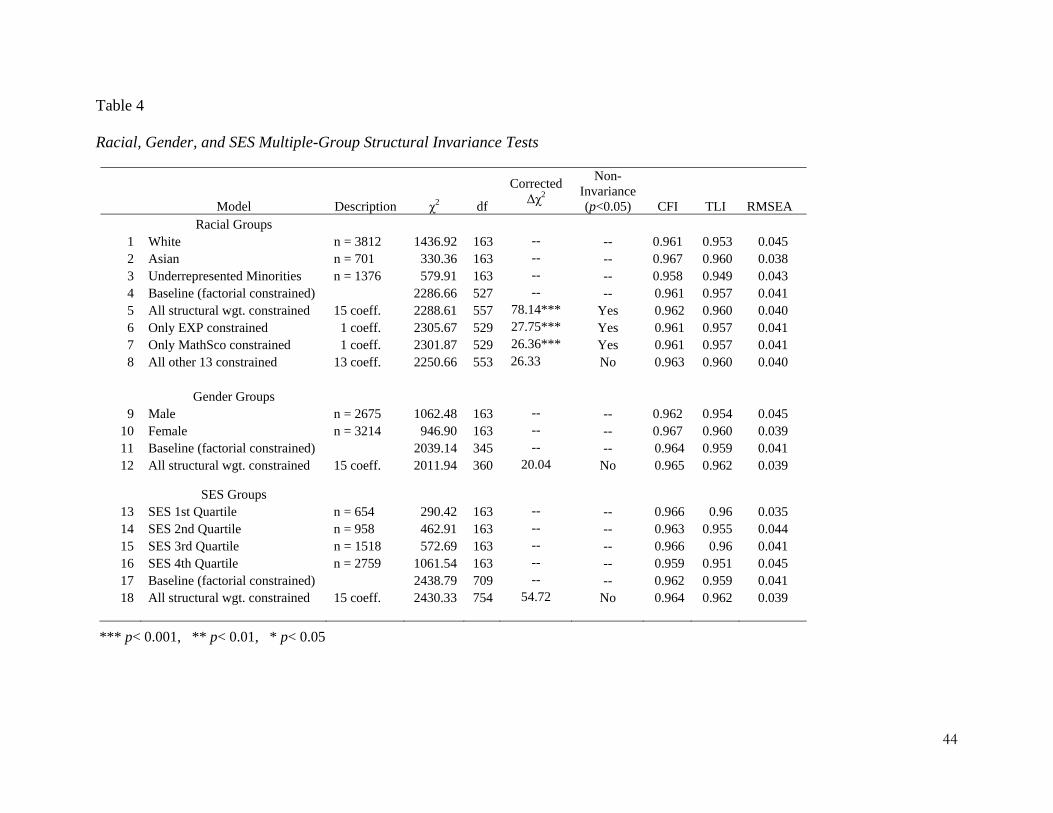
Multiple-group SEM analyses were conducted for racial, gender, and SES groupings. Three
sets of statistics and model fit indices were derived from this series of analyses and are presented
in Table 4. For example, in the race-based multiple-group analysis, the hypothesized model was
initially fitted to the White, Asian, and under-represented minority (URM) samples separately.
The fit statistics for the White-only model are χ2(163) = 1436.92, CFI = 0.961, TLI = 0.953,
RMSEA = 0.045 (line 1of Table 4); Asian’s fit statistics are χ2(163) = 330.36, CFI = 0.967, TLI
= 0.960, RMSEA = 0.038 (line 2); and URM’s fit statistics are χ2(163) = 579.91, CFI = 0.958,
TLI = 0.949, RMSEA = 0.043 (line 3). The fit indices suggest that the hypothesized model fits
each racial group adequately. Thus, all racial groups were combined together and simultaneously
fitted to the data to become the multiple-group baseline model.

17
The racial multiple-group baseline model also fits the data well: χ2(527) = 2286.66, CFI =
0.961; TLI = 0.957, RMSEA = 0.041 (line 4). In the next step, all of the 15 structural weights
(i.e., regression coefficients) were constrained equally across racial groups to examine structural
weight invariance across racial groups. The result of the corrected chi-square difference test is
statistically significant (p < 0.05), which suggests that one or more of the parameters are non-
invariant across racial groups (line 5). Thus, instead of constraining these 15 parameters all at
once, parameters were constrained one by one to identify the source of non-invariance found in
the previous step. When the regression coefficient for exposure to math and science courses on
intent to pursue STEM was constrained equal across racial groups, the result of the corrected chi-
square difference test was again significant, suggesting that exposure to math and science
courses is one of the sources of structural non-invariance across racial groups (line 6). Similarly,
non-invariance was found when the regression coefficient for math standardized score on intent
to pursue STEM was constrained equally across racial groups (line 7). I further identified
precisely where the non-invariance of these two structural weights lies between specific pairings
of racial groups by performing partial constraints (i.e., selecting only two of the three racial
groups to be constrained equal at a time). I found that non-invariance of these two structural
weights exists for all three pairs of comparison: White and Asian, Asian and URM, and URM
and White. Therefore, I kept both structural weights freely estimated across all racial groups in
the model. Subsequent invariance tests showed that there was no structural non-invariance
caused by the rest of the 13 structural weights (line 8).
[Insert Table 4 about here.]

18
The middle and lower sections of Table 4 display the model fit statistics and multiple-group
structural invariance test results for gender and SES groupings, respectively. No structural non-
invariance was found in the multiple-group analyses based on gender and SES, which indicates
that the hypothesized model can be operated across different subgroups within gender or SES.
Final SEM Model
Through these detailed analyses, it became clear that a multiple-group model based on race,
where the paths from exposure to math and science courses and math standardized score to
intent to major in STEM were freely estimated for all racial groups while all other structural
weights are constrained equal, is the most reasonable and viable model. This final model fit the
data, χ2 (553) = 2250.66, CFI = 0.963, TLI = 0.960, RMSEA = 0.040, and did not differ in fit
than the fully unconstrained model, corrected Δχ2 (26) =26.33, p = 0.445. Table 5 displays the
unstandardized and standardized estimates from this final multiple-group model based on race.
[Insert Table 5 about here.]
Figure 3 presents the final model with the significant paths highlighted, and the coefficient
estimates also are denoted along with the paths.
[Insert Figure 3 about here.]

19
Discussion
The following focuses on a discussion of the results from the final SEM model, beginning
first by addressing the questions this study pursued:
1. What are the relationships among high school exposure to math and science courses,
math achievement, math self-efficacy beliefs, intent to major in STEM, and entrance into STEM
fields of postsecondary study?
Intent to pursue STEM, the mediating variable in the proposed model, was significantly and
positively influenced by math self-efficacy beliefs, the effect of which remained the same across
gender, racial/ethnic, and SES groups. The effect of high school exposure to math and science
courses on intent to major in STEM was statistically significant and positive among White and
Asian students but was null among underrepresented minority students. High school math
achievement positively influenced intent to pursue STEM fields, and this effect, although
significant across all three racial groups, was largest among White students and approximately
the same for Asian students and underrepresented minorities. Through this mediating variable,
all three high school variables also indirectly and positively affected actual choice of STEM
fields, except that exposure to math and science did not show any significant indirect effect
among underrepresented minorities. In addition, math achievement also showed a significant
direct effect on entrance into STEM fields of study.
2. Taking into account the high school variables, how are students’ initial postsecondary
education experiences related to choice of STEM fields?
Intent to pursue STEM and several postsecondary latent and observed variables showed
direct effects on entrance into STEM. Specifically, entrance into STEM fields of study was
associated positively with intent to major in STEM, academic interaction, perceived adequacy of

20
high school preparation for college, receiving financial aid, and expecting to earn a graduate
degree. External demands, such as being a parent and number of work hours, did not contribute
any significant effect in presence of other postsecondary variables. Receiving remediation and
being enrolled full-time did not show any influence on STEM entrance either. None of these
effects differ significantly across gender, racial, and SES groups.
3. How do the modeled effects vary based on gender, race, and SES?
The potentially varying effects of the modeled factors were examined through conducting
multiple-group SEM analyses based on gender, race, and SES. These analyses indicate that the
proposed theoretical model generally held well and was stable across various gender, racial, and
SES groups. Significant differences in structural weights were found in the multiple-group model
based on race, where the effects of math achievement and high school exposure to math and
science courses on intent to major in STEM fields differed significantly among all racial groups.
Overall, the influences of these two variables were the strongest among White students.
A closer examination of these results reveals a number of important findings worthy of
further discussion. First, high school preparation in terms of math and science has a lasting,
persistent effect on student academic choices as related to STEM by playing a critical role in
developing student interest in pursuing a postsecondary STEM field of study, thus cultivating the
intent to pursue STEM, and by directly influencing entrance into STEM fields. Math and science
learning in K-12 schooling has been central to the research and discussion on broadening the
STEM pipeline. In particular, with a great variability, course selection and completion during
high school are essential in developing student predispositions towards a STEM major choice in
college (Blickenstaff, 2005).

21
The influence of high school preparation as related to math and science, however, is
multifaceted. Many prior studies solely focused on math achievement when examining the
influence of high school experience on student interest and entrance into STEM fields (Crisp,
Nora, & Taggart, 2009; Porter & Umbach, 2006; Staniec, 2004). This study, however, shows that
the effect of student exposure to math and science courses is as salient as that of math
achievement, which was once deemed the single best predictor of future STEM choices. This
finding implies that, to boost high school students’ interest in pursuing STEM fields of study, an
earlier introduction and exposure to math- and science- related courses could be a most effective
method and that students’ interest in pursuing STEM could be an evoked response to direct
exposure to these courses. On the other hand, math achievement still indicates a persistent effect
on student interest and subsequent enrollment in STEM majors; this warrants continued policy
focus on improving math achievement of students. When it comes to structuring and engaging
students in math and science courses, particular attention should be given to college preparedness.
As clearly indicated in this study, students who perceive their high school math and science
courses to have adequately prepared them for college work are likely to enter into STEM fields
of study. In light of these findings, a stronger alignment between high school offerings and
academic expectations at the college level represents a promising step toward promoting greater
student interest and entrance into STEM fields of postsecondary study.
Second, motivation matters in STEM choices. This study examined three motivational
attributes and their link to entrance into STEM fields: (a) math self-efficacy beliefs, (b) intent to
pursue STEM fields of study, and (c) aspiration to earn a graduate degree. The results show that
math self-efficacy beliefs play a significant and positive role in shaping intent to pursue STEM
and that, through influencing intent, they have a lasting indirect effect on actual choice of STEM

22
majors. Similar to previous research that examines the link between math self-efficacy and
STEM choice (e.g., Scott & Mallinckrodt, 2005), this study demonstrates that students with
greater math self-efficacy beliefs are more likely to intend to major in STEM fields upon college
entrance. While this finding supports the argument for promoting positive math self-efficacy
beliefs among all students, it should be noted that math self-efficacy often is discussed in relation
to gender, with a particular focus on the "confidence gap" (M. Sadker & D. Sadker, 1994). That
is, male students are more math self-efficacious than female students despite comparable
achievement (Eccles, 1994; Pajares, 2005; Watt, 2006), although more recent research (e.g.,
Britner & Pajares, 2006; Chen & Zimmerman, 2007; Kay & Knaack, 2008; Kenney-Benson,
Pomerantz, Ryan, & Patrick, 2006) indicates that this gap may be closing. Multiple-group
analysis in this study shows that there is no gender difference in terms of how math self-efficacy
works to influence student intent to major in STEM fields of study; this highlights the
importance of further addressing the gender bias in STEM discussion (Clewell & Campbell,
2002), which may play a role in the genderized socialization of female students and have
additional adverse effects on their math self-efficacy beliefs.
In addition to self-efficacy, other key motivational factors in SCCT that influence choice
actions include outcome expectations and interests (Lent, et al., 2010). In this study, intent to
major in STEM fields of study was used as a proxy for outcome expectations and interests and
shows a positive and significant effect on the choice action of interest: entrance into STEM fields.
This result aligns well with SCCT, which stipulates that an individual’s intention to engage in a
certain activity (in this case choosing a major in STEM fields) helps organize, guide, and sustain
the individual’s efforts over a period of time without external influence (eventually entering a
STEM field of study). This study also found that expecting to earn a graduate degree is
23
positively associated with STEM entrance. Perhaps those who are graduate school aspirants tend
to be a more select and motivated group who are successful in establishing a stable, long-term
academic plan and who are better prepared to take on challenging fields of study such as STEM.
Third, taking student intent into account, the first year of college is important for students
who pursue STEM fields of study, especially when contextual support in the form of
socialization with faculty and academic advisors and receipt of financial aid is present. For all
students, interaction with faculty and academic advisors seems to encourage entrance into STEM
fields of study. These interactions may help students better integrate themselves into the college
environment and also make them better align their academic aspirations with actual choices.
From an advising perspective, helping current and potential STEM aspirants declare a STEM
major early in their college careers is critical to minimizing additional time, funds, and
opportunity costs spent in pursuing a degree (Frehill, 1997). As discussed previously, the
socialization process may help reinforce one’s academic and career choices. Also, in the context
of SCCT, such interactions serve as the contextual support that helps individuals persist in
alignment with their goals. The positive influence of financial aid suggests that financial support
also can provide the much needed support for students to pursue STEM fields of study. Given
that students pursing STEM disciplines tend to spend more time studying than students in other
fields (Arum & Roksa, 2011; Brint, Cantwell, & Saxena, 2011), receiving financial aid may help
relax financial constraints and allow them to allocate enough time and energy to study and
engage in greater interaction with faculty and advisors, thus meeting the academic challenges
associated with majoring in STEM fields. In fact, a recent study by Kienzl and Trent (2009)
found that receiving financial aid helped underrepresented students enter high-cost STEM fields
at a large public research university. Results from this study based on national data echoes
24
Kienzl’s and Trent’s finding and further reveals that the positive effect of financial aid applies
across gender, racial, and SES groups. It also is worth mentioning that with academic interaction
and financial aid taken into consideration, variables representing postsecondary contextual
barriers, such as remediation and external demands, did not seem to have any statistically
significant impact on STEM entrance.
Fourth, for recent high school graduates, racial backgrounds still largely impact the way in
which high school math and science learning is linked to STEM aspirations, with
underrepresented minorities such as Blacks and Hispanics experiencing the least gain in their
intent to purse a STEM field through math achievement and coursework in math and science.
This study suggests that the effects of math achievement and high school exposure to math and
science courses on STEM aspirations are heterogeneous, accruing more to White students and
last to underrepresented minorities. The identification of these heterogeneous effects indicates
that the well-documented racial disadvantage in STEM participation cannot simply be attributed
to underrepresented minorities’ low levels of academic preparation in high school math and
science or resolved by increasing their achievement and exposure to math and science. Rather,
more research is needed to understand how math and science learning during high school can
better serve underrepresented minority students and what additional factors contribute to these
students’ STEM-related aspirations and choices. The challenges associated with broadening the
participation of minorities in STEM fields should be addressed while keeping in mind the
possible heterogeneous impacts of various policies and practices so as to more effectively target
underrepresented minorities in growing the STEM pipeline.
Last but not least, the process leading to entrance into STEM fields of study is complex;
numerous influences—individual, psychological, and social—act together to shape, develop, and

25
sustain one’s interest and eventually turn it into an actual choice. This study set out to
disentangle these influences and their effects on STEM choice by adopting a K-16 perspective
that draws upon the integration of SCCT and relevant literature on STEM education. Although
this study does not account for all of this complexity, its findings suggest that SCCT is a viable
framework for understanding STEM choice behaviors, especially when high school STEM-
related learning experience is added to the model. Consistent with SCCT, STEM participation
for all students largely is dependent on their intrinsic motivational attributes, such as math self-
efficacy beliefs and interest in entering STEM. These observations, along with the finding that
aspiring to earn a graduate degree turns out to influence students’ STEM choice, suggests that
students’ pathways to STEM can be substantially explained by their overall educational
motivation and aspirations. Students also respond positively to postsecondary support, such as
academic interaction and financial aid, when making choices in regard to STEM as a major field
of study. In addition, by utilizing a multiple-group SEM analysis to gauge impact heterogeneity,
this study illuminates the differential processes leading up to entrance into STEM fields among
racial groups. A general theme that emerges from this study is that the race-based inequitable
participation in STEM fields of study may be partially explained by White, Asian, and
underrepresented minority students’ differential responses to their high school learning
experiences in math and science.
Limitations of the Study and Directions for Future Research
This study’s findings should be considered in conjunction with several important limitations.
First, although the study relies on a nationally representative sample, the use of an extant dataset
poses constraints in terms of what can be included to operationalize the theoretical model. For

26
example, self-efficacy beliefs are central to SCCT, which serves as the guiding theoretical
framework for this study. While ELS: 2002 contains survey items that measure math self-
efficacy adequately, a more comprehensive measure of STEM-specific self-efficacy would be
more appropriate given the study’s outcome variable. ELS does not include data for developing
such a measure, thus forcing this study to rely on math self-efficacy as a proxy for STEM self-
efficacy, which limits the robustness of the data in support of the theory. Second, also due to the
lack of relevant data, this study is not able to account for students’ perceptions and attitudes
toward STEM fields, how these perceptions and attitudes are shaped by students’ socialization,
or how they influence students’ motivation to participate in STEM fields (Felder, Felder,
Mauney, Hamrin, & Dietz, 1995).
Another limitation concerns the lack of causal inference, given the use of observational data
and SEM. Although SEM goes beyond the traditional regression analysis in that it accounts for
the temporal, complex relationships among latent and observed variables, it is still an exploration
of various correlations. While plausible explanations for the findings are discussed based on
theory and prior research, none of the relationships described in this article should be interpreted
as causal.
In addition, this study focuses on choosing a major within STEM fields roughly within two
years of college. Some students still may be exploring their major fields of interest during this
time frame, and others might switch into STEM fields later on; these dynamics were not
explored given the data available for the study. Because ELS: 2002 only followed students two
years after high school graduation, it is impossible to explore the long-term effects of the high
school and postsecondary variables on students’ entire progress through the STEM pipeline.

27
This study points to several directions for future research. Although studies on STEM-
related issues have proliferated in the past decade, disentangling the reasons for STEM
participation remains a complex challenge, especially when determining whether the factors are
dependent on socio-demographic backgrounds and/or within the control of the educator.
Integrating variables at the high school and college levels, this study set out to account for a
longitudinal process of STEM choice and tackled the effects of heterogeneity based on gender,
race, and SES. However, a number of questions remain to be answered in future research. First,
the finding surrounding math self-efficacy needs further investigation to understand more
completely the mechanism through which it works in support of interest in STEM fields and
future STEM choice, especially among female students. How does math self-efficacy or, better
yet, STEM self-efficacy, interact with various socialization sources and social perceptions
regarding the gender role in career- and major-related choices to affect students’ actual STEM
choices? Which one of the sources of self-efficacy—mastery experience, vicarious experience,
social persuasions, or physiological factors—is the most theoretically and practically viable way
to help promote STEM-related self-efficacy?
In addition, given the persistent, enduring effect of high school exposure to math and
science courses, as well as math achievement, finding the best possible way to teach those
courses, especially accounting for racial differences in the ways in which these effects are
transmitted, will continue to dominate the central stage of STEM discussion. Rigorously
designed experimental or quasi-experimental research may represent the best approach for
scaling up promising interventions. Equally important, the first year in college can be critical,
and as evidenced in this study, a number of postsecondary variables are related to entrance into
STEM fields of study. Of particular note are the positive effects of both receiving financial aid
28
and academic interaction on STEM choice. These relationships need to be further studied—
ideally through original, targeted data collection—to understand how they affect STEM entrance.
Such nuanced understanding may aid in the development of policy interventions that truly can
make a difference.
Conclusion
Given the continued national attention to promoting seamless movement through the STEM
pipeline among students of diverse backgrounds, research along this line will continue to flourish.
It has been established that college majors create differential opportunities for social mobility
and that college graduates from STEM fields attain higher occupational earnings and social
status positions associated with these professions compared to many other fields (Russell &
Atwater, 2005). Therefore, underrepresentation of women and minorities may become a social
justice issue. The differential participation rates in STEM fields between underrepresented
students and other groups are particularly detrimental because they affect individuals’ long-term
social mobility (Carter, 2006). Continued attention will be given to issues of representation for
women and minorities throughout the STEM pipeline. In particular, a comprehensive knowledge
of the barriers or facilitators to entering these important fields will be helpful in designing
interventions that can address equitable participation in STEM fields. Following the holistic view
of the issue of inequity in STEM participation, this study examined the high school learning and
postsecondary context of support and barriers and their potentially heterogeneous influences on
STEM entrance. Results of this study not only validate a viable conceptual model for researching
STEM entrance but also illuminate the racial differences in how high school learning exerts its
impact on student intent to major in STEM fields of study. Educational policy and interventions

29
targeted at developing STEM-related perceptions, attitudes, and aspirations among
underrepresented minority students will benefit from a deeper understanding of potentially
heterogeneous effects of variable educational experiences.
30
References
ACT. (2006). Developing the STEM education pipeline. Iowa City, IA: ACT.
Adelman, C. (1998). Answers in the tool box: Academic intensity, attendance patterns, and
bachelor’s degree attainment. Retrieved from http://www.ed.gov/pubs/Toolbox/Title.html
Adelman, C. (1999). Women and men of the engineering path: A model for analysis of
undergraduate careers. Washington, DC: U.S. Department of Education.
Adelman, C. (2006). The toolbox revisited: Paths to degree completion from high school through
college. Washington, DC: U.S. Department of Education.
Anderson, E., & Kim, D. (2006). Increasing the success of minority students in science and
technology. Washington, DC: American Council on Education.
Arum, R., & Roksa, J. (2011). Academically adrift: Limited learning on college campuses.
Chicago, IL: University of Chicago Press.
Astin, A. W. (1993). What matters in college? Four critical years revisited. San Francisco:
Jossey-Bass.
Bailey, T., & Alfonso, M. (2005). Paths to persistence: An analysis of research on program
effectiveness at community colleges (New Agenda Series Vol. 6, No. 1). Indianapolis, IN:
Lumina Foundation for Education. Retrieved from
http://www.luminafoundation.org/publications/PathstoPersistence.pdf
Bahr, P. R. (2008). Does mathematics remediation work?: A comparative analysis of academic
attainment among community college students. Research in Higher Education, 49(5), 420-
450.
Bandura, A. (1986). Social foundations of thought and action: A social cognitive theory.
Englewood Cliffs, NJ: Prentice Hall.
31
Betz, N. E., & Hackett, G. (1983). The relationship of mathematics self-efficacy expectations to
the selection of science-based college majors. Journal of Vocational Behavior, 23, 329-345.
Blickenstaff, J. C. (2005). Women and science careers: leaky pipeline or gender filter. Gender
and Education, 17(4), 369-386.
Brainard, S., Metz, S. S., & Gillmore, G. (1993). WEPAN pilot climate survey: Exploring the
environment for undergraduate engineering students. Retrieved from
http://www.wepan.org/associations/5413/files/Climate%20Survey.pdf
Brint, S., Cantwell, A., & Saxena, P. (2011, May). Disciplinary categories, majors, and
undergraduate academic experiences: Rethinking Bok’s “Underachieving Colleges” thesis.
Research in Higher Education. Retrieved from
http://www.springerlink.com/content/x87l6x8314808m0h/fulltext.pdf
Britner, S. L., & Pajares, F. (2006). Sources of science self-efficacy beliefs of middle school
students. Journal of Research in Science Teaching, 43, 485–499.
Byrne, B. M. (1998). Structural equation modeling with LISREL, PRELIS, and SIMPLIS: Basic
concepts, applications, and programming. Mahwah, NJ: Lawrence Erlbaum.
Byrne, B. M. (2010). Structural equation modeling with AMOS: Basic concepts, applications,
and programming (2nd ed.). New York, NY: Routledge.
Cabrera, A. F., Colbeck, C. L., & Terenzini, P. T. (2001). Developing performance indicators for
assessing classroom teaching practices and student learning: The case of
engineering. Research in Higher Education, 42, 327-352.
Carter, D. F. (2006). Key issues in the persistence of underrepresented minority students. New
Directions for Institutional Research,130, 33-46.
32
Chang, J. C. (2005). Faculty-student interaction at the community college: A focus on students of
color. Research in Higher Education, 46(7), 769-802.
Chang, M. J., Cerna, O., Han, J., & Sáenz, V. (2008). The contradictory roles of institutional
status in retaining underrepresented minorities in biomedical and behavioral science majors.
The Review of Higher Education, 31(4), 433-464.
Chang, M. J., Sharkness, J., Newman, C., & Hurtado, S. (2010, May). What matters in college
for retaining aspiring scientists and engineers? Paper presented at the annual meeting of the
American Educational Research Association, Denver, CO.
Chen, P., & Zimmerman, B. J. (2007). A cross-national comparison study on the accuracy of
self-efficacy beliefs of middle-school mathematics students. Journal of Experimental
Education, 75, 221–244.
Chen, X., & Weko, T. (2009). Students who study science, technology, engineering, and
mathematics (STEM) in postsecondary education: NCES 2009 161. Washington, DC:
National Center for Education Statistics.
Clewell, B. C., & Campbell, P. B. (2002). Taking stock: Where we’ve been, where we are, where
we’re going. Journal of Women and Minorities in Science and Engineering, 8, 255–284.
Crisp, G., Nora, A., & Taggart, A. (2009). Student characteristics, pre-college, college, and
environmental factors as predictors of majoring in and earning a STEM degree: An analysis
of students attending a Hispanic Serving Institution. American Educational Research
Journal, 46(4), 924–942.
DesJardins, S., Ahlburg, D., & McCall, B. P. (2006). An integrated model of application,
admission, enrollment, and financial aid. The Journal of Higher Education, 77(3), 381-429.

33
Dowd, A. C., Malcom, L. E., & Bensimon, E. M. (2009). Benchmarking the success of Latina
and Latino students in STEM to achieve national graduation goals. Los Angeles, CA:
Center for Urban Education.
Eagan, M. K. (2009, November). An examination of the contributors to production efficiency of
undergraduate degrees in STEM. Paper presented at the annual meeting of the Association
for the Study of Higher Education, Vancouver, BC, Canada.
Eccles, J. S. (1994). Understanding women’s educational and occupational choices: Applying the
Eccles et al. model of achievement-related choices. Psychology of Women Quarterly, 18,
585–609.
Ellington, R. M. (2006). Having their say: Eight high-achieving African-American
undergraduate mathematics majors discuss their success and persistence in mathematics.
(Unpublished doctoral dissertation). University of Maryland, College Park. Retrieved from
Dissertations and Theses Database.
Elliott, R., Strenta, A. C., Adair, R., Matier, M., & Scott, J. (1996). The role of ethnicity in
choosing and leaving science in highly selective institutions. Research in Higher Education,
37(6), 681-709.
Ethington, C. A., & Wolfle, L. M. (1988). Women’s selection of quantitative undergraduate
fields of study. American Educational Research Journal, 25(2), 157-175.
Felder, R., Felder, G., Mauney, M., Hamrin, C., & Dietz, J. (1995). A longitudinal study of
engineering student performance and retention. III. Gender differences in student
performance and attitudes. Journal of Engineering Education, 84(2), 151-163.
Frehill, L. M. (1997). Education and occupational sex segregation: The decision to major in
engineering. Sociological Quarterly, 38(2), 225-249.
34
Fouad, N. A., & Smith, P. L. (1996). A test of a social cognitive model for middle school
students: Math and science. Journal of Counseling Psychology, 43, 338–346.
Gainor, K. A., & Lent, R. W. (1998). Social cognitive expectations and racial identity attitudes in
predicting the math choice intentions of Black college students. Journal of Counseling
Psychology, 45, 403–413.
Goldrick-Rab, S. (2007). What higher education has to say about the transition to college.
Teachers College Record, 109(10), 2444-2481.
Gruca, J. M., Ethington, C. A., & Pascarella, E. T. (1988). Intergenerational effects of college
graduation on career sex atypicality in women. Research in Higher Education, 29(2), 99-124.
Hackett, G., Betz, N. E., Casas, J. M., & Rocha-Singh, I. A. (1992). Gender, ethnicity, and social
cognitive factors predicting the academic achievement of students in engineering. Journal of
Counseling Psychology, 39, 527–538.
Hagedorn, L. S., & Dubray, D. (2010). Math and science success and nonsuccess: Journeys
within the community college. Journal of Women and Minorities in Science and
Engineering, 16(1), 31-50.
Halpern, D. F., Benbow, C. P., Geary, D. C., Gur, R. C., Hyde, J. S., & Gernsbacher, M. A.
(2007). The science of sex differences in science and mathematics. Psychological Science in
Public Interest, 8, 1–51.
Heck, R. H., & Thomas, S. L. (2000). An introduction to multilevel modeling techniques.
Mahwah, NJ: Lawrence Erlbaum Associates.
Higher Education Research Institute. (2010). Degrees of success: Bachelor’s degree completion
rates among initial STEM majors. Los Angeles: Higher Education Research Institute.

35
Hilton, T., & Lee, V. (1988). Student interest and persistence in science: Changes in the
educational pipeline in the last decade. The Journal of Higher Education, 59(5), 510-526.
Holland, J. (1992). Making vocational choices: A theory of vocational personalities and work
environments. Lutz, FL: Psychological Assessment Resources.
Huang, G., Taddese, N., & Walter, E. (2000). Entry and persistence of women and minorities in
college science and engineering education: No. NCES 2000601. Washington, DC: National
Center for Education Statistics.
Huang, P., & Brainard, S. (2001). Identifying determinants of academic self-confidence among
science, math, engineering, and technology students. Journal of Women and Minorities in
Science and Engineering , 7(4), 315-337.
Hughes, W. (2000). Perceived gender interaction and course confidence among undergraduate
science, mathematics, and technology majors. Journal of Women and Minorities in Science
and Engineering , 6 (2), 155-167.
Ishitani, T. T., & DesJardins, S. L. (2002). A longitudinal investigation of dropout from colleges
in the United States. Journal of College Student Retention, 4(2), 173-201.
Kaplan, D. (2009). Structural equation modeling: Foundations and extensions (2nd ed.).
Thousand Oaks, California: Sage Publications.
Kay, R. H., & Knaack, L. (2008). A formative analysis of individual differences in the
effectiveness of learning objects in secondary school. Computers & Education, 51, 1304–
1320.
Kenney-Benson, G. A., Pomerantz, E. M., Ryan, A. M., & Patrick, H. (2006). Sex differences in
math performance: The role of children’s approach to schoolwork. Developmental
Psychology, 42, 11–26.

36
Kenny, D. A. (2011). Measuring Model Fit. http://davidakenny.net/cm/fit.htm
Kienzl, G., & Trent, W. (2009). Underrepresented undergraduates in STEM: From
matriculation to degree completion at large, research-intensive public universities. Report
to the Alfred P. Sloan Foundation.
Kupek, E. (2006). Beyond logistic regression: structural equations modeling for binary variables
and its application to investigating unobserved confounders. BMC Medical Research
Methodology, 6, 13-23.
Lamport, M. A. (1993). Student-faculty informal interaction and the effect on college student
outcomes: A review of the literature. Adolescence, 28, 971-990.
Leach, E. (2010). Challenges and opportunities for increasing the STEM pipeline. The League
for Innovation in the Community College, 23(9), 1.
Lent, R. W., & Brown, S. D. (2006). Integrating person and situation perspectives on work
satisfaction: A social-cognitive view. Journal of Vocational Behavior, 69, 236-247.
Lent, R. W., Brown, S. D., & Hackett, G. (1994). Toward a unifying social cognitive theory of
career and academic interest, choice and performance. Journal of Vocational Behavior, 45,
79-122.
Lent, R. W., Brown, S. D., & Hackett, G. (2000). Contextual supports and barriers to career
choice: a social cognitive analysis. Journal of Counseling Psychology, 47, 36-49.
Lent, R. W., Lopez, A. M., Lopez, F. G., & Sheu, H. (2008). Social cognitive career theory and
the prediction of interests and choice goals in the computing disciplines. Journal of
Vocational Behavior, 73, 52-62.
37
Lent, R. W., Lopez, F. G., & Bieschke, K. J. (1993). Predicting mathematics-related choice and
success behaviors: Test of an expanded social cognitive model. Journal of Vocational
Behavior, 42, 223-236.
Lent, R. W., Sheu, H., Gloster, C. S., & Wilkins, G. (2010). Longitudinal test of the social
cognitive model of choice in engineering students at historically Black universities. Journal
of Vocational Behavior, 76, 387-394.
Long, B. T. (2005) The remediation debate: Are we serving the needs of underprepared college
students? National CrossTalk, 13, 11-12. Retrieved from
http://www.highereducation.org/crosstalk/ct0405/voices0405-long.shtml
MacCallum, R. C., Browne, M. W., & Sugawara, H. M. (1996). Power analysis and
determination of sample size for covariance structure modeling. Psychological Methods, 1,
130-149.
Maple, S. A., & Stage, F. K. (1991). Influences on the choice of math/science major by gender
and ethnicity. American Educational Research Journal, 28(1), 37-60.
Marsh, H. W., Trautwein, U., Lüdtke, O., Köller, O., & Baumert, J. (2005). Academic self-
concept, interest, grades, and standardized test scores: Reciprocal effects models of causal
ordering. Child Development, 76(2), 397-416.
Muthén, L. K. & Muthén, B. O. (1998-2010). Mplus User’s Guide (6th ed.). Los Angeles:
Muthén & Muthén.
National Academies 2005 "Rising Above the Gathering Storm" Committee. (2010). Rising above
the gathering storm: Rapidly approaching Category 5. Washington, DC: Author.
National Science Board. (2010). Preparing the next generation of STEM innovators: Identifying
and developing our nation’s human capital. Arlington, VA: Author.

38
National Science Foundation (NSF). (2010). Science and Engineering Indicators 2010.
Arlington, VA: Author.
Newsom, J. (2010). Some Clarifications and Recommendations on Fit Indices,
http://www.upa.pdx.edu/IOA/newsom/semclass/ho_fit.pdf.
Pajares, F. (2005). Gender differences in mathematics self-efficacy beliefs. In A. M. Gallagher &
J. C. Kaufman (Eds.), Gender differences in mathematics: An integrative psychological
approach (pp. 294–315). New York: Cambridge University Press.
Pascarella, E. T., & Terenzini, P. T. (2005). How college affects students: Vol. 2. A third decade
of research. San Francisco: Jossey-Bass.
Porter, S. R., & Umbach, P. D. (2006). College major choice: An analysis of person–
environment fit. Research in Higher Education, 47, 429-449.
Russell, M. L., & Atwater, M. M. (2005). Traveling the road to success: A discourse on
persistence throughout the science pipeline with African American students at a
predominantly white institution. Journal of Research in Science Teaching, 42(6), 691-715.
Sadker, M., & Sadker, D. (1994). Failing at fairness: How America’s schools cheat girls. New
York: Simon & Schuster.
Schreiber, J. B., Stage, F. K., King, J., Nora, A., & Barlow, E. A. (2006). Reporting structural
equation modeling and confirmatory factor analysis results: A review. Journal of
Educational Research, 99(6), 323-337.
Schumacker, R. E. & Lomax, R.G. (2004). A beginner’s guide to structural equation modeling
(2nd ed.). Mahwah, NJ: Lawrence Erlbaum Associate.

39
Scott, A. B., & Mallinckrodt, B. (2005). Parental emotional support, science self-efficacy, and
choice of science major in undergraduate women. The Career Development Quarterly, 53,
263-273.
Seymour, E., & Hewitt, N. (1997). Talking about leaving: Why undergraduates leave the
sciences. Boulder, CO: Westview Press.
Shuman, L., Delaney, C., Scalise, A., Wolfe, H., & Besterfield-Sacre, M. (1999). Engineering
attrition: student characteristics and educational intitiatives. Charlotte, NC: American
Society for Engineering Education.
Staniec, J. F. O. (2004). The effects of race, sex, and expected returns on the choice of college
major. Eastern Economic Journal, 30, 549-562.Steiger, J. H., & Lind, J. C. (1980, May).
Statistically based tests for the number of factors. Paper presented at the meeting of the
Psychometric Society, Iowa City, IA.
Terenzini, P. T., Pascarella, E. T., & Blimling, G. S. (1999). Students’ out-of-class experiences
and their influence on learning and cognitive development: A literature review. Journal of
College Student Development, 40, 610-622.
Towers, S. (2008). A case study of gender bias at the postdoctoral level in physics, and its
resulting impact on the academic career advancement of females. arXiv.org. Retrieved May
16, 2008, from http://arxiv.org/abs/0804.2026?context=physics
U.S. Department of Labor (DOL). (2007). The STEM workforce challenge: The role of the public
workforce system in a national solution for a competitive science, technology, engineering,
and mathematics (STEM) workforce. Washington, DC: Author.
Ware, N. C., & Lee, V. E. (1988). Sex differences in choice of college science majors. American
Educational Research Journal, 25(4), 593-614.

40
Watt, H. M. G. (2006). The role of motivation in gendered educational and occupational
trajectories related to maths. Educational Research and Evaluation, 12, 305–322.
Wyer, M. (2003). Intending to stay: Images of scientists, attitudes toward women, and gender as
influences on persistence among science and engineering majors. Journal of Women and
Minorities in Science and Engineering, 9(1), 1-16.

41
Table 1 List of Variables in the Study Variable Name Description ELS Label Dependent Variable
Entrance into STEM fields of study
Respondent’s 2006 major field of study is in STEM fields. 1=yes, 0=no
Recoded from F2MAJOR2 F2MAJOR4
Mediating Variable
Intent to major in a STEM field Field of study respondent would most likely pursue when beginning at the first postsecondary institution is in STEM fields. 1=yes, 0=no
Recoded from F2B15
Independent Variable High school math preparation High school math standardized score F1TXMSTD
*Math self-efficacy beliefs
-Can do excellent job on math tests F1S18A -Can understand difficult math texts F1S18B -Can understand difficult math class F1S18C -Can do excellent job on math assignments F1S18D -Can master math class skills Items based on four-point Likert scales with 4 indicating "almost always" and 1 indicating "almost never"
F1S18E
*High school exposure to math and science courses
-Units in mathematics from high school transcript F1R27_C -Units in science from high school transcript F1R41_C
Postsecondary context of support and barriers
*Academic interaction
-Talk with faculty about academic matters outside of class F2B18A -Meet with advisor about academic plans Items based on three-point scales with 3 indicating "often" and 1 indicating "never"
F2B18B
*Preparation for college
-High school math prepared for college F2B17A -High school science prepared for college Items based on three-point scales with 3 indicating "a great deal" and 1 indicating "not at all"
F2B17B
Remediation -Took remedial reading, 1=yes, 0=no F2B16A -Took remedial writing, 1=yes, 0=no F2B16B -Took remedial math,1=yes, 0=no F2B16C
External demands -Whether has biological children, 1=yes, 0=no F2D03
-Hours worked weekly F2C26R F2C31R
Financial aid receipt Offered financial aid 1st year at college, 1=yes, 0=no F2PS1AID Demographic and control variables
Race Underrepresented minorities a, Asian American, and White Recoded from F1RACE
SES Socioeconomic status quartile F1SES1QR
Enrollment intensity 1=full-time, 0=part-time Recoded from F2B20A to H
Expecting to earn a graduate degree
Whether respondent expected to earn a graduate degree, 1=yes, 0=no
Recoded from F2STEXP
Note. Latent variables are represented by "*." a Underrepresented minorities include African Americans, Hispanics, Indian Americans, and multiple-racial students.

42
Table 2 Descriptive Statistics of Demographic Characteristics of the Sample, Unweighted and Weighted
Total N Expressed intent
to major in STEM fields (2004) Entered into STEM
fields of study (2006)
Unwgted Wgted Unwgted Wgted Unwgted Wgted N (%) N (%) N (%) N (%)
Gender
Female 3,436 708,844 374 (10.9%) 92,625 (10.9%) 352 (10.2%) 87,318 (10.3%)
Male 2,868 851,202 841 (29.3%) 210,236 (29.7%) 618 (21.5%) 153,355 (21.6%)
Race/Ethnicity
American Indian 80 19,170 11 (13.8%) 3,601 (18.8%) 9 (11.2%) 2,968 (15.5%)
Black 855 204,866 148 (17.3%) 33,978 (18.9%) 124 (14.5%) 29,024 (14.2%)
Hispanic 959 266,270 166 (17.3%) 46,979 (17.6%) 139 (14.5%) 37,552 (14.1%)
Multi-racial 321 84,243 71 (22.1%) 17,405 (20.7%) 51 (15.9%) 11,626 (13.8%)
Asian 826 214,049 156 (18.9%) 40,306 (18.8%) 113 (13.7%) 30,328 (14.2%)
White 3,263 788,765 663 (20.3%) 160,592 (20.4%) 534 (16.4%) 129,174 (16.4%)
SES
Lowest quartile 703 173,826 156 (22.2%) 37,246 (21.4%) 87 (12.4%) 20,149 (11.6%)
Second quartile 1,051 268,578 183 (17.4%) 47,942 (17.9%) 137 (13.0%) 34,611 (12.9%)
Third quartile 1,623 398,640 273 (16.8%) 69,080 (17.3%) 230 (14.2%) 56,242 (14.1%)
Highest quartile 2,927 719,001 603 (20.6%) 148,594 (20.7%) 516 (17.6%) 129,671 (18.0%)

43
Table 3 Model Fit Indices of the Single Sample
Fit Statistics
Chi-Square Test of Model Fit Value 1960.548 Degrees of Freedom 163 P-value 0.000
RMSEA (Root Mean Square Error of Approximation) Estimate 0.043 90 Percent C.I. 0.042, 0.045 Probability RMSEA <= 0.05 1.000
CFI/TLI CFI 0.964 TLI 0.957
44
Table 4 Racial, Gender, and SES Multiple-Group Structural Invariance Tests
*** p< 0.001, ** p< 0.01, * p< 0.05
Model Description χ2 df
CorrectedΔχ2
Non-Invariance (p<0.05) CFI TLI RMSEA
Racial Groups 1 White n = 3812 1436.92 163 -- -- 0.961 0.953 0.045 2 Asian n = 701 330.36 163 -- -- 0.967 0.960 0.038 3 Underrepresented Minorities n = 1376 579.91 163 -- -- 0.958 0.949 0.043 4 Baseline (factorial constrained) 2286.66 527 -- -- 0.961 0.957 0.041 5 All structural wgt. constrained 15 coeff. 2288.61 557 78.14*** Yes 0.962 0.960 0.040 6 Only EXP constrained 1 coeff. 2305.67 529 27.75*** Yes 0.961 0.957 0.041 7 Only MathSco constrained 1 coeff. 2301.87 529 26.36*** Yes 0.961 0.957 0.041 8 All other 13 constrained 13 coeff. 2250.66 553 26.33 No 0.963 0.960 0.040
Gender Groups 9 Male n = 2675 1062.48 163 -- -- 0.962 0.954 0.045
10 Female n = 3214 946.90 163 -- -- 0.967 0.960 0.039 11 Baseline (factorial constrained) 2039.14 345 -- -- 0.964 0.959 0.041 12 All structural wgt. constrained 15 coeff. 2011.94 360 20.04 No 0.965 0.962 0.039
SES Groups 13 SES 1st Quartile n = 654 290.42 163 -- -- 0.966 0.96 0.035 14 SES 2nd Quartile n = 958 462.91 163 -- -- 0.963 0.955 0.044 15 SES 3rd Quartile n = 1518 572.69 163 -- -- 0.966 0.96 0.041 16 SES 4th Quartile n = 2759 1061.54 163 -- -- 0.959 0.951 0.045 17 Baseline (factorial constrained) 2438.79 709 -- -- 0.962 0.959 0.041 18 All structural wgt. constrained 15 coeff. 2430.33 754 54.72 No 0.964 0.962 0.039

45
Table 5 Unstandardized and Standardized Estimates of Direct and Indirect Effects in the Racial Multiple-Group Model
*** p< 0.001, ** p< 0.01, * p< 0.05, † p< 0.10 (=) represents that the estimate is constrained equal across groups.
White Asian Under-Represented Minorities
Direct Effect Est. SE Std est. Est. SE Std est. Est. SE Std est.
INTENT ON
EFF 0.077*** 0.019 0.135 (=) (=) 0.131 (=) (=) 0.127
EXP 1.120*** 0.175 0.436 0.974*** 0.237 0.456 0.093 0.114 0.045
MATHSCO 0.059*** 0.005 0.059 0.026*** 0.008 0.026 0.027*** 0.006 0.027 STEM ON
ACA 0.162* 0.068 0.148 (=) (=) 0.176 (=) (=) 0.158
PRE 0.165*** 0.052 0.179 (=) (=) 0.308 (=) (=) 0.168
INTENT 1.123*** 0.069 1.123 (=) (=) (=) (=) (=) (=) MATHSCO 0.018*** 0.005 0.018 (=) (=) (=) (=) (=) (=) REMRDNG 0.005 0.159 0.005 (=) (=) (=) (=) (=) (=) REMWRTG -0.161 0.146 -0.161 (=) (=) (=) (=) (=) (=) REMMATH 0.136 0.136 0.136 (=) (=) (=) (=) (=) (=) AID 0.242** 0.095 0.242 (=) (=) (=) (=) (=) (=) FULLTIME -0.143 0.262 -0.143 (=) (=) (=) (=) (=) (=) GRADEXP 0.293** 0.093 0.293 (=) (=) (=) (=) (=) (=) CHILD -0.318 0.155 -0.318 (=) (=) (=) (=) (=) (=) WORKHOUR -0.001 0.006 -0.001 (=) (=) (=) (=) (=) (=)
Indirect Effect
EFF→INTENT→STEM 0.086*** 0.022 0.152 (=) (=) 0.147 (=) (=) 0.143
EXP→INTENT→STEM 1.258 *** 0.197 0.490 1.095*** 0.269 0.512 0.104 0.128 0.051
MATHSCO→INTENT→STEM 0.066 *** 0.007 0.066 0.029*** 0.009 0.029 0.031*** 0.007 0.031

46
Figure 1. Theoretical model for the study.
Exposure to Math and
Science
Math Self-Efficacy
Beliefs
Intent to Major in a
STEM Field Entrance into STEM Fields
of Study
Postsecondary Context of
Support and Barriers
High School Math
Preparation

47
Figure 2. SEM model.
High School Exposure to Math and
Science
Math Self-Efficacy
Beliefs
Intent to Major in a
STEM Field
Entrance into a STEM
Field of Study
High School Math
Preparation: Math Score
Financial Aid
AcademicInteraction
Adequacy of HS
Preparation for College
Postsecondary Context of Support and Barriers
External Demands
Child Work hours
Remediation Reading Writing
Math
Expecting a Graduate
Degree
Enrolled Fulltime
2004 2006

48
Figure 3. Final SEM results. W-White, A-Asian, U-Underrepresented minorities (=) indicates that the estimate is constrained equal across groups. *** p< 0.001, ** p< 0.01, * p< 0.05
W: 0.018***
A: (=)
U: (=)
W: 1.120***
A: 0.974***
U: 0.093
W: 0.059***
A: 0.026***
U: 0.027***
W: 1.123***
A: (=)
U: (=)
W: 0.162*
A: (=)
U: (=)
W: 0.165***
A: (=)
U: (=)
W: 0.293**
A: (=)
U: (=)
W: 0.242**
A: (=)
U: (=)
W: 0.077***
A: (=)
U: (=)
High School Exposure to Math and
Science
Math Self-Efficacy
Beliefs
High School Math
Preparation: Math Score
Intent to Major in a
STEM Field
AcademicInteraction
External Demands
Child Work hours
Adequacy of HS
Preparation for College
Entrance into a STEM
Field of Study
Remediation Reading Writing
Math
Financial Aid
Enrolled Fulltime
Expecting a Graduate
Degree
Postsecondary Context of Support and Barriers
2004 2006