modeling ssi financial eligibility and simulating the
TRANSCRIPT

Modeling SSI Financial Eligibility and Simulating the Effect ofPolicy Optionsfrom Social Security Bulletin, Vol. 64 No. 2
ERRATA
This article originally used frequency weights rather than normalized sampling weights inestimating the Supplemental Security Income participation model. As a result, the standarderrors reported in Table 7 (pages 30–31) were calculated based on population counts ratherthan sample counts and were thus substantially underestimated. Many of the coefficients are,in fact, statistically significant, although at lower levels of confidence in some cases; othersare not significant at conventional levels. The coefficient estimates and their associatedmarginal effects were correctly reported in Table 7. The errors have been corrected in theelectronic versions of the article.

Social Security Bulletin • Vol. 64 • No. 2 • 2001/200216
Modeling SSI Financial Eligibilityand Simulating the Effect of Policy Options
by Paul S. Davies, Minh Huynh, Chad Newcomb, Paul O’Leary,Kalman Rupp, and Jim Sears*
This article presents theSupplemental Security Income(SSI) Financial EligibilityModel developed in theDivision of Policy Evaluationof the Office of Research,Evaluation, and Statistics.Focusing on the elderly, thearticle simulates five potentialchanges to the SSI eligibilitycriteria and presents theeffects of those simulations onSSI participation, federalbenefits, and poverty amongthe elderly. Finally, thearticle discusses futuredirections for research andpotential improvements to themodel.
Acknowledgments: This articlerepresents the model developmenteffort of the Division of PolicyEvaluation’s Financial EligibilityModelingTeam. An earlier versionwas presented at the 2000 AnnualMeeting of the Southern Eco-nomic Association, November 10,2000, in Washington, D.C. We aregrateful to Susan Grad, BrianGreenberg, Howard Iams, JohnSabelhaus, and Charlie Scott forhelpful comments and sugges-tions. Correspondence regardingthis article should be directed toKalman Rupp [email protected].
*The authors are with theDivision of Policy Evaluation,Office of Research, Evaluation,and Statistics, Office of Policy,Social Security Administration.
Summary
This article simulates eligibility forSupplemental Security Income (SSI)among the elderly, analyzes factorsaffecting participation, and looks at thepotential effects of various options tomodify financial eligibility standards forthe federal SSI program.
We find that in the estimated noninsti-tutional elderly population of 30.2 millionin the United States in 1991, approxi-mately 2 million individuals aged 65 orolder were eligible for SSI (a 6.6 percentrate of eligibility). Our overall estimateof the rate of participation among eligibleelderly is approximately 63 percent,suggesting that more than a third of thosewho are eligible do not participate in theprogram. The results of our analysis offactors affecting participation among theeligible elderly show that a number ofdemographic and socioeconomic vari-ables are associated with the probabilityof participation.
We also simulate the effects ofvarious policy options on the povertyrate, poverty gap, annual program cost,the number of participants, and theaverage estimated benefits amongparticipants. The simulations considerthe potential effects of five policy
alternatives:
• Increase the general incomeexclusion (GIE) from $20 to $80.
• Increase the earned incomeexclusion (EIE) from $65 to $260.
• Increase the federal benefit rate(FBR) by $50 for individuals and$75 for couples and eliminate theGIE.
• Increase the asset threshold to$3,000 for individuals and $4,500for couples.
• Increase the asset threshold to$6,000 for individuals and $9,000for couples.
Using 1991 microdata from theSurvey of Income and Program Partici-pation (SIPP) matched to Social SecurityAdministration administrative recordsand making adjustments reflectingaggregate program statistics, we presentthe results of our simulations for Decem-ber 1999. The results show substantialvariation in the simulated effects of thefive policy alternatives along the variousoutcome dimensions considered. Thesimulated effects on the poverty gap ofthe elderly population range from a 7.9percent reduction (“Increase the GIE

Social Security Bulletin • Vol. 64 • No. 2 • 2001/2002 17
from $20 to $80”) to a 0.1 percent reduction (“Increasethe EIE from $65 to $260”). All simulated interventionsare expected to increase the rate of SSI participationamong the elderly from a high of 20.3 percent (“Increasethe GIE from $20 to $80”) to a low of 0.5 percent(“Increase the EIE from $65 to $260”).
We also find that the interventions that have greaterestimated effects in terms of increased participation andreduced poverty tend to cost more. At the high end, weestimate that increasing the GIE from $20 to $80 couldraise annual federal SSI cash benefit outlays by about 46percent, compared with only 0.9 percent for increasingthe EIE from $65 to $260. Similar to the EIE interven-tion, raising the resource thresholds by 50 percent wouldreduce the overall poverty gap of the elderly by only 0.2percent, would increase SSI participation only modestly(by 1.3 percent), but would entail slightly higher programcosts (by 1.4 percent). Increasing the asset threshold by200 percent would have higher estimated effects on allthree outcomes, but it would still be associated withrelatively low increases in both costs and benefits.Finally, the simulated effects on the three key outcomesof increasing the FBR by $50 for individuals and $75 forcouples, combined with eliminating the GIE, are relativelylarge but are clearly less substantial than increasing theGIE from $20 to $80.
This work relies on data from the SIPP matched toadministrative data on federal SSI benefits that provide amore accurate picture of SSI participation than has beenfeasible for previous studies. We simulate eligibility forfederal SSI benefits by applying the program rules todetailed information on the characteristics of individualsand couples based on the rich array of demographic andsocioeconomic data in the SIPP, particularly the compre-hensive information SIPP provides on assets and monthlyincome. A probit model is estimated to analyze factorsaffecting participation among the eligible elderly. Finally,we conduct the policy simulations using altered programrules represented by the policy alternatives and predictedparticipation probabilities to estimate outcomes undersimulated program rules. We compare those simulatedoutcomes to observed outcomes under current programrules. The results of our simulations are conditional on thecharacteristics of participants and eligibles in 1991, butthey also reflect aggregate adjustments capturing sub-stantial changes in overall participation and programbenefit levels between 1991 and 1999.
Introduction
The Supplemental Security Income (SSI) program servesas an income source of last resort for individuals who areelderly or severely disabled. SSI eligibility is restricted topeople with limited resources, and the benefit amount is
reduced as the recipient’s countable income rises. Chart1 provides a simplified description of the rules for SSIeligibility and benefit receipt.1 Relaxing the financialeligibility standards for SSI could have distinct separateeffects: current beneficiaries might receive higherincomes, previously ineligible individuals might becomeeligible for the program, and eligible nonparticipants mightbe induced to enroll in SSI. We explore these effects bydeveloping models of eligibility and participation for thefederal SSI program. Our ultimate goal is to simulate theeffects that modifying the SSI criteria for income andresource eligibility would have on program costs and onthe financial status of beneficiaries.2
People under age 65 must be found disabled beforethey may receive SSI benefits. To separate our discus-sion of financial eligibility from the issue of categoricaleligibility, we focus on people aged 65 or older. Ourmodel of financial eligibility applies to both elderly anddisabled individuals, but our current participation model isestimated only for the elderly.
Although restricting our attention to the elderly popula-tion simplifies our work, we still face a number of specificchallenges:
• What is the appropriate data source for estimatingSSI eligibility and participation?
• What is the appropriate unit of analysis?
• How should we measure program participation?
• How can we predict program participation undersimulated program rules?
• What are the relevant outcomes to focus on inassessing the effects of proposed policy changes?
• How can we make simulation results based onhistorical data useful to policymakers today?
In addressing these challenges, we describe ourmethodology and present the results of illustrative SSIpolicy simulations.
Previous Studies
Several previous studies have developed models of SSIeligibility and participation. We consider those studies interms of the data used, the focus (for example, questionsaddressed, populations of interest), and the methodology.
Virtually all existing studies of SSI eligibility andparticipation use publicly available survey data. Popularchoices include the Survey of Income and ProgramParticipation (Sheils and others 1990; Wixon and Vaughan1991; Vaughan and Wixon 1991; McGarry 1996), theCurrent Population Survey (Warlick 1982; Sheils andothers 1990), the Panel Study of Income Dynamics (Coe1985; Hill 1990), and more recently, the study of Assets

Social Security Bulletin • Vol. 64 • No. 2 • 2001/200218
and Health Dynamics Among the Oldest Old (Daviesforthcoming; McGarry 2000). Three previous studiesused survey data collected by the Social Security Admin-istration (SSA). Choi (1998) uses SSA’s New Benefi-ciary Survey and New Beneficiary Follow-up; Menefee,Edwards, and Schieber (1981) use 1973 and 1974 datafrom SSA’s Survey of Low-Income Aged and Disabled.Drazga, Upp, and Reno (1982)use data on 2,000 low-incomeelderly individuals collectedthrough a 1977 survey sponsoredby SSA.
The focus of previous studiesof SSI eligibility and participationvaries. Some studies areprimarily designed to conductdistributional analyses to studythe impact of various policyalternatives (for example, Sheilsand others 1990; Wixon andVaughan 1991; Vaughan andWixon 1991; McGarry 2000).Other studies contribute to theliterature a better understandingof the factors associated withparticipation in the SSI program(for example, McGarry 1996;Davies forthcoming). Related tothat group of studies are analy-ses that focus on factors thatlimit or reduce SSI participationamong individuals who appear tobe eligible for SSI benefits (forexample, Menefee, Edwards,and Schieber 1981; Coe 1985;Choi 1998).
The methodology is fairlyconsistent across recent studies.In general, survey data are usedto develop a microsimulationmodel of SSI eligibility at a givenpoint in time. Econometricmodels, including linear probabil-ity models and maximum likeli-hood probit or logit models, arethen estimated to examine thedecision to participate by eligibleindividuals. Some studies, suchas Hill (1990), develop morecomplex econometric models toanalyze SSI eligibility andparticipation.
As a direct extension ofprevious work at SSA (Wixon
and Vaughan 1991; Vaughan and Wixon 1991), theprimary purpose of our model is to simulate the effects ofpotential changes to the SSI program rules. In doing so,we focus on key outcomes including the number ofeligible individuals, the number of participants, the distri-bution of SSI benefits among participants, and thepoverty status of participants under various policy
Chart 1. Simplified rules fo r determining SSI eligibility and benefit amount
Age /disability status
SSI beneficiar y
Benefits=FBR–totaladjusted income
Asseteligible?
Incomeeligible?
Categorically eligible?
DENIEDNO
Assetthreshold
DENIEDNO
Countable assets YES
Unearned income
Earned income
Adjustedearnedincome
Adjustedunearned
income
General incomeexclusion (GIE)
Earned incomeexclusion (EIE)
YES
Federal benefitrate (FBR)
YES
DENIEDNO

Social Security Bulletin • Vol. 64 • No. 2 • 2001/2002 19
regimes. However, we also contribute to the participa-tion literature and provide insights on the differencesbetween survey, self-reported, and administrative mea-sures of SSI participation and benefits.
Data Sources
Our model has a distinct advantage over previous modelsof SSI eligibility and participation in that we have accessto data from the Survey of Income and Program Partici-pation (SIPP) matched to SSA administrative data.Although the SIPP collects very detailed information on awide variety of topics, including income sources, programparticipation, and assets, the ability to use administrativedata on SSI participation and SSI benefit amounts greatlyenhances the accuracy and validity of our model. In thissection we briefly describe the SIPP and the matchedadministrative data and discuss possible extensions toother SIPP panels and other SSA administrative data.Appendix A addresses construction of the sample and thederivation of standard error estimates that appropriatelyaccount for the complex sample design.
1990 Survey of Incomeand Program Participation
The SIPP is a household survey of the noninsti-tutionalized U.S. population. Our SSI eligibility andparticipation models are based on the 1990 panel of theSIPP. The 1990 panel consists of eight interviews, eachof which gathered 4 months of retrospective data. All ofthe data we use pertain to 1991.
The SIPP provides a number of advantages in model-ing SSI eligibility and participation. The survey collectsdetailed data on the sources and amounts of income andassets. Those data allow us to accurately identify theincome sources and assets that should be included in (orexcluded from) countable income and countable re-sources under the SSI program rules. The fact that theSIPP also provides the income data on a monthly basis iscrucial to the estimation of SSI eligibility, which can varyfrom month to month.
The SIPP core questionnaire collects detailed informa-tion on demographic characteristics and householdcomposition. Some demographic characteristics, such asage and marital status, are used to determine SSI eligibil-ity. Other characteristics, such as sex, race and ethnicity,educational attainment, and health insurance coverage(private, Medicare, Medicaid), are not directly used in theSSI eligibility determination but are important factors inthe SSI participation model and are useful for descriptivepurposes.
SIPP topical modules are available to supplement thecore information. We use information from TopicalModule 3 on disability and work limitations to determine
categorical eligibility for nonelderly individuals (that is, todetermine whether an individual meets the disabilitycriteria for SSI eligibility) and from Topical Module 4 onassets to determine resource eligibility for SSI.
Finally, the SIPP contains sufficient observations tosupport cross-sectional analyses of large subpopulations(for example, analyses of SSI participants by age cat-egory or sex).
SSA Administrative Data
The SIPP is exactly matched to administrative data fromfive sources (see Table 1), although we currently useonly the Supplemental Security Record (SSR) and theSummary Earnings Record (SER). The most importantadministrative data source for our model is the SSR. Asdescribed in more detail below, we replace self-reportedSSI participation and benefit amounts from the surveywith administrative reports from the SSR. We regardthese SSR data items to be of high quality because oftheir central role in the administration of the SSI program.We use the date-of-birth field on the SER to identify andremove improperly matched records.
Extensions to Other SIPP Panelsand Other SSA Administrative Data
Although the 1990 SIPP matched to SSA administrativerecords is a solid database on which to develop the SSIeligibility and participation models, it has some limitations.First, the data are relatively old. Ideally, policy analysiswould be based on up-to-the-minute data so that, forexample, simulations of policy changes being consideredin 2000 would be based on data from 1999 or 2000.Since that is rarely possible, we adjust our results fromthe 1990 SIPP to reflect the expected effect of policychanges in 2000. We are updating the model to run onthe 1993 and 1996 SIPP, which will provide more currentestimates.
Second, the sample size of the 1990 SIPP is not largeenough to support detailed analyses of subgroups. Wefind that 480 elderly individuals are eligible for SSI in thereference month for wave 4 of the 1990 SIPP.3 Al-though that number is sufficient for analyzing the charac-teristics of large groups, multiple SIPP panels need to becombined in order to support more detailed analyses ofsubgroups. The 1990 SIPP will be combined with the1993 and 1996 SIPP for this purpose in future work.
Although we do not currently use the Master Benefi-ciary Record (MBR), the Social Security NumberIdentification file (Numident), or the National DisabilityDetermination Services System (NDDSS) in our SSIeligibility and participation models, we plan to add them inthe near future. We plan to replace self-reported SocialSecurity participation and benefit amounts from thesurvey with administrative reports from the MBR.

Social Security Bulletin • Vol. 64 • No. 2 • 2001/200220
Preliminary analyses suggest that doing so will substan-tially improve our estimates of eligibility. Data from theNDDSS will clearly be useful as we refine the model’sestimates of eligibility and participation among nonelderlyindividuals with disabilities.
Estimating SSI Financial Eligibility
To be financially eligible for SSI, individuals must havelimited assets as well as limited monthly income. Forindividuals who live with their spouse, SSI eligibility alsodepends on the spouse’s resources and income. Conse-quently, eligibility is based on the characteristics of“family units” rather than individual characteristics. Weestimate SSI financial eligibility for adult units only. Someof the units are couples who report that they are marriedand that both spouses are present in the household.Other units are unmarried adults or individuals who areseparated from their spouse. We create a SIPP analysisfile at the unit level and use that file to calculate separateindicators of eligibility based on assets and income.
Asset Eligibility
The SSI thresholds for countable assets are $2,000 forindividuals and $3,000 for couples. These values have
not changed since 1989, which implies that the real valueof the asset thresholds has declined because of inflation.We define a unit to be asset-eligible if its estimatedcountable assets are below the relevant asset threshold.
We estimate countable assets by summing the SIPPself-reported amounts for savings accounts, checkingaccounts, Keogh accounts, savings bonds, money marketaccounts, stock and mutual fund equities, individualretirement accounts, mortgages, money owed from thesale of business or property, other financial investments,countable vehicle equity, and countable real estate equity.
We exclude the car, truck, or van with the greatestequity from our estimate of countable vehicle equity. TheSSI program rules limit this exclusion to $4,500 unless thevehicle is used for medical or work-related purposes.Since any car might be used for transportation to ahospital or doctor’s office, we believe that excluding thevehicle with the highest equity is a reasonable approxima-tion of the program rules. We sum the equity in theremaining vehicles, including all equity in boats andmotorcycles.
The primary residence is not a countable asset for SSIpurposes. Other real estate generally is counted exceptthat $6,000 per rent-generating property may be excludedunder the property essential to self-support (PESS) rule.4
Source of data Coverage Key data items
Supplemental Security Record SSI applicants and recipients Social Security number, monthly SSI payment status, monthly federal SSI benefit amount, monthly federally administered state supplement amount, date of birth, sex, disability diagnosis code, application date, date of first payment, monthly countable earned and unearned income, state and county code
Master Beneficiary Record OASDI applicants and beneficiaries
Social Security number, payment eligibility history, sex, race, date of birth, primary insurance amount, average indexed monthly earnings, state and county code, current date of entitlement, date of filing, type of claim, disability diagnosis code, and dual entitlement status code
Summary Earnings Record All workers Social Security number, annual Social Security-covered earnings from 1951 to the present, sex, race, date of birth, date of death
Social Security Number Identification (Numident) file
All Social Security number holders
Social Security number, date of birth, date of death
National Disability Determination Services System
All disability decisions (SSI and DI)
Social Security number, beneficiary identification code, filing date, type of claim, date of disability decision, result of disability determination, date of birth, disability diagnosis codes, date disability period began
Table 1.Summary of SSA administrative data matched to the SIPP
NOTE: SIPP = Survey of Income and Program Participation; SSI = Supplemental Security Income; OASDI = Old-Age, Survivors, and Disability Insurance; DI = Disability Insurance.
Social Security Bulletin • Vol. 64 • No. 2 • 2001/2002 21
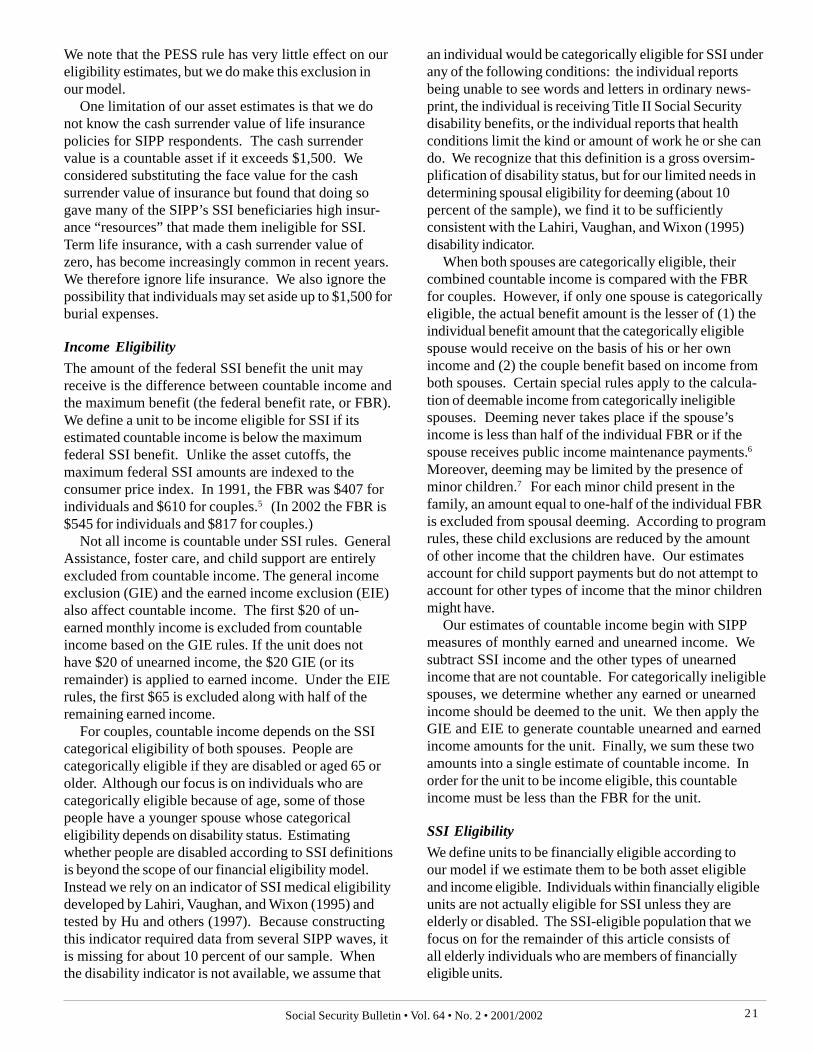
We note that the PESS rule has very little effect on oureligibility estimates, but we do make this exclusion inour model.
One limitation of our asset estimates is that we donot know the cash surrender value of life insurancepolicies for SIPP respondents. The cash surrendervalue is a countable asset if it exceeds $1,500. Weconsidered substituting the face value for the cashsurrender value of insurance but found that doing sogave many of the SIPP’s SSI beneficiaries high insur-ance “resources” that made them ineligible for SSI.Term life insurance, with a cash surrender value ofzero, has become increasingly common in recent years.We therefore ignore life insurance. We also ignore thepossibility that individuals may set aside up to $1,500 forburial expenses.
Income Eligibility
The amount of the federal SSI benefit the unit mayreceive is the difference between countable income andthe maximum benefit (the federal benefit rate, or FBR).We define a unit to be income eligible for SSI if itsestimated countable income is below the maximumfederal SSI benefit. Unlike the asset cutoffs, themaximum federal SSI amounts are indexed to theconsumer price index. In 1991, the FBR was $407 forindividuals and $610 for couples.5 (In 2002 the FBR is$545 for individuals and $817 for couples.)
Not all income is countable under SSI rules. GeneralAssistance, foster care, and child support are entirelyexcluded from countable income. The general incomeexclusion (GIE) and the earned income exclusion (EIE)also affect countable income. The first $20 of un-earned monthly income is excluded from countableincome based on the GIE rules. If the unit does nothave $20 of unearned income, the $20 GIE (or itsremainder) is applied to earned income. Under the EIErules, the first $65 is excluded along with half of theremaining earned income.
For couples, countable income depends on the SSIcategorical eligibility of both spouses. People arecategorically eligible if they are disabled or aged 65 orolder. Although our focus is on individuals who arecategorically eligible because of age, some of thosepeople have a younger spouse whose categoricaleligibility depends on disability status. Estimatingwhether people are disabled according to SSI definitionsis beyond the scope of our financial eligibility model.Instead we rely on an indicator of SSI medical eligibilitydeveloped by Lahiri, Vaughan, and Wixon (1995) andtested by Hu and others (1997). Because constructingthis indicator required data from several SIPP waves, itis missing for about 10 percent of our sample. Whenthe disability indicator is not available, we assume that
an individual would be categorically eligible for SSI underany of the following conditions: the individual reportsbeing unable to see words and letters in ordinary news-print, the individual is receiving Title II Social Securitydisability benefits, or the individual reports that healthconditions limit the kind or amount of work he or she cando. We recognize that this definition is a gross oversim-plification of disability status, but for our limited needs indetermining spousal eligibility for deeming (about 10percent of the sample), we find it to be sufficientlyconsistent with the Lahiri, Vaughan, and Wixon (1995)disability indicator.
When both spouses are categorically eligible, theircombined countable income is compared with the FBRfor couples. However, if only one spouse is categoricallyeligible, the actual benefit amount is the lesser of (1) theindividual benefit amount that the categorically eligiblespouse would receive on the basis of his or her ownincome and (2) the couple benefit based on income fromboth spouses. Certain special rules apply to the calcula-tion of deemable income from categorically ineligiblespouses. Deeming never takes place if the spouse’sincome is less than half of the individual FBR or if thespouse receives public income maintenance payments.6
Moreover, deeming may be limited by the presence ofminor children.7 For each minor child present in thefamily, an amount equal to one-half of the individual FBRis excluded from spousal deeming. According to programrules, these child exclusions are reduced by the amountof other income that the children have. Our estimatesaccount for child support payments but do not attempt toaccount for other types of income that the minor childrenmight have.
Our estimates of countable income begin with SIPPmeasures of monthly earned and unearned income. Wesubtract SSI income and the other types of unearnedincome that are not countable. For categorically ineligiblespouses, we determine whether any earned or unearnedincome should be deemed to the unit. We then apply theGIE and EIE to generate countable unearned and earnedincome amounts for the unit. Finally, we sum these twoamounts into a single estimate of countable income. Inorder for the unit to be income eligible, this countableincome must be less than the FBR for the unit.
SSI Eligibility
We define units to be financially eligible according toour model if we estimate them to be both asset eligibleand income eligible. Individuals within financially eligibleunits are not actually eligible for SSI unless they areelderly or disabled. The SSI-eligible population that wefocus on for the remainder of this article consists ofall elderly individuals who are members of financiallyeligible units.
Social Security Bulletin • Vol. 64 • No. 2 • 2001/200222
Not surprisingly, the demographic characteristics ofaged individuals who are eligible for SSI are quitedifferent from the characteristics of those who are not(see Table 2). For example, the average total SSI-countable income for eligible units is $264, comparedwith $1,878 for noneligible units. Even more dramatic isthe difference in SSI-countable resources—just $248for eligible individuals compared with over $80,000 forthose who are not eligible. Eligible individuals also havemuch lower levels of monthly earnings and SocialSecurity benefits; are less likely to be covered byMedicare, to be born in the United States, and to beU.S. citizens; and are more likely to receive FoodStamps and to be covered by Medicaid. Furthermore,the distribution of eligible individuals by marital status,race, Hispanic ethnicity, and educational attainment ismuch different than for those who are not eligible.Specifically, eligible individuals are more likely to bedivorced, separated, or widowed; black or Hispanic; andto have completed less than a high school education.All of these observed differences substantiate priorexpectations and conform to the definition of SSIeligibility: individuals who are eligible for SSI benefitshave very little in the way of economic resources,human capital, and family support.
Analysis of Program Participation
In this section we discuss the measurement of programparticipation, the development of our participationmodel, and the empirical results from that model. Ouranalysis of the measurement of participation covers boththe aged and working-age disabled, although ouranalysis of substantive results in this article is limited tothe aged.
Measurement of Program Participation
The SIPP measures the receipt of both federal SSIbenefits and state supplementation. The SSR containsmonthly information on the receipt of SSI payments.Since our model of financial eligibility is a model offinancial eligibility for federal SSI benefits, we defineSSI participation on the basis of participation in thefederal SSI program. Any person 18 years of age orolder with a positive federal SSI payment amount forthe reference month should, conceptually, be regardedas a participant. Huynh, Rupp, and Sears (2002)provide a detailed comparison of SIPP and administra-tive data on SSI and Social Security participation andbenefits.
From the SIPP and the SSR, we have three differentmeasures of SSI participation, because the SSR con-tains two conceptually different payment fields. Thefederal computational amount (FEDAMT) reflects
SSA’s current assessment of the amount of benefits forwhich the person is eligible during a given month. Thatamount is essentially the one that is posted to the benefi-ciary for a given month. It may be different from actualbenefit payments because of possible overpayments orunderpayments that add to or offset this amount. Incontrast, the federal payment amount (FEDPMT)reflects the actual federal money paid in a given month,including back payments for previous underpayments ordeductions for previous overpayments.8 In that sense, itrepresents the amount that was actually disbursed to theindividual in the month.
We compared the unweighted counts of participantsusing FEDAMT and FEDPMT (both aged and working-age disabled are included in the following tabulations).The two measures produce similar overall results (seeTable 3). Of the 35,605 unweighted observations in ourfile, 98 percent are identified as nonparticipants, and 1.8percent are identified as participants by both measures.However, 0.13 percent of the total are identified asparticipants by the FEDAMT measure but as nonpartici-pants by the FEDPMT measure, and the reverse occursin 0.04 percent of the cases. Overall, FEDPMT identi-fies a slightly lower fraction of the overall total as partici-pants (1.88 percent) than does FEDAMT (1.97 percent).
Because the FEDPMT measure is conceptually closerto the survey concept of participation, we focus onFEDPMT in comparisons with the SIPP measure. Thedifferences are larger in this comparison (see Table 3).Overall, the SIPP identifies a higher proportion of the fileas participants (2.34 percent) than does FEDPMT (1.88percent). Although the two sources consistently identify97.46 percent of the observations as nonparticipants and1.68 percent as participants, the 0.67 percent of observa-tions identified as participants in the SIPP but as nonpar-ticipants by FEDPMT, and the 0.20 percent with thereverse discrepancy, are relatively large compared withthe proportion consistently identified as participants.Although the consistent identification of 97.46 percent ofthe observations suggests good performance in screeningout SSI participants from the general population, it doesnot imply great precision if the focus is on screening inSSI participants.
If our focus is on measuring SSI participation ratherthan on the relevant overall population, the importance ofsurvey measurement error becomes apparent. Assumingthat the FEDPMT information reflects “true” participa-tion, the SIPP overestimates SSI participation, overall, by24 percent [(2.34/1.88-1)*100]. In addition, almost 30percent of individuals identified as SSI participants in theSIPP are shown to be nonparticipants in administrativerecords, and about 11 percent of “true” participants asmeasured by administrative records are coded as nonpar-ticipants in the SIPP.

Social Security Bulletin • Vol. 64 • No. 2 • 2001/2002 23
Mean Mean
162.22 7.41 . . . . . .264.46 10.31 1,878.12 30.99247.86 32.56 80,706.31 3,565.02
1,047.95 71.71 2,349.82 37.43
74.46 0.36 73.20 0.1075.96 2.19 56.42 0.63
Married, spouse present 22.34 3.19 57.69 0.95Divorced, separated, spouse absent 19.25 2.27 6.17 0.36Widowed 49.53 3.18 31.48 0.87Never married 8.88 1.37 4.66 0.36
White 63.89 2.67 92.15 0.49Black 31.54 2.43 6.61 0.44American Indian, Alaska Native 0.56 0.32 0.13 0.04Asian, Pacific Islander 4.00 1.14 1.11 0.22
16.04 1.86 2.76 0.2666.59 3.01 82.62 0.7273.25 2.77 88.08 0.65
Less than high school 80.64 2.55 40.57 0.89High school 14.83 2.12 31.07 0.71More than high school 4.53 1.26 28.36 0.83
9.95 3.47 162.19 11.18223.32 8.67 545.98 4.61
4.24 0.97 2.89 0.4731.61 2.87 1.75 0.2568.74 2.52 2.68 0.2791.85 1.65 98.19 0.19
Excellent, very good 8.71 1.35 28.60 0.81Good 28.90 2.36 34.81 0.78Fair 32.05 2.65 25.15 0.68Poor 30.34 2.72 11.45 0.57
WeightedUnweighted
U.S. citizen (percent)
Earnings (dollars/month)
Education (percentage distribution)
Medicaid (percentage covered)Medicare (percentage covered)
Welfare benefits (TANF and GA, dollars/month)Food Stamp participant (percent)
Social Security benefits (dollars/month)
Eligible Not eligible
Standard error
Number of observations
Born in the United States (percent)
Total SSI-countable resources
Total family income (monthly, including SSI)
Hispanic (percent)
Total SSI-countable income (monthly)
NOTES: The institutionalized population is excluded from all estimates. All statistics are weighted using the SIPP wave 4 sample weights. Standard errors are computed using a Taylor-series approximation to correct for the complex sample design of the SIPP.
SOURCES: Estimates are from the SSI Financial Eligibility Model, based on the 1990 Survey of Income and Program Participation (SIPP), wave 4, month 4, exactly matched with the Social Security Administration's Supplemental Security Record, Summary Earnings Record, and Numident file.
Standard error
48028,201,840
5,5492,017,197
Unit level (dollars)
General health status (percentage distribution)
Table 2. Characteristics of units and individuals aged 65 or older, by SSI eligibility status, 1991
TANF = Temporary Assistance for Needy Families; GA = General Assistance; . . . = not applicable.
Individual level
Characteristic
Marital status (percentage distribution)
Race (percentage distribution)
Age (years)Sex (percentage female)
SSI benefit amount (model based)

Social Security Bulletin • Vol. 64 • No. 2 • 2001/200224
Chart 2 illustrates the relationship between measuredparticipation status based on the SIPP and the SSRFEDPMT variable for simulated eligibles. It also pro-vides similar information for simulated ineligibles.
What measure should we use in the analysis? A priorireasoning suggests that FEDPMT is superior toFEDAMT because the former reflects actual payments.FEDPMT also appears superior to survey self-reportedparticipation because the administrative records that areused to generate the actual payments should be of highquality and should not be affected by reporting bias. Inaddition, we find a better empirical fit between our SSIeligibility model and FEDMPT than with either of theother two measures in terms of the proportion of mea-sured SSI participants predicted to be eligible by ourmodel.9 Because of the conceptual superiority and betterempirical fit of the FEDPMT variable, we use it as themeasure of participation.
Is our measure of SSI eligibility consistent with ourmeasure of participation? Appendix B addresses thisissue in some detail. Essentially, replacing the surveymeasure of participation with FEDPMT and otherchanges (treatment of life insurance) dramatically reducethe proportion of participants classified as ineligible, but asubstantial portion remain. The distribution of the re-maining ineligible participants and the reason for ineligibil-ity are provided in Table 4. There are plausibleexplanations for most of these cases, and the data aresufficiently accurate to be used for modeling participationamong the elderly.
Descriptive Data on Eligibility and Participation
SSI-eligible participants and SSI-eligible nonparticipantsaged 65 or older present quite different demographic
profiles (see Table 5). In particular, among eligibleparticipants, the average calculated SSI benefit from theSSI eligibility model ($190.70) is within $0.60 of theaverage SSI payment to eligible participants from theSSR ($190.14). On average, our SIPP-based eligibilitymodel predicts SSI benefit amounts remarkably well.
Although there are many substantial differencesbetween eligible participants and eligible nonparticipants,the differences are not as pronounced as those betweenindividuals who are and are not eligible for SSI. Eligibleparticipants have a much higher calculated SSI benefit(from the SSI eligibility model) than do eligible nonpartici-pants, which is consistent with their lower SSI-countableincome. Eligible participants on average also havesubstantially fewer SSI-countable resources. Further-more, eligible participants are more likely to be divorcedor widowed, to be Hispanic, to participate in the FoodStamp program, and to have Medicaid coverage. Theyare less likely to be born in the United States, to be aU.S. citizen, and to have completed high school. AverageSocial Security benefits are somewhat lower for eligibleparticipants than for eligible nonparticipants. Generalhealth status is noticeably poorer among eligible partici-pants: a larger proportion of eligible participants are inpoor health (self-reported), but a larger proportion are inexcellent or very good health as well. A plausible inter-pretation is that, other things being equal, excellent orvery good health increases access to SSI.
The overall participation rate among all eligible indi-viduals aged 65 or older is 62.4 percent (Table 6). Thatrate is somewhat higher than prevailing estimates in theliterature, which generally range between 50 percent and60 percent (see, for example, Warlick 1982; Sheils andothers 1990; McGarry 1996; Davies forthcoming; and
34,889 97.99 47 0.13 34,936 98.12
14 0.04 655 1.84 669 1.88
Total 34,903 98.03 702 1.97 35,605 100.0
34,699 97.46 237 0.67 34,936 98.12
72 0.20 597 1.68 669 1.88
Total 34,771 97.66 834 2.34 35,605 100.0
Participant
SOURCE: 1990 Survey of Income and Program Participation (SIPP), wave 4, month 4, exactly matched with the Social Security Administration's Supplemental Security Record, Summary Earnings Record, and Numident file.
Participation based on federal SSI payment amount (FEDPMT)
Nonparticipant
Participant
Nonparticipant
Number Percent
Participant
Number
Table 3. Two definitions of SSI participation from SSA's administrative records
Participation based on SIPP
Participation based on federal SSI computation amount (FEDAMT)
PercentPercentNumber
Nonparticipant Total

Social Security Bulletin • Vol. 64 • No. 2 • 2001/2002 25
McGarry 2000). As discussedpreviously, our data allow us touse measures of SSI participationdirectly from SSA’s administrativerecords. Those records arethought to be of much higherquality than survey reports of SSIparticipation because of theircentral role in the administration ofthe SSI program. We thereforebelieve that our estimate of theSSI participation rate is moreaccurate than previous estimatesthat use survey data alone.
The participation rate amongeligible individuals aged 65 or olderalso varies by individual character-istics (see Table 6). The partici-pation rate is substantially higherfor women than men, for allmarital status categories relativeto married individuals, and forHispanics relative to non-Hispan-ics. African American and whiteindividuals have very similarparticipation rates. Noncitizenshave a much higher participationrate than citizens.
Differences in participationrates by educational attainmentand by general health status mayappear somewhat puzzling.Individuals with more than a highschool education have a higherparticipation rate than individualswith a high school degree. Indi-viduals in excellent or very goodhealth have a higher participationrate than individuals in good, fair,or poor health, although theparticipation rate for those in poorhealth is also quite high. Onepossible explanation is that bothhigher educational attainment andexcellent health contribute togreater access because of accessto information (awareness ofprogram rules), physical access(transportation), or both.
Measured vs. ActualNonparticipation
One important issue concerningthe policy interpretation of our
Chart 2. SSI participation status among simulated eligibles and ineligibles as measured b y SIPP and SSA administrative recor ds
Eligible a
Ineligible b
175 participants from administrative records
553 participants from administrative records
562 participants from SIPP
Administrative records = Yes, SIPP = No (44 cases)
Nonparticipant in both (740 cases)
SIPP = Yes, Administrative records = No (53 cases)
Participant in both (509 cases)
Participant in both (134 cases)
Administrative records = Yes, SIPP = No (41 cases)
SIPP = Yes, Administrative records = No (136 cases)
Nonparticipant in both (33,946 cases)
a. Chart is based on 1,346 unweighted sample observations. The size of the area of each section of the chart is not proportional to the number of observations and therefore should be viewed as illustrative of broad patterns rather than an exact representation. SSR data reflect actual payment status.
b. Chart is based on 34,257 unweighted observations. The size of the area of each section of the chart is not proportional to the number of observations and therefore should be viewed as illustrative of broad patterns rather than an exact representation. In particular, note that the relative size of the "Nonparticipant in both" group is substantially underrepresented by the corresponding area of the chart. SSR data reflect actual payment status.
SOURCES: Survey of Income and Program Participation and Supplemental Security Record.
NOTES: SSI = Supplemental Security Income; SIPP = Survey of Income and Program Participation; SSR = Supplemental Security Record.
270 participants from SIPP

Social Security Bulletin • Vol. 64 • No. 2 • 2001/200226
estimated participation rate is whether and to what extentthe results represent problems with the measurement ofnonparticipation as opposed to “true” nonparticipationamong eligibles. Policy concerns about nonparticipationand outreach interventions are thus predicated on thenotion that measured nonparticipation among eligiblesreflects genuine nonparticipation. In our case, themeasured degree of nonparticipation is almost 40 percentamong the elderly.
Since our measure of participation is based on adminis-trative records and can be reasonably treated as highlyaccurate, the issue of measurement error boils down tothe measurement of the pool of eligibles. Measurementerror could arise either from the eligibility model or, morelikely, from the SIPP data used as inputs to calculateeligibility. Although our eligibility model uses somesimplifying assumptions (for example, we ignore in-kindsupport and the face value of life insurance policies), wesee no obvious reason to believe that those assumptionswould substantially and significantly bias our estimate ofthe pool of eligibles. Thus we are essentially left with thepossibility that measurement error arises from the SIPPdata. There are three principal variables in the SIPP toconsider as a source of error: age, income, and assets.
Age. Though a possible source of error, age is generallybelieved to be reasonably well measured in both adminis-trative data and the SIPP.10 Any random error thatoccurred in measuring age in either or both should notpose a serious problem in estimating participation rates.One possible source of observed discrepancies in the ageinformation from matched administrative records and theSIPP is not rooted in measurement error in either data setbut could be cause for concern—the possibility that amismatch exists between SIPP observations and adminis-trative records that is attributable to misreporting ofSocial Security numbers by SIPP respondents. Themismatch could cause some systematic error in estimat-ing rates of participation even if the misreporting ofSocial Security numbers was totally random and age wasmeasured with complete precision in both data sets. Thereason is that the true rate of participation among theelderly is much higher than among the working aged,because SSI eligibility for the elderly is not conditioned ondisability status but it is for the nonaged. Thus, evenrandom misclassification of people by age could dilute themeasured participation rate. Nevertheless, given that theincidence of observed mismatch by age larger than ayear in absolute value is fairly small and that onlymisclassification that occurs among those over the age of65 should be of concern here, factors related tomisreporting of age or Social Security number should notsubstantially bias the measured rate of nonparticipation.Income. With respect to income, the principal concern is
possible underreporting.11 Such underreporting wouldproduce an upward bias in the estimate of the number ofeligibles and therefore would artificially depress themeasured participation rate. The SIPP provides substan-tial detail on monthly income sources and amounts. Weare unaware of any substantial concerns or evidence ofsystematic underreporting of income, particularly amongthe elderly.12 Some evidence suggests that people tendto report Social Security income net of Medicare Part Bpremium withholdings, but that is unlikely to explainmeasured nonparticipation of almost 40 percent. More-over, some factors are operating in the opposite direction,such as possible misreporting of SSI income as SocialSecurity by some persons. Another possible concern isunreported income from the underground economy, whichmay arise with respect to unreported employment orinvestment income. Neither is plausibly an importantsource of income among the relatively poor elderly.Overall, we believe that underreporting of income is anunlikely explanation for the measured nonparticipationamong the elderly.
Assets. The possible underreporting of assets is the onlyremaining explanation, but it does not appear to be aplausible source of the measured nonparticipation in SSIamong the elderly. The SIPP is believed to do a rela-
. . . . . . . . .69 . . . 69
9 4 131 . . . 1
29 38 6715 . . . 15
2 6 82 . . . 2
Total 127 48 175
NOTE: . . . = not applicable.
Table 4.Ineligible participants, by source of ineligibility and age group
Categorically eligibleCategorically ineligible
Income ineligible
SOURCE: Estimates are from the SSI Financial Eligibility Model, based on the 1990 Survey of Income and Program Participation, wave 4, month 4, exactly matched with the Social Security Administration's Supplemental Security Record, Summary Earnings Record, and Numident file.
Resource eligible
Resource ineligibleCategorically eligibleCategorically ineligible
Categorically eligibleCategorically ineligible
Income eligible
Source of ineligibilityNonelderly
(18–64)Elderly
(65 or older) Total
Resource eligible
Resource ineligible
Categorically eligibleCategorically ineligible

Social Security Bulletin • Vol. 64 • No. 2 • 2001/2002 27
Mean Mean
Based on eligibility model 190.70 10.55 114.90 10.54Federal payment amount 190.14 7.73 a . . . . . .
230.56 13.66 320.79 14.00192.08 45.14 340.52 46.19
1,115.23 91.14 936.17 84.31
74.54 0.45 74.31 0.5077.44 2.88 73.49 3.19
Married, spouse present 19.87 4.13 26.44 4.17Divorced, separated, spouse absent 20.79 3.17 16.71 3.00Widowed 49.44 4.41 49.66 4.56Never married 9.90 1.71 7.19 2.21
White 64.05 3.55 63.63 4.25Black 31.26 3.19 32.01 4.07American Indian, Alaska Native 0 0 1.50 0.87Asian, Pacific Islander 4.70 1.75 2.85 1.37
17.43 2.64 13.72 2.6465.26 3.80 68.81 4.0069.72 3.79 79.12 3.06
Less than high school 81.94 3.19 78.47 3.38High school 13.63 2.72 16.84 2.80More than high school 4.43 1.64 4.69 1.79
1.53 1.25 23.94 8.73208.24 11.74 248.37 10.78
4.83 2.01 3.26 1.5144.18 3.96 10.72 2.2595.72 1.22 23.92 3.7691.87 2.12 91.81 2.09
Excellent, very good 9.78 1.89 6.92 2.19Good 24.83 3.55 35.69 3.66Fair 32.18 3.52 31.82 4.05Poor 33.20 3.70 25.57 3.59
WeightedUnweighted
a.
TANF = Temporary Assistance for Needy Families; GA = General Assistance; . . . = not applicable.
NOTES: The institutionalized population is excluded from all estimates. All statistics are weighted using the SIPP wave 4 sample weights. Unless otherwise noted, standard errors are computed using a Taylor-series approximation to correct for the complex sample design of the SIPP.
The standard error for the SSI payment amount is not corrected for complex sample design of SIPP and is therefore biased downward.
Total SSI-countable income (monthly)Total SSI-countable resourcesTotal family income (monthly, including SSI)
SOURCE: Estimates are from the SSI Financial Eligibility Model, based on the 1990 Survey of Income and Program Participation (SIPP), wave 4, month 4, exactly matched with the Social Security Administration's Supplemental Security Record, Summary Earnings Record, and Numident file.
Medicare (percentage covered)General health status (percentage distribution)
Food Stamp participant (percent)Welfare benefits (TANF and GA, dollars/month)
Earnings (dollars/month)
Born in the United States (percent)U.S. citizen (percent)Education (percentage distribution)
SSI benefit amount
Race (percentage distribution)
Social Security benefits (dollars/month)
Hispanic (percent)
Table 5. Characteristics of SSI-eligible units and individuals aged 65 or older, by SSI participation status, 1991
Participants
Characteristic
Standard error
Nonparticipants
Standard error
Unit level (dollars)
Individual level
1,259,276 757,921292 188
Number of observations
Medicaid (percentage covered)
Age (years)Sex (percentage female)Marital status (percentage distribution)

Social Security Bulletin • Vol. 64 • No. 2 • 2001/200228
tively good job in measuring asset income. Moreoverincome and assets are correlated: those who are incomeeligible are likely to have low assets as well. Althoughwe cannot altogether discount the possibility thatunderreporting of assets helps explain measurednonparticipation (particularly because of the relativelylow SSI asset limits), we are not aware of any evidencesuggesting that it does.
Despite some uncertainty concerning the relativecontribution of true nonparticipation and measurementerror, our overall assessment is that measurement errordoes not explain away observed nonparticipation, and theevidence clearly suggests the existence of some, possiblysubstantial nonparticipation in SSI among the elderly.This conclusion is also supported by positive evidence aswell.
First, participation may be affected by the opportunitycosts that eligibles face in applying, imperfect information,and perceived stigma. All of these factors reduce thedemand for program participation among eligibles.
Second, one can reasonably argue that administrativepractices and other factors related to the applicationprocess are unlikely to result in incorrect denials of trueeligibles (among the elderly) and therefore provide nocredible explanation of measured nonparticipation. Weare unaware of substantial incentives or evidence forfield office personnel to turn away eligible elderly. Ifanything, field office personnel may reduce theirworkload by not collecting comprehensive information onall possible sources of income and asset eligibility, al-though quality control reduces the incentives to do so.Moreover, applicants face incentives to underreportincome and assets—and certainly more so in applying forbenefits than in responding to a national survey. Finally,although changes in income, assets, and living arrange-ments may make initially eligible awardees subsequentlyineligible, one can reasonably assume that SSA often failsto detect such changes in eligibility status or detects themwith some lag. These considerations are supported byevidence from our model revealing that a nontrivialproportion of participants are ineligible.
Third, outreach demonstrations appear to have suc-ceeded in increasing participation in SSI. The mostplausible explanation is that the demonstrations success-fully identified and enrolled eligible nonparticipants, thusproviding prima facie evidence of the existence of a poolof nonparticipants.
Overall, these programmatic factors suggest thatmeasured nonparticipation is real, not a simple artifact ofmeasurement error. Having said that, it is also clear that100 percent participation among eligibles would not be areasonable objective because of a variety of factors,including the voluntary nature of the program and opera-tional difficulties.
All eligible individuals aged 65 or older 62.43 2.73
63.08 3.6661.75 3.37
58.57 4.9563.65 3.05
55.53 6.9667.39 5.9562.32 3.7969.57 7.88
62.58 4.0261.87 3.82
0 073.23 12.88
67.86 6.2661.39 2.88
61.12 3.1364.87 4.72
59.36 3.1270.62 4.69
63.44 2.9957.35 6.4261.07 12.59
70.25 8.4053.74 5.9862.80 4.9768.43 4.03
Table 6. SSI participation rate among eligible individuals aged 65 or older, by individual characteristics, 1991
Characteristic
Women
Married, spouse presentDivorced, separated, spouse absent
Age category
Sex
65–7475 or older
Country of birth
Marital status
Race
Ethnicity
American Indian, Alaska NativeAsian, Pacific Islander
Hispanic
Never married
White
Excellent, very goodGoodFair
Men
Widowed
Education
General health status
Not U.S. citizen
Less than high schoolHigh school
Number of eligibles Poor
Weighted 2,017,197
Participation rate
Standard error
More than high school
Not Hispanic
Born in the United States
Citizenship statusBorn elsewhere
U.S. citizen
Black
Unweighted
Unweighted
Weighted Number of participants
NOTES: The institutionalized population is excluded from all estimates. All statistics are weighted using the SIPP wave 4 sample weights. Standard errors are computed using a Taylor-series approximation to correct for the complex sample design of the SIPP.
SOURCE: Estimates are from the SSI Financial Eligibility Model, based on the 1990 Survey of Income and Program Participation (SIPP), wave 4, month 4, exactly matched with the Social Security Administration's Supplemental Security Record, Summary Earnings Record, and Numident file.
480
1,259,276292

Social Security Bulletin • Vol. 64 • No. 2 • 2001/2002 29
SSI Participation Model
The participation model is a simple probit. The dependentvariable P
i is an indicator variable for a positive SSI
payment for the unit, according to SSA administrativerecords.
Pi = f ( Xi , Βi
; $, δ ) + gι gi ~ N(0,σ2)
where Pi=
for the ith unit
Xi = vector of demographic characteristics
Bi= expected SSI benefit (from the
SSI eligibility model)
$ = vector of coefficients attached to Xi
δ = coefficient attached to Bi.
For each unit i, Xi contains demographic information
for the unit head, including age, sex, race and ethnicity,marital status, educational attainment, home ownership,pension receipt, contact with Social Security, place ofbirth (United States or elsewhere), U.S. citizenship,health, expected benefits, and state dummies.
As with McGarry’s (1996) model, the expected SSIbenefit (B
i) is hypothesized to be positively related to SSI
participation. In this article we operationalize expectedSSI benefits as the sum of the amount of federal SSIbenefit dollars calculated by our eligibility model, plusmaximum state supplement amounts for SSI recipientsadjusted by categories of health and other status. Thusour measure is based on a fairly comprehensive methodto derive expected federal benefits and on a simplifiedmethod of measuring expected state benefits. As aresult, the variable can be regarded as a proxy measureof expected total (federal and state combined) SSIbenefits. The model follows Yelowitz (1998), incorporat-ing Medicaid as a predictor variable. For this analysis,however, we do not compute the budget constraint withthe Medicaid notch. Instead, we use average stateMedicaid expenditures on SSI recipients to approximatethe effect of Medicaid on SSI participation. Appendix Cprovides a more detailed description of the data andprocedures used to derive maximum state SSI supple-ments and average Medicaid benefits.
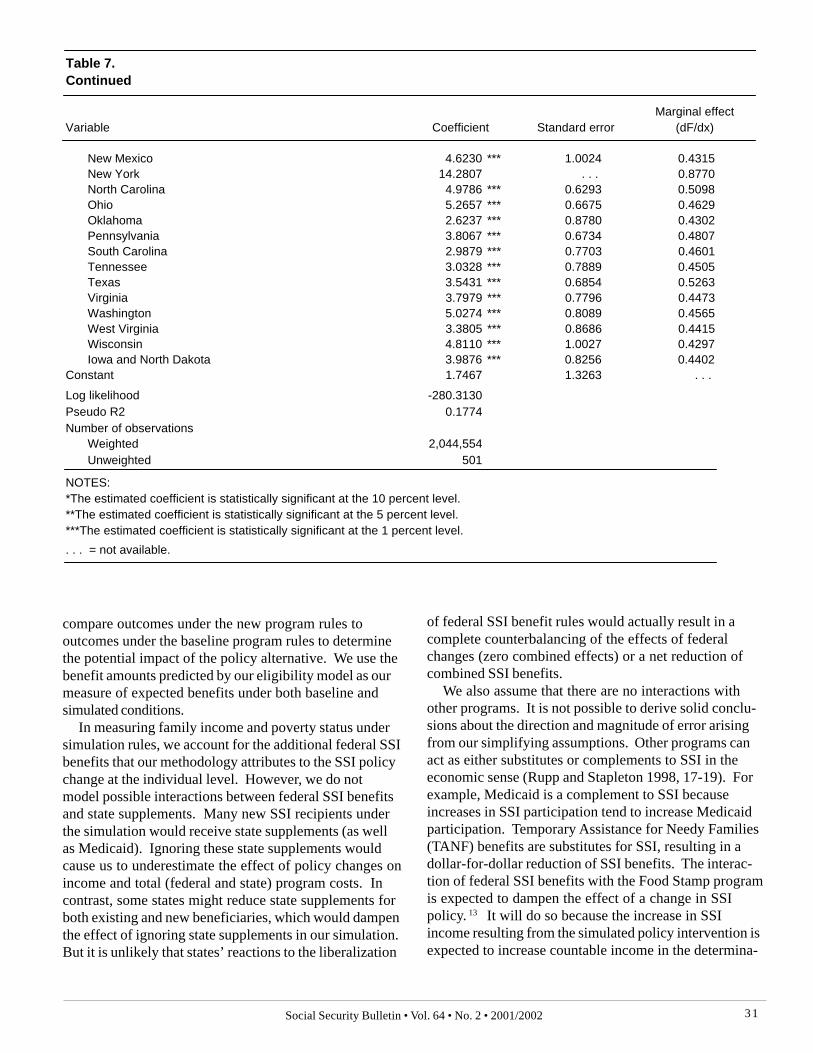
In the simple probit model, the coefficient on the SSIbenefit amount is not statistically significant, although it ispositive and similar in magnitude to estimates in previousstudies (see Table 7). Many of the other coefficients arestatistically significant and have the expected sign. Forexample, high school graduates are significantly lesslikely to participate in the SSI program, relative to thosewith less than a high school education. Those who own
their own home and own a car also are significantly lesslikely to participate. The number of doctor visits in theprevious 12 months is positively related to SSI participa-tion. Those born in the United States are more likely toparticipate than immigrants, but U.S. citizens are lesslikely to participate. The combined effect is relativelysmall. Among immigrants, the participation probabilityvaries by entry cohort. The data suggest that obtainingU.S. citizenship offsets the possibly higher SSI participa-tion among immigrants. The coefficient on the disabilityindicator is negative and significant, which is unexpected.However, it is an indicator of work-related disability andthus should be interpreted in conjunction with the recentwork experience coefficient (negative and significant)and the coefficient on the personal care indicator (posi-tive and significant).
Simulation of Policy Changes
Our interest is in estimating the potential effects ofvarious policy alternatives, which can be done in anumber of ways.
Methodology
We develop a static model of policy changes in which thecounterfactual represents current conditions, including thenumber and characteristics of current participants. Thesimulated conditions are identical to current conditions,with the exception of the policy change. Conceptually,the changes from current to simulated conditions occurinstantaneously, with no time allowed for learning andadjustment to the new conditions. Also, we assume thatexcept for the policy change, no other conditions change;that is, no demographic, labor market, or other changesaffect the differences between the counterfactualbaseline and the simulated policy regime. Although thesesimplifications certainly do not reflect reality, they havethe advantage of keeping the focus clearly on the effectsof the proposed policy change. Nevertheless, keep inmind that the effects to be measured with this approachare conditional on baseline circumstances and may bealtered in the future if some of those circumstances, forexample, the size and composition of the target popula-tion, change.
In operational terms, we simulate eligibility under thenew program rules by altering the relevant programparameter and rerunning the eligibility model. Weestimate participation under the new program rules byapplying the estimated coefficients from the baselineparticipation model to eligibles under the new programrules. Rather than deterministically assigning participa-tion status, we use participation probabilities derived fromour multivariate probit model to allocate individuals to theparticipant and eligible nonparticipant groups. We then
>
otherwise 0
0payment SSI if 1

Social Security Bulletin • Vol. 64 • No. 2 • 2001/200230
0.0010 0.0007 0.0004-0.0236 ** 0.0115 -0.0092-0.0101 0.2053 -0.00400.0941 0.2152 0.0365
-0.1332 0.1538 -0.0523-0.1771 0.3067 -0.0699-0.3382 ** 0.1708 -0.13361.0094 *** 0.2897 0.3859
-0.7870 *** 0.2838 -0.2857
0.7059 ** 0.3213 0.24370.2236 0.3055 0.0853
-0.2277 0.1809 -0.0885-0.4511 ** 0.1943 -0.17810.1088 0.1719 0.0424
-0.0090 0.0079 -0.00350.4913 *** 0.1728 0.1873
0.0215 ** 0.0093 0.0084-0.0003 *** 0.0000 -0.0001-0.2363 * 0.1379 -0.0922-0.4375 0.2755 -0.17310.0316 0.1298 0.0124
-0.1674 0.2612 -0.0648-0.7641 * 0.4500 -0.2946-0.0015 0.0017 -0.0006-0.4167 ** 0.1747 -0.1646
Alabama 2.6267 *** 0.7499 0.4823Arkansas 3.0460 *** 0.7730 0.4496California 2.7278 *** 0.7282 0.5542Florida 3.4787 *** 0.6880 0.5324Georgia 3.3700 *** 0.7132 0.4755Hawaii 5.1750 *** 1.0446 0.4307Illinois 4.8960 *** 0.6452 0.4969Indiana 5.3915 *** 0.7464 0.4515Kentucky 4.0152 *** 1.1411 0.4348Louisiana 3.4573 *** 0.7308 0.4681Maryland 4.7927 *** 0.7481 0.4489Massachusetts 7.0506 *** 0.6567 0.4727Michigan 3.8229 *** 0.7430 0.4476Minnesota 8.0202 *** 0.5506 0.4955Mississippi 3.7063 *** 0.8652 0.4611Missouri 2.4237 ** 0.9552 0.4257New Jersey 6.0995 *** 0.6307 0.4714
Worked at least 1 month in previous 12 months (unit head)
Personal care indicator (unit head)
Average state Medicaid expenditure on SSI participants
Immigrant, entered U.S. after 1980 (unit head)Residence in metropolitan statistical area
Poor health (unit head or spouse)
U.S. citizen (unit head)Immigrant, entered U.S. between 1960 and 1980 (unit head)
Hispanic (unit head)Black (unit head)Married (unit head)High school graduate (unit head)
Table 7. Probit coefficients and marginal effects in the participation model
State dummies
Own home (unit head or spouse)Pension (unit head or spouse)Number of Social Security recipients in householdSocial Security (unit head or spouse)
Own carEarnings variance over previous 12 months (unit head)
Number of overnight hospital stays in previous 12 months (unit head or spouse)
Number of doctor visits in previous 12 months (unit head and spouse)
Continued
Coefficient Standard errorMarginal effect
(dF/dx)
Disability indicator (unit head)
Variable
SSI benefit amountAge (unit head)Sex (unit head)
Born in the United States (unit head)
Social Security Bulletin • Vol. 64 • No. 2 • 2001/2002 31
compare outcomes under the new program rules tooutcomes under the baseline program rules to determinethe potential impact of the policy alternative. We use thebenefit amounts predicted by our eligibility model as ourmeasure of expected benefits under both baseline andsimulated conditions.
In measuring family income and poverty status undersimulation rules, we account for the additional federal SSIbenefits that our methodology attributes to the SSI policychange at the individual level. However, we do notmodel possible interactions between federal SSI benefitsand state supplements. Many new SSI recipients underthe simulation would receive state supplements (as wellas Medicaid). Ignoring these state supplements wouldcause us to underestimate the effect of policy changes onincome and total (federal and state) program costs. Incontrast, some states might reduce state supplements forboth existing and new beneficiaries, which would dampenthe effect of ignoring state supplements in our simulation.But it is unlikely that states’ reactions to the liberalization
of federal SSI benefit rules would actually result in acomplete counterbalancing of the effects of federalchanges (zero combined effects) or a net reduction ofcombined SSI benefits.
We also assume that there are no interactions withother programs. It is not possible to derive solid conclu-sions about the direction and magnitude of error arisingfrom our simplifying assumptions. Other programs canact as either substitutes or complements to SSI in theeconomic sense (Rupp and Stapleton 1998, 17-19). Forexample, Medicaid is a complement to SSI becauseincreases in SSI participation tend to increase Medicaidparticipation. Temporary Assistance for Needy Families(TANF) benefits are substitutes for SSI, resulting in adollar-for-dollar reduction of SSI benefits. The interac-tion of federal SSI benefits with the Food Stamp programis expected to dampen the effect of a change in SSIpolicy. 13 It will do so because the increase in SSIincome resulting from the simulated policy intervention isexpected to increase countable income in the determina-
New Mexico 4.6230 *** 1.0024 0.4315New York 14.2807 . . . 0.8770North Carolina 4.9786 *** 0.6293 0.5098Ohio 5.2657 *** 0.6675 0.4629Oklahoma 2.6237 *** 0.8780 0.4302Pennsylvania 3.8067 *** 0.6734 0.4807South Carolina 2.9879 *** 0.7703 0.4601Tennessee 3.0328 *** 0.7889 0.4505Texas 3.5431 *** 0.6854 0.5263Virginia 3.7979 *** 0.7796 0.4473Washington 5.0274 *** 0.8089 0.4565West Virginia 3.3805 *** 0.8686 0.4415Wisconsin 4.8110 *** 1.0027 0.4297Iowa and North Dakota 3.9876 *** 0.8256 0.4402
1.7467 1.3263 . . .
-280.31300.1774
Weighted 2,044,554Unweighted 501
Marginal effect (dF/dx)
Table 7. Continued
. . . = not available.
Pseudo R2Number of observations
NOTES: *The estimated coefficient is statistically significant at the 10 percent level.**The estimated coefficient is statistically significant at the 5 percent level.***The estimated coefficient is statistically significant at the 1 percent level.
Variable
Constant
Log likelihood
Coefficient Standard error

Social Security Bulletin • Vol. 64 • No. 2 • 2001/200232
tion of Food Stamp benefits and would therefore de-crease Food Stamp benefits.14 Thus, ignoring FoodStamp interactions is expected to result in an upward biasin the net effects of the SSI policy change on totalgovernment outlays.
In other cases, the situation is more complex. Forexample, liberalized SSI rules could result in concurrentapplications and awards to the Social Security DisabilityInsurance (DI) program (complementarity), whereas DIbenefits offset SSI benefits essentially dollar for dollar.Thus the substitute or complementary nature of interac-tions with other programs needs to be assessed inevaluating the possible biases arising from omitting suchinteractions in our simulation.
None of our simulations involve changes in SocialSecurity benefits. Social Security retirement is anentitlement rather than a means-tested program. There-fore our simulations should have no effects on the receiptand amount of Social Security retirement benefits.However, changes in those benefits might affect SSI.Our model easily accommodates SSI simulations thatmay involve such changes; we simply alter the amount ofSocial Security benefits used to calculate total familyincome.
Finally, an important issue in conducting the simulationsis how to make results based on 1991 data useful topolicymakers who are concerned about the effects ofchanging policy today. We implement a two-part strategyto deal with this concern.
First, we deflate the value of the change in the pro-gram parameter to 1991 dollars so that the currentsimulation more closely reflects what would have hap-pened in 1991 if a policy change of the same magnitudehad been implemented. For example, if policymakerstoday were considering an increase in the unearnedincome disregard from $20 to $80, we would deflate the$60 change to 1991 dollars for the simulation.15
Second, we adjust the simulated outcomes from 1991based on the current number of actual SSI participantsaged 65 or older and the current average federal benefitpayment to SSI participants in that age group. Forexample, if our simulation shows that the number ofparticipants in 1991 would increase by 25 percent andthat the average benefit would increase by 5 percent, weapply those percentage changes to the current number ofactual participants aged 65 or older and the currentaverage benefit for participants in that age group tosimulate what would happen if the policy change wereimplemented today. Although this adjustment requires anumber of relatively strict behavioral assumptions, weconsider it appropriate. Future simulation efforts willuse more recent SIPP panels matched to administrativedata.
Outcomes
We focus on five primary outcomes to assess the effectsof the various policy alternatives:
1. SSI eligibility,
2. SSI participation,
3. Average SSI benefit amounts,
4. Poverty rate, and
5. Poverty gap.
The first three outcomes are obvious choices. Wefocus on the poverty rate and poverty gap as key out-comes, both among SSI participants and among the entirepopulation aged 65 or older, because the SSI program isdesigned to provide income support to a population withvery low income. The central goal of the program is toassist recipients in escaping extreme poverty. Therefore,the degree to which policy changes would reduce thepoverty rate or poverty gap among participants is anatural choice for gauging the impact of the policyalternative. Only relatively large policy changes will havean impact on the poverty rate of the entire population 65or older. The absolute change in the poverty gap for thatpopulation should be equal to the absolute change in thepoverty gap for SSI participants, but the relative changewill obviously differ. Because federal SSI benefitsprovide only a subpoverty level of income for the elderly,the poverty rate may not be sufficiently sensitive tomeasuring outcomes. In contrast, the poverty gap issensitive to income changes at the subpoverty level butdoes not give credit to income increases above thepoverty line. Thus the two measures complement eachother (Rupp, Strand, and Davies 2001).
Other outcomes resulting from the policy change alsocan be measured—for example, changes in the racial andethnic composition of SSI participants or differences inhealth and functional limitations between baseline partici-pants and new participants. However, sample sizes aregenerally too small to support such detailed comparisonsbetween subgroups with any degree of statistical preci-sion. In the future, as we add other SIPP panels to themodel, more detailed subgroup analyses should becomefeasible.
Another complication we encountered in characteriz-ing the changes in outcome measures was that the policychanges may not only affect current participants but alsobring in new participants. Therefore, changes in theobserved average outcomes, such as monthly benefits,may be influenced by both the changes experienced bycurrent participants and the inflow of new participants.For example, even if one considers a policy change thatby definition can only increase the benefit of individualparticipants, the average benefit level for the new pool ofparticipants may appear to have gone down relative to

Social Security Bulletin • Vol. 64 • No. 2 • 2001/2002 33
the average for the old pool under baseline conditions.This situation would occur if the increase in the averagebenefit level of baseline participants were overwhelmedby the substantially lower average benefit level of newparticipants. Given this compositional effect, we presentthe change in the average benefit level for an identicalpool of people who are all participants under the simu-lated policy scenario. In this case, the average properlyreflects the change experienced by all persons affectedby the intervention.
In summary, when average outcomes are measuredfor “old” participants only at baseline and for the com-bined group of “old” and “new” participants under thesimulation case, we have an accurate description for thetwo different situations, but the naive comparison of themeans may result in misleading causal interpretation. Todevelop a better causal understanding, one needs todecompose the changes and reach causal inferences onlyin interpreting changes that are observed for identicalpopulations.
Some measures are not affected by the ambiguitiesarising from compositional changes. In particular, changesin the aggregate level of benefits paid or in the aggregatevalue of the poverty gap are not affected. Nor do theambiguities affect measures that average a given out-come for all elderly, such as the aggregate effect ofpolicy changes on the percentage of the elderly below thepoverty line.
Results
We present the effects of five policy alternatives:
• Increase the GIE from $20 to $80.
• Increase the EIE from $65 to $260.
• Increase the FBR by $50 for individuals and $75 forcouples and eliminate the GIE.
• Increase the asset threshold by 50 percent, from$2,000 to $3,000 for individuals and from $3,000 to$4,500 for couples.
• Increase the asset threshold by 200 percent, from$2,000 to $6,000 for individuals and from $3,000 to$9,000 for couples.
Table 8 summarizes the effects of these alternatives onSSI program participation and average benefits forparticipants. Table 9 presents their effects on thepoverty status of elderly SSI participants and the generalelderly population. Increasing the GIE from $20 to $80has substantial estimated positive effects on the numberof participants and average federal benefit levels (seeTable 8). The result is a slight reduction in the povertyrate but a large reduction in the poverty gap (see Table9). This result is not surprising because SSI incomeeligibility rules reflect countable income levels that are
substantially below the poverty line. Thus, although anintervention of this kind might move only a relativelysmall proportion of people out of poverty, the effects onthe poverty gap are expected to be much larger.
The increase in the SSI earned income exclusionfrom $65 to $260 is estimated to have essentially noeffect on participation and only a modest effect onaverage benefits. The reason is that earnings form onlya very small fraction of income for the elderly. Thissimulated policy intervention has virtually no effect onpoverty among the elderly.
The third option would increase the FBR by $50 forindividuals and $75 for couples and eliminate the GIE.The two elements of this policy change work in oppositedirections: increasing the FBR expands benefits acrossthe board, but eliminating the GIE tightens the rules forthose with positive unearned income. However, sincethe GIE is only $20, the FBR should clearly dominatethe picture: indeed, there are net increases in participa-tion and benefit levels. This simulated change is secondto the simulated increase in the GIE in terms of positiveeffects on participation and average benefit levels. Thereduction in the poverty rate is small, but the reductionin the poverty gap is notable.
Finally, we estimate the effects of two versions ofliberalizing the SSI asset threshold—a 50 percentincrease and a 200 percent increase—for both individu-als and couples. The estimated effects on participationare small, and there is no discernible effect on benefitlevels. Our analysis of the underlying data helps explainwhy the seemingly substantial liberalization of the SSIasset rules under both scenarios has such a small effecton participation: among persons who are income-eligiblefor SSI, the asset distribution is heavily skewed towardzero. Moreover, because the change in asset rules doesnot have any effect on calculated benefits amongparticipants under the baseline conditions, it is nosurprise that we do not find discernible effects onbenefit levels.
The evaluation of the outcomes measured in Tables 8and 9 would not be complete without asking the obviousquestion: what is the cost of the measured outcomes(benefits) of these interventions? We therefore per-formed some simple calculations of total program costs(federal benefit outlays) under the baseline and simula-tion conditions.
The calculation clearly shows that the policy interven-tions that have the greatest effect on the outcomes weinvestigate are also the most costly (see Table 10).Remarkably, increasing the GIE from $20 to $80 (great-est measured outcomes) is estimated to increase federalbenefit costs by about 46 percent. At the other end ofthe spectrum, substantial increases in the resource limithave relatively minor costs in terms of federal outlays.

Social Security Bulletin • Vol. 64 • No. 2 • 2001/200234
1,875,453 2,256,733 381,280 20.3%
1,875,453 1,884,080 8,627 4.6
1,875,453 2,075,751 200,298 10.7
1,875,453 1,900,397 24,944 1.3
1,875,453 1,970,914 95,461 5.1
261.67 316.41 54.74 20.9%
261.67 262.82 1.15 0.4
261.67 298.88 37.21 14.2
261.67 261.75 0.08 0.03
261.67 261.75 0.08 0.03
a.
b.
c.d.
e.
f.
g.
*
**
NOTES: GIE = guaranteed income exclusion; EIE = earned income exclusion; FBR = federal benefit rate.
The estimated change is statistically significant at the 1 percent level. The standard errors used in the significance tests were calculated from a first-order Taylor-series approximation to account for the complex sample design of the SIPP.
The estimated change is statistically significant at the 5 percent level. The standard errors used in the significance tests were calculated from a first-order Taylor-series approximation to account for the complex sample design of the SIPP.
The average benefit under the simulated program rules was derived by applying the percentage change in the average benefit if this policy change had been implemented in 1991 to the average federal SSI payment to recipients aged 65 or older in March 2000. The percentage change in the average benefit if this policy change had been implemented in 1991 is estimated from the Division of Policy Evaluation's SSI Financial Eligibility Model.
The simulation with the 1990 SIPP is based on the deflated value of the $60 assumed increase ($80–$20) in the GIE.
Increase FBR by $50 for individuals and $75 for couples and
eliminate GIE*, d
Increase asset threshold by 50%, from $2,000 to $3,000 for
individuals and $3,000 to $4,500 for couples**, e
Increase asset threshold by 200%, from $2,000 to $6,000 for
individuals and $3,000 to $9,000 for couples*, f
Increase asset threshold by 200%, from $2,000 to $6,000 for
individuals and $3,000 to $9,000 for couples*, f
Increase GIE from $20 to $80*, b
Increase EIE from $65 to $260*, c
Increase FBR by $50 for individuals and $75 for couples and
eliminate GIE*, d
Increase asset threshold by 50%, from $2,000 to $3,000 for
individuals and $3,000 to $4,500 for couples*, e
Number of participants a
Absolute Percent
Table 8.Effects of policy changes on SSI program participation and average benefits for participants
Change
Policy changeCurrent
rulesSimulated
rules
Increase EIE from $65 to $260**, c
Increase GIE from $20 to $80*, b
The average benefit under current program rules is the average federal SSI payment to recipients aged 65 or older in March 2000, based on SSA administrative records ( "Current Operating Statistics," Social Security Bulletin 63(2), Table 2.A2).
The simulation with the 1990 SIPP is based on the deflated value of the $195 assumed increase ($260–$65) in the EIE.The simulation with the 1990 SIPP is based on the deflated value of the assumed increase in the FBR of $50 for individuals and $75 for couples.The simulation with the 1990 SIPP is based on the deflated value of the assumed increase in the asset threshold of $1,000 for individuals ($3,000–$2,000) and $1,500 for couples ($4,500–$3,000).
The simulation with the 1990 SIPP is based on the deflated value of the assumed increase in the asset threshold of $4,000 for individuals ($6,000–$2,000) and $6,000 for couples ($9,000–$3,000).
Average estimated benefit among participants g (dollars)
SOURCE: The estimates are from the SSI Financial Eligibility Model, based on the 1990 Survey of Income and Program Participation (SIPP), wave 4, month 4, exactly matched with the Social Security Administration's Supplemental Security Record, Summary Earnings Record, and Numident file.
The number of participants under current program rules is the number of individuals aged 65 or older receiving federal SSI payments in March 2000, based on SSA administrative records (see "Current Operating Statistics," Social Security Bulletin 63(2), Table 2.A2). The number of participants under the simulated program rules was derived by applying the percentage change in the number of participants if the policy change had been implemented in 1991 to the number of individuals receiving federal SSI payments in March 2000.

Social Security Bulletin • Vol. 64 • No. 2 • 2001/2002 35
1.49 * 33,625 29.0 *
0 0 0.1 *
0 0 19.1 *
0 0 0.8
0 0 3.0 *
0.04 . . . 7.8 *
0 ** . . . 0.1 **
0.06 . . . 5.1 *
0 . . . 0.2
0 . . . 0.7 *
a.
b.
c.
d.
e.
f.
g.
*
**
Policy change
Increase GIE from $20 to $80c
Increase EIE from $65 to $260d
Reduction in poverty rate (percentage
points) aNumber moved out
of poverty
Reduction in poverty gap
(percent) b
Effects on participants
Increase FBR by $50 for individuals and $75 for couples and
eliminate GIEe
Increase asset threshold by 50%, from $2,000 to $3,000 for
individuals and $3,000 to $4,500 for couplesf
Increase asset threshold by 200%, from $2,000 to $6,000 for
individuals and $3,000 to $9,000 for couplesg
Increase FBR by $50 for individuals and $75 for couples and
eliminate GIEe
The estimated change is statistically significant at the 5 percent level.
Table 9.Effect of policy changes on poverty status
The simulation with the 1990 SIPP is based on the deflated value of the assumed $195 increase ($260–$65) in the EIE.
The simulation with the 1990 SIPP is based on the deflated value of the assumed increase in the FBR of $50 for individuals and $75 for couples.
The simulation with the 1990 SIPP is based on the deflated value of the assumed increase in the asset threshold of $1,000 for individuals ($3,000–$2,000) and $1,500 for couples ($4,500–$3,000).
SOURCE: The estimates are from the SSI Financial Eligibility Model, based on the 1990 Survey of Income and Program Participation (SIPP), wave 4, month 4, exactly matched with the Social Security Administration's Supplemental Security Record, Summary Earnings Record, and Numident file.
The poverty estimates are derived by comparing family income in the SIPP reference month to one-twelfth of the family-specific poverty threshold provided in the 1990 SIPP. The percentage-point reduction in the poverty rate is calculated as the difference between the poverty rate under current program rules and the poverty rate under the simulated program rules.The percentage change in the poverty gap is calculated as the percentage difference between the poverty gap under current program rules and the poverty gap under the simulated program rules. The poverty gap is the difference between family income and the family-specific poverty threshold, aggregated across all individuals in the relevant group.The simulation with the 1990 SIPP is based on the deflated value of the $60 assumed increase ($80–$20) in the GIE.
Increase asset threshold by 50%, from $2,000 to $3,000 for
individuals and $3,000 to $4,500 for couplesf
NOTES: GIE = guaranteed income exclusion; EIE = earned income exclusion; FBR = federal benefit rate; . . . = not applicable.
The estimated change is statistically significant at the 1 percent level.
The simulation with the 1990 SIPP is based on the deflated value of the assumed increase in the asset threshold of $4,000 for individuals ($6,000–$2,000) and $6,000 for couples ($9,000–$3,000).
Increase asset threshold by 200%, from $2,000 to $6,000 for
individuals and $3,000 to $9,000 for couplesg
Increase GIE from $20 to $80c
Increase EIE from $65 to $260d
Effects on elderly population

Social Security Bulletin • Vol. 64 • No. 2 • 2001/200236
Our findings suggest that, in evaluating alternativereform proposals, policymakers should systematicallyconsider the costs and benefits in terms of highlyvalued outcomes.
Possible Future Directions
Future research could build upon our work in a numberof promising directions. We briefly discuss some ofthose possibilities below.
Implementation of Modelfor Working-Age Disabled
Categorical eligibility (that is, disability as defined bySSA) is not directly observable for the working-agepopulation. The modeling of their SSI participationneeds to consider that as well as disability-specificfactors affecting SSI participation among the disabledpopulation. Also, some individuals may be eligible notonly for SSI but also for Disability Insurance (DI). DIinsured status and expected future DI benefit streams,which start after a 5-month waiting period, arguablyinfluence the decision to apply for SSI, especiallybecause dual eligibility implies a less uncertain futurebenefit stream. Finally, although concurrent SSI andDI awardees become eligible forMedicare after a 2-year waitingperiod, SSI-only awardees are eligibleonly for Medicaid, albeit from thevery beginning of the spell of SSIrecipiency.
Measurement of Effectson State Supplementation
Our participation model considers theeffect of state supplements on thedecision to participate in SSI. How-ever, we do not measure either theeffects of proposed federal policychanges on state supplements or thecombined effect of federal benefitsand state supplements on family orindividual income. Liberalizations infederal policy might increase stateoutlays as participation in the federalSSI program increases, but offsettingeffects may arise from the increasedfederal benefit levels of existingparticipants. If the federal policychange was substantial, states mightadjust their own rules.
Program Interactions
In addition to the interaction with DI, Medicare, andMedicaid, the decision to participate in SSI may interactwith other means-tested programs, such as Food Stamps,Temporary Assistance for Needy Families, and GeneralAssistance. Some evidence suggests that changes inother means-tested programs may affect SSI participa-tion.16 Likewise, changes in the structure of the SSIprogram might affect participation in the other programs.To obtain a complete accounting of the costs and benefitsof proposed changes in SSI, effects on the other pro-grams need to be considered. Finally, although liberaliz-ing SSI should have no effect on Social Security, which isan entitlement program, Social Security reforms mayhave marked effects on SSI. To account for the neteffects of proposed changes in Social Security, one wouldneed to consider interactions with SSI explicitly.
Simulations Used as SystematicTools of Policy Analysis
Although there may be some policy justification for theSSI rule changes presented in this article, the analyticrationale—in terms of costs and benefits—is not immedi-ately obvious. We do not know whether a lower orhigher value of revised parameters would work better or
Increase GIE from $20 to $80 5.89 8.57 2.68 45.5
Increase EIE from $65 to $260 5.89 5.94 0.05 0.9
Increase FBR by $50 for individuals and $75 for couples and eliminate GIE 5.89 7.44 1.55 26.4
Increase asset threshold by 50%, from $2,000 to $3,000 for individuals and $3,000 to $4,500 for couples 5.89 5.97 0.08 1.4
Increase asset threshold by 200%, from $2,000 to $6,000 for individuals and $3,000 to $9,000 for couples 5.89 6.19 0.30 5.1
Billions of dollars Percent
Table 10.Total SSI program costs for participants aged 65 or older under baseline and simulated conditions
SOURCE: The estimates are from the SSI Financial Eligibility Model, based on the 1990 Survey of Income and Program Participation, wave 4, month 4, exactly matched with the Social Security Administration's Supplemental Security Record, Summary Earnings Record, and Numident file.
NOTE: GIE = general income exclusion; EIE = earned income exclusion; FBR = federal benefit rate.
Annual costs (billions of dollars)
Policy changeSimulation scenario Baseline
Increase in federal benefits

Social Security Bulletin • Vol. 64 • No. 2 • 2001/2002 37
worse in terms of some outcomes of interest. Moreover,our analysis has shown that the various simulated inter-ventions are associated with widely varying costs, so inthat sense they are not comparable. Finally, we do notknow whether spending a given budgeted amount exclu-sively on changing a single parameter would be more orless effective in reaching a particular objective or objec-tives, or whether combining two or more interventionswould be more effective. Addressing such issues couldgreatly enhance our understanding of the trade-offs.
Modeling the Eligibilityand Participation Process
Our model is static and therefore provides no informationabout the process of adjusting to the simulated conditions.Presumably, this adjustment does not happen instanta-neously, and substantial learning may be involved. Also,the temporal dynamics of eligibility may affect thedecision to participate. For example, persons who arepermanently eligible for SSI, as opposed to those whoseeligibility is more variable through time, are expected tohave stronger incentives to participate in SSI. Using thelongitudinal aspects of SIPP and the administrativerecords, it is possible to model income eligibility longitudi-nally and to analyze the dynamic relationship betweeneligibility and participation.
Analyzing Characteristicsof New Eligibles
Finally, there is substantial policy value to having theinformation needed to compare the characteristics ofpeople who are expected to become newly eligible forSSI or to become new participants as a result of a policychange with the characteristics of current SSI partici-pants. The simulations presented in this article provideonly very limited information concerning such issues,primarily because the unweighted sample sizes are toosmall to allow us to make reliable comparisons of therelevant population subgroups. Obtaining such informa-tion may require merging two or more SIPP panels.
Appendix A.Sample Construction and StandardError Estimates
The sample used in this analysis comprises respondentsfrom the Survey of Income and Program Participants1990 panel, Wave 4 Core, reference month 4. Additionalinformation comes from the Wave 4 Topical Module(assets variables), Wave 3 Topical Module (health-relatedvariables), Wave 2 Topical Module (citizenship andimmigration variables), and other administrative data (theSummary Earnings Record to assess the validity of
matches of survey data to administrative records, theSupplemental Security Record for program participationstatus, and the Master Beneficiary Record for type ofSocial Security benefit). The sample is divided intoSupplemental Security Income units for analysis by usingmarital status. The wives’ information is attached to thehusbands’ records, and only the unit head identifiers arekept. The wives’ records are then removed from thesample. The remaining sample is matched with the SERand checked for a nonzero birthdate to identify validmatches between survey and administrative data. Of theremaining sample, 3,396 observations are matched to theSSR, indicating that they have applied for SSI benefits.The following summarizes the construction of the sample:
Source Usable observations
Wave 4 Core, reference month 4 59,462Wave 4 Topical Module merge 55,680Wave 3 Topical Module merge 54,357Other merges and sample restrictions35,605Other missing values 35,603Divided into SSI units 28,011Valid matches between survey
and administrative data 25,614
The data for all SIPP samples follow a complexsurvey design, so the precision of counts, means, propor-tions, and ratio estimates are overstated when standarderrors are calculated using techniques that assume simplerandom sampling. The estimated standard errors can becalculated using a linearization or replication method(Levy and Lemeshow 1999). We use a linearizationmethod based on a Taylor-series approximation, primarilybecause it is relatively easy to implement using the svyfamily of commands in Stata Release 6.0. Details of thismethod are provided in Levy and Lemeshow (1999,Chapter 12) and in Stata Corporation (1999, 62-72).Standard errors using the linearization method are largerthan standard errors calculated using standard tech-niques, resulting in more conservative conclusions aboutthe statistical significance of our estimated counts,means, proportions, and ratios.
Appendix B.Analysis of Reasons for Measured IneligibilityAmong SSI Participants
The consistency of our eligibility estimates based on theSurvey of Income and Program Participation and theSocial Security Administration’s assessment of eligibilityamong applicants and beneficiaries is relevant in evaluat-ing the quality of measurement in our study. Using thesurvey-based definition of participation, our model initially

Social Security Bulletin • Vol. 64 • No. 2 • 2001/200238
classified 47 percent of Supplemental Security Incomeparticipants (aged and working-age disabled combined)as ineligible.17 SSA presumably found those measuredineligibles to be eligible because they were actually parti-cipating in the Supplemental Security Income program.
There are three possible reasons for the high rate ofineligible participants. First, we may incorrectly measureparticipation status. Second, the SIPP data or oureligibility algorithm may produce incorrect eligibilityestimates. Third, the income and assets that are re-flected in the administrative records may be incorrect dueto moral hazard (biased self-report) or to administrativepractices. Likewise, SSA may incorrectly identify somepeople as medically eligible.
The replacement of the survey measure of participa-tion with the administrative records data (FEDPMT) andthe more realistic treatment of life insurance policiessubstantially improved the empirical fit between mea-sured participation and estimated eligibility. However,even after these changes, almost a quarter of measuredparticipants were estimated to be ineligible for the agedand working-age disabled combined. Therefore, weconducted further analyses of the remaining cases ofineligibles using the FEDPMT definition of SSI participa-tion. We considered three sources of ineligibility: cat-egorical, income, and resource. (See Table 4, whichdescribes participants in ineligible units by type of ineligi-bility and age.)
According to our initial estimates, the vast majority ofineligible participants (127 of 175 unweighted cases)were nonaged. Ineligible participantsconstitute about 33 percent of work-ing-age disabled participants(unweighted observations) but only 14percent of the aged.
Categorical Ineligibility
The most important reason forineligibility among the nonaged wascategorical ineligibility. About 68percent (87 cases) were categori-cally ineligible measured by themedical eligibility flag that was usedin this analysis (a few of those caseswere ineligible on the basis ofincome or asset measures as well).The measurement of categoricaleligibility is not a major issue for theaged, because status as “65 years orolder” can be measured with rea-sonable accuracy in our data set andcan be assumed to be measured byfield office staff with virtually noerrors.
Income Ineligibility
The most important reasons for measured incomeineligibility among the elderly were, in order of impor-tance:
• SIPP reporting of Social Security benefits largerthan reported in the Master Beneficiary Record,
• The use of imputed income amounts in the SIPP,and
• Self-reports of income (other than Social Securityor SSI) in the SIPP that are not reflected in theadministrative records.
For the nonelderly, the relative frequency of these threeitems is the exact opposite. We note that the reporting ofSocial Security benefits in the SIPP that are larger thanthose reported in the MBR is unique to ineligible partici-pants. For eligible nonparticipants, the SIPP-reportedSocial Security benefits tend to be lower than theamounts indicated in the administrative data, with a netSIPP underreporting of Social Security benefits in theoverall population.18
Two sources of income ineligibility (inflated reportingof Social Security benefits and imputed income) arerooted in shortcomings of the SIPP. The misreporting ofSocial Security income can be corrected by using SSAadministrative records, but the use of imputed incomevalues in the SIPP is an inherent shortcoming that cannotbe corrected in that manner unless the reason for theimputation is a missing Social Security benefit. Arguably,since SSA uses administrative records to make payments
Chart B-1. Percenta ge of SSI participants with imputed income items, by measured eligibility status of elderl y and wo rking-a ge SSI participants
NOTES: Chart is based on unweighted counts. Participation status is measured by the Supplemental Security Record's actual payment variable (FEDPMT). Imputed status is measured on the basis of the core income fields in the Survey of Income and Program Participation.
0
5
10
15
Eligible participants
Ineligible participants
Working-age disabled Elderly
Percent

Social Security Bulletin • Vol. 64 • No. 2 • 2001/2002 39
to beneficiaries, SSA benefit amounts tend to be morereliable than SIPP self-reports, which are affected byrecall and other sources of respondent error. Chart B-1provides evidence of the relationship between SIPPimputations and simulated eligibility status for the elderlyand disabled separately. For both groups, the proportionof imputed income is clearly higher among ineligibleparticipants, suggesting that the use of imputed income inthe SIPP clearly contributes to simulated ineligibilityamong participants. Thus, to some extent, SIPP mea-surement error rather than administrative failure tocapture income accurately is the source of simulatedineligibility among participants.
In contrast to these two items, the third source ofincome ineligibility—the reporting of income (other thanSocial Security and SSI) in the SIPP that is not containedin administrative records—may reflect eitheroverreporting in the survey or underreporting in theadministrative records. A good case can be made for theadministrative records being a source of this error if oneconsiders both the moral hazard of underreporting othersources of income among SSI participants and theadministrative difficulties of keeping the records of SSIbeneficiaries current past the time of application. Wefind less than 5 percent of participants with this source ofmeasured ineligibility, which is not an implausible result.
With respect to income eligibility, replacing self-reported Social Security with data from administrativerecords is a feasible option that we are pursuing inongoing research (Huynh, Rupp, and Sears 2002). Withrespect to the other potential sources of income ineligibil-ity, there is no obvious fix. However, for almost all casesof measured income ineligibility, we found plausibleexplanations other than errors in our model (such as theuse of imputed values in SIPP).19
Resource Ineligibility
Of the two financial eligibility variables, income was amore important source of ineligibility than resources forboth the aged and the disabled. In fact, the remaining 24cases that are resource-ineligible constitute 3.3 percentof participants, and almost half (11 cases) are ineligiblefor other reasons as well. This finding suggests animpressively low (1.5 percent) upper bound for themeasurement error attributable to resources alone.
In conclusion, with the replacement of self-reportedSocial Security benefit amounts with data from adminis-trative records and the different handling of life insurancepolicies, the proportion of ineligible participants becomestolerably low for the elderly, especially since our analysispositively identified the reasons for the vast majority ofremaining cases of ineligibility. The situation is morecomplicated for the disabled, partly because of therelatively large number of categorically ineligible cases
and partly because of the less tangible nature of qualify-ing disabilities.
Appendix C.Measurement of Maximum State SSI Supplementand Average Medicaid Benefit
In this analysis, maximum SSI state supplement numbersare taken from State Assistance Programs for SSIRecipients, Office of Supplemental Security Income,Division of Program Management and Analysis, SocialSecurity Administration (1992). This document providesdata on state assistance programs as of January 1992 forall states plus the District of Columbia. Because Surveyof Income and Program Participation state codes com-bine states in sparsely populated regions, the followingexceptions are made:
• Benefits for Maine and Vermont are weighted bythe number of federal SSI recipients.
• For Iowa, North Dakota, and South Dakota, thevalues of Iowa are used since it has by far thelargest population of the three states.
• For Alaska, Idaho, Montana, and Wyoming, we usethe average across states.
Appendix Tables C-1, C-2, and C-3 provide additionalinformation on the benefits for each state and combinedSIPP region.
Notes1 The ordering of the three steps in determining eligibility
facilitates the discussion but does not necessarily reflectoperational steps. The outcome is invariant to sequencing.
2 In this article we use the terms asset eligibility andresource eligibility interchangeably.
3 This is the unweighted sample count. The weighted totalis 2,017,000.
4 The PESS rule exclusion applies to properties earningannual returns of at least 6 percent.
5 These maximums are reduced by one-third for individualswho live in another person’s household. Regulations specifythat this reduction does not apply to an individual who ownsor rents, buys food separately, eats meals out rather than withthe household, or pays a prorated share of the household’sfood and shelter expenses (Social Security Administration1992). The regulations have been interpreted quite liberally,and only about 5 percent of SSI recipients are classified asliving in other people’s households. We experimented withmodeling living arrangements with SIPP, but we would haveunrealistically assigned nearly one-third of SSI beneficiaries toother people’s households. We decided that ignoring depen-dent living arrangements altogether was preferable to grosslyoverestimating them.

Social Security Bulletin • Vol. 64 • No. 2 • 2001/200240
6 Public income maintenance pay-ments include Aid to Families withDependent Children, General Assistance,payments under the Refugee Act of 1980,and U.S. Veterans Administrationpayments based on need.
7 Although program rules would takeinto account children between ages 18and 21 if they were in school, the SIPPindicator we use is for children under age18.
8 Pickett and Scott (1996) discussthese two payment concepts and theissue of overpayments. Panis and others(2000) discuss the FEDAMT andFEDPMT fields.
9 Our reasoning was supported by apiece of analysis that looked at thepercentage of all participants who weredetermined to be ineligible by oureligibility model yet were reported to beparticipants by one or more of the threemeasures. The highest proportion ofineligible participants (32.5 percent) wasgenerated by the survey measure. Theadministrative records produced num-bers that were close to each other, butFEDPMT produced the lower proportion(22.7 percent) compared with FEDAMT(23.8 percent). These data support thesuperiority of FEDPMT.
10 However, the SER measurement ofage may be less accurate than that whichcan be obtained from the Numident.Measuring age is less of an issue forpeople with SSR and MBR records. Weare currently investigating the relation-ship between the information in the SER,Numident, and SIPP on age.
11 Overreporting would produce errorin the opposite direction, resulting inartificially inflated participation rates.
12 The claim here is not that there isno evidence of underreporting of incomebut that there is no evidence of substan-tial systematic underreporting of incomein the SIPP. The Division of PolicyEvaluation in the Office of Research,Evaluation, and Statistics is conductinga fairly comprehensive analysis ofpossible misreporting in the SIPP. Thatstudy may result in the modification ofthese conclusions.
1,997 3,841 2,292 3,430 No268 499 732 628 No
2,417 4,788 3,807 4,205 No1,886 4,251 3,748 4,158 No3,011 6,279 24,763 8,681 No
5,994 19,278 5,521 7,600 Yes3,671 11,355 5,588 9,328 No4,456 12,136 1,906 10,698 No2,358 5,271 3,553 5,177 No2,411 5,190 3,933 5,005 No
2,606 7,974 8,604 5,904 Yes2,387 6,644 5,903 5,553 Yes4,003 9,743 6,371 11,062 Yes2,642 6,785 5,119 8,079 No2,284 5,371 3,303 4,265 No
2,690 4,559 4,455 6,643 No3,565 8,829 4,845 7,218 No4,344 11,584 7,990 8,011 No2,283 6,926 4,302 6,401 No3,702 11,089 12,270 14,440 Yes
1,607 3,426 2,859 3,177 No2,221 5,570 3,491 5,306 Yes2,915 7,751 6,673 8,683 No3,005 5,939 5,660 8,673 No4,898 12,829 15,692 12,628 Yes
4,437 11,835 6,185 11,671 No2,113 6,062 6,239 5,453 No5,577 17,084 23,458 10,727 No2,679 5,295 7,983 6,527 Yes2,812 10,102 5,651 7,949 Yes
2,673 4,915 2,659 6,794 Yes2,531 6,188 15,991 8,908 No2,690 8,397 2,981 5,787 No4,014 8,363 5,215 8,582 No2,426 4,242 2,967 5,184 No
2,130 4,290 2,566 4,065 No2,043 5,036 3,836 6,206 No2,408 6,273 5,599 9,416 No2,756 6,025 4,415 6,107 Yes2,235 7,876 4,475 4,136 No
Illinois
Delaware
Minnesota
IndianaKansasKentucky
LouisianaMarylandMassachusetts
District of ColumbiaFloridaGeorgia
Hawaii
ArkansasCaliforniaColorado
Connecticut
Table C-1. Average state Medicaid expenditures (in dollars) and 209(b) status, 1991
State or region
AlabamaArizona
All recipients Aged Blind 209(b)aDisabled
Michigan
MississippiMissouriNebraskaNevadaNew Hampshire
New JerseyNew MexicoNew YorkNorth CarolinaOhio
OklahomaOregonPennsylvaniaRhode IslandSouth Carolina
TennesseeTexasUtahVirginiaWashington
Continued

Social Security Bulletin • Vol. 64 • No. 2 • 2001/2002 41
13 See House Committee on Ways and Means (1998) for adescription of basic Food Stamp rules and the interaction ofthe Food Stamp and SSI programs.
14 Since SSI beneficiaries are categorically eligible for foodstamps, some of the people who became newly eligible for SSIas a result of the SSI policy change may not have been eligiblefor food stamps under baseline conditions. Food Stampbenefits may therefore magnify the estimated SSI policy effect.We think that is highly unlikely, though, because the incomeeligibility criteria of SSI are generally stricter than those for theFood Stamp program.
15 An important ambiguity arises from the fact that someparameters of the SSI program, such as the FBR, are indexed toinflation but others, such as income exclusions and assetthresholds, are not. Thus there is no straightforward way torepresent policy changes to be implemented in a given yearwith data for an earlier year. We have chosen the approachdescribed here on the basis that it produces estimates of thecost of the policy intervention in 1991 and today that arearguably equivalent.
16 See Bound, Kossoudji, and Ricart-Moes (1998) for theeffects on SSI of eliminating General Assistance in Michigan.
17 We derived this percentage with an earlier version of oureligibility model that assumed that the face value of lifeinsurance policies and their cash surrender value were identi-cal.
18 The most important likely reason is the reporting of SocialSecurity benefits net of the Part B deduction rather than thegross benefit amount. The Social Security Administrationdeducts Part B premiums from the monthly benefit payable
before it sends a monthly check tobeneficiaries or electronically depositsbenefits to their bank account. Thus thevast majority of beneficiaries who electPart B coverage receive monthly cashbenefit payments net of the Part Bpremium.
19 The use of information from thelongitudinal version of SIPP, whereimputations are done longitudinally ratherthan through a cross-sectional hot deck,may be an attractive option to considerhere.
References
Bound, John; Sherrie Kossoudji; andGema Ricart-Moes. 1998. “The Endingof General Assistance and SSI Disabil-ity Growth in Michigan.” In Growth inDisability Benefits: Explanations andPolicy Implications, edited by KalmanRupp and David Stapleton.Kalamazoo, Mich.: W.E. UpjohnInstitute for Employment Research.
Choi, Namkee G. 1998. “A Comparative Study of Elderly SSIRecipients, Denied Applicants, and Eligible Nonparticipants.”Journal of Aging and Social Policy 10(2): 7-28.
Coe, Richard. 1985. “Nonparticipation in the SSI Program bythe Eligible Elderly.” Southern Economic Journal 51(3): 891-897.
Davies, Paul S. Forthcoming. “SSI Eligibility and ParticipationAmong the Oldest Old: Evidence from the AHEAD.” SocialSecurity Bulletin 64(3).
Drazga, Linda; Melinda Upp; and Virginia Reno. 1982. “Low-Income Aged: Eligibility and Participation in SSI.” SocialSecurity Bulletin 45(5): 28-35.
Hill, Daniel. 1990. “An Endogenously-Switching Ordered-Response Model of Information, Eligibility, and Participationin SSI.” Review of Economics and Statistics 72(2): 368-371.
House Committee on Ways and Means. 1992. 1992 GreenBook. Washington, D.C.: U.S. Government Printing Office.
____________. 1998. 1998 Green Book. Washington, D.C.:U.S. Government Printing Office.
Hu, Jianting; Kajal Lahiri; Denton R. Vaughan; and BernardWixon. 1997. “A Structural Model of Social Security’sDisability Determination Process.” ORES Working Paper No.72. Washington, D.C.: Social Security Administration, Officeof Policy, Office of Research, Evaluation, and Statistics.August.
Huynh, Minh; Kalman Rupp; and James Sears. 2002. TheAssessment of Survey of Income and Program Participation(SIPP) Benefit Data Using Longitudinal AdministrativeRecords. SIPP Working Paper No. 238. Washington, D.C.:U.S. Census Bureau.
1,912 5,585 3,138 4,545 No3,537 9,037 6,323 7,474 No3,312 8,709 3,436 7,957 No
3,204 6,721 3,992 9,069 No
3,006 8,797 3,984 7,489 No
a.
All recipients
Table C-1.Continued
State or region 209(b)Disabled
SOURCE: House Committee on Ways and Means (1992).
BlindAged
Under the 209(b) option, states may impose Medicaid eligibility criteria that are more restrictive than SSI eligibility criteria. A separate Medicaid application with the state also may be required.
NOTES: States and metropolitan areas with populations less than 250,000 are not identified in Survey of Income and Program Participation (SIPP) public-use files to protect the confidentiality of respondents. For the 1990 SIPP panel used in this article, state-level geography is available for 41 individual states and the District of Columbia. The nine other states are combined into three groups: Maine and Vermont; Iowa, North Dakota, and South Dakota; and Alaska, Idaho, Montana, and Wyoming.
West VirginiaWisconsinMaine,Vermont
Alaska, Idaho, Montana, Wyoming
Iowa, North Dakota, South Dakota

Social Security Bulletin • Vol. 64 • No. 2 • 2001/200242
Yes 0 0 0 60
Yes a 0 0 0 0No 0 0 0 0
Yes 223 297 223 0Yes 56 0 0 778
Yes 325 325 325 0No 0 0 0 0
Yes 15 15 15 0No 0 0 0 0No 0 0 0 0
Yes 5 5 5 0Yes . . . . . . . . . . . .No 0 0 0 0No 0 0 0 0
Yes 0 0 0 32
No 0 0 0 0No 0 0 0 0
Yes 129 150 114 0Yes 14 14 14 0Yes 81 81 81 0
No 0 0 0 0Yes 0 322 0 0Yes 30 30 30 0Yes 36 109 0 0Yes 27 27 27 0
Yes 31 31 31 0No 0 0 0 0
Yes 86 86 86 0Yes 0 146 0 0No 0 0 0 0
Yes 64 64 64 0Yes 2 27 2 0Yes 32 32 32 0Yes 67 67 67 0No 0 0 0 0
No 0 0 0 0No 0 0 0 0
Yes 5 5 5 0No 0 0 0 0
Yes 28 28 28 0
Requiring care
Supplement available Aged Blind Disabled
Continued
VirginiaWashington
Table C-2. Maximum SSI state supplement, by eligibility category, 1991 (in dollars)
State or region
Alabama
ArizonaArkansasCaliforniaColorado
ConnecticutDelawareDistrict of ColumbiaFloridaGeorgia
HawaiiIllinoisIndianaKansasKentucky
LouisianaMarylandMassachusettsMichiganMinnesota
MississippiMissouriNebraskaNevadaNew Hampshire
New JerseyNew MexicoNew YorkNorth CarolinaOhio
OklahomaOregonPennsylvaniaRhode IslandSouth Carolina
TennesseeTexasUtah
Lahiri, Kajal; Denton R. Vaughan; andBernard Wixon. 1995. “ModelingSSA’s Sequential Disability Determina-tion Process Using Matched SIPPData.” Social Security Bulletin 58(4):3-42.
Levy, P., and S. Lemeshow. 1999.Sampling of Populations. 3rd ed. NewYork: John Wiley & Sons.
McGarry, Kathleen. 1996. “FactorsDetermining Participation of the Elderlyin Supplemental Security Income.”Journal of Human Resources 31(2):331-358.
___________. 2000. “GuaranteedIncome: SSI and the Well-Being of theElderly Poor.” NBER Working PaperNo. 7574. Cambridge, Mass.: NationalBureau of Economic Research.
Menefee, John; Bea Edwards; andSylvester Schieber. 1981. “Analysis ofNonparticipation in the SSI Program.”Social Security Bulletin 44(6): 3-21.
Panis, Constantijn; Roald Euller; CynthiaGrant; Melissa Bradley; Christine E.Peterson; Randall Hirscher; and PaulSteinberg. 2000. SSA Program DataUser’s Manual. Baltimore, Md.: SocialSecurity Administration.
Pickett, Clark D., and Charles G. Scott.1996. “Reinventing SSI Statistics:SSA’s New Longitudinal File.” SocialSecurity Bulletin 59(2): 31-56.
Rupp, Kalman, and David Stapleton.1998. “Introduction.” In Growth inDisability Benefits: Explanations andPolicy Implications, edited by Ruppand Stapleton. Kalamazoo, Mich.: W.E.Upjohn Institute for EmploymentResearch.
Rupp, Kalman; Alexi Strand; and Paul S.Davies. 2001. “The Potential of theSupplemental Security Income Programto Fight Poverty Among ElderlyWomen.” Paper presented at the SixthWomen’s Policy Research Conference,The Status of Women: Facing theFacts, Forging the Future, Washing-ton, D.C., June 8-9.
Sheils, John; Burt Barnow; KatherineChaurette; and Jill Constantine. 1990.Elderly Persons Eligible for andParticipating in the SupplementalSecurity Income (SSI) Program.Washington, D.C.: Lewin/ICF.

Social Security Bulletin • Vol. 64 • No. 2 • 2001/2002 43
Social Security Administration. 1992.State Assistance Programs for SSIRecipients. SSA Pub. No. 17-002.Washington, D.C.: Social SecurityAdministration, Office of SupplementalSecurity Income, Division of ProgramManagement and Analysis. January.
Stata Corporation. 1999. Stata 6 Refer-ence Su–Z, Vol. 4. College Station, Texas:Stata Press.
Vaughan, Denton, and Bernard Wixon.1991. “Implementing an SSI ModelUsing the Survey of Income andProgram Participation.” ORS WorkingPaper Series No. 54. Washington, D.C.:Social Security Administration.
Warlick, Jennifer. 1982. “Participation ofthe Aged in SSI.” Journal of HumanResources 17(2): 236-260.
Wixon, Bernard, and Denton Vaughan.1991. “Rationale for a SIPP-BasedMicrosimulation Model of SSI andOASDI.” ORS Working Paper Series No.54. Washington, D.C.: Social SecurityAdministration.
Yelowitz, Aaron. 1998. “The Impact ofHealth Care Costs and Medicaid on SSIParticipation.” In Growth in DisabilityBenefits: Explanations and PolicyImplications, edited by Kalman Ruppand David Stapleton. Kalamazoo, Mich.:W.E. Upjohn Institute for EmploymentResearch.
No 0 0 0 0Yes 93 93 93 0Yes 30 30 30 0
South Dakota Yes 0 22 0 0
Montana, Wyoming Yes 87 87 87 0
a.
Blind
West VirginiaWisconsin
Requiring care
. . . = not available.
SOURCE: Social Security Administration (1992).
NOTES: States and metropolitan areas with populations less than 250,000 are not identified in Survey of Income and Program Participation (SIPP) public-use files to protect the confidentiality of respondents. For the 1990 SIPP panel used in this article, state-level geography is available for 41 individual states and the District of Columbia. The nine other states are combined into three groups: Maine and Vermont; Iowa, North Dakota, and South Dakota; and Alaska, Idaho, Montana, and Wyoming.
Alaska, Idaho,
Iowa, North Dakota, Maine, Vermont
Aged Disabled
Table C-2. Continued
State or region
Arizona provides a supplement only for SSI recipients who require housekeeping services. See Table C-3.
Supplement available

Social Security Bulletin • Vol. 64 • No. 2 • 2001/200244
0 0 0 0 0 12070 0 0 0 0 0
0 0 0 0 0 00 0 557 762 557 00 0 323 211 211 0
0 0 461 461 461 00 0 0 0 0 00 0 30 30 30 00 0 0 0 0 00 0 0 0 0 0
0 0 9 9 9 0. . . . . . . . . . . . . . . . . .
0 0 0 0 0 00 0 0 0 0 00 0 0 0 0 72
0 0 0 0 0 00 0 0 0 0 00 0 202 510 180 00 0 21 21 21 00 0 129 129 129 0
0 0 0 0 0 00 0 0 644 0 00 0 48 48 48 00 0 74 375 0 00 0 21 21 21 0
0 236 25 25 25 00 0 0 0 0 00 0 103 103 103 00 0 0 243 0 00 0 0 0 0 0
0 0 128 128 128 00 2 0 26 0 00 0 49 49 49 00 0 125 125 125 00 0 0 0 0 0
0 0 0 0 0 00 0 0 0 0 00 0 11 11 11 00 0 0 0 0 00 192 22 22 22 00 0 0 0 0 0West Virginia
Continued
TexasUtahVirginiaWashington
PennsylvaniaRhode IslandSouth Carolina
Tennessee
Missouri
OklahomaOregon
New JerseyNew MexicoNew York
MassachusettsMichiganMinnesota
Mississippi
KansasKentucky
LouisianaMaryland
Individuals
With housekeeper
With ineligible spouse
Arkansas
AlabamaArizona
Couples
Requiring careAged Blind Disabled
CaliforniaColorado
ConnecticutDelaware
FloridaGeorgia
HawaiiIllinoisIndiana
Table C-3. Maximum SSI state supplement, by selected characteristics, 1991 (in dollars)
State or region
NebraskaNevadaNew Hampshire
District of Columbia
North CarolinaOhio

Social Security Bulletin • Vol. 64 • No. 2 • 2001/2002 45
0 144 146 146 146 00 0 50 50 50 0
0 0 0 44 0 0
0 0 107 107 107 0
NOTES: States and metropolitan areas with populations less than 250,000 are not identified in Survey of Income and Program Participation (SIPP) public-use files to protect the confidentiality of respondents. For the 1990 SIPP panel used in this article, state-level geography is available for 41 individual states and the District of Columbia. The nine other states are combined into three groups: Maine and Vermont; Iowa, North Dakota, and South Dakota; and Alaska, Idaho, Montana, and Wyoming.
WisconsinMaine, Vermont
. . . = not available.
Iowa, North Dakota, South Dakota
Alaska, Idaho, Montana, Wyoming
Table C-3. Continued
State or region
IndividualsCouples
With housekeeper
With ineligible spouse Aged Blind
SOURCE: Social Security Administration (1992).
Disabled Requiring
care