modeling of the thermal efficiency of a whole cement
TRANSCRIPT

energies
Article
Modeling of the Thermal Efficiency of a WholeCement Clinker Calcination System and ItsApplication on a 5000 MT/D Production Line
Yanfei Yao 1 , Songxiong Ding 2 and Yanxin Chen 1,*1 College of Materials Science and Engineering, Xi’an University of Architecture and Technology,
Xi’an 710055, China; [email protected] Department of Civil Engineering, University of Agder, 4879 Grimstad, Norway; [email protected]* Correspondence: [email protected]; Tel.: +86-1309-697-3109
Received: 21 August 2020; Accepted: 5 October 2020; Published: 10 October 2020�����������������
Abstract: This paper proposes that the scope of research should be extended to the whole clinkercalcination system from its single device or specific process (i.e., its functional subunits) asconventionally conducted. Mass/heat flow and effective heat were first analyzed to obtain thethermal efficiencies of its subunits ϕi); a thermal efficiency model of the whole system ϕQY was thusestablished by correlating the relationship between ϕi and ϕQY. The thermal efficiency model of thewhole system showed thatϕi had a positive linear correlation withϕQY; it was found that the thermalefficiency of the decomposition and clinker calcination unit ( ϕDC) had the greatest weight on ϕQY,where a 1% increase inϕDC led to a 1.73% increase inϕQY—improvingϕDC was shown to be the mosteffective way to improve ϕQY. In this paper, the developed thermal efficiency model was applied toone 5000 MT/D production line. It was found that its ϕQY was only 61.70%—about 2.35% lower thana representative line; such decrease was caused by its low ϕDC and ϕP which, as disclosed by model,were derived from the low decomposition rate of calcium carbonate in preheated meal put into acalciner and the high excess air coefficient of secondary air. Controlled parameter optimization of this5000 MT/D production line was then carried out. As a result, the ϕDC and ϕP of the production linewere increased from 30.03% and 64.61% to 30.69% and 65.69%, respectively; the ϕQY increased from61.70% to 62.55%; the clinker output of the production line increased from 5799 MT/D to 5968 MT/D;the heat consumption of clinker was reduced from 3286.98 kJ/kg·cl to 3252.41 kJ/kg·cl.
Keywords: thermal efficiency; effective heat; whole system; decomposition rate
1. Introduction
Cement clinker manufacturing is an energy-intensive process, often involving fuel (pulverizedcoal, oil and gas) combustion/firing. Fuel firing (mainly pulverized coal in China) is required to achieveand maintain thermal conditions for carbonate decomposition and clinker calcination; it is also aprocess with significant CO2 emissions [1,2]. Global process emissions during cement productionin 2017 were 1.48 ± 0.20 GT of CO2, equivalent to about four percent of the total global fossil fuelemissions [3]. With the development of suspension preheaters and pre-calciner technology, the capacityof single-cement production lines has been greatly increased at a much-reduced energy consumptionrate [4,5]. The maximum production scale of a cement production line can reach 12,000 MT/D at aheat consumption of as low as 2900 kJ/kg·cl [6]. Benefiting from continuous technological advances,the modern cement industry has become more conscious of the energy efficiency of the wholeproduction line while pursuing increased capacities of cement kilns.
It is estimated that 95% of the energy consumption in cement clinker production comes fromthermal energy; fuel consumption accounts for 50–60% of the total costs of cement production [7].
Energies 2020, 13, 5257; doi:10.3390/en13205257 www.mdpi.com/journal/energies

Energies 2020, 13, 5257 2 of 16
Therefore, there are economic reasons to improve the energy efficiency of production lines. In fact,considerable efforts have been made to improve the performance of various thermal devices asadopted in cement clinker production to reduce fuel consumption [8,9]. Typical examples includeimplementation of large scale NSP (New Suspension Preheater) kilns and high-performance burners,the development of advanced raw meal preheaters and calciner units based on “high solid-gas ratiotechnology” and other efforts to develop production lines with external processing of coal grindingand raw meal drying to retrieve the thermal energy exiting the flues [10–13]. It is worth noting thatresearch has been recently conducted to develop intelligent control tools for the same purpose [14–18].
For cement clinker calcination systems, improving thermal efficiency is the most direct way toreduce heat consumption [19], and the key to increasing heat efficiency lies in how to determine thekey parameters and their most valuable operating range. The modern cement industry mostly usesdistributed control systems to control operating parameters [20]. Assuming a 2500 MT/D cementproduction line as an example, there are more than 2000 operating parameters, and most of theparameters affect and restrict each other, which means that it is quite challenging to improve thermalefficiency in a simple fashion [21,22].
Rasul M. G. adopted burning and second law efficiencies and cooler and recovery efficiencies toassess the thermal performance of the cement industry in Indonesia [8]. In doing so, thermal energyconservation opportunities were also identified. Liu Z. established a thermally efficient analyticalmodel of raw material preheating and decomposition, clinker calcination and clinker cooling anddetermined that increasing the raw material decomposition rate fed into the kiln can improve thethermal efficiency of the clinker calcination process unit [23]. It should be noted that research onthermal efficiency is mostly concentrated on a single device or unit, and studies encompassing thewhole cement production system have not been sufficiently carried out.
This paper proposes that the scope of research should be extended from a single device or certainprocess to the whole cement clinker calcination system (the whole system) while analyzing the thermalefficiency of the cement clinker production process. The whole system has been divided into fivesubunits based on the production process, and the subunits have been further divided into heat firingunits and heat recovery units, according to the functions of the main thermal equipment in theirrespective scope. Thus, the effective heat and thermal efficiency of the whole system and its fivesubunits have been identified using mass and energy balances, and the relationships between thethermal efficiencies of the subunits and thermal efficiency of the whole cement clinker system havebeen analyzed to establish the thermal efficiency model of the whole system. This thermal efficiencymodel has also been applied to a 5000 MT/D production line.
2. Scope and Objectives of the Whole System
Taking one 5000 MT/D cement clinker production line in Anhui Province as an example, a moderncement production line typically consists of eight thermal devices: the raw mill, SP waste heat boiler,preheater, calciner, rotary kiln, grate cooler, coal mill, and AQC waste heat boil. Based on energy/massflows and the functionality of each device, they have been grouped into five subunits (as illustratedin Figure 1):
a. Raw Material Grinding and Boiler of Suspension Preheater (SP) unit (R&SP) for handling rawmaterial and cogeneration.
b. Preheating unit as row feed preheaters.c. Decomposition and Clinker Calcination unit (D&C) for the formation of clinker.d. Clink Cooling unit (grate cooler) for the rapid cooling of hot clinker.e. Coal Grinding and Boiler of Air Quenching Cooler (AQC) unit (C&AQC) for handling raw coal
and cogeneration.

Energies 2020, 13, 5257 3 of 16
Energies 2020, 13, x FOR PEER REVIEW 3 of 16
.
Figure 1. Whole system and its subunits in a modern cement production line.
Figure 1 shows the mass flow between the various units either as inputs or as outflow/output to be defined and clarified later for the whole system. The raw mill is used to dry and grind wet raw materials to a required particle size as raw feed, and the raw feed is then fed into the Preheating unit for heating. Such raw feed is expected to be heated to 750–790 ℃ from ambient temperature before entering the D&C unit. As shown in Figure 1, pulverized coal is burned in the calciner for decarbonation of the heated raw feed and the rotary kiln for the formation reaction of the clinker, respectively. The newly formed clinker exits to the Cooling unit for rapid cooling. The Cooling unit (grate cooler) utilizes air to quench the clinker, and as a result, the air itself can be quickly heated. The air is then sent into different pieces of equipment: air at medium and low temperatures is sent to the C&AQC unit for drying raw coal and power generation, while air at high temperature is sent to the D&C unit as “secondary air” or “tertiary air” to provide oxygen for the combustion of pulverized coal in the rotary kiln or calciner. All air is now becoming ‘flue gas’, which is then introduced to the R&SP unit after heat exchange with raw materials in the Preheating unit.
3. Effective Heat and Thermal Efficiency
3.1 Definition of Effective Heat and Thermal Efficiency
Heat balance analysis was introduced to address both the input and output heats of the whole system and its subunits, and the output heat was further divided into three categories according to consumption method, which are effective heat, transfer heat and lost heat. Among them, effective heat refers to the heat directly consumed to realize the purpose of the subunits or the whole system, transfer heat refers to the heat that cannot be fully used by one subunit and is transferred to adjacent
Figure 1. Whole system and its subunits in a modern cement production line.
Figure 1 shows the mass flow between the various units either as inputs or as outflow/outputto be defined and clarified later for the whole system. The raw mill is used to dry and grind wetraw materials to a required particle size as raw feed, and the raw feed is then fed into the Preheatingunit for heating. Such raw feed is expected to be heated to 750–790 ◦C from ambient temperaturebefore entering the D&C unit. As shown in Figure 1, pulverized coal is burned in the calciner fordecarbonation of the heated raw feed and the rotary kiln for the formation reaction of the clinker,respectively. The newly formed clinker exits to the Cooling unit for rapid cooling. The Cooling unit(grate cooler) utilizes air to quench the clinker, and as a result, the air itself can be quickly heated.The air is then sent into different pieces of equipment: air at medium and low temperatures is sent tothe C&AQC unit for drying raw coal and power generation, while air at high temperature is sent to theD&C unit as “secondary air” or “tertiary air” to provide oxygen for the combustion of pulverized coalin the rotary kiln or calciner. All air is now becoming ‘flue gas’, which is then introduced to the R&SPunit after heat exchange with raw materials in the Preheating unit.
3. Effective Heat and Thermal Efficiency
3.1. Definition of Effective Heat and Thermal Efficiency
Heat balance analysis was introduced to address both the input and output heats of the wholesystem and its subunits, and the output heat was further divided into three categories according toconsumption method, which are effective heat, transfer heat and lost heat. Among them, effective

Energies 2020, 13, 5257 4 of 16
heat refers to the heat directly consumed to realize the purpose of the subunits or the whole system,transfer heat refers to the heat that cannot be fully used by one subunit and is transferred to adjacentsubunits in the form of sensible heat carried by flue gas and materials, lost heat refers to the heat lostduring the utilization and transmission of heat, mostly in the form of surface heat loss, sensible heatcontained in the low temperature flue gas and materials discharged from the whole system.
The purposes of the subunits and whole system are determined by their main thermal devices,which can be categorized as calcination devices and heat recovery devices. For the whole kiln system,only the decomposition calciner (D&C unit) and rotary kiln belong to calcination devices, while all otherthermal equipment belongs to heat recovery devices. Therefore, the D&C unit is the only calcinationunit of all subunits within which pulverized coal is burned to provide the necessary heat to formcement clinker [19]; its effective heat refers to the heat consumed by the physical and chemical reactionsduring clinker generation, such as decomposition heat of calcium carbonate and the formation heat ofclinker. Heat recovery units, including the R&SP unit, Preheating unit, Cooling unit, and C&AQC unit,can recover heat from the high temperature flue gas and hot-red clinker to be used in various ways,such as drying materials, residual heat power generation and preheating raw materials. For one specificsubunit, its effective thermal reference would be analyzed in the following specific articles/sections.
The ratio of effective heat to the sum of the input heat is defined as the thermal efficiency of thesubunit or whole system:
ϕi =Ei
U
Eiin
. (1)
where ϕi is the thermal efficiency of the whole system or its subunit (%), where a larger thermalefficiency value relates to higher heat utilization efficiency of the subunit or the whole system. Eu is theeffective heat (kJ) and Ein is the total input heat (kJ). The symbol “i” in Equation (1) refers to differentobjectives, RS for R&SP unit, P for Preheating unit, DC for D&C unit, C for Cooling unit, CA forC&AQC unit and QY for the whole system. For instance, ϕRS is the energy efficiency of the R&SP unit,and ECA
U is the effective heat utilized by the C&AQC unit.
3.2. Assumptions
Calculation and analysis of all heat measurements in this paper were calculated by thermodynamicprinciples with assumptions as follows.
1. The whole cement clinker system is stable, i.e., in a steady state.2. All calculations are based on one kilogram of clinker.3. Ambient temperature (20 ◦C) was used as the reference temperature; therefore, sensible heat
of normal temperature materials and air entering the system, such as raw materials, coal andcooling air, can be ignored.
4. No air seepage occurred in the whole system.
3.3. Effective Heat of Subunits
3.3.1. Raw Material Grinding and SP Unit (R&SP)
The Raw Material Grinding and SP unit has two main devices: the SP waste heat boiler and theraw mill, as shown in Figure 2.
Sensible heat of the flue gas (denoted as QYQ) from the Preheating unit and the sensible heat of flyash contained in the flue gas (QFC) constitute the input heat of the R&SP unit (ERS
in ). That is:
ERSin = QYQ + QFC (2)

Energies 2020, 13, 5257 5 of 16
Energies 2020, 13, x FOR PEER REVIEW 5 of 16
Figure 2. Heat flow modeling of the Raw Material Grinding and SP unit.
Sensible heat of the flue gas (denoted as QYQ) from the Preheating unit and the sensible heat of fly ash contained in the flue gas (QFC) constitute the input heat of the R&SP unit (E ). That is: E = Q + Q (2)
Flue gas from the Preheating unit with a temperature of 270~340℃ first goes through the SP boiler to heat circulating water in the SP boiler to obtain superheated steam; the heat obtained by the circulating water constitutes the first effective heat of the R&SP unit, which is denoted as QCSP. Flue gas discharged from the SP boiler is then divided into two routes, 90% of which enters the raw mill (route A in Figure 2) to dry the wet raw material while the other 10% (route B in Figure 2) enters the process with the flue gas and powdered dry raw mill discharged from the raw mill for further environmental protection treatment, where the powdered raw mill can be collected. Heat consumed to evaporate the moisture in the raw material constitutes the second effective heat of the R&SP unit and is denoted as QSLQH; thus, the effective heat E of the R&SP unit can be calculated by Equation (3): E = 𝑄 + 𝑄 (3)
Sensible heat of both the exhaust gas and powdered dry raw mill at the R&SP outlet cannot be used by any other equipment or subunit and is considered as heat loss together with the heat dissipation through the R&SP surface.
Heat flows of the Raw Material Grinding and SP unit are shown in Figure 2 and its heat balance is given in Table 1 with brief descriptions. All heat involved in this article can be classified into three types: chemical reaction, sensible heat and surface heat loss; their calculated values are shown in Table 1. For conciseness in the subsequent analysis, only the calculation of chemical heat is specified, whereas the calculation processes of surface heat dissipation and physical heat will not be described.
Table 1. Heat balance of the Raw Material Grinding and SP (R&SP) unit.
Input Heat Symbols Description Formula Used
QYQ Sensible heat of flue gas at preheater outlet A1·C1·(T1-T0) QFC Sensible heat of fly ash at preheater outlet M1·C2·(T2-T0) E Total input heat of R&SP unit ΣQi
Output heat Item Symbols Description Formula used
Lost heat QFQ Sensible heat of exhaust gas at R&SP outlet A2·C3·(T3-T0)
QC
SP
QSL
QH
SP Boiler
Effective heat
Loss heat
Route A
Rou
te B
QFQ
1
Flue gas from Preheating unitRaw
Mill
To environmental protection process R
aw m
eal
Pow
dery
R
aw m
eal
QYQ+ QFC
QY
WS
QFQ2
Input heat
Legend
QSL
Figure 2. Heat flow modeling of the Raw Material Grinding and SP unit.
Flue gas from the Preheating unit with a temperature of 270~340 ◦C first goes through the SPboiler to heat circulating water in the SP boiler to obtain superheated steam; the heat obtained bythe circulating water constitutes the first effective heat of the R&SP unit, which is denoted as QCSP.
Flue gas discharged from the SP boiler is then divided into two routes, 90% of which enters the rawmill (route A in Figure 2) to dry the wet raw material while the other 10% (route B in Figure 2) entersthe process with the flue gas and powdered dry raw mill discharged from the raw mill for furtherenvironmental protection treatment, where the powdered raw mill can be collected. Heat consumed toevaporate the moisture in the raw material constitutes the second effective heat of the R&SP unit and isdenoted as QSLQH; thus, the effective heat ERS
U of the R&SP unit can be calculated by Equation (3):
ERSU = QCSP + QSLQH (3)
Sensible heat of both the exhaust gas and powdered dry raw mill at the R&SP outlet cannotbe used by any other equipment or subunit and is considered as heat loss together with the heatdissipation through the R&SP surface.
Heat flows of the Raw Material Grinding and SP unit are shown in Figure 2 and its heat balance isgiven in Table 1 with brief descriptions. All heat involved in this article can be classified into threetypes: chemical reaction, sensible heat and surface heat loss; their calculated values are shown inTable 1. For conciseness in the subsequent analysis, only the calculation of chemical heat is specified,whereas the calculation processes of surface heat dissipation and physical heat will not be described.

Energies 2020, 13, 5257 6 of 16
Table 1. Heat balance of the Raw Material Grinding and SP (R&SP) unit.
Input Heat
Symbols Description Formula Used
QYQ Sensible heat of flue gas at preheater outlet A1·C1·(T1-T0)QFC Sensible heat of fly ash at preheater outlet M1·C2·(T2-T0)ERS
in Total input heat of R&SP unit ΣQi
Output heat
Item Symbols Description Formula usedLost heat QFQ Sensible heat of exhaust gas at R&SP outlet A2·C3·(T3-T0)Lost heat QS Heat dissipation of R&SP surface ξ1·S1·(T5-T0)Lost heat QSL Sensible heat of raw materials at raw mill outlet M2·C4·(T4-T0)
Effective heat QSLQH Heat consumption of water evaporation M3·2496Effective heat QCSP Absorbed heat by SP boiler M4·(C6·T7-C5·T6)
ERSout Total output heat of R&SP unit ΣQi
3.3.2. Preheating Unit
The Preheating unit contains 10 cyclones which are arranged on four levels in twin-parallelcolumns, A and B; in each column, there are two cyclones on level one and one cyclone from levelstwo to four downward, which are named as C1A1/A2, C2A, C3A, C4A, C1B1/B2, C2B, C3B and C4B forconvenience (see Preheating unit in Figure 1). The hot flue gas exiting from the D&C unit is streamedevenly into columns A and B through each upward cyclone, and the raw feed is fed into cyclonesC1A1/A2 and C1B1/B2, respectively.
The purpose of the preheating system is to recover the heat in the high temperature flue gas andfly ash from the D&C unit to heat the fed raw feed. All of its input heat comes from the sensible heat ofhot air and fly ash from the D&C unit (denoted as QC5F).
Chemical reactions, such as the decomposition of magnesium carbonate, occur during thepreheating process; the heat required in such a process is called the formation heat of clinker in thePreheating unit (denoted as QSC1) and belongs to effective heat. The formula of QSC1 is as follows:
QSC1 = M5 ∗ 1420 (4)
The effective heat of the Preheating unit (EPU) refers to the sum of the heat absorbed by the preheated
raw feed (denoted as QC4) and the formation heat of clinker in the Preheating unit (see Equation (5)).
EPU = QSC1 + QC4. (5)
Flue gas, after heat exchange with the raw feed, as well as a small amount of dust carried in theflue gas, is discharged from C1A1/A2 and C1B1/B2 and enters the SP boiler in the R&SP unit, where thesensible heat can be recycled. Then, the sensible heat of the flue gas and fly ash at the preheater(denoted as QYQ and QFC) outlet can be classified as transfer heat. The only lost heat in the Preheatingunit is the heat dissipation of the Preheating unit surface (denote as QYRS). Heat flow modeling of thePreheating unit is shown in Figure 3.

Energies 2020, 13, 5257 7 of 16
Energies 2020, 13, x FOR PEER REVIEW 6 of 16
Lost heat QYWS Heat dissipation of R&SP surface ξ1·S1·(T5-T0) Lost heat QSL Sensible heat of raw materials at raw mill outlet M2·C4·(T4-T0)
Effective heat QSLQH Heat consumption of water evaporation M3·2496 Effective heat QCSP Absorbed heat by SP boiler M4·(C6·T7- C5·T6) E Total output heat of R&SP unit ΣQi
3.3.2. Preheating Unit
The Preheating unit contains 10 cyclones which are arranged on four levels in twin-parallel columns, A and B; in each column, there are two cyclones on level one and one cyclone from levels two to four downward, which are named as C1A1/A2, C2A, C3A, C4A, C1B1/B2, C2B, C3B and C4B for convenience (see Preheating unit in Figure 1). The hot flue gas exiting from the D&C unit is streamed evenly into columns A and B through each upward cyclone, and the raw feed is fed into cyclones C1A1/A2 and C1B1/B2, respectively.
The purpose of the preheating system is to recover the heat in the high temperature flue gas and fly ash from the D&C unit to heat the fed raw feed. All of its input heat comes from the sensible heat of hot air and fly ash from the D&C unit (denoted as QC5F).
Chemical reactions, such as the decomposition of magnesium carbonate, occur during the preheating process; the heat required in such a process is called the formation heat of clinker in the Preheating unit (denoted as QSC1) and belongs to effective heat. The formula of QSC1 is as follows: Q = M ∗ 1420 (4)
The effective heat of the Preheating unit (E ) refers to the sum of the heat absorbed by the preheated raw feed (denoted as QC4) and the formation heat of clinker in the Preheating unit (see Equation (5). E = 𝑄 + 𝑄 (5)
Flue gas, after heat exchange with the raw feed, as well as a small amount of dust carried in the flue gas, is discharged from C1A1/A2 and C1B1/B2 and enters the SP boiler in the R&SP unit, where the sensible heat can be recycled. Then, the sensible heat of the flue gas and fly ash at the preheater (denoted as QYQ and QFC) outlet can be classified as transfer heat. The only lost heat in the Preheating unit is the heat dissipation of the Preheating unit surface (denote as QYRS). Heat flow modeling of the Preheating unit is shown in Figure 3.
Figure 3. Heat flow modelling of the Preheating unit.
QC
4
QSC
1
Flue gas and dust from D&C unit
Preheater
Flue gas and dust to R&SP unit
Raw
feed
Preh
eate
d m
ater
ial t
o D
&C
uni
tQYQ+ QFC
QY
RS
QC5F
Legend
Effective heat
Loss heatInput heat
Transfer heat
Figure 3. Heat flow modelling of the Preheating unit.
3.3.3. Decomposition and Clinker Calcination Unit (D&C unit)
The Decomposition and Clinker Calcination unit (D&C subunit) consists of the calciner,cyclone C5A/B, tertiary air ducts and a rotary kiln. Most cement enterprises use pulverized coalas fuel, 30–40% of which (MTM in Figure 1) is fed into the rotary kiln and the other 60–70% (MWM
in Figure 1) into the calciner; under the action of heat and oxygen provided by high temperature airfrom the Cooling unit, pulverized coal burns and releases heat, which can be denoted as QTM andQWM, respectively. Exothermic combustion of pulverized coal, as well as the sensible heat of hightemperature tertiary air and secondary air from the Cooling unit (denoted as Q3C and Q2C, respectively)and heated material/feed from the Preheating unit (denoted as QC4), are composed of the input heat inthe D&C subunit.
As the only calcination unit in the whole system, the purpose of the D&C unit is to provide a hightemperature environment and steady stream of heat required to carry out the chemical reaction to formthe clinker. Chemical reactions in the D&C unit can be divided into two categories: decompositionof calcium carbonate and formation of clinker; the heat consumed in these reactions is countered asthe effective heat of the D&C unit and can be calculated by formulas (6–8). C3S, C2S, C3A and C4AFin Equation (8) are the percentages of various minerals in clinker, which can be concluded from thecomposition analysis of clinker.
EDCU = QSC2 + QSC3. (6)
QSC2 = M6 ∗ 1686 (7)
QSC3 = −(C3S∗465 + C2S∗610 + C3A∗88 + C4AF∗105)/100 (8)
After the completion of the reactions in the D&C subunit, spherical clinker is formed andtransported to the Cooling unit at a temperature of about 1400 ◦C for rapid cooling, whereas the 870 ◦Cflue gas is discharged from the cyclone C5 outlet and streamed into the Preheating unit. Sensible heatof the flue gas and dust (denoted as QC5F) can be reused as the heat source for preheating raw meal,and the sensible heat of red-hot clinker (denoted as QHS) can also be recycled in the Cooling unit,both of which are classified as transfer heat of the D&C unit.
The only heat loss of the D&C unit is the dissipated heat through the calciner surface, cyclone C5A/B,tertiary air duct and rotary kiln (denoted as QDCS). It is worth noting that QDCS is usually considerable,greater than that of all other subunits because of the high surface temperature of the D&C unit(the surface temperature of the rotary kiln is much higher than that of all other thermal equipment inthe whole system).

Energies 2020, 13, 5257 8 of 16
The heat flow of the D&C unit is shown in Figure 4.Energies 2020, 13, x FOR PEER REVIEW 8 of 16
Figure 4. Heat flow modelling of the Decomposition and Clinker Calcination unit.
3.3.4. Cooling Unit
Red-hot clinker discharged from the rotary kiln moves along the grate bed of the grade cooler to complete rapid heat exchange with ambient temperature cooling air, where the temperature of discharged clinker from the grade cooler can be reduced from about 1400 ℃ to about 100 ℃ and the cooling air temperature conversely increases. As the most important heat recovery device in the whole system, the Cooling unit plays an important role in reducing the heat consumption of clinker burning.
The input heat of the Cooling unit (E ) is the sensible heat of red-hot clinker (denoted as QHS), most of which is utilized as the sensible heat of hot cooling air after heat exchange. Cooling air discharged from the front of the grate bed has a high temperature and is sent to the D&C subunit as “secondary air” and “tertiary air” to provide oxygen and heat for coal combustion; their heat is denoted as Q2C and Q3C, respectively. Cooling air discharged from the middle and back section of the grate bed is generally used for waste heat power generation and drying raw coal for its low temperature; its heat is denoted as QZWF.
The effective heat of the Cooling unit (E ) refers to the sum of the sensible heat of all hot cooling air, which is calculated as follows: E = 𝑄 + 𝑄 + 𝑄 (9)
Lost heat of the Cooling unit contains both the dissipated heat through its surface (denoted as QLQS) and the sensible heat of cooled clinker at the grate cooler outlet (denoted as QCS). The heat flow of the Cooling unit is shown in Figure 5.
Flue gas and dust to Preheatingunit
Calciner
Decomposed material
Preh
eate
d m
ater
ial
Rotary kiln
Calciner coal
Kiln coal
Secondary air
Tertiary air
Fuel gas
QWM+Q3C
QTM+Q2C
QC
4
QC5F
QSC2
QSC3
QDSC
Red
-hot
cl
inke
r
QH
S
Legend
Effective heat
Loss heatInput heat
Transfer heat
Figure 4. Heat flow modelling of the Decomposition and Clinker Calcination unit.
3.3.4. Cooling Unit
Red-hot clinker discharged from the rotary kiln moves along the grate bed of the grade coolerto complete rapid heat exchange with ambient temperature cooling air, where the temperature ofdischarged clinker from the grade cooler can be reduced from about 1400 ◦C to about 100 ◦C and thecooling air temperature conversely increases. As the most important heat recovery device in the wholesystem, the Cooling unit plays an important role in reducing the heat consumption of clinker burning.
The input heat of the Cooling unit (ECin) is the sensible heat of red-hot clinker (denoted as QHS),
most of which is utilized as the sensible heat of hot cooling air after heat exchange. Cooling airdischarged from the front of the grate bed has a high temperature and is sent to the D&C subunit as“secondary air” and “tertiary air” to provide oxygen and heat for coal combustion; their heat is denotedas Q2C and Q3C, respectively. Cooling air discharged from the middle and back section of the gratebed is generally used for waste heat power generation and drying raw coal for its low temperature;its heat is denoted as QZWF.
The effective heat of the Cooling unit (ECU) refers to the sum of the sensible heat of all hot cooling
air, which is calculated as follows:
ECU = Q3C + Q2C + QZWF (9)
Lost heat of the Cooling unit contains both the dissipated heat through its surface (denoted as QLQS)and the sensible heat of cooled clinker at the grate cooler outlet (denoted as QCS). The heat flow of theCooling unit is shown in Figure 5.

Energies 2020, 13, 5257 9 of 16
Energies 2020, 13, x FOR PEER REVIEW 9 of 16
Figure 5. Heat flow modelling of the Cooling unit.
3.3.5. Coal Grinding and AQC Unit
The C&AQC unit has a similar process and function as the R&SP unit, but the difference is that the C&AQC unit uses the middle and low temperature air from the Cooling unit (QZWF) as the input heat. The heat balance of the C&AQC unit is given in Table 2, where heat input, effective heat and lost heat (Heat outflow) have been identified.
Table 2. Heat balance of the C&AQC unit.
Heat Input Symbols Description
QZWF Sensible heat of middle and low temperature air E Total heat input of C&AQC unit Heat Out
Symbols Description Lost heat QYTF Sensible heat of exhaust gas at the C&AQC outlet Lost heat QYTS Heat dissipation of the C&AQC surface Lost heat QMF Sensible heat of coal at coal mil outlet
Effective heat QAQC Absorbed heat by AQC boiler Effective heat QMFQH Heat consumption of water evaporation in coal E Total heat output of C&AQC unit
3.3.6. Effective Heat of the Whole System
The purpose of the whole system can be divided into two categories: one is to provide the heat needed for clinker generation and the other is to recover the heat in the discharged flue gas during the burning process.
The input heat of the whole system E is the combustion heat from pulverized coal where ambient temperature is used as the reference temperature, and most is used to form clinker. The formation heat of clinker is denoted as QSC, which is the sum of QSC1, QSC2, and QSC3. About 30% of E is consumed in the form of sensible heat of medium and low temperature flue gas at the outlets of both the Preheating and Cooling units, which can be reused for drying raw coal and materials and power generation. Lost heat of the whole system includes surface heat loss during heat utilization and recovery, and the sensible heat of the exhaust gas and cooled clinker discharged from the R&SP and C&AQC units. There is no transfer heat when taking the whole system as the research object.
The heat flow of the whole system is shown in Figure 6.
Red-hot clinker
Grade cooler
Cooled clinker to storage
QCS+QLQS
Q2C +Q
3C
QHS
QZW
F
Tertiary airto rotary kiln
Secondary airto calciner Middle and low
temperature air to C&AQC unit
Cooling air
Effective heat
Loss heat
Input heat
Legend
Figure 5. Heat flow modelling of the Cooling unit.
3.3.5. Coal Grinding and AQC Unit
The C&AQC unit has a similar process and function as the R&SP unit, but the difference is thatthe C&AQC unit uses the middle and low temperature air from the Cooling unit (QZWF) as the inputheat. The heat balance of the C&AQC unit is given in Table 2, where heat input, effective heat and lostheat (Heat outflow) have been identified.
Table 2. Heat balance of the C&AQC unit.
Heat Input
Symbols Description
QZWF Sensible heat of middle and low temperature airECA
in Total heat input of C&AQC unit
Heat Out
Symbols DescriptionLost heat QYTF Sensible heat of exhaust gas at the C&AQC outletLost heat QYTS Heat dissipation of the C&AQC surfaceLost heat QMF Sensible heat of coal at coal mil outlet
Effective heat QAQC Absorbed heat by AQC boilerEffective heat QMFQH Heat consumption of water evaporation in coal
ECAout Total heat output of C&AQC unit
3.3.6. Effective Heat of the Whole System
The purpose of the whole system can be divided into two categories: one is to provide the heatneeded for clinker generation and the other is to recover the heat in the discharged flue gas during theburning process.
The input heat of the whole system EQYin is the combustion heat from pulverized coal where ambient
temperature is used as the reference temperature, and most is used to form clinker. The formationheat of clinker is denoted as QSC, which is the sum of QSC1, QSC2, and QSC3. About 30% of EQY
in isconsumed in the form of sensible heat of medium and low temperature flue gas at the outlets ofboth the Preheating and Cooling units, which can be reused for drying raw coal and materials andpower generation. Lost heat of the whole system includes surface heat loss during heat utilization andrecovery, and the sensible heat of the exhaust gas and cooled clinker discharged from the R&SP andC&AQC units. There is no transfer heat when taking the whole system as the research object.
The heat flow of the whole system is shown in Figure 6.

Energies 2020, 13, 5257 10 of 16
Energies 2020, 13, x FOR PEER REVIEW 10 of 16
Figure 6. Heat flow modeling of the whole system.
4. Modeling of the Thermal Efficiency of the Whole Cement Clinker System
As defined in Section 3.3, the thermal efficiency of the whole system could be written as: φ = (10)
By introducing the thermal efficiency of each subunit, the thermal efficiency of the whole system φ , as expressed in Equation (10), can be modified as follows: φ = 1 − − + φ + φ + φ + φ + φ (11)
where φ , φ , φ , φ and φ refer to the energy efficiencies for the Raw Material Grinding and SP unit, Preheating unit, Decomposition and Clinker Calcination unit, Cooling unit and Coal Grinding and AQC unit, respectively.
The thermal efficiency model given in (11) shows that φQY has a positive linear correlation with the thermal efficiencies of all five subunits, meaning that an increase in the thermal efficiency of any subunit will lead to an increase in φQY.
In industrial production, the thermal efficiencies of subunits affect and restrict each other. For example, a reduction in φC will reduce the air temperature entering the D&C and C&AQC units and affect the combustion of both calciner coal and kiln coal, and the heat exchange effect of the coal mill and AQC boiler, φDC and φCA, will be reduced. A poor combustion of pulverized coal will reduce the quality and output of clinker, which will further reduce the heat brought into the Cooling unit by hot-red clinker and the heat exchange effect between cooling air and clinker and cause further reductions in φP.
Thermal efficiencies of all subunits on one representative 5000 MT/D production line were obtained as reference values of φi (as shown in Table 3). To quantitatively analyze the influence of the individual thermal efficiencies of each subunit on the whole system φQY, the mutual influence of the thermal efficiency between subunits must be controlled—it is hereby assumed that the change in thermal efficiency of one subunit will not affect the thermal efficiency of another subunit. On this basis, the thermal efficiency of one subunit φi was maneuvered with an increase or decrease by an increment of 2%, and the contribution of such changes to the thermal efficiency of the whole system φQY was calculated according to the thermal efficiency model as given in (11); the result is shown in Figure 7.
Table 3. Thermal efficiencies of subunits of a representative 5000 MT/D production line.
Item Units R&S Unit
Preheating Unit
D&C Unit
Cooling Unit
C&A Unit
Whole System
Ein kJ/kg.cl 533.98 1865.83 5498.71 1662.59 484.16 3187.29 Total effective
heat kJ/kg.cl 152.71 1266.03 1761.76 1577.07 79.60 2041.59
φi % 28.60 67.85 32.04 94.86 16.44 64.05
Figure 6. Heat flow modeling of the whole system.
4. Modeling of the Thermal Efficiency of the Whole Cement Clinker System
As defined in Section 3.3, the thermal efficiency of the whole system could be written as:
ϕQY =EQY
U
EQYin
(10)
By introducing the thermal efficiency of each subunit, the thermal efficiency of the whole systemϕQY, as expressed in Equation (10), can be modified as follows:
ϕQY = 1−ECA
in
EQYin
−EDC
in
EQYin
+ ϕCA ECAin
EQYin
+ ϕP EPin
EQYin
+ ϕDC EDCin
EQYin
+ ϕC ECin
EQYin
+ ϕRS ERSin
EQYin
. (11)
where ϕRS, ϕP, ϕDC, ϕC and ϕCA refer to the energy efficiencies for the Raw Material Grindingand SP unit, Preheating unit, Decomposition and Clinker Calcination unit, Cooling unit and CoalGrinding and AQC unit, respectively.
The thermal efficiency model given in (11) shows that ϕQY has a positive linear correlation withthe thermal efficiencies of all five subunits, meaning that an increase in the thermal efficiency of anysubunit will lead to an increase in ϕQY.
In industrial production, the thermal efficiencies of subunits affect and restrict each other.For example, a reduction in ϕC will reduce the air temperature entering the D&C and C&AQC unitsand affect the combustion of both calciner coal and kiln coal, and the heat exchange effect of the coalmill and AQC boiler, ϕDC and ϕCA, will be reduced. A poor combustion of pulverized coal will reducethe quality and output of clinker, which will further reduce the heat brought into the Cooling unitby hot-red clinker and the heat exchange effect between cooling air and clinker and cause furtherreductions in ϕP.
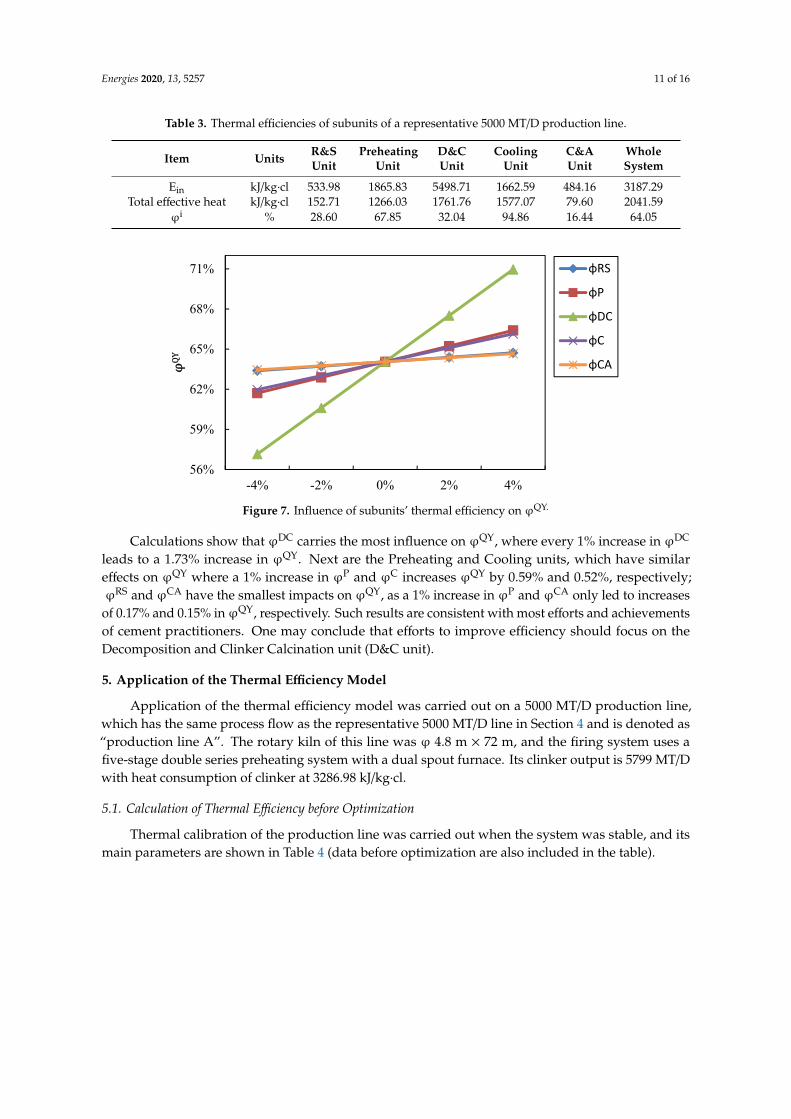
Thermal efficiencies of all subunits on one representative 5000 MT/D production line were obtainedas reference values ofϕi (as shown in Table 3). To quantitatively analyze the influence of the individualthermal efficiencies of each subunit on the whole system ϕQY, the mutual influence of the thermalefficiency between subunits must be controlled—it is hereby assumed that the change in thermalefficiency of one subunit will not affect the thermal efficiency of another subunit. On this basis,the thermal efficiency of one subunit ϕi was maneuvered with an increase or decrease by an incrementof 2%, and the contribution of such changes to the thermal efficiency of the whole system ϕQY wascalculated according to the thermal efficiency model as given in (11); the result is shown in Figure 7.
Energies 2020, 13, 5257 11 of 16
Table 3. Thermal efficiencies of subunits of a representative 5000 MT/D production line.
Item Units R&SUnit
PreheatingUnit
D&CUnit
CoolingUnit
C&AUnit
WholeSystem
Ein kJ/kg·cl 533.98 1865.83 5498.71 1662.59 484.16 3187.29Total effective heat kJ/kg·cl 152.71 1266.03 1761.76 1577.07 79.60 2041.59
ϕi % 28.60 67.85 32.04 94.86 16.44 64.05Energies 2020, 13, x FOR PEER REVIEW 11 of 16
Figure 7. Influence of subunits’ thermal efficiency on φQY.
Calculations show that φDC carries the most influence on φQY, where every 1% increase in φDC leads to a 1.73% increase in φQY. Next are the Preheating and Cooling units, which have similar effects on φQY where a 1% increase in φP and φC increases φQY by 0.59% and 0.52%, respectively; φ and φCA have the smallest impacts on φQY, as a 1% increase in φP and φCA only led to increases of 0.17% and 0.15% in φQY, respectively. Such results are consistent with most efforts and achievements of cement practitioners. One may conclude that efforts to improve efficiency should focus on the Decomposition and Clinker Calcination unit (D&C unit).
5. Application of the Thermal Efficiency Model
Application of the thermal efficiency model was carried out on a 5000 MT/D production line, which has the same process flow as the representative 5000 MT/D line in Section 4 and is denoted as “production line A”. The rotary kiln of this line was φ 4.8 m × 72 m, and the firing system uses a five-stage double series preheating system with a dual spout furnace. Its clinker output is 5799 MT/D with heat consumption of clinker at 3286.98 kJ/kg.cl.
5.1. Calculation of Thermal Efficiency Before Optimization
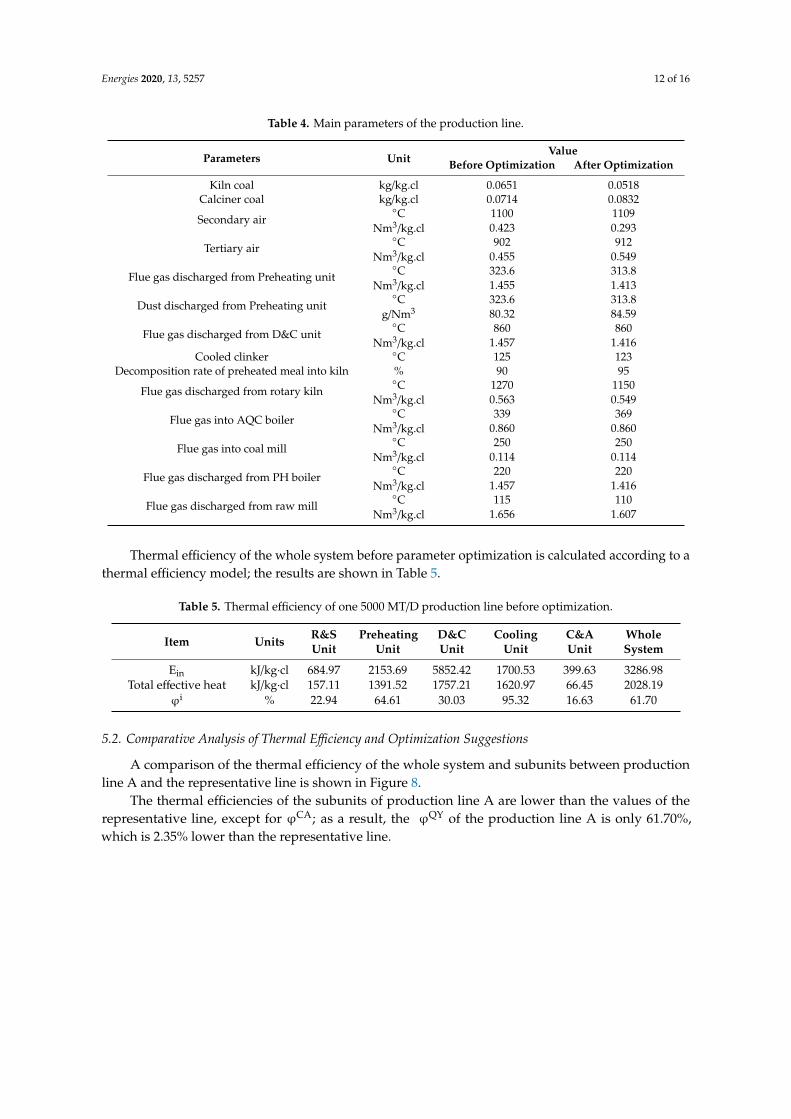
Thermal calibration of the production line was carried out when the system was stable, and its main parameters are shown in Table 4 (data before optimization are also included in the table).
Table 4. Main parameters of the production line.
Parameters Unit Value Before Optimization After Optimization
Kiln coal kg/kg.cl 0.0651 0.0518 Calciner coal kg/kg.cl 0.0714 0.0832
Secondary air ℃ 1100 1109
Nm3/kg.cl 0.423 0.293
Tertiary air ℃ 902 912
Nm3/kg.cl 0.455 0.549
Flue gas discharged from Preheating unit ℃ 323.6 313.8
Nm3/kg.cl 1.455 1.413
Dust discharged from Preheating unit ℃ 323.6 313.8
g/Nm3 80.32 84.59
Flue gas discharged from D&C unit ℃ 860 860
Nm3/kg.cl 1.457 1.416
56%
59%
62%
65%
68%
71%
-4% -2% 0% 2% 4%
φQY
Change value of thermal efficiency of subunit
φRS
φP
φDC
φC
φCA
Figure 7. Influence of subunits’ thermal efficiency on ϕQY.
Calculations show that ϕDC carries the most influence on ϕQY, where every 1% increase in ϕDC
leads to a 1.73% increase in ϕQY. Next are the Preheating and Cooling units, which have similareffects on ϕQY where a 1% increase in ϕP and ϕC increases ϕQY by 0.59% and 0.52%, respectively;ϕRS and ϕCA have the smallest impacts on ϕQY, as a 1% increase in ϕP and ϕCA only led to increases
of 0.17% and 0.15% inϕQY, respectively. Such results are consistent with most efforts and achievementsof cement practitioners. One may conclude that efforts to improve efficiency should focus on theDecomposition and Clinker Calcination unit (D&C unit).
5. Application of the Thermal Efficiency Model
Application of the thermal efficiency model was carried out on a 5000 MT/D production line,which has the same process flow as the representative 5000 MT/D line in Section 4 and is denoted as“production line A”. The rotary kiln of this line was ϕ 4.8 m × 72 m, and the firing system uses afive-stage double series preheating system with a dual spout furnace. Its clinker output is 5799 MT/Dwith heat consumption of clinker at 3286.98 kJ/kg·cl.
5.1. Calculation of Thermal Efficiency before Optimization
Thermal calibration of the production line was carried out when the system was stable, and itsmain parameters are shown in Table 4 (data before optimization are also included in the table).
Energies 2020, 13, 5257 12 of 16
Table 4. Main parameters of the production line.
Parameters UnitValue
Before Optimization After Optimization
Kiln coal kg/kg.cl 0.0651 0.0518Calciner coal kg/kg.cl 0.0714 0.0832
Secondary air◦C 1100 1109
Nm3/kg.cl 0.423 0.293
Tertiary air◦C 902 912
Nm3/kg.cl 0.455 0.549
Flue gas discharged from Preheating unit◦C 323.6 313.8
Nm3/kg.cl 1.455 1.413
Dust discharged from Preheating unit◦C 323.6 313.8
g/Nm3 80.32 84.59
Flue gas discharged from D&C unit◦C 860 860
Nm3/kg.cl 1.457 1.416Cooled clinker ◦C 125 123
Decomposition rate of preheated meal into kiln % 90 95
Flue gas discharged from rotary kiln◦C 1270 1150
Nm3/kg.cl 0.563 0.549
Flue gas into AQC boiler◦C 339 369
Nm3/kg.cl 0.860 0.860
Flue gas into coal mill◦C 250 250
Nm3/kg.cl 0.114 0.114
Flue gas discharged from PH boiler◦C 220 220
Nm3/kg.cl 1.457 1.416
Flue gas discharged from raw mill◦C 115 110
Nm3/kg.cl 1.656 1.607
Thermal efficiency of the whole system before parameter optimization is calculated according to athermal efficiency model; the results are shown in Table 5.
Table 5. Thermal efficiency of one 5000 MT/D production line before optimization.
Item Units R&SUnit
PreheatingUnit
D&CUnit
CoolingUnit
C&AUnit
WholeSystem
Ein kJ/kg·cl 684.97 2153.69 5852.42 1700.53 399.63 3286.98Total effective heat kJ/kg·cl 157.11 1391.52 1757.21 1620.97 66.45 2028.19
ϕi % 22.94 64.61 30.03 95.32 16.63 61.70
5.2. Comparative Analysis of Thermal Efficiency and Optimization Suggestions
A comparison of the thermal efficiency of the whole system and subunits between productionline A and the representative line is shown in Figure 8.
The thermal efficiencies of the subunits of production line A are lower than the values of therepresentative line, except for ϕCA; as a result, the ϕQY of the production line A is only 61.70%,which is 2.35% lower than the representative line.

Energies 2020, 13, 5257 13 of 16
Energies 2020, 13, x FOR PEER REVIEW 12 of 16
Cooled clinker ℃ 125 123 Decomposition rate of preheated meal into kiln % 90 95
Flue gas discharged from rotary kiln ℃ 1270 1150
Nm3/kg.cl 0.563 0.549
Flue gas into AQC boiler ℃ 339 369
Nm3/kg.cl 0.860 0.860
Flue gas into coal mill ℃ 250 250
Nm3/kg.cl 0.114 0.114
Flue gas discharged from PH boiler ℃ 220 220
Nm3/kg.cl 1.457 1.416
Flue gas discharged from raw mill ℃ 115 110
Nm3/kg.cl 1.656 1.607
Thermal efficiency of the whole system before parameter optimization is calculated according to a thermal efficiency model; the results are shown in Table 5.
Table 5. Thermal efficiency of one 5000 MT/D production line before optimization.
Item Units R&S Unit
Preheating Unit
D&C Unit
Cooling Unit
C&A Unit
Whole System
Ein kJ/kg.cl 684.97 2153.69 5852.42 1700.53 399.63 3286.98 Total effective
heat kJ/kg.cl 157.11 1391.52 1757.21 1620.97 66.45 2028.19
φi % 22.94 64.61 30.03 95.32 16.63 61.70
5.2. Comparative Analysis of Thermal Efficiency and Optimization Suggestions
A comparison of the thermal efficiency of the whole system and subunits between production line A and the representative line is shown in Figure 8.
Figure 8. Comparison of thermal efficiency.
The thermal efficiencies of the subunits of production line A are lower than the values of the representative line, except for φCA; as a result, the φQY of the production line A is only 61.70%, which is 2.35% lower than the representative line.
According to the thermal efficiency model, the main reason for the low thermal efficiency of the whole system is the low thermal efficiencies of the D&C and Preheating units. The reasons for these low φDC and φP were analyzed according to the parameters of the production line A (as shown in Table 4) as follows.
1) Low decomposition rate of preheated meal into the rotary kiln.
0%
20%
40%
60%
80%
100%
φRS φP φDC φC φCA φQY
Ther
mal
effi
cien
cy
Representative lineProduction line A
Figure 8. Comparison of thermal efficiency.
According to the thermal efficiency model, the main reason for the low thermal efficiency ofthe whole system is the low thermal efficiencies of the D&C and Preheating units. The reasons forthese low ϕDC and ϕP were analyzed according to the parameters of the production line A (as shownin Table 4) as follows.
(1) Low decomposition rate of preheated meal into the rotary kiln.
The decomposition rate of the preheated meal (raw feed) entering the rotary kiln in productionline A is only 90%, which is lower than the recommended rate (no less than 95%). A portion ofthe calcium carbonate enters the kiln with preheated meal to be decomposed, absorbs heat in therotary kiln and thus increases the thermal load of the kiln and restricts the clinker output increase.Consequently, surface heat loss per kilogram of clinker in the D&C system will be increased as thetotal heat dissipation per hour is constant.
(2) Excess secondary air volume.
The oxygen content in the flue gas at the kiln hood is around 4.0%, which is higher than therecommended value of about 2%. This is an equivalent of an excess air coefficient of 1.18, which meansthat the volume of secondary air in the kiln is higher than its actual requirement. Excessive volumeof secondary air results in increased sensible heat taken away by the flue gas discharged from theD&C unit.
(3) Low heat transfer efficiency between gas and solid.
Heat transfer efficiency between the fed meal and flue gas in the Preheating system is mainlydetermined by the structural parameters and gas-solid ratio of the Preheating system. Heat transferefficiency between gas and solid increases as the solid-gas ratio increases when structural parametersremain unchanged [24]. Affected by the excess secondary air, the solid-gas ratio of the preheatingsystem at production line A is only 1.21, and the effect of heat transfer between the gas and solid ispoor where the temperature of the exhaust gas from the preheating system unit is as high as 323.6 ◦C.Therefore, a large amount of heat is taken away with the flue gas, resulting in low thermal efficiency ofthe Preheating unit.
Based on the premise of maintaining the existing process route and main equipment, measuressuch as properly increasing the calcination temperature in the calciner or increasing the proportionof calciner coal and tertiary air can be taken to improve the decomposition rate of preheated mealin the kiln. At the same time, excess air coefficient of secondary air should be properly reduced to

Energies 2020, 13, 5257 14 of 16
reduce the sensible heat taken away by the high temperature flue gas discharged from the D&C unit.Furthermore, with decreased excess air coefficients, the solid-gas ratio of the Preheating unit can beslightly increased to improve the heat transfer between the gas and solid and thus, ϕP would beincreased. Since both ϕDC and ϕP would increase, the thermal efficiency of the whole kiln system ofproduction line A can be improved.
5.3. Calculation of Thermal Efficiency After Optimization
The main parameters of production line A after optimization are shown in Table 4 (parametersafter optimization) and the thermal efficiency is also calculated as shown in Table 6.
Table 6. Thermal efficiency of one 5000 MT/D production line after optimization.
Item Units R&SUnit
PreheatingUnit
D&CUnit
CoolingUnit
C&AUnit
WholeSystem
Ein kJ/kg·cl 642.51 2090.87 5727.65 1662.86 435.83 3252.41Total effective heat kJ/kg·cl 152.46 1373.50 1757.74 1585.01 79.10 2036.73
ϕi % 23.73 65.69 30.69 95.32 18.15 62.62
As seen in Tables 5 and 6, the ϕQY of production line A increased from 61.70% to 62.62%after parameter optimization. Measurements also confirmed that its clinker output increased from5799 MT/D to 5968 MT/D, whereas the heat consumption of clinker was reduced from 3286.98 kJ/kg·cl to3252.41 kJ/kg·cl; all of which shows that the thermal efficiency model plays a positive role in improvingthe thermal efficiency of the cement production line.
5.4. Summary of Thermal Efficiency Application
The thermal efficiency of one 5000 MT/D production line was analyzed using the whole systemthermal efficiency model. The model found out that the main reason for the low thermal efficiencyϕQY lies in its low ϕDC and ϕP. ϕDC was improved by increasing the decomposition of preheatedmeal into the kiln, while ϕP was increased by reducing the excess air coefficient of secondary air asdiagnosed by the model. The values of ϕDC and ϕP in the production line increased from 30.03% and64.61% to 30.69% and 65.69%, respectively; as a result, ϕQY increased from 61.70% to 62.55%, and theclinker output and heat consumption of clinker were slightly optimized.
6. Conclusions
A thermal efficiency model of the whole clinker calcination system was established by mass/heatbalance analysis of its subunits, and its application was carried out on one 5000 MT/D production linein this paper. The following conclusions were obtained:
1. The thermal efficiency of the whole system (ϕQY) is linearly correlated with the thermal efficienciesof its subunits. Increases in the thermal efficiency of each subunit lead to increases in ϕQY.
2. The thermal efficiency of the D&C subunit, ϕDC, provided more influence than other subunitson the whole system. It was found that a 1% increase in ϕDC led to a 1.73% increase in ϕQY,followed by the Preheating unit and Cooling unit, where a 1% increase in ϕP and ϕC ledto increases in ϕQY of 0.59% and 0.52%, respectively; ϕRS and ϕCA had the lightest impacton ϕQY where 1% increases in ϕP and ϕCA might only lead to increases of 0.17% and 0.15%in ϕQY, respectively.
3. Thermal efficiency of the whole system ( ϕQY) of one 5000 MT/D production line was 61.70% ascalculated, which was 2.35% lower than the representative line. Application of the model revealedthat this was due to low ϕDC and ϕP values derived from the low decomposition rates of calciumcarbonate in the preheated meal in the kiln and the high excess air coefficient of secondary air.

Energies 2020, 13, 5257 15 of 16
4. After control parameter optimization based on the model, ϕDC and ϕP values of the productionline increased from 30.03% and 64.61% to 30.69% and 65.69%, respectively, and as a result, theϕQY
increased from 61.70% to 62.55% and the clinker output and heat consumption of clinker wereslightly optimized at the same time.
Author Contributions: Conceptualization, Y.C. and S.D.; methodology, Y.Y. and S.D.; data curation, Y.Y.;writing—original draft preparation, Y.Y.; writing—reviewing and editing, Y.C. and S.D.; scope and plot in draft,Y.Y.; writing—revising, S.D. All authors have read and agreed to the published version of the manuscript.
Funding: This research was funded by NATIONAL KEY R&D PROGRAM OF CHINA, grant number2016YFB0303402.
Conflicts of Interest: The authors declare no conflict of interest.
Nomenclature
Symbol Content UnitA1 Volume of flue gas at preheater outlet per kg clinker Nm3
A2 Volume of exhaust gas at R&SP outlet per kg clinker Nm3
C1 Specific heat of flue gas at preheater outlet kJ·(kg K)C2 Specific heat of fly ash at preheater outlet kJ·(kg K)−1
C3 Specific heat of exhaust gas at R&SP outlet kJ·(kg K)−1
C4 Specific heat of raw materials at raw mill outlet kJ·(kg K)−1
C5 Specific heat of water vapor at SP inlet kJ·(kg K)−1
C6 Specific heat of water vapor at SP outlet kJ·(kg K)−1
M1 Fly ash at preheater outlet per kg clinker kgM2 Raw materials at raw mill outlet per kg clinker kgM3 Water in raw materials at raw mill outlet per kg clinker kgM4 Water vapor of SP boil per kg clinker kgM5 Magnesium carbonate contained in raw materials to preheating unit per kg clinker kgM6 Calcium carbonate contained in raw materials per kg clinker kgT0 Ambient temperature ◦CT1 Temperature of flue gas at preheater outlet ◦CT2 Temperature of fly ash at preheater outlet ◦CT3 Temperature of exhaust gas at R&SP outlet ◦CT4 Temperature of raw materials at raw mill outlet ◦CT5 Temperature of R&SP surface ◦CT6 Temperature of water vapor at SP inlet ◦CT7 Temperature of water vapor at SP outlet ◦Cξ1 Heat transfer coefficient of R&SP surface kJ·(m2
·K)−1
S1 Superficial area of R&SP surface m2
References
1. Bildirici, M.E. Cement production, environmental pollution, and economic growth: Evidence from Chinaand USA. Clean Technol. Environ. Policy 2019, 21, 783–793. [CrossRef]
2. Wei, J.; Cen, K. Empirical assessing cement CO2 emissions based on China’s economic and social developmentduring 2001–2030. Sci. Total Environ. 2019, 653, 200–211. [CrossRef] [PubMed]
3. Andrew, R.M. Global CO2 emissions from cement production, 1928–2017. Earth Syst. Sci. Data 2018, 10,2213–2239. [CrossRef]
4. Breidenbach, J. The new kiln line 6 at the Exshaw cement plant in Canada. Cem. Int. 2017, 6, 28–33.5. Ma, J.M.; Peng, X.P.; Di, D.R.; Zhao, L.; Chen, C.H.; Li, B.; Wang, W. Research and Application of the Cement
Low-energy Consumption Burning Technology. Cem. Technol. 2019, 3, 21–28.6. Assawamartbunlue, K.; Surawattanawan, P.; Wanwiwa, L. Specific energy consumption of cement in
Thailand. Energy Procedia 2019, 156, 212–216. [CrossRef]7. Wang, J.F.; Dai, Y.P.; Gao, L. Energy analyses and parametric optimizations for different cogeneration power
plants in cement industry. Appl. Energy 2009, 86, 941–948. [CrossRef]

Energies 2020, 13, 5257 16 of 16
8. Rasul, M.G.; Widianto, W.; Mohanty, B. Assessment of the thermal performance and energy conservationopportunities in a cement industry in Indonesia. Appl. Therm. Eng. 2005, 25, 2950–2965. [CrossRef]
9. Su, T.L.; Chan, D.Y.L.; Hung, C.Y.; Hong, G.B. The status of energy conservation in Taiwan’s cement industry.Energy Policy 2013, 60, 481–486. [CrossRef]
10. Nazari, M.A.; Aslani, A.; Ghasempour, R. Analysis of solar farm site selection based on TOPSIS Approach.Int. J. Soc. Ecol. Sustain. 2018, 9, 12–25. [CrossRef]
11. Zhou, C.Y.; Wang, Y.Q.; Jin, Q.Y.; Chen, Q.J.; Zhou, Y.G. Mechanism analysis on the pulverized coalcombustion flame stability and NOx emission in a swirl burner with deep air staging. J. Energy Inst. 2019, 92,298–310. [CrossRef]
12. Ma, L.; Fang, Q.Y.; Yin, C.G.; Wang, H.J.; Zhang, C.; Chen, G. A novel corner-fired boiler system of improvedefficiency and coal flexibility and reduced NOx emissions. Appl. Energy 2019, 238, 453–465. [CrossRef]
13. Li, Q.; Xu, D.L.; Chen, Y.X.; Yao, Y.F.; Sun, Z.; Ding, S.X. Decomposition of ammonium sulfate residue in ahigh solid/gas ratio suspension state with an industrial-scale reactor system (production line). Particuology2015, 22, 107–113. [CrossRef]
14. Du, Y.; Wu, X.L.; Tian, Q.; Meng, F.H.; Ren, H.P. Design and application of intelligence coordination controlsystem for complicated industrial process. J. Hebei Univ. Sci. Technol. 2005, 26, 146–149.
15. Zhang, Y.L.; Wang, X.H.; Yu, H.L. Design of The Intelligent Control System of Cement Calciner. J. Univ. JinanSci. Technol. 2014, 2, 97–100.
16. Gang, X.; Fan, Y.; Keming, X. The Temperature Control of Cement Decomposing Furnace Based on ImmuneNeural Network. J. Taiyuan Univ. Technol. 2007, 38, 287–289.
17. Jarvensivu, M.; Saari, K.; Jounela, S.L.J. Intelligent Control System of an Industrial Lime Kiln Process.Control. Eng. Pract. 2001, 9, 589–606. [CrossRef]
18. Wang, X.H.; Fang, X.M.; Yu, H.L. Recognition of Working Condition for Rotary Kiln Hood Based on ExpertSystem. Control. Eng. China 2010, 5, 309–312.
19. Chen, H.K.; Liu, H.Y.; Liu, D.P. Optimal Design of Rotary Kiln Control System Based on DCS. J. QiluUniv. Technol. 2018, 32, 54–60.
20. Pramathes, D.; Chandrani, D. Distributed control system in cement industry. J. Mines Metals Fuels 2013, 61,302–305.
21. Siwen, W.; Xiaodong, D.; Juju, H. Design of the control system of the new dry process cement productionline. J. Xinyu Coll. 2009, 14, 94–96.
22. Tahsin, E.; Vedat, A. Energy auditing and recovery for dry type cement rotary kiln systems-a case study.Energy Convers. Manag. 2005, 46, 551–562.
23. Liu, Z.; Wang, Z. Thermal efficiency modeling of the cement clinker manufacturing process. J. Energy Inst.2015, 88, 76–86. [CrossRef]
24. Delong, X. Theory and Practice of Cement Suspension Pre-Decomposition Technology; Scientific & TechnicalDocuments Publishing House: Beijing, China, 2002; ISBN 7-5023-4272-9.
© 2020 by the authors. Licensee MDPI, Basel, Switzerland. This article is an open accessarticle distributed under the terms and conditions of the Creative Commons Attribution(CC BY) license (http://creativecommons.org/licenses/by/4.0/).