modeling of short time dilatometry testing of high carbon
TRANSCRIPT

Robert Goldstein, Fluxtrol, Inc. [email protected] Ethan Buchner, Robert Cryderman Colorado School of Mines, Golden, Colorado
Modeling of Short Time Dilatometry Testing of High Carbon Steels

Overview• EffectofShortTimeHeatTreatmentonTransforma6onPhenomena• TestResultsThatLedtotheStudy
• DilatometerDescrip6on• ModelingDilatometerPerformance• ComparisonBetweenSimula6onandExperiments
• Conclusions/FutureResearch

Effect of Short Time Heat Treatment on Transformation Temperature
Superior Performance of Components Has Been Achieved in Many Cases Using Non-Equilibrium Thermal Processes (NETP), but There Is Very Little Quantitative Data Available on Material Response to Rapid Thermal Processing

Recent Findings at ASPPRC of Improved Mechanical Properties with NETP
Up to 3X better properties demonstrated using appropriate alloying elements and relatively short, low temperature heat treatment

Dilatometer Testing of the Steel for Materials Characterization
Effect of Reduced Pre-Transformation Expansion with Increasing Cooling Rate called Temperature Gradient Effect and Led to Impression There Was Non-Uniform Temperature in the Sample Cooling Rates: ! He: 235 ˚C/s ! N: 91 ˚C/s ! Ar: 52 ˚C/s

Dilatometer Description • Measures dimensional movement
during thermal procession • Heating is in a vacuum • Heat source is induction heating
• Advertised heating rate up to 1000 C/s
• Gas quenching through induction coil used for cooling
• Fused silica rods hold the component
• Manufacturer TA Instruments
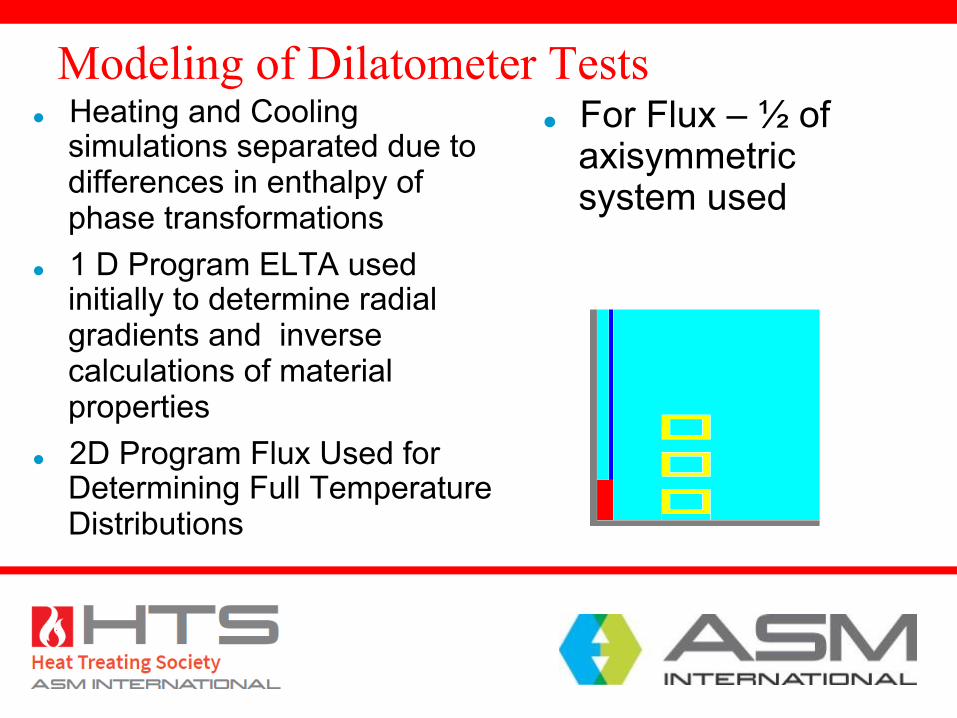
Modeling of Dilatometer Tests ● Heating and Cooling
simulations separated due to differences in enthalpy of phase transformations
● 1 D Program ELTA used initially to determine radial gradients and inverse calculations of material properties
● 2D Program Flux Used for Determining Full Temperature Distributions
● For Flux – ½ of axisymmetric system used

Comparison of ELTA with Experimental Data
● Surface Temperature tracks closely
● Dynamics of power change very similar
● Big discrepancy in power level, measured substantially higher than calculated

Radial Temperature Gradients for Different Heating Rates with Helium Quench
-100 -90 -80 -70 -60 -50 -40 -30 -20 -10
0 10 20 30 40 50 60 70 80 90
100
0 5 10 15 20 25 30 35 40
Tem
pera
ture
(C)
Time (s)
Radial Temperature Differential
Delta T 50 Cps 850 C 10 s
Delta T 100 Cps 850 C 10s
Delta T 250 Cps 850 C 10 s
Delta T 500 Cps 850 C 10s
For 50 CPS, radial gradients much larger during cooling than heating. As heating rate increases, gradients during initial heating approach those from the rapid cooling. After Curie Point, radial temperature difference close to 0 for all samples during heating and holding phase

2D Modeling with Flux ● Axial Gradients are
Larger than Radial Gradients on Heating According to Models
● Axial Gradients Also Exist on Cooling, with ends being colder than center for uniform heat transfer coefficient on surface

3 TC Testing and Comparison to Models Heating Experiments Models

3 TC Testing Cooling Comparison Experimental End to End
Experimental Cool End to Models
Axial Variation in Temperature is High, End to End Cooling Different, Initial Inversion Relative to Models Means We Have Significant HTC Variation in Length and Time!
Cool End
Hot End
Initial Inversion of Gradient Compared to Models
Excellent Agreement During Heating

Image During Cooling
Cool End Hot End

Conclusions ● Models have been created to determine temperature
distributions which occur during dilatometer testing ● Once the steel started transforming from magnetic to non-
magnetic, the generator power level rises dramatically, limiting the ability to deliver high heating rates
◗ Need to understand better as there is a significant variance from calculated power levels and need to determine how to increase power delivery
● For rapid heating and cooling rates, there are significant gradients (both axial and radial) in the part which need to be considered when evaluating dimensional movement data
● More work still needs to be done to better characterize/improve the cooling dynamics in the system