modeling of propagation losses in common residential...
TRANSCRIPT

Interaction Notes
Note 624
15 August 2013
Modeling of Propagation Losses in Common Residential and
Commercial Building Walls
Dr. D. V. Giri
Pro-Tech, 11-C Orchard Court, Alamo, CA 94507-1541
Dept. of ECE, University of New Mexico, Albuquerque, NM
Tel: 1 (925) 552-0510 E-mail: [email protected] URL: [email protected]
and
Dr. F. M. Tesche
1519 Miller Mountain Road Saluda, NC 28773
Abstract: This note reviews the wave propagation and attenuation through exterior walls
of common United States residential and commercial buildings. Some of the past
analyses and measured data from previously tested construction materials are also
included.
2
1. Introduction
The construction of external walls in a building or other facility is usually
determined by the structural and architectural needs. Many different building materials
may be used, and their electrical characteristics ,, might be unknown making it
difficult to predict the reflection coefficient , the transmission coefficient and the
complex propagation constant where,
j
jj ro
(1)
and and are the real and imaginary parts of the complex propagation constant [1].
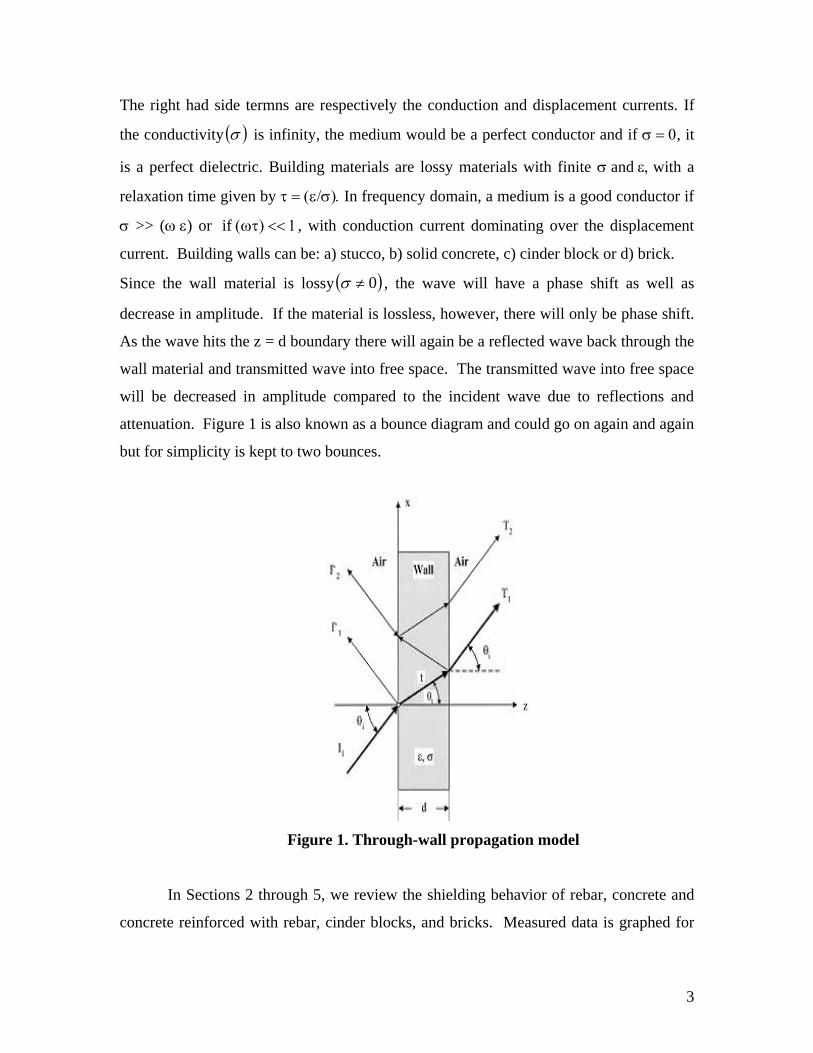
The propagation model of electromagnetic-wave travel through a wall with free space on
either side (figure 1) assumes the configuration and construction materials are known in
detail. Present day propagation software [2-5] can allow the user to define the
electromagnetic wall parameters of a complex structure to determine the reflection and
transmission coefficients [6]. In figure 1 a single uniform plane wave arrives at the
boundary between the air and wall. Using the boundary connection super matrix (BCS)
detailed in [7 and 8], a complex wall consisting of many different materials can be
analyzed by a simple multiplication of the appropriate matrices representing each layer.
At the boundary z=0 the uniform plane wave gives rise to one transmitted wave and one
reflected uniform plane wave. As the transmitted wave travels through the wall it will
attenuate by a factor of .ze One of the Maxwell’s curl equations states
t
EE
t
DJHX
(2)
In frequency domain the above equation can be written as
EjEHX~~~
(3)
3
The right had side termns are respectively the conduction and displacement currents. If
the conductivity is infinity, the medium would be a perfect conductor and if , it
is a perfect dielectric. Building materials are lossy materials with finite andwith a
relaxation time given by In frequency domain, a medium is a good conductor if
>> () or if, with conduction current dominating over the displacement
current. Building walls can be: a) stucco, b) solid concrete, c) cinder block or d) brick.
Since the wall material is lossy 0 , the wave will have a phase shift as well as
decrease in amplitude. If the material is lossless, however, there will only be phase shift.
As the wave hits the z = d boundary there will again be a reflected wave back through the
wall material and transmitted wave into free space. The transmitted wave into free space
will be decreased in amplitude compared to the incident wave due to reflections and
attenuation. Figure 1 is also known as a bounce diagram and could go on again and again
but for simplicity is kept to two bounces.
Figure 1. Through-wall propagation model
In Sections 2 through 5, we review the shielding behavior of rebar, concrete and
concrete reinforced with rebar, cinder blocks, and bricks. Measured data is graphed for

4
each construction material to show how EM fields attenuate as they propagate through
each material. In the later Sections of 6 and 7, the most common U.S. residential and
commercial buildings exterior wall configurations are explained. The empirical data
from Sections 2 through 5 is used to describe how common residential and commercial
buildings in the United States might attenuate waves from outdoor-to-indoor propagation.
2. Rebar Enforced Structures
Two different rebar meshes were tested [9] for how EM waves attenuate as they
pass through. These cases have been identified as RE1 and RE2 as shown in figure 2.
The dimensions of each shield are shown below and the wire diameter mmrd ww 192 .
A good electrical contact at the joints of the rebar was maintained.
Figure 2. Rebar structures RE1 and RE2 respectively
Two bands of frequency were tested to study the propagation of electric fields.
The low frequency band ran from 0.5 to 2 GHz and the high frequency band from 3 to 8
GHz. The results are shown below in figures 3 and 4.

5
Figure 3. Plots of the measured E-field transmission coefficients for RE1 and RE2 in
the low frequency band of 0.5 to 2 GHz.
Figure 4. Plots of the measured E-field transmission coefficients for RE1 and RE2 in
the high frequency band of 3 to 8 GHz.
6
It is easily observed that, at low frequencies the rebar mesh looks like a thin plate
of lossy material. This causes the EM wave to attenuate (via reflection) as it passes
through. However, at higher frequencies, the incident wave has a smaller wavelength and
thus the incident EM field sees larger spacing in the rebar mesh and is able to penetrate
more. Also noted about this experiment is the rebar with greater coverage (RE2) has
lower transmission compared with the RE1 data. This shows that the mesh with more
conducting material acts as a better shield.
3. Concrete and Concrete/Rebar Structures
In [9] three different concrete wall slabs were tested for various transmission
properties. The concrete used had an approximate water cement ratio of 0.36, a slump of
165 mm (“high”), a nominal maximum crushed aggregate size of 25.4 mm (“large”), a
cement content (by weight) of 14%, and an average density of 2.38 g/cc. For this mixture
three different thicknesses were considered: sample C84 with a thickness of 102 mm,
sample C88 with a thickness of 203 mm, and sample C812 with a thickness of 305 mm.
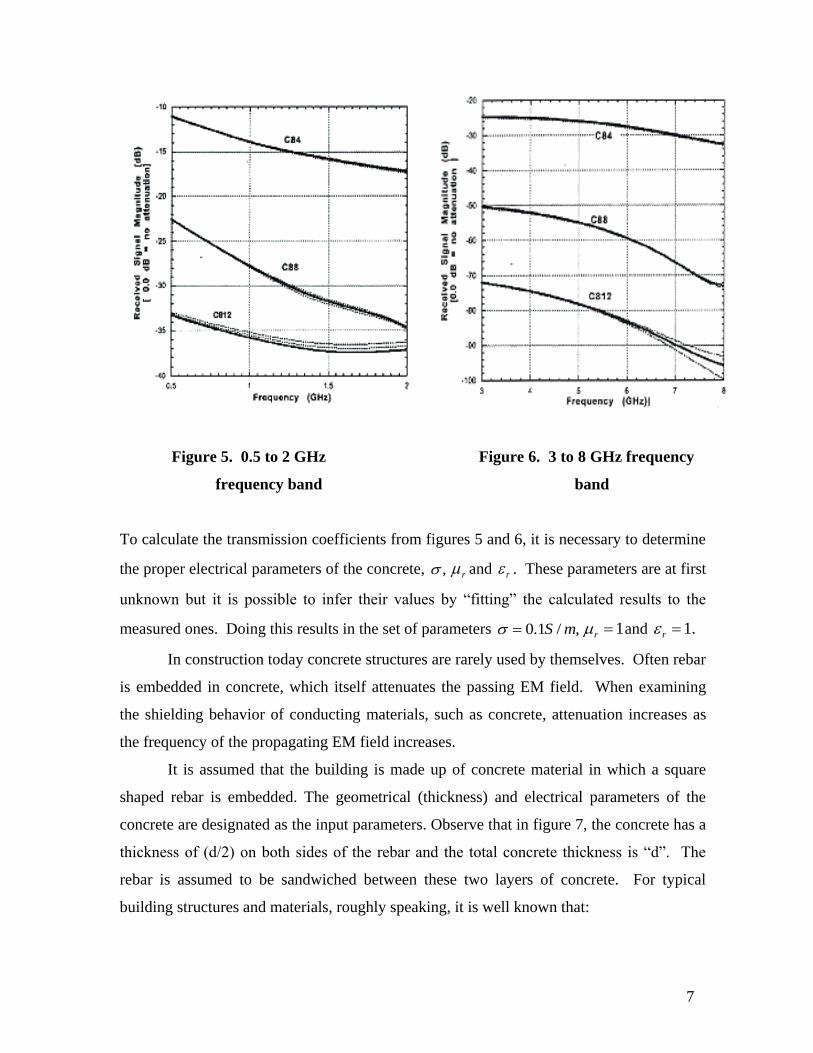
The E-field coefficient (in dB) for the three different thicknesses of a concrete only slab
in the frequency range of 0.5 to 2 GHz is graphed in figure 5 and for a frequency range of
3 to 8 GHz is graphed in figure 6.
7
Figure 5. 0.5 to 2 GHz
frequency band
Figure 6. 3 to 8 GHz frequency
band
To calculate the transmission coefficients from figures 5 and 6, it is necessary to determine
the proper electrical parameters of the concrete, , r and r . These parameters are at first
unknown but it is possible to infer their values by “fitting” the calculated results to the
measured ones. Doing this results in the set of parameters ,/1.0 mS 1r and .1r
In construction today concrete structures are rarely used by themselves. Often rebar
is embedded in concrete, which itself attenuates the passing EM field. When examining
the shielding behavior of conducting materials, such as concrete, attenuation increases as
the frequency of the propagating EM field increases.
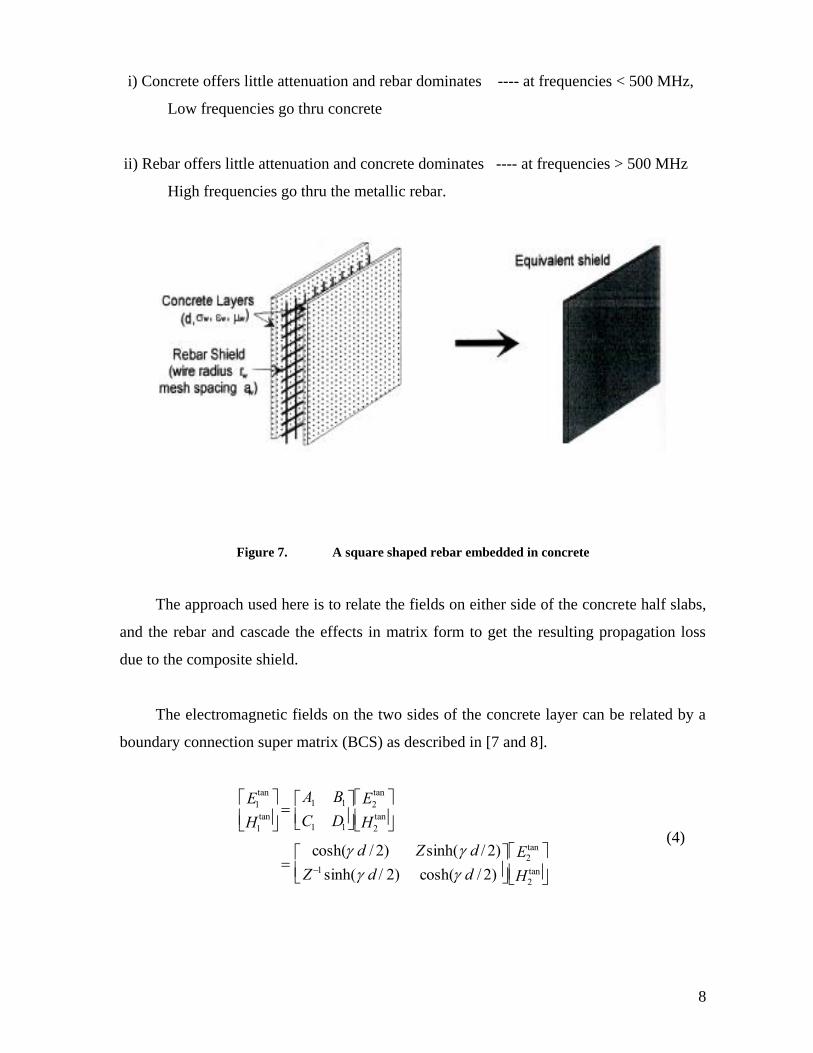
It is assumed that the building is made up of concrete material in which a square
shaped rebar is embedded. The geometrical (thickness) and electrical parameters of the
concrete are designated as the input parameters. Observe that in figure 7, the concrete has a
thickness of (d/2) on both sides of the rebar and the total concrete thickness is “d”. The
rebar is assumed to be sandwiched between these two layers of concrete. For typical
building structures and materials, roughly speaking, it is well known that:
8
i) Concrete offers little attenuation and rebar dominates ---- at frequencies < 500 MHz,
Low frequencies go thru concrete
ii) Rebar offers little attenuation and concrete dominates ---- at frequencies > 500 MHz
High frequencies go thru the metallic rebar.
Figure 7. A square shaped rebar embedded in concrete
The approach used here is to relate the fields on either side of the concrete half slabs,
and the rebar and cascade the effects in matrix form to get the resulting propagation loss
due to the composite shield.
The electromagnetic fields on the two sides of the concrete layer can be related by a
boundary connection super matrix (BCS) as described in [7 and 8].
E1tan
H1tan
A1 B1
C1 D1
E2tan
H2tan
cosh( d / 2) Zsinh( d / 2)
Z 1 sinh( d / 2) cosh( d / 2)
E2tan
H2tan
(4)

9
where the term is the complex wave propagation constant in the concrete, given by
)()( ffjj www (5)
and Z is the wave impedance in concrete:
)()( ffj
jZ
ww
w
. (6)
In considering the concrete material, it is important to include the frequency
dependence of the conductivity and dielectric constant, in order to get accurate results at
higher frequencies. For the frequency dependent model, we have elected to use the causal
fit to the parametric variations with frequency in accordance with the Debye model [10].
In this context, the frequency variation is given as
o
w
2)( (7)
and
oow 2)( . (8)
In these expressions, o is the dc conductivity, and is the high frequency
permittivity, which is related to the permittivity of free space by the relative permittivity
, as o . Note that if the two scalar quantities o and o are known, the
frequency dependence of the concrete parameters is fully characterized.
With regards to the rebar, Casey [11] has developed a theory for mesh shields
characterized by equivalent impedance, of the form
sss LjRZ , (9)
10
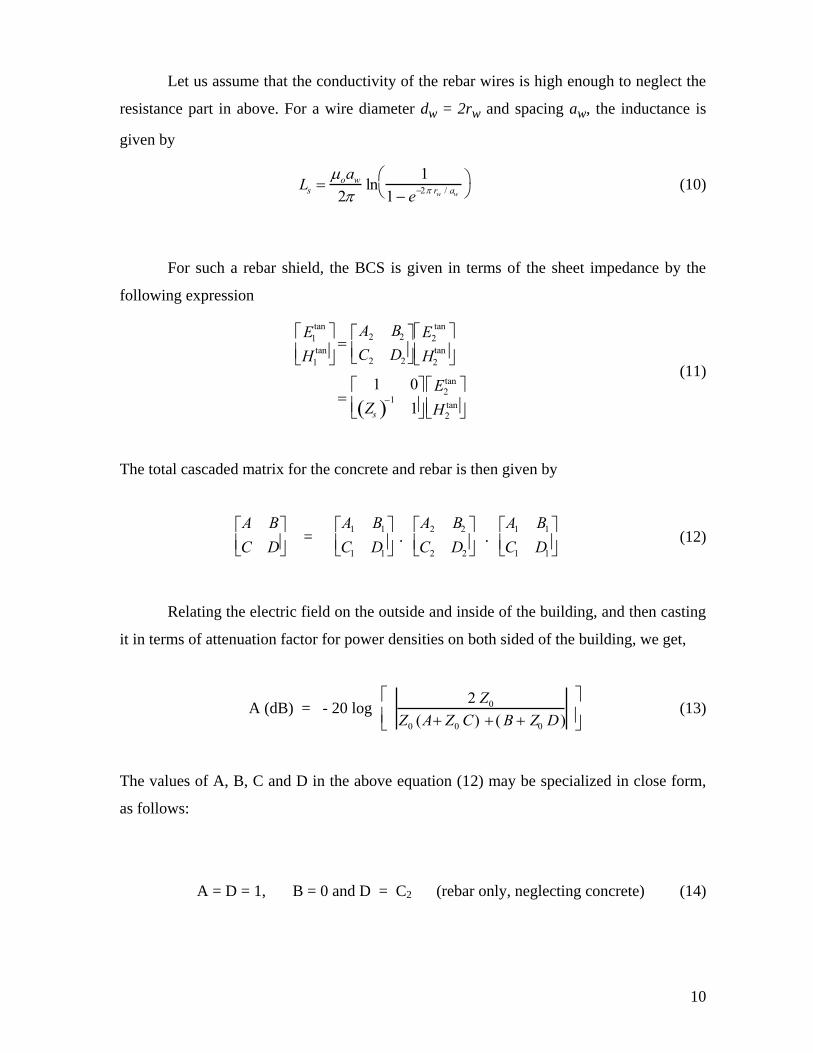
Let us assume that the conductivity of the rebar wires is high enough to neglect the
resistance part in above. For a wire diameter dw = 2rw and spacing aw, the inductance is
given by
Ls oaw2
ln1
1 e2 rw / aw
(10)
For such a rebar shield, the BCS is given in terms of the sheet impedance by the
following expression
E1tan
H1tan
A2 B2
C2 D2
E2tan
H2tan
1 0
Zs 1
1
E2tan
H2tan
(11)
The total cascaded matrix for the concrete and rebar is then given by
A B
C D
=
A1 B1
C1 D1
.
A2 B2
C2 D2
.
A1 B1
C1 D1
(12)
Relating the electric field on the outside and inside of the building, and then casting
it in terms of attenuation factor for power densities on both sided of the building, we get,
A (dB) = - 20 log 2 Z0
Z0 (A Z0C) (B Z0 D)
(13)
The values of A, B, C and D in the above equation (12) may be specialized in close form,
as follows:
A = D = 1, B = 0 and D = C2 (rebar only, neglecting concrete) (14)
11
)2/cosh()2/sinh(
)2/sinh()2/cosh(1 dDdZC
dZBdA
(concrete only, neglecting rebar) (15)
For the composite case of concrete and rebar, one needs to use equations (12) and (13).
Concrete is known to have an electrical conductivity that depends both on
frequency and water content. Reference [12], states that the electrical conductivity of
concrete typically varies within the range of 0.001 to 0.01 S/m, and the relative dielectric
constant ranges from 5 to 10, depending on the water content.
To illustrate the effect of this variation on the attenuation of RF signals through a
slab of reinforced concrete, Carron [13] plot the RF attenuation through a 20 cm thick
concrete slab having a rebar structure with 20 cm spacing and a wire diameter of ¼ inch
(0.635 cm). Considering only the case of normal incidence on the slab, figure 8 from [13]
illustrates the reported variation of the attenuation as a function of frequency for different
water contents. In this reference, it is not clear what the basis of water content is? –
whether by weight of by volume.
Another useful piece of information on the conductivity of concrete has been
provided by Flanagan [12], who has measured the conductivity of concrete as a function of
water content. In this study, a transient EM field was applied to a concrete sample, and the
conductivity was inferred from an examination of the transmitted field through the sample.
The reported conductivity of the concrete is shown in Figure 9, and the values are similar to
those suggested in [12].

12
Figure 8. Reported transmission of a 20 cm thick concrete slab containing rebar with 20
cm spacing and wire diameter d = 0.635 cm (1/4 in) for normal incidence, shown as a function
of frequency for 4 different water percentages (reproduced from [13])
water content (% by weight)
Figure 9. Plot of the electrical conductivity of concrete, shown as a function
of water content (% by weight), as reported in [12]
0.01 0.1 1.0 10.0
(S/m)
10-5
10-4
10-3
10-2

13
Using the above described model, a series of calculations were performed to try to
infer the proper frequency-dependent, electrical parameters of the concrete slab used for the
data in Figure 7. In doing this, the analytical model (the present BCS model) was run for
various values of conductivity, and the “best” fit for particular water content was selected.
In this study, it was found that the dependence on the relative permittivity was relatively
weak compared with the dependence on conductivity.
For an assumed permittivity of = 5, Figure 10 plots the family of curves that best
replicate the data of Figure 8 for the reported water contents of 1%, 10%, 30% and 100%.
For these curves, conductivities of = 0.003, 0.01, 0.02 and 0.05 S/m, respectively, were
found to provide reasonable fits. Note that these values of conductivities are reasonably
consistent with the measured conductivities reported by Flanagan [12] (see figure 9).
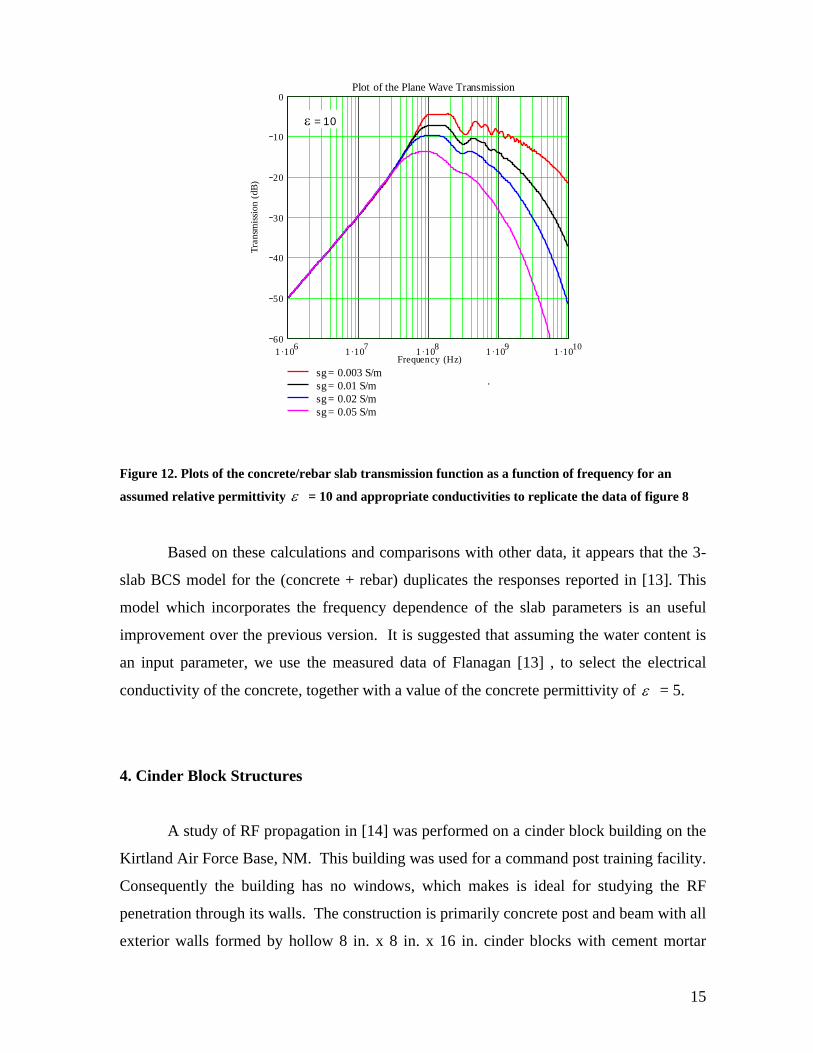
Similar plots for = 7.5 and 10 are shown in figures 11 and figure 12, with only a
minor change in the transmission function as is varied.
Note that all of these curves provide reasonable fits to figure 8. There are minor
differences between the present model and the curves in figure 8 at the high frequencies (>
2 GHz), which may be attributed to differences in the assumed frequency dependence of
the material parameters in [12]. These differences, however, are not very important in a
practical sense, since the attenuation is so high at these frequencies.

14
Figure 10.Plots of the concrete/rebar slab transmission function as a function of frequency for an
assumed relative permittivity = 5 and appropriate conductivities to replicate the data of figure 8
Figure 11.Plots of the concrete/rebar slab transmission function as a function of frequency for an
assumed relative permittivity = 7.5 and appropriate conductivities to replicate the data of Figure 8
1 106
1 107
1 108
1 109
1 1010
60
50
40
30
20
10
0
sg = 0.003 S/m
sg = 0.01 S/m
sg = 0.02 S/m
sg = 0.05 S/m
Plot of the Plane Wave Transmission
Frequency (Hz)
Tra
nsm
issi
on (
dB
)
.
= 5
.
1 106
1 107
1 108
1 109
1 1010
60
50
40
30
20
10
0
sg = 0.003 S/m
sg = 0.01 S/m
sg = 0.02 S/m
sg = 0.05 S/m
Plot of the Plane Wave Transmission
Frequency (Hz)
Tra
nsm
issi
on (
dB
)
.
=7.5
.
15
Figure 12. Plots of the concrete/rebar slab transmission function as a function of frequency for an
assumed relative permittivity = 10 and appropriate conductivities to replicate the data of figure 8
Based on these calculations and comparisons with other data, it appears that the 3-
slab BCS model for the (concrete + rebar) duplicates the responses reported in [13]. This
model which incorporates the frequency dependence of the slab parameters is an useful
improvement over the previous version. It is suggested that assuming the water content is
an input parameter, we use the measured data of Flanagan [13] , to select the electrical
conductivity of the concrete, together with a value of the concrete permittivity of = 5.
4. Cinder Block Structures
A study of RF propagation in [14] was performed on a cinder block building on the
Kirtland Air Force Base, NM. This building was used for a command post training facility.
Consequently the building has no windows, which makes is ideal for studying the RF
penetration through its walls. The construction is primarily concrete post and beam with all
exterior walls formed by hollow 8 in. x 8 in. x 16 in. cinder blocks with cement mortar
1 106
1 107
1 108
1 109
1 1010
60
50
40
30
20
10
0
sg = 0.003 S/m
sg = 0.01 S/m
sg = 0.02 S/m
sg = 0.05 S/m
Plot of the Plane Wave Transmission
Frequency (Hz)
Tra
nsm
issi
on (
dB
)
.
= 10
.
16
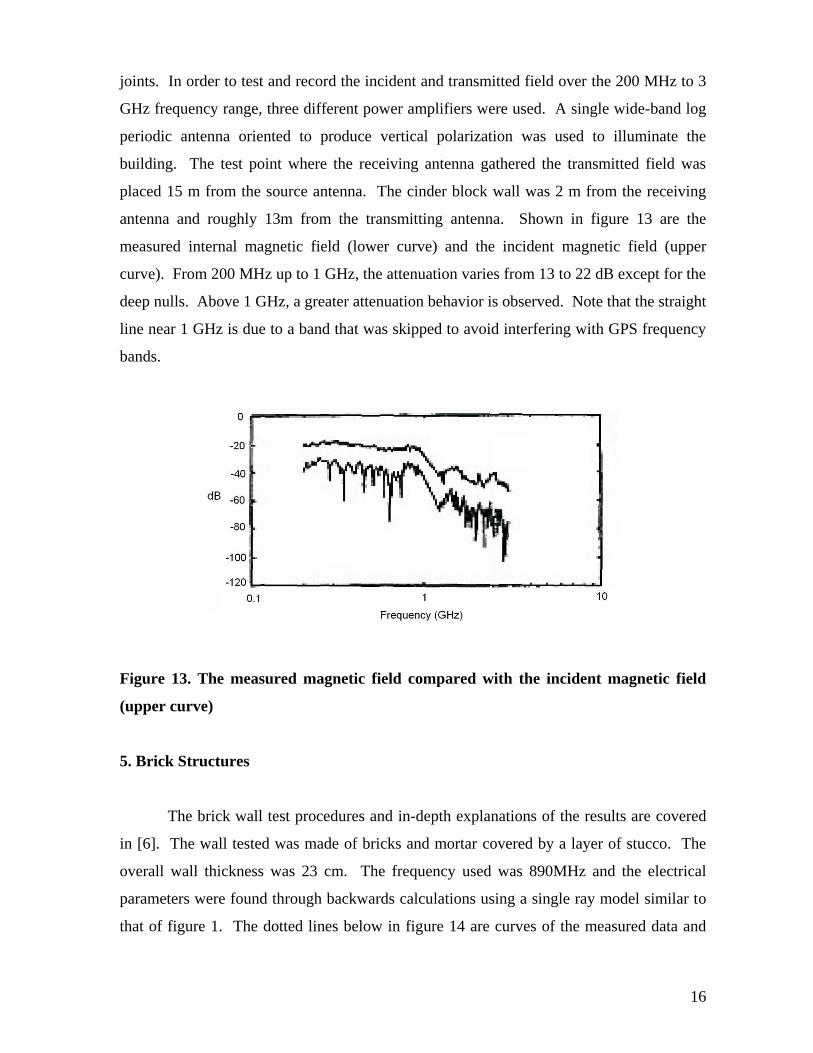
joints. In order to test and record the incident and transmitted field over the 200 MHz to 3
GHz frequency range, three different power amplifiers were used. A single wide-band log
periodic antenna oriented to produce vertical polarization was used to illuminate the
building. The test point where the receiving antenna gathered the transmitted field was
placed 15 m from the source antenna. The cinder block wall was 2 m from the receiving
antenna and roughly 13m from the transmitting antenna. Shown in figure 13 are the
measured internal magnetic field (lower curve) and the incident magnetic field (upper
curve). From 200 MHz up to 1 GHz, the attenuation varies from 13 to 22 dB except for the
deep nulls. Above 1 GHz, a greater attenuation behavior is observed. Note that the straight
line near 1 GHz is due to a band that was skipped to avoid interfering with GPS frequency
bands.
Figure 13. The measured magnetic field compared with the incident magnetic field
(upper curve)
5. Brick Structures
The brick wall test procedures and in-depth explanations of the results are covered
in [6]. The wall tested was made of bricks and mortar covered by a layer of stucco. The
overall wall thickness was 23 cm. The frequency used was 890MHz and the electrical
parameters were found through backwards calculations using a single ray model similar to
that of figure 1. The dotted lines below in figure 14 are curves of the measured data and

17
the values of the permittivity and conductivity that best fit those curves are 4r and
mS /022.0 for perpendicular polarization and 4r and mS /024.0 for parallel
polarization. The attenuation at normal incidence is 5.2 and 5.6 dB for perpendicular and
parallel polarization, respectively. It was found that the wall transmission coefficient
depends much more on conductivity than on permittivity [6].
Figure 14. Received power for brick wall
6. Residential Structures
Residential buildings in the United States are made up of wood frame structures
and/or concrete structures. However, the most common type of residential housing
structure is the wood frame structure [15]. The external wooden frame is made up of
Douglas Fir 2x4 inch studs, 16 inches apart on center with a sheathing layer of 0.75 inch
plywood on the external side [16]. An example of this is shown in figure 15. On the
internal side of the 2x4 inch studs a layer of drywall is nailed up. Between that layer of
plywood and drywall is the insulation. Insulation with a rating of R-11 or R-19 is required
in newly constructed homes. In short, the higher the R value of an insulator, the greater the
material resists the movement of heat [15]. On the outside of the plywood black weather
paper is applied which prevents moisture from reaching the wood. The weather paper has
little nails protruding allowing chicken wire to be fastened for stucco work. Stucco is a
type of concrete. On houses only an inch thick layer is applied [16].

18
Figure 15. External wood frame wall with 2x4 in studs on center and 0.5 inch plywood
sheathing.
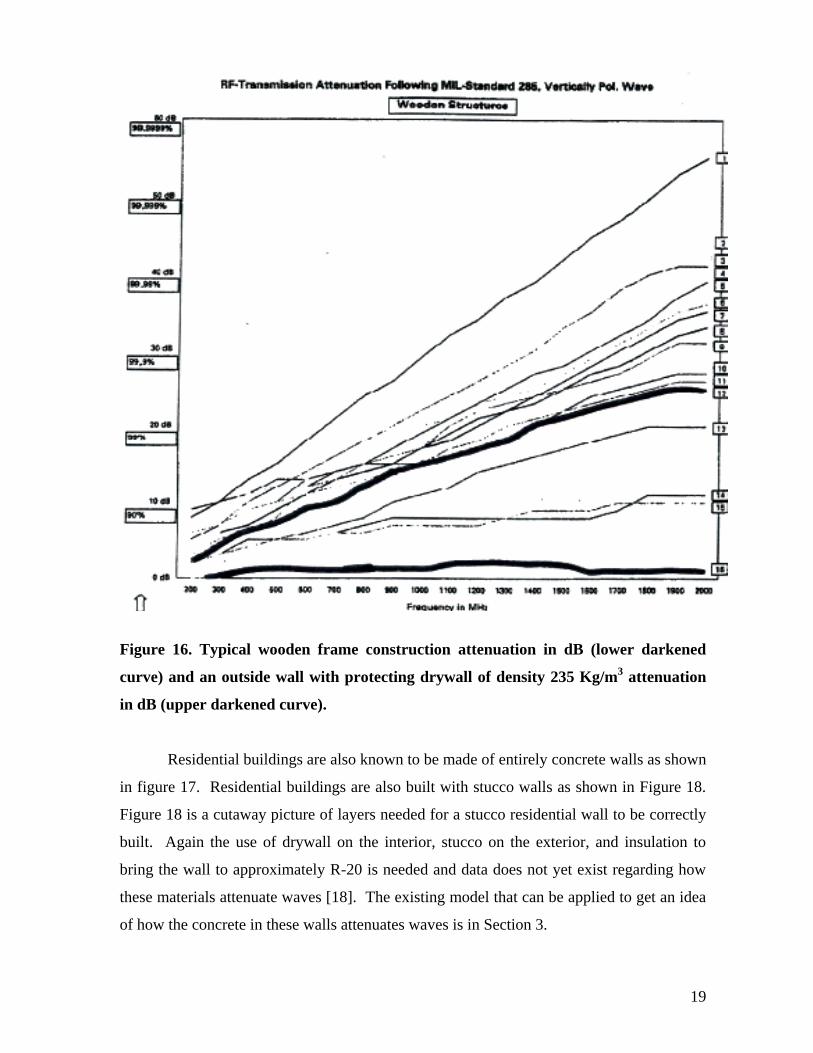
Determining the attenuation of EM fields through wood-framed residential walls is
a difficult task. There are limited resources regarding the shielding of residential walls due
to their complex structure and unknown electrical properties of the materials used. Studies
have been done to determine the attenuation of a wood frame structure by itself (figure 16,
lower darkened curve [17]) and a wooden frame with drywall mounted (figure 16, upper
darkened curve). However, these results are only for one type of drywall (density 235
kg/m3) and cannot be accepted as a general case.
The information reported in Section 3 regarding concrete only structures can give
us an idea of how the stucco on the external wall of a house will attenuate EM fields.
Using the data plotted for the C85 (101.5mm thick) concrete wall of figures 5 and 6, one
can only infer how a stucco layer an inch thick, a quarter of the thickness of the C85 slab
(101.5 mm = 4 inches), will cause shielding of EM fields.
19
Figure 16. Typical wooden frame construction attenuation in dB (lower darkened
curve) and an outside wall with protecting drywall of density 235 Kg/m3 attenuation
in dB (upper darkened curve).
Residential buildings are also known to be made of entirely concrete walls as shown
in figure 17. Residential buildings are also built with stucco walls as shown in Figure 18.
Figure 18 is a cutaway picture of layers needed for a stucco residential wall to be correctly
built. Again the use of drywall on the interior, stucco on the exterior, and insulation to
bring the wall to approximately R-20 is needed and data does not yet exist regarding how
these materials attenuate waves [18]. The existing model that can be applied to get an idea
of how the concrete in these walls attenuates waves is in Section 3.

20
Figure 17. A residential home with concrete walls.
Figure 18. Cutaway diagram of the materials needed for a residential stucco wall.
21
The insulation used with stucco typically has a moisture barrier made of Aluminum foil on
one side. The strips are not joined at the seams, but they do provide some attenuation. A
stucco building has a layer of chicken wire in it which provides some attenuation.
7. Commercial Structures
Concrete is the most common building material for commercial structures.
However, commercial buildings are still constructed with cinder blocks or the wood frame
residential structure model [19]. Cinder block walls can be hollow with or without any
rebar. Depending on the desired thickness of a concrete wall for commercial use, either a
single or double rebar mesh design is used inside the concrete wall. Walls thicker than 6
inches use the double mesh design where each rebar mesh is 1 inch inside the concrete
from the exterior surface of the wall. In the single mesh case, the rebar is sandwiched in
the middle as shown in figure 7. In both cases the rebar used is either #7 (diameter = 7/8
inch) or #8 (diameter = 1 inch) steel rebar with 20 mm spacing. These specifications are
similar to the concrete/rebar model in Section 3 therefore it is possible to accurately predict
the shielding common concrete commercial structures exhibit for outdoor to indoor wave
propagation. If dealing with a double rebar mesh concrete wall structure, incorporate the
rebar mesh only data of Section 2 into the concrete/rebar design of Section 3.
Recall that the combined effect of a concrete/rebar structure reduces the fields
penetrating through the wall. At low frequencies the rebar mesh appears to the incident
EM wave as a thin plate of lossy material that attenuates the wave as it passes through. At
higher frequencies the attenuation is dominated by the concrete because the wave sees large
gaps in the rebar mesh making it easy to penetrate through [7 and 8].
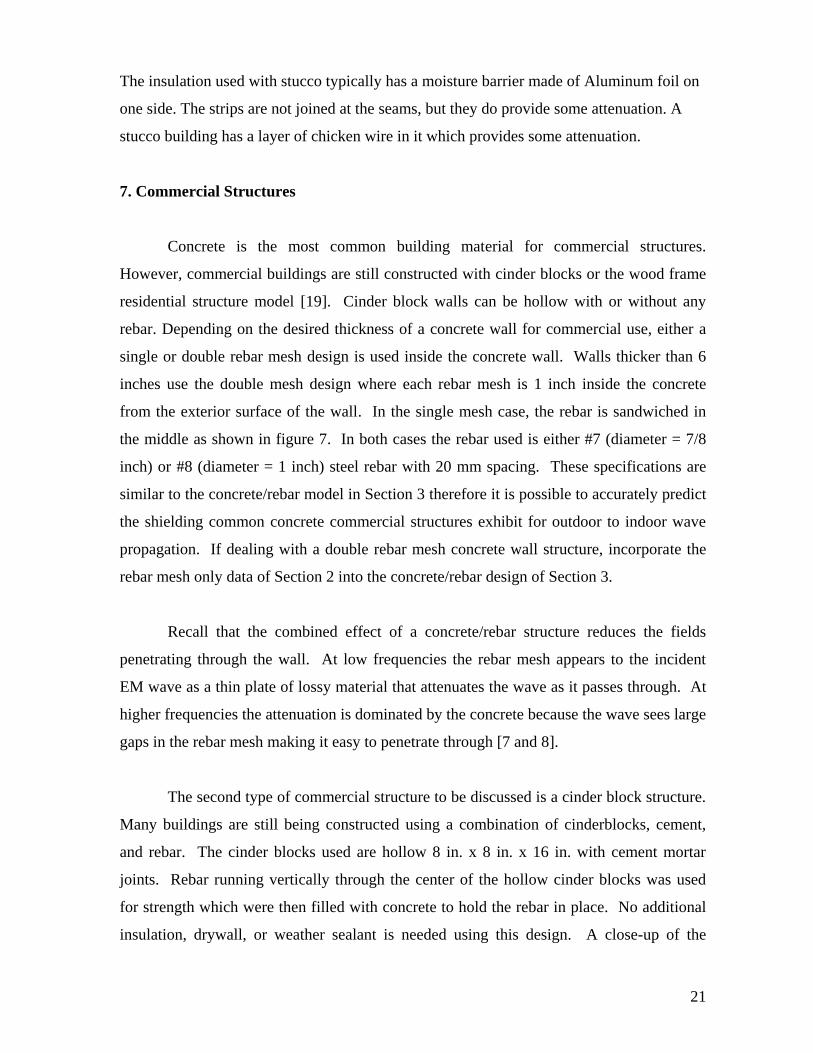
The second type of commercial structure to be discussed is a cinder block structure.
Many buildings are still being constructed using a combination of cinderblocks, cement,
and rebar. The cinder blocks used are hollow 8 in. x 8 in. x 16 in. with cement mortar
joints. Rebar running vertically through the center of the hollow cinder blocks was used
for strength which were then filled with concrete to hold the rebar in place. No additional
insulation, drywall, or weather sealant is needed using this design. A close-up of the
22
Rodeway Inn in downtown Chicago in figure 19 demonstrates the cinderblock arrangement
of the external wall with a coat of paint [20].
Figure 19. Close-up of Rodeway Inn cinder block external wall.
The modeling in Section 4 of the cinder block building at Kirtland Air Force base in
section four did not have rebar to reinforce the wall. To get an accurate idea of how
today’s common cinder block buildings shield EM waves, one must include the vertical
rebar shielding in addition to the cinder block shielding of Section 4. Only at high
frequencies can one use the cinder block only model of Section 4 without the rebar to
predict attenuation and be accurate.
8. Conclusion
There exists a limited amount of published material on outdoor-to-indoor
propagation. Propagation predictions depend primarily on often unavailable building
construction parameters and indoor building structures. The problem with the ray-based
model used today is it often encounters a large number of reflections from indoor materials
and hence is computationally inefficient.
23
Present-day software used to predict propagation models need user defined
electrical parameters of the construction material. Usually these parameters are unknown
and determined through calculations to fit the measured data. The problem is that the
reported results from the software are only applicable to a specific type of wall. In order
for a building transmission model to be of practical value, it should be a simple model to
use and only need minimal information regarding the building under study. A great deal of
time is needed to determine the electrical parameters of wall structures and only after they
are determined can the results be put into software that doesn’t account for any indoor
material reflections in the results. Lack of knowledge of diffraction coefficients for the
indoor structures is an area of study for the future if a truly accurate result for attenuation
through exterior walls is desired.
References
[1] M. Iskander , Electromagnetic Fields and Waves. New Jersey: Prentice Hall, 1992.
[2] “Propagation Models for Urban Environment.” <WTEC Hyper-Librarian>, Jul.
2000.
[3] Y.L.C. de Long, M.H.J.L. Koelen and M.H.A.J. Herben, “A Building-Transmission
Model for Improved Propagation Prediction in Urban Microcells,” IEEE
Transactions on Vehicular Technology, vol 53. pp. 490-502, Mar. 2004.
[4] T.B. Givson and D.C. Jenn, “Prediction and Measurement of Wall Insertion
Losses,” IEEE Transactions on Antennas and Propagation, vol 47. pp. 55-57, Jan.
1999.
[5] J.W. Schuster and R.J. Luebbers, “FDTD Techniques for Evaluating the Accuracy
of Ray-Tracing Propagation Models for Microcells,” IEEE Antennas and
Propagation Society International Symposium, vol 3. pp. 1676-1679, Jun. 1998.
[6] D. Pena and R. Feick, “Measurement and Modeling of Propagation Losses in Brick
and Concrete Walls for the 900-MHz Band,” IEEE Transactions on Antennas and
Propagation, vol 51. pp. 31-39, Jan. 2003.
[7] K. F. Casey, “Electromagnetic Shielding from Advanced Composite Materials”
Interaction Note 341, June 1977.
24
[8] F. M. Tesche, “Analysis Model for High Power Microwave (HPM) Penetration
through Concrete and Rebar Walls,” Dec. 2000.
[9] W. C. Stone, “Electromagnetic Signal Attenuation in Construction Materials”,
NIST Construction Automation Program Report no. 3, NISTIR 6055, Oct. 1997
[10] E. G. Farr and C. A. Frost, “Impulse Propagation Measurements of the Dielectric
Properties of Water, Dry Sand, Moist Sand and Concrete”, Measurement Note 52,
May 1997.
[11] K. F. Casey, “Electromagnetic Behavior of Wire-Mesh screens,” IEEE Transactions
EMC, Volume 30, No.3, August 1988, pp 298-311.
[12] T. M. Flanagan, and R. A. Cesena, “Radiation-Induced Conductivity in Missile Site
Materials,” Gulf Radiation Technology, Report Gulf-RT-10642, also published as
Theoretical Note 122, 7 May 1971
[13] N. Carron, “Electromagnetic Penetration of a Reinforced Concrete Wall,” MRC-R-
1545, 28 August 1997.
[14] C. D. Taylor, S.L. Gutierrez, S.L. Langdon and K.L. Murphy, “On the Propagation
of RF into a Building Constructed of Cinder Block Over the Frequency Range
200MHz to 3GHz,” IEEE Transactions on Electromagnetic Compatibility, vol 41.
pp. 46-49, February 1999.
[15] Homepage, Home Tips, 1 Sept. 2004
http://www.hometips.com/hyhw/book/housetop.html
[16] Chris Garcia, General contractor. Personal interview. 10 Aug. 2004.
[17] P. Pauli and D. Moldan, “Reduction and Shielding of RF and Microwaves.”
http://www.electrosmog-free-living.com/uk/links.php Mainbernheim Germany,
May 2000.
[18] Homepage, 2003, All Wall, 1 Sept. 2004 http://www.allwallsystem.com/index.htm
[19] Reed Gaucho, Civil Engineer, Personal interview. 10 Aug. 2004.
[20] Emporis Building Database, Rodeway Inn, 2 Sept. 2004
http://www.emporis.com/en/wm/bu/?id=117016