modeling of instrumentation and control system of
TRANSCRIPT

MODELING OF INSTRUMENTATION AND CONTROL SYSTEM OF PROTOTYPE FAST
BREEDER REACTOR
A THESIS
Submitted by
P.SWAMINATHAN (Reg.No.2006192219)
in fulfillment for the award of the degree
of
DOCTOR OF PHILOSOPHY
FACULTY OF ELECTRONICS ENGINEERING
SATHYABAMA UNIVERSITY JEPPIAAR NAGAR, CHENNAI – 119
DECEMBER 2008

iii

iv
ACKNOWLEDGEMENT I sincerely thank Dr.Baldev Raj, Distinguished Scientist and Director,
Indira Gandhi Centre for Atomic Research, Kalpakkam, for his
benevolence and encouragement shown on me. He is constant source of
energy, enthusiasm and inspiration for me to keep my morale high. I
humbly acknowledge his kindness.
I would like to thank Dr Jeppiar, Chancellor, Sathyabama University
for his encouragement and support.
I wish to express my grateful thanks to Dr.N.Manoharan, Dean,
Research and PG Studies, Sathyabama University and Dr.B.Sheela Rani,
HOD, E&I department, Sathyabama University for constantly
encouraging and giving valuable ideas and suggestions to me to carry out
this thesis work.
I sincerely thank Dr.V.S.R.K. Mouly, Vice chancellor, Thiru. Marie
Jhonson, Director, Tmt. Mariazeena Jhonson, Director, Sathyabama
University, Dr.P.E.Sankaranarayanan, Dean, (Academic Research) of
Sathyabama University for constant encouragement during my course of
research.
I would like to thank Shi B. Sasidhar Rao, Smt H. Seetha,
Shri S.A.V. Satya Murty, Smt T. Jayanthi, Shri M. K. Mishra,
Shri S.Anantha Narayanan and Dr B.Venkatraman, my colleagues
from Indira Gandhi Centre for Atomic Research, for proving all the help I
needed while preparing this thesis report.
(P.Swaminathan)

v
ABSTRACT
Safety analysis and operational experience consistently indicate that
human error is the greatest contributor to the risk of a severe accident in a
nuclear power plant. A classical example is the Three Mile Island
accident. Subsequent to this accident, major efforts have been made by
practically all the nations using nuclear technology to produce power to
reduce the potential for human error through improved procedures and
methodologies and greater emphasis on the training of plant operators.
The use of full scope simulators in the training of operators is an essential
element in these international efforts. For successful training using
simulators, the simulator should closely represent the actual conditions
and environment. Thus each simulator would be unique to that country
depending on the nature and type of reactors under use.
India with its three stage nuclear power program has now
successfully entered the second stage. At the Indira Gandhi Centre for
Atomic Research (IGCAR) a 40 MWt Fast Breeder Test Reactor (FBTR)
is operational since 25th October 1985. Based on the valuable experience
gained, design of 500 MWe Prototype Fast Breeder Reactor (PFBR) has
been completed and construction is in progress. This thesis dwells on the
experiences and knowledge gained in the operation of FBTR and how
this has been fruitfully integrated in the development of such a simulator
for PFBR. It should be highlighted here that while the training simulators

vi
used by the Nuclear Power Corporation Ltd, primarily simulate the
failure of mechanical and electrical equipments, the full scope simulator
of PFBR incorporates modeling of instrumentation and control also.
This thesis has eight chapters.
The first chapter is an introductory chapter. After a brief overview of
the Indian Nuclear Power Program, the salient features of PFBR are
presented. PFBR is a pool type of reactor using U-Pu in their oxide form
as the fuel and sodium as the coolant.
Chapter-2 provides an overview of the training simulators present
worldwide. A detailed literature survey has been undertaken and the
highlights of this is presented. To provide comprehensive training to the
Plant Operator, it is necessary to model both normal and transient
behaviour of primary sodium circuit, secondary sodium circuit, steam &
water circuit, fuel handling system. The Full Scope Training Simulator
takes care of all the above mentioned aspects. Architecture and unique
features of PFBR Training Simulator are explained.
Chapter -3 outlines the instrumentation and control aspects of PFBR.
The various types of sensors, basis of sensor validation and neutronics
aspects of PFBR are outlined.
Most of the faults in Nuclear Reactor can be traced to faulty
behaviour of Instrumentation & Control System. Hence modeling of both
normal and abnormal behaviour of Instrumentation and Control System is
essential to ensure safe operation of PFBR. Modeling of I&C requires
safety analysis and identification of both ‘safe’ and ‘unsafe’ faults.
Chapter – 4 dwells in detail about the safety analysis of Neutronic
systems, Diverse Safety Logic systems and Safety Critical Embedded

vii
systems. The presence of different types of faults in I&C system and their
typical output on Training Simulator has also been analysed.
Misbehaviour of control elements resulting in uncontrolled
withdrawal of control rod has taken place in FBTR. Hence this incident is
modeled in detail in start up range, intermediate point and in full power
range and presented in Chapter - 5. Information flow as a result of
processing 15000 process signals through physically and functionally
distributed embedded systems will result in flooding of messages in the
CRT terminal. This chapter explains in a lucid manner an optimum
scheme that has been evolved to overcome this limitation.
Chapter-6 dwells on modeling of faults in safety related embedded
systems while Chapter – 7 provides the modeling aspects of the startup
conditions of the reactor.
Due to high power density (500 KW/litre) in Fast Breeder Reactor, it
is necessary to supervise the reactor core against the blockage of coolant
flow in the fuel subassembly. As a function of flow blockage, the
temperature rise along with fuel subassembly is modeled and the
behaviour of core temperature monitoring system is illustrated in Chapter
- 8.
Chapter-9 summarises the salient results and also provides an insight
into the possible areas for future research.
Overall, this thesis attempts to provide an encapsulated knowledge
bank of the design and developmental aspects that have been undertaken
in the integration of a unique simulator for PFBR.

viii
TABLE OF CONTENTS
CHAPTER NO TITLE PAGE NO. ABSTRACT v
LIST OF FIGURES xi
LIST OF TABLES xiii
LIST OF ABBREVIATIONS xiv
1 INTRODUCTION 1
1.1 GROWTH OF NUCLEAR ENERGY IN INDIA 1
1.2 FBR TECHNOLOGY 2
1.3 REACTOR CORE 5
1.4 STATE OF THE REACTOR 7
2 FULL SCOPE TRAINING SIMULATOR 10
2.1 NEED FOR FULL SCOPE TRAINING SIMULATOR 10
2.2 ARCHITECTURE 18
2.3 COMPARISON OF TRAINING SIMULATORS ALL OVER THE
WORLD 25
2.3.1 SIMULATORS OF RAPSODIE,PHENIX,SUPER-PHENIX 25
2.3.2 SIMULATOR AT CIVAUX POWER PLANT 25
2.3.3 SIMULATOR AT DAYABAY PLANT 26
2.3.4 SIMULATORS AT RUSSIA AND UKRAIN 26
2.3.5 SIMULATORS AT TORONTO 27
2.3.6 SIMULATOR AT NUCLEAR POWER PLANT-KOREA 29
2.3.7 SIMULATOR AT PHILIPSBURG-2,GERMANY 29
2.3.8 SIMULATORS AT RAPS,TAPS,KAIGA-INDIA 30
2.3.9 GENERAL FEATURES OF TRAINING SIMULATOR FOR PFBR 31
2.3.10 UNIQUE FEATURES OF PFBR TRAINING SIMULATOR 34
3 INSTRUMENTATION AND CONTROL OF PFBR 36
3.1 INTRODUCTION
3.2 SENSOR VALIDATION 36
3.3 OPTIMUM HUMAN MACHINE INTERFACE SYSTEM 37
3.4 NEUTRONIC SYSTEM FOR PROTOTYPE FAST BREEDER
REACTOR 41
ix
4 FAULT ANALYSIS AND MODELING OF NEUTRONIC SYSTEM 44
4.1 FAULT ANALYSIS OF NEUTRONIC SYSTEM 44
4.2 SAFETY LOGIC SYSTEM WITH FINE IMPULSE TEST SYSTEM 50
4.3 FAULTS IN PULSE CODED SAFETY LOGIC SYSTEM 59 4.3.1 DESIGN OF PULSE CODED SAFETY LOGIC SYSTEM 59
4.3.2 MODELING OF PULSE CODED SAFETY LOGIC SYSTEM 60
5 MISBEHAVIOR OF IMPORTANT ELEMENTS IN CONSOLE
PANEL 62
6 SAFETY RELATED EMBEDDED SYSTEMS 70
6.1 DESIGN OF SAFETY RELATED EMBEDDED SYSTEM 70
6.2 CHOICE OF BACK PLANE OR BUS 71
6.3 DESIGN OF CPU BOARD 72
6.4 DESIGN OF ANALOG INPUT CARD 74
6.5 DESIGN OF DIGITAL INPUT CARD 76
6.6 DESIGN OF ANALOG & DIGITAL OUTPUT CARDS 77
6.7 SOFTWARE ARCHITECTURE OF EMBEDDED SYSTEM 79
6.8 PROCESS MODELS 81
6.8.1 WATERFALL MODEL 81
6.9 SAFETY ANALYSIS OF EMBEDDED SYSTEMS 84
6.9.1 SAFETY ANALYSIS OF SYSTEM ARCHITECTURAL DESIGN 84 6.9.2 SAFETY ANALYSIS OF SOFTWARE REQUIREMENTS
SPECIFICATION 85
6.9.3 SAFETY ANALYSIS OF HARDWARE REQUIREMENTS
SPECIFICATION 85
6.9.4 SAFETY ANALYSIS OF SOFTWARE DESIGN AND MPLEMENTATION 85
6.9.5 SAFETY ANALYSIS OF HARDWARE DESIGN 86
6.9. 6 SAFETY TESTING 86
6.9.7 SAFETY AUDIT 87
6.10 RELIABILITY ANALYSIS OF EMBEDDED SYSTEM 88
6.10.1 SAFE FAILURES & UNSAFE FAILURES 89
7 MODELING OF START-UP CONDITIONS FOR THE REACTOR 96
7.1 INTRODUCTION 96

x
7.2 REACTOR STARTUP LOGIC (RSUL) BLOCK
7.3 INPUT CONDITIONS 101
7.4 FLOW CHART FOR MODELING RSU LOGIC 120
8 MODELING OF FLOW BLOCKAGE IN FUEL SUB-ASSEMBLIES 121
8.1 INTRODUCTION 121
8.2 CORE INLET TEMPERATURE (θRI) MONITORING SYSTEM 122
8.3 SUBASSEMBLY OUTLET TEMPERATURE (θI) MONITORING
SYSTEM 123
8.4 FLOW CHART FOR MODELING CORE TEMPERATURE
SUPERVISION 138
9 CONCLUSION AND DIRECTIONS 141
REFERENCES 145
LIST OF PUBLICATIONS 147
CURRICULAM VITAE 149

xi
LIST OF FIGURES
FIGURE NO. TITLE PAGE NO.
1.1 GROWTH OF NUCLEAR ENERGY IN INDIA 1
1.2 PFBR HEAT TRANSPORT FLOW SHEET 2
1.3 SECONDARY SODIUM MAIN SYSTEM 4
1.4 PFBR CORE CONFIGURATION 6
1.5 VARIOUS STATE OF REACTOR 7
2.1 CONTROL ROOM OF NUCLEAR REACTOR 11
2.2 ARCHITECTURE OF FULL SCOPE TRAINING SIMULATOR 19
2.3 SOFTWARE ARCHITECTURE 20
2.4 INTERFACE BETWEEN CONTROL PANELS AND SOFTWARE 21
2.5 PFBR ELECTRICAL SYSTEM 24
3.1 THERMAL BALANCE CALCULATION FOR SENSOR VALIDATION 39
3.2 OPTIMUM DISPLAY FORMAT 40
3.3 TRIPLICATED NEUTRONIC SAFETY CHANNEL 42
3.4 DUAL CONTROL CHANNEL 42
4.1 ARCHITECTURE OF SAFETY LOGIC SYSTEM 50
4.2 ARCHITECTURE OF PULSE CODED SAFETY LOGIC SYSTEM 60
5.1 CSR/DSR CUMULATIVE WORTH VS POSITION 63
5.2 FEED BACK DUE TO TEMPERATURE COEFFICIENT 66
6.1 ARCHITECTURE OF SAFETY CRITICAL EMBEDDED SYSTEM 70
6.2 VME BUS BASED CPU CARD 73
6.3 BLOCK DIAGRAM OF ANALOG INPUT CARD 75
6.4 BLOCK DIAGRAM OF DIGITAL INPUT CARD 76
6.5 BLOCK DIAGRAM OF RELAY OUTPUT CARD 77
6.6 BLOCK DIAGRAM OF ANALOG OUTPUT CARD 78

xii
6.7 FLOW CHART FOR APPLICATION SOFTWARE 79
6.8 SOFTWARE LIFE CYCLE 82
6.9 LIFE CYCLE FOR SAFETY ANALYSIS 84
6.10 1/2VOTING LOGIC 89
6.11 2/2VOTING LOGIC 90
6.12 HOT STANDBY LOGIC 91
6.13 2/3 VOTING LOGIC 92
7.1 STATES OF REACTOR 96
7.2 CONTEXT DIAGRAM FOR REACTOR STARTUP LOGIC 98
7.3 FLOW CHART FOR MODELING RSU LOGIC 120
8.1 BLOCK DIAGRAM OF ΘRI MONITORING SYSTEM 123
8.2 ARCHITECTURE OF RTC BASED CTM SYSTEM 125

xiii
LIST OF TABLES
TABLE NO. TITLE PAGE NO.
4.1 FMEA OF SAFETY LOGIC WITH FINE IMPULSE TEST SYSTEM 52
5.1 TOTAL REACTIVITY VALUES AND REACTOR STATES FOR DIFFERENT CSR/DSR POSITIONS 63
8.1 SA WISE FLOW & POWER FACTIONS 132
xiv
LIST OF ABBRIVIATIONS ADC - Analog to Digital Converter
AREB - Atomic Energy Regulatory Authority
BDBE - Beyond Design Base Events
CR - Control Room
CSR - Control & Safety Rod
CSRDM - Control & Safety Rod Driving Mechanism
CTM - Core Temperature Monitoring
DBE - Design Base Events
DDCS - Distributed Digital Control System
DSR - Diversified Safety Rod
DSRDM - Diversified Safety Rod Driving Mechanism
DYNA – P - Plant DYNAmic model
EDAC - Error Detection And Correction
FBR - Fast Breeder Reactors
FFLM - Failed Fuel Location Mechanism
FIT - Fine Impulse Test system
FMEA - Failure Modes and Effects Analysis
FSU - Fuel handling Startup
I/O - Input / Output
IHX - Intermediate Heat Exchanger
LMFBR - Liquid Metal Fast Breeder Reactor
LWR - Light Water Reactor
MISRA - Motor Industry Software Reliable Association
MTBF - Mean Time between Failure
PCSL - Pulse Coded Safety Logic System
PFBR - Prototype Fast Breeder Reactor
PFD - Probability of Failure on Demand
PHWR - Pressurised Heavy Water cooled Reactors

xv
Q.A. - Quality Assurance
RFH - Reactor in Fuel Handling state
ROP - Reactor in Operation state
RSD - Reactor in Shut Down state
RSU - Reactor Startup state
RSUL - Reactor Startup Logic
RTC - Real Time Computer
RTD - Resistance Temperature Detector
SA - Sub - Assembly
SCRAM - Safety Control Rod Activation Mechanism
SGDHR - Safety Grade Decay Heat Removal
SLFIT - Safety Logic System with Fine Impulse Test system
SORC - Station Operation review Committee
T/C - Thermo Couple
TMR - Triple Modular Redundancy
V & V - Verification & Validation
VME - Versa Module Europa

1
CHAPTER 1
INTRODUCTION
1.1 GROWTH OF NUCLEAR ENERGY IN INDIA
Nuclear electricity in India is presently from Pressurised Heavy
Water Reactors(PHWRs). Presently 15 reactors are operating, and 8 more
are under construction. With 250 reactor-years of operating experience,
India is one of the advanced countries in nuclear energy. PHWRs will
saturate at about 10 GWe. In order to satisfy the energy requirements,
with fuel derived from internal resources, it is possible to build FBRs
with energy capacity as shown in the Figure 1.1 below. It is estimated
that, indigenous Fast Breeder Reactors (FBRs) will contribute 200 GWe
by 2052. This will account for about 16 % of total energy production in at
that time.
FBRs are thus inevitable for the growth of nuclear energy in India,
with fuel generated indigenously. With import of reactors the nuclear
energy capacity can be further increased.
2000 2010 2020 2030 2040 2050 2060
0
50
100
150
200
PHWR FBR
Inst
alle
d C
apac
ity (G
We)
YearFIGURE 1.1 GROWTH OF NUCLEAR ENERGY IN INDIA

2
1.2 FBR TECHNOLOGY
FIGURE 1.2 PFBR HEAT TRANSPORT FLOW SHEET
The schematic of a fast breeder reactor in operation is given in Figure
1.2 along with its inner and peripheral components. The fluid flow
directions are also indicated. The core consists generally of a mixture of
Pu and U in their oxide forms. Surrounding the core is a “blanket” of
uranium oxide. Breeding takes place both in the core and the blanket. Hot
liquid sodium coolant flows through the core and the blanket to extract
the fission energy. Fuel (Pu/U) in metallic, carbide, or nitride form is also
feasible.
The coolant has to convey the fission energy removed to the heat-
exchange system, such as a steam generator, eventually to convert heat
energy into electrical energy. Sodium coolant, while passing through the

3
core becomes radioactive, and so is not permitted to contact directly the
steam generator. The primary sodium coolant gives its energy to an
intermediate heat-exchanger (IHX), from which a secondary sodium loop
takes the energy, which in turn is conveyed to the steam generator.
In the reactor core, sodium is pumped through the core by two centrifugal
pumps. Sodium flows through each and every fuel subassembly. The inlet
temperature of sodium is measured by six thermocouples. The
temperature of sodium is measured at the outlet of every sub assembly by
two thermocouples. Neutronic flux is measured by triplicate in-core high
temperature fission chambers. Flow of sodium is measured by eddy
current flow meters at the outlet of primary sodium pump.
The level of sodium in the reactor vessel is measured by continuous
level probe. The hot sodium coming out of the core enters four
Intermediate Heat Exchangers (IHX). The arrangements of primary
pump, reactor core, intermediate heat exchangers etc inside the main
vessel are shown Figure 1.3.
There are two secondary loops, each loop consisting of one expansion
tank with centrifugal pump, one surge tank, and four steam generator
modules. Heat transfer takes place from primary sodium to secondary
sodium in intermediate heat exchanger. Hot sodium flows into surge
tank and then to steam generators. After transferring heat to water,
relatively cool sodium flows from steam generator to expansion tank.
Here submerged centrifugal secondary sodium pump pumps sodium into
intermediate heat exchanger as sown in Fig 1.3. Permanent magnet type
flowmeters are used to measure the sodium flow in secondary sodium
circuit. A sample of sodium coming out of steam generator is analysed
for the presence of hydrogen. Increase in hydrogen level will reveal leak
in the steam generator modules.

4
FIGURE 1.3 SECONDARY SODIUM MAIN SYSTEM
Superheated steam coming out of steam generator is passed into
turbo-generator set for generating electricity. Spent steam is condensed
back into water. After preheating with bleeding steam, water is pumped
back into steam generator. In case turbine is not available, there is
provision for steam to flow into condenser through turbine bypass
system. During shutdown state of the reactor, decay heat is removed by
Operation Grade Decay Heat Removal (OGDHR) system. This system
consists of recirculation pump, steam generator and steam-to-air heat
exchanger. During the station black out, electrical supply will not be
available for any cooling pumps. In this case, decay heat is removed by
passive Safety Grade Decay Heat Removal (SGDHR) systems.

5
1.3 REACTOR CORE
A fast reactor requires higher fraction (enrichment) of fissile material
in the fuel, say about 20 %. The neutrons are fast and the neutron flux is
more by 10 times compared to that in thermal reactors. The power
extracted from unit mass and unit volume of the fuel is higher. Hence it
needs better heat transfer facilities. Higher neutron flux causes higher
damage to reactor materials. These are the challenges to be handled in the
engineering design, in addition to considering cost-effectiveness. The
design objectives include high breeding ratio, short doubling time, low
fuel-cycle cost, etc.
The characteristics of a fast reactor core may be summarized as
follows:
• Smaller than that of thermal reactor.
Power density: Thermal reactor (LWR): 12 kWe/l; Fast
Reactor: 108 kWe/l.
• Triangular lattice arrangement.
Advantages:
Neutron leakage decreased.
Higher fuel volume fraction.
Minimised fissile loading.
• Typical vol. Fraction:
Fuel: 30-45%;
Na: 35-45%;
Steel: 15-20%.
• Fuel: (U,Pu)O2 ; (U,Pu)C ; (Pu,U)N; Metallic
• Control Rod: B4C enriched in B10

6
• Structural materials: Austenitic SS, Ferritic Steel
• Coolant: Liquid metals (Sodium, Pb-Bi Alloy)
Fuel, blanket, control rods, shields, etc. are arranged inside a duct of
hexagonal cross-section, called a “hexcan”. A hexcan with its appropriate
content is called a subassembly (SA). Each zone of the reactor comprises
of many SAs. The fuel or the blanket materials are clad in metal (SS)
pins, and a bundle of such pins are inserted in an SA. The coolant runs
around each pin to extract the heat generated. The PFBR core plan, along
with schematic views of the subassemblies and the fuel pins are given in
the Figure 1.4. A helically running spacer-wire gives the needed gap
between pins and also enhances efficiency of heat removal by sodium.
Inner Core
Radial Blanket
Control rod
Outer Core
Steel Reflector
B4C Shield
FIGURE 1.4 PFBR CORE CONFIGURATION
The above figure shows that, as the liquid sodium flows around the
fuel pins inside the hexcan, it becomes hot due to the fission energy
released inside the pins. For controlling the neutron population, nine
control and safety rods and three diverse safety rods, all made of neutron
absorbing boron-10, are available.

7
The multiplication factor (K) is defined as the ratio between the
successive values of neutron population. When the value is constant, K is
unity and reactor said to be critical.
Reactivity (ρ ) is defined as (K-1)/K. When the reactor is critical,
reactivity is zero. When the reactor is in shutdown state, all the control
rods are fully inserted. K is much less than one and reactivity is negative.
The value of reactivity when all the rods are inserted is called shutdown
margin. When the control rods are pulled out of the reactor core, one by
one, value of K increases. At one point when K is unity, reactor reaches
criticality. If K is higher than unity, reactivity is positive and reactor is
said to be supercritical. The value of neutron flux rises exponentially. The
time taken for the flux to increase “e” times the initial value is called
reactor period (T).When the reactor is critical, value of neutron flux is
steady, and hence reactor period is infinity.
1.4 STATE OF THE REACTOR
Reactor has five states as shown below:
FIGURE 1.5 VARIOUS STATE OF THE REACTOR
Startup of Reactor
Reactor ShutDown
Reactor operation Reactor Fuel
Handling
Startup of Fuel Handling

8
When the reactor is in the shut down state (RSD), both primary and
secondary sodium circuits are operational. Decay heat is removed by
operation grade decay heat removal System. All the nine control and
safety rods and three diverse safety rods are down (fully inserted in the
reactor core).Shut down neutron flux is monitored by in-core triplicated
high temperature fission chambers. From this state, reactor can be taken
either to operational state (ROP) or to fuel handling state (RFH).
For taking the reactor to operational state, operator has to ensure
that all the 39 startup conditions are satisfied. This is done in reactor in
startup state (SUR). If all the conditions are satisfied or if unsatisfied
conditions are consciously inhibited, then the operator starts the reactor
by raising first diverse safety rods and then control and safety rods, all
one by one.
The speed of raising of control rods is limited to 2mm/sec to ensure
that neutron population growth is limited to safe limit. The effective
multiplication factor (Keff) is normally less than unity, when reactor is
sub-critical. When effective multiplication factor reaches unity, reactor is
said become critical. In this state, the population of neutron is steady.
Now the reactor is deemed to be placed in Reactor in Operation State
(ROP). Control rods are raised further steadily for raising the power of
the reactor. During this process, raise of reactor temperature is limited to
25 degree per hour to limit the thermal stress. Operator Grade Decay Heat
removal system is stopped and main boiler feed pump takes over in
forcing water into the steam generator. After satisfying the steam
conditions, turbine is rolled. After analysing both the frequency and phase
of generated electricity, output from the generator is connected to the
grid. During steady state power operation, loss of reactivity is
compensated by manually raising the control rods. During this phase, if
any safety parameter crosses the alarm limit, corresponding alarm is

9
energized in the control room. Detailed printout is also made, to enable
the operator to correct the situation. If the operator fails to take proper
action, then the safety parameter will cross trip (SCRAM) limit. This will
enable safety logic to de energize the current in the electromagnets which
are holding the safety rods. All the safety rods will drop under gravity,
thus shutting down the reactor. If the reactor is operating satisfactorily,
operator, at the end of campaign, will manually order the reactor
shutdown. Similarly from the shutdown state, operator can proceed to the
fuel handling state. All the fuel handling conditions are checked in startup
of fuel handling state. If all conditions are satisfied or if some conditions
are consciously inhibited, reactor is deemed to be placed in fuel handling
state. At the end of fuel handling state, reactor is brought back to shut
down state.
During Fuel handling state the following operations are carried out:
a) Transfer of fuel subassembly from one location to other
b) Discharge of spent subassembly from the reactor
c) Loading of fresh subassembly into the reactor

10
CHAPTER 2
FULL SCOPE TRAINING SIMULATOR
2.1 NEED FOR FULL SCOPE TRAINING SIMULATOR
The startup of the Reactor and subsequent raising of power are
carried out from the control room. The information about nearly
10,000 process signals are available through conventional meters,
recorders and display terminals. If any process parameter crosses the
alarm limit, corresponding alarm is energized in the control panel.
Operator has to take corrective action immediately, otherwise process
parameter will cross the trip limit. If process parameter crosses the trip
limit, Reactor will be tripped, causing thermal shock to the reactor
assembly. Hence operator need to be trained in handling the alarms in
the control room.
When the reactor is operating steadily, reactivity loss due to burn-
up has to be compensated by gradual withdrawal of control rods. In
Pressurised Heavy water Reactors, power control is carried out by
fault tolerant embedded systems. But in Fast Breeder Reactors ,power
control is carried out by adjusting the position of control rods
manually.
When the reactor is operating steadily, incidents like tripping of
coolant pumps, blockage of flow in fuel sub assembly, off-site power
failure etc may occur. Operator needs to be fully trained in handling
these incidents. Lack of training will result in accidents which we can
not afford to happen. Operator has to be very alert in the control room.
Typical picture of control room of nuclear reactor is shown below.

11
FIGURE 2.1 CONTROL ROOM OF NUCLEAR REACTOR
Start-up of reactor, power raising, fuel handling operation etc is
always carried out from the control room. In the control room, control
panels and console panels are arranged as arc of a circle. We have
separate control panel for neutronic system, sodium heat transport
system, steam and water system, electrical system and fuel handling
system. Control panel has alarm window, CRT display for messages,
conventional meters for indication and switches for initiating
command.
Whenever any process parameter crosses the alarm, then
corresponding group alarm will be energized in the appropriate control
panel. Operator has to take suitable action such that the process
parameter returns to normal value. If operator fails to take suitable
action, then the process parameter will cross the TRIP or SCRAM
limit, thus shutting down the reactor. Each unwanted TRIP or
SCRAM of the reactor results in thermal shock to the components of
reactor assembly. In commercial reactor, tripping of reactor will
results in economic loss also. After each trip, reactor can not be
restarted immediately. Station Operation review Committee (SORC)
will analyse the cause of the TRIP and if any limiting condition of

12
operation (LCO) is violated, then approval of Safety Committee is
required for restart of the reactor. This unpleasant situation can be
avoided if the Plant operator is fully trained in the operation of the
reactor with the help of training simulator. Training is all the more
required because alarms in a plant will come in a group, not alone.
When large numbers of alarms are energized in control room, operator
is totally confused. He has to refer the computer printout to find out
the primary alarm or root cause of the incident. Based on the cause of
the alarm, operator will have to be trained in taking corrective action.
For public acceptance of nuclear reactors, it is necessary to operate
them safely. But most of the accidents in nuclear reactors are traced to
design and human errors. Hence to avoid human errors, it is absolutely
necessary to provide comprehensive training to the operators of
nuclear reactor.
Incidents which occurred in different nuclear reactors, and which
strengthen the need for training simulator are listed below.
THREE MILE ISLAND ACCIDENT
The Three Mile Island accident of 1979 was a partial core meltdown
in Unit 2, pressurized water reactor, using enriched uranium as fuel
and light water as coolant and moderator. It was the most significant
accident in the history of the American commercial nuclear power
generating industry, resulting in the release of an estimated 43,000
curies (1.59 PBq) of radioactive krypton, but under 20 curies (740
GBq) of the particularly hazardous iodine-131.
The accident began at 4:00 a.m on Wednesday, March 28, 1979, with
failures in the non-nuclear secondary system, followed by a stuck-

13
open pilot-operated relief valve (PORV) in the primary system, which
allowed large amounts of reactor coolant to escape. The mechanical
failures were compounded by the initial failure of plant operators to
recognize the situation as a loss of coolant accident due to inadequate
training and ambiguous control room indicators. In the end, the
reactor was brought under control, although full details of the accident
were not discovered until much later, following extensive
investigations by both a presidential commission and the NRC. Three
Mile Island has been of interest to human factors engineers as an
example of how groups of people react and make decisions under
stress. There is consensus that the accident was exacerbated by wrong
decisions made because the operators were overwhelmed with
information, much of it irrelevant, misleading or incorrect. As a result
of the TMI-2 incident, nuclear reactor operator training has been
improved. Before the incident it focused on diagnosing the
underlying problem; afterwards, it focused on reacting to the
emergency by going through a standardized checklist to ensure that
the core is receiving enough coolant under sufficient pressure.
In the end, a few simple water level gauges on the reactor vessel might
have prevented the accident. The operators' focus on a single
misleading indication, the level in the pressurizer, was a significant
contributing factor to the partial meltdown.
THE FERMI I REACTOR
An accident occurred in US Fermi-1 prototype fast breeder reactor
near Detroit in 1966.Core temperature measurement at the outlet of
each and every fuel subassembly was not available. Due to a blockage

14
in coolant flow, some of the fuel melted. However no radiation was
released offsite and no-one was injured. The reactor was repaired and
restarted .
The Fermi I reactor was a breeder located at Lagoona Beach, 30 miles
from Detroit. On October 5, 1966, high temperatures were measured
and radiation alarms sounded involving two fuel rod subassemblies.
The reactor scrammed and there was indication of fuel melting. After
a month of sweating, they tested out enough subassemblies to limit the
damage to 6 subassemblies. By January 67 they had learned that 4
subassemblies were damaged with two stuck together, but it took until
May to remove the assemblies.
When they had checked the sodium flow earlier, they had detected a
clapping noise. In August 67 they were able to lower a periscope
device into the meltdown pan and found that a piece of zirconium
cladding had come loose and was blocking the sodium coolant
nozzles. The zirconium cladding was part of the lining of the
meltdown cone designed to direct the distribution of fuel material
should a meltdown of the fuel occur. Such structures are necessary in
a breeder reactor because of the possibliity of molten fuel
reassembling itself in a critical configuration. This is not a possibility
in an ordinary light water reactor because of the low level of
enrichment of the uranium, but a fast breeder reactor is operated with
a much higher level of enrichment.
NRX REACTOR AT CHALK RIVER, CANADA
The events of December 12, 1952 at this experimental heavy water-
moderated nuclear reactor make a wild tale of the type of common-

15
mode failures which make everyone nervous about nuclear reactors.
First, four valves which kept air pressure from raising the control
rods were opened in error by an operator. The supervisor noted
warning lights and rushed to the basement to close the valves. Once he
had closed them, he assumed that the rods had dropped back, but they
hadn't dropped fully - they had dropped only far enough to shut off the
warning lights.
The supervisor, realizing that the reaction was still on, called the
control room to order the operator to push buttons 4 and 3 to stop the
reactor, but mistakenly said 4 and 1. The operator rushed off to do it
before he could correct his mistake. Button 1 raised 4 banks of control
rods, causing the reaction rate to double every 2 seconds. This buildup
was noted after about 20 seconds and the reactor was scrammed.
Because of the air pressure problem, the control rods didn't go all the
way down. After about 44 seconds, the plant physicist dumped the
heavy water to kill the moderation and stop the reaction. This dumped
tons of radioactive water into the basement. About 3 minutes later, the
4 ton lid blew off the reactor, spurting radioactive water and setting
off alarms warning of lethal radiation levels. The building was
evacuated. This incident included a hydrogen-oxygen explosion and
the melting of some uranium fuel, yet the release was contained.
CHERNOBYL NUCLEAR POWER PLANT
The accident at the Chernobyl nuclear power plant in the Ukraine was
caused by a faulty reactor design combined with mistakes made by
power plant employees. A surge of power destroyed one of the
reactors at the plant and released large amounts of radiation.

16
Helicopters dropped boron and sand onto the reactor to prevent more
radiation from leaking into the environment. 600 employees were
present at the time of the explosion.
PROTOTYPE FAST REACTOR ,UK.
Instrumentation shall be highly reliable. But in Prototype Fast Reactor
(PFR),UK, spurious alarms were encountered in the control room
regarding leak in Steam Generator. Operator has disabled the alarm.
At this time ,actual leak took place in steam generator. A large steam-
sodium reaction in the PFR superheater involving a rupture of
multiple tubes was caused by fatigue failure due to tube to tube
fretting against the central flow baffle.
FAST BREEDER TEST REACTOR (FBTR)
The following incidents have taken place in FBTR.
1) Tripping of Primary Sodium Pumps and Secondary Sodium
Pumps due to rise in insulation temperature,resulting in
tripping of the reactor
2) Tripping of Condenser Extraction Pump resulting in tripping
of the reactor
3) Uncontrolled withdrawal of control rod resulting SCRAM
on period signal
4) Discordance between triplicated neutronic channels
5) Safe, Unsafe and Mixed faults in Safety logic system
6) Plugging alarm in the control room
7) Safe fault in Safety critical embedded system
8) Sensor failure in control rod position measurement system
9) Sensor failure of in-core temperature measurement system
10) Failure of final stage power transistor of safety logic

17
in unsafe mode.
11) Failure of Class-II UPS system resulting in failure of
safety critical embedded systems.
12) Failure of DG set to come up, resulting in failure of
Class-III power supply
13) Failure of Steam Generator leak detection system
14) Spurious SCRAM due to noise pickup in neutronic
Channels
15) Spurious TRIP due to cold junction box temperature
measurement systems
16) Line heater failure due to fault in valve position indicator
17) Bending of Guide tube due to fault in interlock logic
18) Reversal in the direction of control rod movement
19) Noise pickup in Pulse transformer of Safety logic resulting in
mixed Fault
20) Misbehaviour of relay based Reactor state logic resulting in
bypassing of core temperature supervision software.
.
In all these incidents, non availability of Training Simulator has
resulted in delayed response of the plant operator. All the incidents
mentioned above in FBTR are modeled in the Full Scope Training
simulator of PFBR.

18
2.2 ARCHITECTURE
The Training Simulators are broadly classified based on
two parameters namely extent of plant to be covered in simulation and
fidelity in replication of plant control room. Based on the extent of
plant to be covered, the simulators are classified as Full Scope or
Part -Task simulators and based on the fidelity in replication of
plant control room, the simulators are classified as Replica and Non
Replica Simulator.
In Replica type, simulators will have a control room with panels
which are one to one replica of actual plant control room, down to
desks, chairs and lights. A built-in advantage of the Replica type
simulator is its ability to do strict procedural training. As with in plant
training, the trainee can learn the location and function of each
instrument and control. In Non Replica simulators, all important
indicators and controls are emulated by CRT displays called virtual
panels.
Operation of nuclear reactor requires deep knowledge in reactor
physics, reactor engineering, Instrumentation and Control system,
water chemistry, electrical systems and safety engineering of power
plants. The primary reason for accident at Chernobyl nuclear reactor
was traced to human error in operation of the reactor. Hence to avoid
accidents, it is necessary to model the normal as well as transient
operation of the nuclear reactor and provide detailed training to
operators of nuclear reactor. The architecture of Full scope training
simulator is shown in Figure 2.2. Part of the Distributed Digital
Control system such as safety critical network, safety related network

19
,fault tolerant process computers, large video display terminals etc are
also included as part of Training Simulator.
1. Replicated Control Room Panels & Console to provide replica Simulator
2. I/O Computers to interface replicated Control Panels and Console Panels to Simulation Computer
3. Simulation Computer : Compaq Alpha system for running plant model in real time
4. Instructor Station : Control simulation and initiate plant incidence and malfunctions
43
2 1
FIGURE 2.2 ARCHITECTURE OF FULL SCOPE TRAINING SIMULATOR
Important safety related control panels and console panels are
included as part of Training Simulator. The inputs from control panels
are routed through dedicated data acquisition systems (I/O computers)
to modeling computer. Outputs from modeling computer are fed back
to control or console panels through I/O computers. The entire plant
data and messages are further passed on to another set of computers
called “Process Computers”. The stored information with time
stamping is disseminated to intelligent display terminals which are
located in all control panels and console panels. Instructor can
introduce malfunctions from the instructor’s desk. The effect will be
displayed in control and console panels. The operator response is also
recorded for appraisal.

20
The operating system in modeling computer is UNIX. Application
software routines are controlled in round robin fashion. The
arrangement is shown below:
Communication interface software receives data from the control and
console panels and stores in common database. From the Instructor’s
desk also commands are read and data are forced in database.
Modeling software reads data from database and calculates new data
as per the process model. The same communication software reads
data from the database and sends it to control and console panels for
display. The interface between control panels and modeling software
is illustrated in fig 2.4.
FIGURE 2.3 SOFTWARE ARCHITECTURE

21
FIGURE 2.4 INTERFACE BETWEEN CONTROL PANELS AND SOFTWARE
There are separate control panel each for neutronic system,
primary sodium system, secondary sodium system, steam and water
System, electrical System etc. Operator can select one of the control
Neutronic Model
Modeling Primary & Secondar
Sodium Systems
Modeling Steam & water
system
Electrical Model
Con Rod Position
Power, Period & Reactivity
P
Na Flow
IReactor inletTemp.
Temp. distribution
Water Flow
Inlet temp. of SG
Steam temp. & pressure
Status of
circuit breakers
Na temp. Inlet SG
Generated P
Neutronic systempanel
Primary & Secondary system panel
Steam & Water systemspanel
Electrical systems
panel
Communication Software

22
rods and “raise” or “lower” it by pressing corresponding push button.
Similarly operator can select the speed of the primary sodium pump
and speed of the secondary sodium pump. Initially operator can switch
on secondary sodium pipe heaters and control the inlet temperature of
the reactor. The speed of feed water pump is kept constant and flow of
water into the steam generator is controlled by a valve. The position of
the valve is controlled by a controller which maintains the temperature
of sodium constant at the outlet of steam generator.
To start the reactor, operator will raise the control rod one by
one. The position of the control rod is calculated by I/O computer and
passed on to global database. The neutronic modeling software reads
the control rod position and calculates the reactor power by solving
point kinetic equations. Calculated reactor power is stored in global
data base. This is further transferred to control panel for display. The
temperature at the outlet of every subassembly is calculated from a
lookup table which contains flow fraction in the subassembly and
power fraction in the subassembly. The calculated outlet temperature
value is stored in the global database. These values are sent to control
panel for display. These values are also taken by core temperature
supervision software which will order trip to the reactor if expected
temperature raise is greater than the actual temperature raise by more
than 10 degree. If the outlet temperature of central subassembly
exceeds the trip limit, reactor will be tripped. Similarly if temperature
raise in the central subassembly exceeds the trip limit also, reactor will
be tripped.
DYNA-P software calculates the temperature of sodium at the inlet
of IHX, outlet of IHX, inlet of steam generator and outlet of steam

23
generator. For this calculation, DYNA-P reads from the global
database flow of primary sodium, flow of secondary sodium, flow of
feed water, and temperature of feed water. DYNA-P also calculates
the temperature and pressure of steam at the outlet of steam generator.
After analyzing the frequency and phase of the generated electricity
with that of grid, the output of generator is synchronized with grid.
The generated power, frequency etc are displayed to the operator.
The electrical supply in the Plant is classified as follows:
Class-IV…Raw supply from the grid
Class-III…..supply from the grid backed up by Diesel Generator
sets
Class-II……Supply from uninterrupted System (UPS)
Class-I…..DC supply
Vital safety critical loads like neutronic instrumentation, Safety logic
etc are connected to Class-I supply. Safety critical and safety related
real time Computer systems are connected to class-II supply. Primary
sodium pumps and secondary sodium pumps are connected to Class-
III supply. The pumps in steam and water circuits are connected to
class-IV supply.
The overall arrangement of electrical supply is shown below:

24
FIGURE 2.5 PFBR ELECTRICAL SYSTEM
Class-IV power supply is available for secondary sodium pumps and
feed water pumps. If Class-IV power supply is not available, this will
result in tripping of pumps. From Class-IV power supply is backed by
the output of Diesel generators, then the power supply is called Class-
III. Failure of this power supply will result in tripping of Primary
Sodium Pumps. The Class-III power is rectified and battery backed.
This in-turn is converted back to Class-II supply. This is available to
all the Real Time Computer Systems. Failure of Class-II power supply
will result in tripping of real Time Computer Systems which in turn
will result in tripping of the Reactor. Class-I power supply is made of
220V and 48V DC. This is available to Neutronic Systems and Safety
Logic Systems.
Clas I
Loa
UP
Loa Loa
Loa
T
Gri
Class
Class
Class
Loa
Loa
220K
21K
D
6.6K
415
6.6K
6.6K
415
415
240 220V
220V /48V
Batter
240
Class IV Class IV -- Normal Normal
Class III Class III -- Emergency Emergency
Class II Class II -- AC Instrumentation & AC Instrumentation & Control
Class I Class I -- DC Instrumentation & ControlDC Instrumentation & Control

25
2.3 COMPARISON OF TRAINING SIMULATORS ALL OVER THE
WORLD
2.3.1 SIMULATORS AT RAPSODIE, PHENIX, SUPER-PHENIX - FRANCE
France has specialized simulators for variety of training activities.
In Rapsodie & Phenix, Analog Simulator and Specific Simulator were
used for training programme. Replica type simulator was not used in
Phenix & Super-Phenix. Infact, SuperPhenix was provided with two
types of simulators, a General Purpose Simulator and Specific
Simulators for the normal and for the emergency decay heat removal
system simulation respectively. General purpose simulator was used for
training operators on normal situations, incidental situations and
diagnosis of pre-accidental situation. The specific Simulators were used
for training on Turbine Generator system, Reactor Control System and
Decay Heat Removal system. Fuel handling operation was not
simulated. 2.3.2 SIMULATOR AT CIVAUX POWER PLANT - FRANCE
Civaux Nuclear Power Plant belongs to France’s N4 Reactor
series. The plant uses Full Scope Replica Simulator of the CIVAUX
control room allowing operators to practice the following:
• Routine operations of the plant.
• Effective response to Emergency Operations
Apart from the above operations the simulator is also used for analysis
& validation purpose as detailed below:
• Reactor behavioral analysis
• Data validation
• System function upgrades

26
2.3.3 SIMULATORS AT DAYABAY PLANT - CHINA China is the fastest growing market for Nuclear Power
generation. China is the world’s second largest consumer of energy
(after US). It has Canadian reactors, French reactors, Russian Reactors
and Chinese Reactors. Dayabay Nuclear Power Station is the first large
scale commercial Nuclear Power Plant in china.
Dayabay Power plant is of 2 x 984 MWe, PWR and a Full Scope
and Analytical Simulator have been installed at site covering the
following systems:
• Reactor system
• Balance of plant
• Electrical system
• I & C models.
• Advanced thermal hydraulics
The main features of the simulator include the following: • Normal and Off Normal Operations of the plant
• Accident and emergency scenarios
• Development and validation of Emergency Operating procedures.
2.3.4 SIMULATORS AT RUSSIA & UKRAIN Russia & Ukraine put together have thirteen VVERs – ranging
from 440 MWe to 1000 MWe located at various places like Kola,
Balakcovo, Kalinin, Khmelnystkyy, Rivine, South Ukrain,
Zaporizhzhya, Trnana etc. All the Units are provided with either a
Full scope or analytical simulator to impart enhanced training

27
capabilities to their plant operators thereby resulting in increased plant
safety.
The simulated systems include the following models:
• Primary system
• Main steam system
• Balance of plant
• Reactor core neutronics
• Turbine Thermal Hydraulics
• Turbine & Reactor control system
• Logic system
The simulators incorporate the following features:
• Normal plant evolutions
• Steady state and transients conditions
• Plant malfunctions specific to VVER design.
3D thermal hydraulic model is also installed at one of the plant
(Kalinin ) for better technical description of the primary system during
asymmetric transient events.
2.3.5 SIMULATORS AT TORONTO - CANADA
Canada has CANDU – 600- 900 MWe (PHWR) type reactors at
the Pickering facility east of Toronto and Bruce facility northwest of
Toronto (each have 8 reactors per site). The plant originally was
provided with a Compact Simulator to assist Atomic Energy of
Canada Ltd, in the design of the plant display system. The current
configuration is a Full Scope Replica Simulator which is able to

28
respond to the operating conditions normally encountered in power
plant operation, as well as many malfunctions as listed below.
The simulator covers the following systems:
• Reactor core
• Heat transport system
• Steam & Water system
• Turbine & Generator
The malfunction list includes the following:
a. Reactor core
• Reactor setback
• One bank of control rods drop into the reactor
b. Heat Transport
• Main circuit relief valve fails open
• Pressure relief valve fails open
• Pressurize isolation valve fails
c. Steam and Feed-Water
• All level control isolation valves fail closed
• One level control valve fails open
• One level control valve fails closed
• All feed pumps trip
• All safety valves open
• Steam header break
• Flow transmitter fails
d. Turbine Generator
• Turbine spurious rip
• Turbine spurious run-back

29
2.3.6 SIMULATOR AT NUCLEAR POWER PLANTS - KOREA
Korea has 16 operating Nuclear Power Plants both PWR &
PHWR of capacities ranging from 600 to 1000 MWe. The installed
capacity is around 13,716 MWe which amounts to 29.2 % of total
country’s installed capacity. Each Nuclear Plant site has a Simulator
Training Centre for training the operators.
The simulated systems include the following:
• Reactor Coolant System
• Component Cooling Water
• Control Rod
• Electrical System
• Condensate and Feed Water System
• Main Steam System
• Nuclear Instrumentation System
• Plant Control System 2.3.7 SIMULATOR AT PHILIPSBURG–2 NPP – GERMANY
Philipsburg–2 Nuclear Power Plant at Germany is a PWR of
1392 MWe capacity. The simulator centre at Philipsburg has a plant
specific full scope simulator for operator training. The simulator facility
has capabilities to support normal, abnormal regimes as well as both
design and beyond design basis emergency events with exclusion of
severe accident management.
There is also a ‘Glass Model’ that provides visibility of thermo
hydraulic processes. Combination of exercise on the Glass – model
along with the lectures and exercises on the convention simulator
provides the operators more clear understanding of the process flow.

30
2.3.8 SIMULATORS AT RAPS, TAPS, KAIGA – INDIA
Full Scope Replica simulators are installed at RAPS, TAPS and
KAIGA Nuclear Power Plants to impart training to plant operators.
India’s first Nuclear Power Plant Simulator was installed at RAPS
Training Centre at Kota and it is now upgraded with state of the art
technology to Full Scope Replica Simulator.
The Simulator offers many facilities in training the plant
operators. The Simulator covers all the normal and abnormal
operation of the plant and over 300 malfunctions of different
equipments in the plant.
The Simulator includes the following systems:
• Primary Heat Transport system
• Reactor Regulating System
• Reactor Protection System
• Moderator System
• Electrical Supervisory Control and Data Acquisition.
• Reactor Auxiliary Systems.
• Turbine Generator and Auxiliaries
• Instrumentation & Control
• Steam Water System
The important features of the Simulator include:
Normal Operation
Routine Testing of Reactor Protection System
Isolation / Normalization of Electrical equipments
Reactor Power Raise /Lower / Set Back
Turbine Rolling Synchronization of TG and Loading

31
Transient Operation
Reactor Setback initiation
Reactor Trip & Start up within Xenon poison override Time
Turbine Trip and Recovery
Class IV Power failure
Reactor Trip by Secondary Shut Down System
Emergency Operating Procedure
Primary Heat Transport System Feed Valve Stuck Operation
Moderator System Circulation Failure
Loss of Normal 90% feed water to one steam generator 2.3.9 GENERAL FEATURES OF TRAINING SIMULATOR FOR PFBR
Full Scope Replica Operator Training Simulator is being
developed in-house for Prototype Fast Breeder Reactor at IGCAR.
The simulator has been targeted to achieve far-reaching capabilities in
imparting training to the plant operators by simulating various plant
operating conditions, component failures, malfunctions, local operator
actions, control overrides etc.
The Full Scope Replica Simulator incorporates all the above
mentioned features which allow the operator to be trained for normal
and abnormal plant conditions covering the full spectrum of reactor
operation including plant transient conditions and design basis events
under various categories as detailed below.
2.3.9.1 CAT - 1 : FREQUENCY OF OCCURRENCE > 1 PER REACTOR YEAR
32
Cat-1 represents all the events occurring with a frequency of f > 1 per
reactor year. i.e. Normal plant operations and all planned activities
like:
• Reactor Start-up / Shut down
• Fuel handling
• Reactor operation at Full Power
• Reactor operation at Partial Power 2.3.9.2 CAT - 2: FREQUENCY OF OCCURRENCE 10-2<F<1 PER REACTOR
YEAR
Cat-2 represents all events occurring with a frequency of 10-2<f<1 per
reactor year.
• Continuous withdrawal of one CSR - Pre-critical
• Continuous withdrawal of one CSR - Low power
• Continuous withdrawal of one CSR - High power
• Partial blockage in a fuel sub assembly
• One primary pump Trip
• One Primary Sodium Pump pony motor failure on demand
• Acceleration of one or both Primary Sodium Pump
• One secondary sodium pump trip
• Offsite power failure
• Complete loss of feed water system 2.3.9.3 CAT – 3 : FREQUENCY OF OCCURRENCE 10-4<F<10-2 PER REACTOR
YEAR
Cat -3 represents all events occurring with a frequency of 10-4<f<10-2
per reactor year.
• One primary pump seizure
• One secondary sodium pump seizure

33
• IHX sleeve valve closure
2.3.9.4 Other Mal-functions simulated
(i) Neutronics System
• Reactor Shut down (SCRAM)
(ii) Primary /Secondary Sodium Systems
• Sudden closure of sodium side isolation valves
• Operation with (n-1) Steam Generator.
(iii) Steam Water System
• Trip of Main BFP & not taken over of stand by
• Failure of CCWP
• Tripping of condensate extraction pump (CEP)
• Malfunction of Water/Steam side isolation valve
• Sudden opening of Water Side depressurization valve
• Failure of vacuum in Condenser
• Loss of steam supply to Deaerator
• Turbine Load throw off
• Inadvertent opening of bypass valve
• Inadvertent opening of steam safety valve
(iv) Electrical System
• Station Blackout
• Offsite power failure
• Failure of Control Power Supply
• Grid Disturbance
(v) Power failure with DG take over
2.3.10 UNIQUE FEATURES OF PFBR SIMULATOR

34
Apart from normal and abnormal event simulation, some more
features have been added to the Simulator as detailed below: (i) FUEL HANDLING OPERATION
• Transfer Arm Simulation
• Inclined Fuel Transfer Machine
Three dimensional Visualization system will be used for training the
plant operator in Fuel Handling System. (ii) I & C SIMULATION
• Safety Critical Data Highway – ( class- I )
• Safety Related Data Highway – ( class- II )
• Non-Safety Related Data Highway – ( class – III )
• Faults in real time computer system
• Faults in neutronic components
• Sensor faults
• Faults in Safety Logic system (iii) CORE TEMPERATURE MONITORING SIMULATION
Core temperature monitoring system simulation includes the
display of individual subassembly sodium outlet temperature, mean
core outlet temperature, core anomalies such as plugging of fuel
subassemblies etc. 3D temperature distribution with zoom facility is
provided.
(iv) OTHER IMPORTANT FEATURES
The other important features of Training Simulator include
simulation of the following:
• Neutronic discordance Supervision,
• Startup of Reactor Authorization,
• Startup of Fuel Handling Authorization,
35
• Performance of Safety Logic with Fine Impulse Supervision
• Performance of Pulse Coded Safety Logic system
• On-line Control Rod calibration
• On-line Reactivity balance calculations
• On-line thermal balance calculation
• On-line fuel sub-assembly burn-up calculation
Thus, the Full Scope Replica Simulator being built at IGCAR is one
of the World Class Simulators having all the important features like
normal & abnormal plant conditions, simulation of fuel handling,
Core monitoring, I & C system, Neutronic discordance supervision,
Startup authorization, Startup fuel handling authorization, Safety logic
system and above all Plant Walkthrough using virtual reality set up.

36
CHAPTER 3
INSTRUMENTATION & CONTROL OF PFBR
3.1 INTRODUCTION
The heat generated in the fuel sub-assemblies is removed by
circulating liquid sodium through the reactor core. Secondary sodium
circuit is used for transferring heat from reactor vessel to steam
generator. Super heated steam (480ºC, 125b) generated in the steam
generator is passed through the turbo-generator system, thus
producing electricity. Unique feature of Fast Breeder reactors are the
following:
Large neutronic flux range [ 107 to 1016 n/cm2/sec]
High Power density in the reactor core (500KW/liter)
Highly reactive sodium in the shell side and pressured
water in the tube side of steam generator
Large breeding ratio
Higher thermal efficiency compared to PHWR
Following unique Instrumentation & Control system are required for
PFBR:
In-core high temperature fission chambers and
associated signal Processing system
Diverse safety logic systems
Computer based core temperature monitoring system
Steam generator leak detection system
Physically and functionally distributed digital control
system

37
Control system for moving the control rods up and
down
On-line computational system for thermal balance of
the system for validation of neutronic channels
On-line calculation of reactivity balance to detect the
addition of any anomalous reactivity
Instrumentation and Control systems are the eyes and ears of
the Nuclear Power Plant. From the control room, operator should be
able to start the Nuclear Reactor from the shut down state and steer it
to full power. It is very important to model both normal and abnormal
behavior of Instrumentation and Control system. This will enable the
designer to develop a Training Simulator for PFBR. Malfunctions
should be introduced by the supervisor in the Training Simulator and
operator should be fully trained in tackling the situation. Modeling of
I&C system has become necessity to avoid human errors while
operating the Nuclear Reactor. Operator should also be able to control
or maintain the power of the Nuclear Reactor by manually adjusting
the position of the control rods. . 3.2 SENSOR VALIDATION
U235 coated fission chambers are used to measure the flux of
neutrons in the nuclear reactor. If neutron strikes U235, the fission
fragments ionize the gas (argon) and generate a pulse. From the pulse
rate, neutronic power (P) of the nuclear reactor is derived. If the
neutronic power crosses the threshold, automatic action is generated to
'trip' the nuclear reactor. Operator has to be sure that the value shown
by neutronic power meter is reliable. In any nuclear reactor, neutronic
power is equal to the thermal power. Hence with the help of on-line

38
computer system, computational routines were developed to calculate
the thermal power of the Nuclear Reactor. The thermal power is
calculated from the secondary sodium side, where the temperature and
coolant flow readings are more reliable.
Thermal power enthalpy difference Mass
at secondary = at secondary side of X flow rate
side of IHX IHX of sodium
Assuming 100% efficiency in intermediate heat exchanger, the
thermal power of the nuclear reactor is calculated by the following
equation:
Thermal power Heat lost Heat
of = by + transported to
Nuclear Reactor radiation Secondary
from reactor Sodium side
Heat lost by radiation from Nuclear Reactor is calculated by the
following equation:
Mass flow Enthalpy difference
Heat lost by = rate of water X of cooling water
Radiation in biological in biological shield
shield

39
The final thermal power is compared with neutronic power as shown
in Figure 3.1. If difference exceeds 10%, operator is alerted through
audible alarm in the control room.
FIGURE 3.1 THERMAL BALANCE CALCULATIONS FOR SENSOR VALIDATION
3.3 OPTIMUM HUMAN MACHINE INTERFACE SYSTEM
With Distributed Digital Control System (DDCS), supervising and
controlling Nuclear Power Plants, the important challenge is how to
solve 'information overloading' for operator in the control room.
Nearly 15000 process signals are being supervised by DDCS. If any
of these signals crosses the alarm threshold, corresponding alarm
messages are displayed in display terminal. If the process signals
come back within the alarm limits, fault clear message will be
displayed. In order to provide comfortable display format, various
display formats were tried in the control room of Fast Breeder Test
Reactor. After detailed interaction with shift engineer, the following
display format was evolved.
Fault message will be displayed in red colour flashing.

40
Fault clear message will be displayed in green colour
flashing.
After selecting 'Ack' in the display terminal, flashing
become steady.
The glowing of 'more' indicates, more messages are waiting
for acknowledgement.
Operator can sail to 'next' page or 'previous' page of display.
Operator can take 'print' of the current page.
There will be provision to display 1000 pages which is one
week history.
Information beyond 1000 pages will be stored in hard disc
for future retrieval.
Date and time stamping of each message shall be available
for data mining operation.
Finalised typical display format is shown below:
SAFETY PARAMETER DISPLAY TERMINAL
ACKMORE PRINT
10-01-08 09-17-52 STARTUP-OF-REACTOR CONDITION 09 NOT SATISFIED
10-01-08 11-27-22 STARTUP-OF-REACTOR CONDITION 09 SATISFIED
11-01-08 10:32:05 DISCORDANCE ON LIN P, Ch A : 500MW Ch B : 400MW Ch B : 510MW
11-01-08 12:12:24 CLEAR DISCORDANCE on LIN P Ch A : 500MW Ch B : 490MW Ch B : 510MW
11-01-08 17:10:32 Control rod level deviation abnormal PCR1:100mm PCR2:115mm PCR3:104mm
PCR4:102mm PCR5:107mm PCR6:109mm
11-01-08 17:19:14 Control rod level deviation normal PCR1:100mm PCR2:102mm PCR3:104mm
PCR4:102mm PCR5:107mm PCR6:109mm
12-01-08 07:10:19 PLUGGING ALARM ; TNA001X Actual - 550oC and Expected - 500oC
12-01-08 12:21:02 CLEAR PLUGGING ALARM ; TNA001X Actual - 548oC and Expected - 550oC
EXPERT ADVICE: Change ‘AI’ constant for TNA001X to clear the Plugging Alarm
FIGURE 3.2 OPTIMUM DISPLAY FORMAT

41
3.4 NEUTRONIC SYSTEM FOR PFBR
Due to the large range of flux, single neutronic detector can not cover
the entire range of operation of the reactor, from shutdown to full
power operation. During the low power range, in-core high
temperature fission chambers, located in the control plug of the
reactor, is useful. This signal is called Log-N. This has higher limit as
trip level. Rate of raise of this signal is covered as period signal Tn.
This has a lower trip limit. Startup range covers from zero power to
1MWt.
As the power of the reactor is raised, the fluctuation in the signal is
proportional to the reactor power. This is called campbell channel.
LOG-Power and period Tp are the signal derived from campbell
channels. Log-P has higher threshold for trip and period Tp has lower
threshold for trip. When Log-P reaches 800KW, start-up channels are
inhibited. If start-up channels are not inhibited, then reactor will be
tripped by Log-N signal. Campbell channel is active from 25KW to
2500MWt.
As the power of the reactor if further raised, ex-core fission
chambers are active. Lin-P, +reactivity and – reactivity are the signals
derived from ex-core fission chambers. The range of the channel is
from 12 MWt to 1375MWt. Lin-P has higher threshold for trip and
positive & negative reactivity have also higher threshold for trip. If
campbell channel is not inhibited at 62.5 MWt, reactor will be tripped
by Log-P signal.

42
The overall arrangement is summarized below:
Two more detectors are available purely for display of signals in the
control room. These are called control channels. Output from control
channels are used for day-to-day operation of the reactor. The
arrangement of control channels is shown below:
II --VESSEVESSE EE -- VESSEVESSE
Pulse Pulse Mode Campbell Campbell Mode(SIGMA(SIGMA
Count RateCount Rate PeriodPeriod
InterlocInterloc
Pulse ModePulse Mode
PowerPower ReactivityReactivity
- - ive ive ++ iveive
AlarAlar Trip Trip AlarAlar TripTrip
AlarAlar Trip Trip AlarAlar TripTrip
InterlocInterloc AlarAlar Trip Trip
Log NLog T T N N
InterlocInterloc AlarAlar TripTrip
LogLogP Lin PLin P
(Inhibit Pulse Mode)
(Inhibit Campbell Mode)
II - - VESSEVESSEL EE -- VESSEVESSEL
Pulse Pulse Mode Campbell Mode(SIGMA)
Pulse Mode
Powe
7 Ranges
Lin PPower
Lin P PowerLin P
2 Ranges
FIGURE 3.3 TRIPLICATED NEUTRONIC SAFETY CHANNEL
FIGURE 3.4 DUAL CONTROL CHANNEL

43
It is important to carry out discordance between control channels and
safety channels. Otherwise, operator will be operating the reactor from
the indicated values from control channels whereas safety actions will
be performed from different values from safety channels.
All the neutronic channels are triplicated to ensure the required
reliability and availability. In triplicated channels, always one channel
can be taken for maintenance or for calibration. Reactor will not be
tripped, because two out of three voting logic is used for trip signal for
tripping the reactor.

44
CHAPTER 4
FAULT ANALYSIS AND MODELING OF NEUTRONIC
SYSTEM
4.1 FAULT ANALYSIS OF NEUTRONIC SYSTEM
In one of the nuclear reactor, the high tension supply of neutronic
detector developed fault. Since the output signal is a function of the
supply voltage, the output signal decreased. But in the process, there
was no variation in the neutronic population (flux). The plant operator
was totally misled. This is a unsafe fault because, even if the process
signal increases, the detector output will not increase enough to cross
the threshold. To detect this problem, the output of triplicated
neutronic channels is connected to embedded system as shown below.
8
SAFETYLOGIC
Ch-A
Ch-B
Ch-C
1
0
1
0
1
0
SCRAM
The discordance between any two of the triplicated channels is
calculated. If the discordance crosses the threshold, corresponding
discordance alarm is energised in the control room along with relevant
message. In simulator, Instructor will introduce fault in any of the
triplets as shown in the following snapshots. Along with the

45
discordance message, corresponding alarm message and scram
message will be generated and displayed.
To start with Instructor selects Neutronic system as shown below:
The instructor can introduce faults in I&C system from his terminal.
The faults are analysed and analog cum digital values for
corresponding parameters are forced in the database. Modeling
software such as discordance supervision will find out the discordance
between the triplicated channels and energise the corresponding alarm.
Relevant messages are also displayed. Similarly, modeling software
for trip cards will compare the analog values of neutronic parameter
with the threshold and energise corresponding alarm.

46
Next, Instructor selects one of the three blocks of neutronic system.
Next, Instructor selects one of the channel as shown below.

47
Next, Operator enables the fault as shown below.
Discordance fault messages are displayed as shown below.

48
Corresponding alarm is energized in the control panel as shown below.
Discordance alarm is also energized in the control panel.

49
Flow chart for discordance software is given below:.
FLOW CHART FOR DISCORDANCE SUPERVISION
START
Read the value of Ch-A, Ch-B & Ch-C
Calculate discordance (d) d = |A-B|, |B-C|, |C-A|
YesIs d > Alarm
No
No Yes
1 --> Flag
Alarm in control room
Message in terminal
0 --> Flag
Deenergise Alarm
Fault clear Message
Go to START
Flag =1 ?
Has alarm already ON?
Flag =1 ? No
Yes

50
4.2 SAFETY LOGIC SYSTEM WITH FINE IMPULSE TEST SYSTEM
The trip signals from the triplicated neutronic system (power, period,
and reactivity) etc are routed to ‘two out of three' voting logic system
as shown in Figure 4.1
Coolant Flow
DND sensor
Neutronic Sensor
Core Temperature
Monitoring sensor
2/3 Voting
2/3 Voting
2/3 Voting
2/3 Voting
OR Logic
OR Logic
FIGURE 4.1 ARCHITECTURE OF SAFETY LOGIC SYSTEM
If any two channels (A&B/B&C/C&A) carry tip order, then 'scram' or
'shutdown' order is generated. This will de-energize the
electromagnetic coil (clutch), thus dropping all the neutron absorbing
control rods into the reactor. The chain reaction will be broken and
reactor reaches 'shutdown' state. If trip order is present in any one of
the channels (A or B or C) and if we get 'scram' order in the final stage
then the fault is classified as 'safe fault'. If trip order is present in any
two channels and if scram order is not present in the final stage, then
the fault is classified as 'unsafe fault'.

51
FAILURE MODES EFFECTS AND CRITICALITY ANALYSIS (FMEA)
Safety Logic with Fine Impulse Test (SLFIT) is the Safety
Logic system provided for Shutdown system 1 of PFBR. It is provided
with FIT logic system for continuously monitoring the Safety Logic.
SLFIT is implemented with CMOS technology based on FPGA’s and
Logic Devices. SCRAM Logic employs seven different types of
boards and FIT employs 2 boards to implement the required
functionality.
Failure Modes Effects and Criticality Analysis is performed on the
SLFIT system using the following assumptions.
Assumptions:
1. Single point failures alone are considered and hence multiple
point failures are not analyzed in the analysis.
2. An IC is considered to be failed even if any one pin of the IC is
failed.
The analysis helps in identifying the faults and its effect on safety of
the reactor. In FBTR the final power transistor driving the current
through EM coil have failed in unsafe mode. Due to fault in grouping
logic, unsafe faults were encountered. Due to noise in pulse
transformer, mixed faults were also encountered. Hence it is very
important to carry out fault analysis of safety logic system.

52
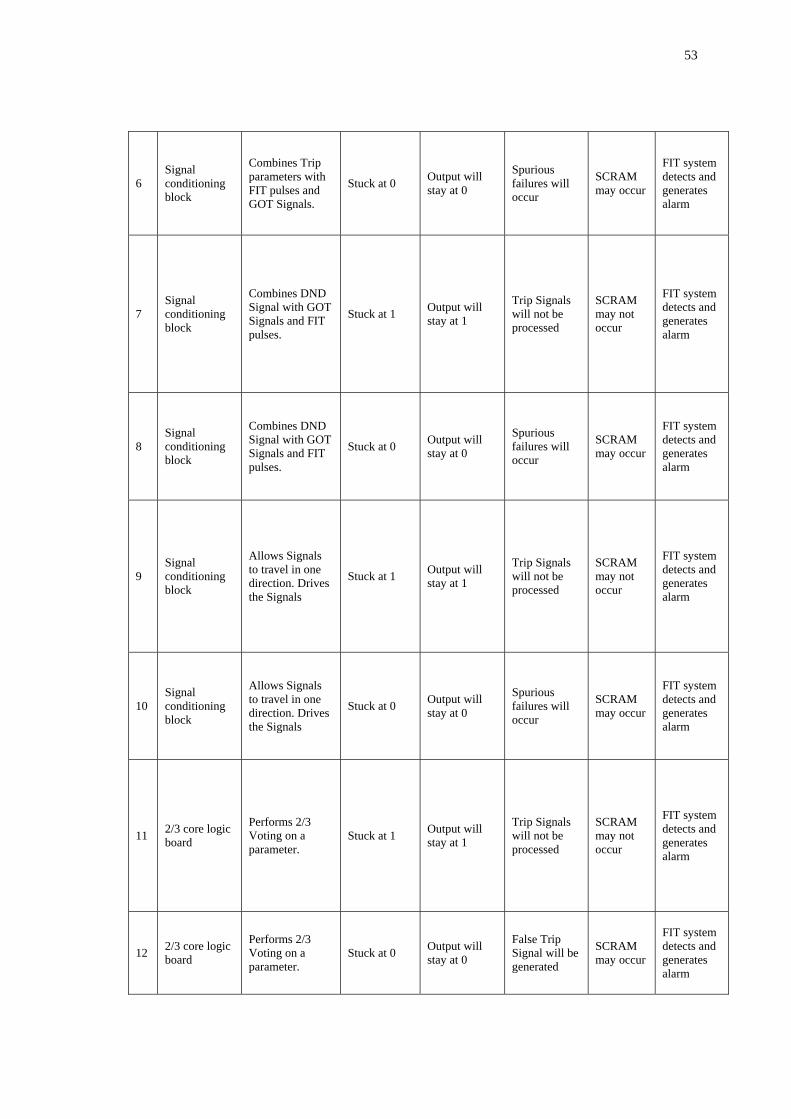
TABLE 4.1 : FMEA OF SAFETY LOGIC WITH FINE IMPULSE TEST SYSTEM
Sub system name Function Failure
Mode Local effect
Sub system level effect
System level effect
Method of detection
1 Signal conditioning block
Combines inhibit Signals with FIT injected pulses
Stuck at 1 Output will stay at 1
Trip Signals will not be processed
SCRAM may not occur
FIT system detects and generates alarm
2 Signal conditioning block
Combines inhibit Signals with FIT injected pulses
Stuck at 0 Output will stay at 0
Spurious failures will occur
SCRAM may occur
FIT system detects and generates alarm
3 Signal conditioning block
Performs OR function Stuck at 1 Output will
stay at 1
Trip Signals will not be processed
SCRAM may not occur
FIT system detects and generates alarm
4 Signal conditioning block
Performs OR function Stuck at 0 Output will
stay at 0
Spurious failures will occur
SCRAM may occur
FIT system detects and generates alarm
5 Signal conditioning block
Combines Trip parameters with FIT pulses and GOT Signals.
Stuck at 1 Output will stay at 1
Trip Signals will not be processed
SCRAM may not occur
FIT system detects and generates alarm
53
6 Signal conditioning block
Combines Trip parameters with FIT pulses and GOT Signals.
Stuck at 0 Output will stay at 0
Spurious failures will occur
SCRAM may occur
FIT system detects and generates alarm
7 Signal conditioning block
Combines DND Signal with GOT Signals and FIT pulses.
Stuck at 1 Output will stay at 1
Trip Signals will not be processed
SCRAM may not occur
FIT system detects and generates alarm
8 Signal conditioning block
Combines DND Signal with GOT Signals and FIT pulses.
Stuck at 0 Output will stay at 0
Spurious failures will occur
SCRAM may occur
FIT system detects and generates alarm
9 Signal conditioning block
Allows Signals to travel in one direction. Drives the Signals
Stuck at 1 Output will stay at 1
Trip Signals will not be processed
SCRAM may not occur
FIT system detects and generates alarm
10 Signal conditioning block
Allows Signals to travel in one direction. Drives the Signals
Stuck at 0 Output will stay at 0
Spurious failures will occur
SCRAM may occur
FIT system detects and generates alarm
11 2/3 core logic board
Performs 2/3 Voting on a parameter.
Stuck at 1 Output will stay at 1
Trip Signals will not be processed
SCRAM may not occur
FIT system detects and generates alarm
12 2/3 core logic board
Performs 2/3 Voting on a parameter.
Stuck at 0 Output will stay at 0
False Trip Signal will be generated
SCRAM may occur
FIT system detects and generates alarm

54
13 2/3 core logic board
Allows Signals to travel in one direction. Drives the Signals
Stuck at 1 Output will stay at 1
Trip Signals will not be processed
SCRAM may not occur
FIT system detects and generates alarm
14 2/3 core logic board
Allows Signals to travel in one direction. Drives the Signals
Stuck at 0 Output will stay at 0
False Trip Signal will be generated
SCRAM may occur
FIT system detects and generates alarm
15 Timer and latching board
Allows Signals to travel in one direction. Drives the Signals
Stuck at 1 Output will stay at 1
Trip Signals will not be processed
SCRAM may not occur
FIT system detects and generates alarm
16 Timer and latching board
Allows Signals to travel in one direction. Drives the Signals
Stuck at 0 Output will stay at 0
False Trip Signal will be generated
SCRAM may occur
FIT system detects and generates alarm
19 Timer and latching board
Performs latching function. and thereby prevents partial dropping of control rods
Stuck at 1 Output will stay at 1
Trip Signals will not be processed
SCRAM may not occur
FIT system detects and generates alarm
20 Timer and latching board
Performs latching function. and thereby prevents partial dropping of control rods
Stuck at 0 Output will stay at 0
False Trip Signal will be generated
SCRAM may occur
FIT system detects and generates alarm

55
21 Timer and latching board
Connects the PCSL output cross link with FIT for testing.
Opened/ Shorted
Optical link broken / Output Short
The signal will not reach Fit system for testing
The Optical link cannot be tested
FIT system detects and generates alarm
22 Grouping logic board
Processes Signals obtained from 2/3 core logic board. decides whether to shutdown the system or not.
Stuck at 1 Output will stay at 1
Trip Signals will not be processed
SCRAM may not occur
FIT system detects and generates alarm
23 Grouping logic board
Processes Signals obtained from 2/3 core logic board. decides whether to shutdown the system or not
Stuck at 0 Output will stay at 0
False Trip Signal will be generated
SCRAM may occur
FIT system detects and generates alarm
24 Grouping logic board
Drives the IGBT’s Opened
Signal will not be sent to EM Coil drive stage
This will terminate the Signal flow
IGBT Gate cannot be triggered. System will be Shutdown
FIT system detects and generates alarm
25 Grouping logic board
Drives the IGBT’s Shorted
SCRAM signal will not be propagated
This will terminate the Signal flow
--
FIT system detects and generates alarm
26 Grouping logic board
Allows Signals to travel in one direction. Drives the Signals
Stuck at 1 Output will stay at 1
The system will not respond to Trip Signals
SCRAM may not occur
FIT system detects and generates alarm
27 Grouping logic board
Allows Signals to travel in one direction. Drives the Signals
Stuck at 0 Output will stay at 0
the system will not respond to Trip Signals
SCRAM may occur
FIT system detects and generates alarm
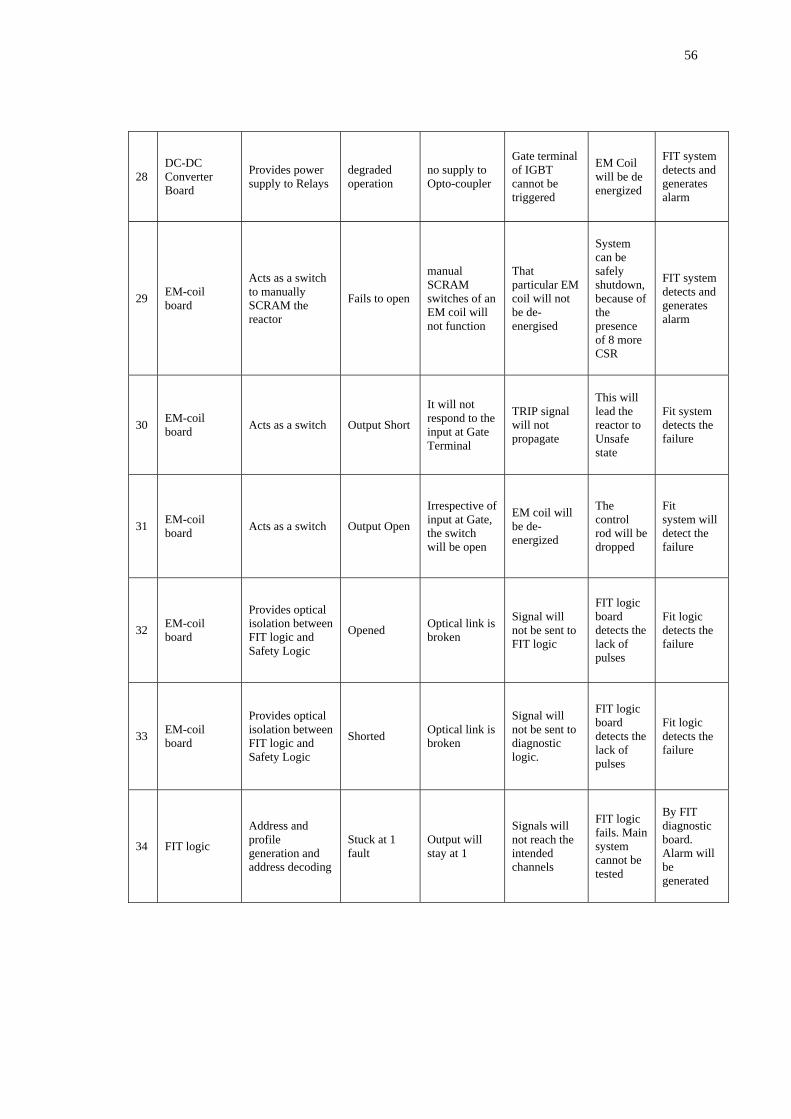
56
28 DC-DC Converter Board
Provides power supply to Relays
degraded operation
no supply to Opto-coupler
Gate terminal of IGBT cannot be triggered
EM Coil will be de energized
FIT system detects and generates alarm
29 EM-coil board
Acts as a switch to manually SCRAM the reactor
Fails to open
manual SCRAM switches of an EM coil will not function
That particular EM coil will not be de-energised
System can be safely shutdown, because of the presence of 8 more CSR
FIT system detects and generates alarm
30 EM-coil board Acts as a switch Output Short
It will not respond to the input at Gate Terminal
TRIP signal will not propagate
This will lead the reactor to Unsafe state
Fit system detects the failure
31 EM-coil board Acts as a switch Output Open
Irrespective of input at Gate, the switch will be open
EM coil will be de-energized
The control rod will be dropped
Fit system will detect the failure
32 EM-coil board
Provides optical isolation between FIT logic and Safety Logic
Opened Optical link is broken
Signal will not be sent to FIT logic
FIT logic board detects the lack of pulses
Fit logic detects the failure
33 EM-coil board
Provides optical isolation between FIT logic and Safety Logic
Shorted Optical link is broken
Signal will not be sent to diagnostic logic.
FIT logic board detects the lack of pulses
Fit logic detects the failure
34 FIT logic
Address and profile generation and address decoding
Stuck at 1 fault
Output will stay at 1
Signals will not reach the intended channels
FIT logic fails. Main system cannot be tested
By FIT diagnostic board. Alarm will be generated

57
35 FIT logic
Address and profile generation and address decoding
Stuck at 0 fault
Output will stay at 0
Signal will not reach the intended channels
FIT logic fails. Main system cannot be tested
By FIT diagnostic board. Alarm will be generated
36 FIT logic
Routing of profiles generated by FPGA 1
Stuck at 1 fault
Output will stay at 1
Signals will not reach the intended channels
FIT logic Fails. Main system cannot be tested
By FIT diagnostic board. Alarm will be Generated
37 FIT logic
Routing of profiles generated by FPGA 1
Stuck at 0 fault
Output will stay at 0
Signal will not reach the intended channels
FIT logic fails. Main system cannot be tested
By FIT diagnostic board. Alarm will be Generated
38 FIT Diagnostic Board
This board tests the healthiness of FIT logic Board
Stuck at 1/ Stuck at 0
Output will stay at 1/ Output will stay at 0
failure of FIT diagnostic logic
FIT diagnostic logic fails.
FIT system cannot be tested
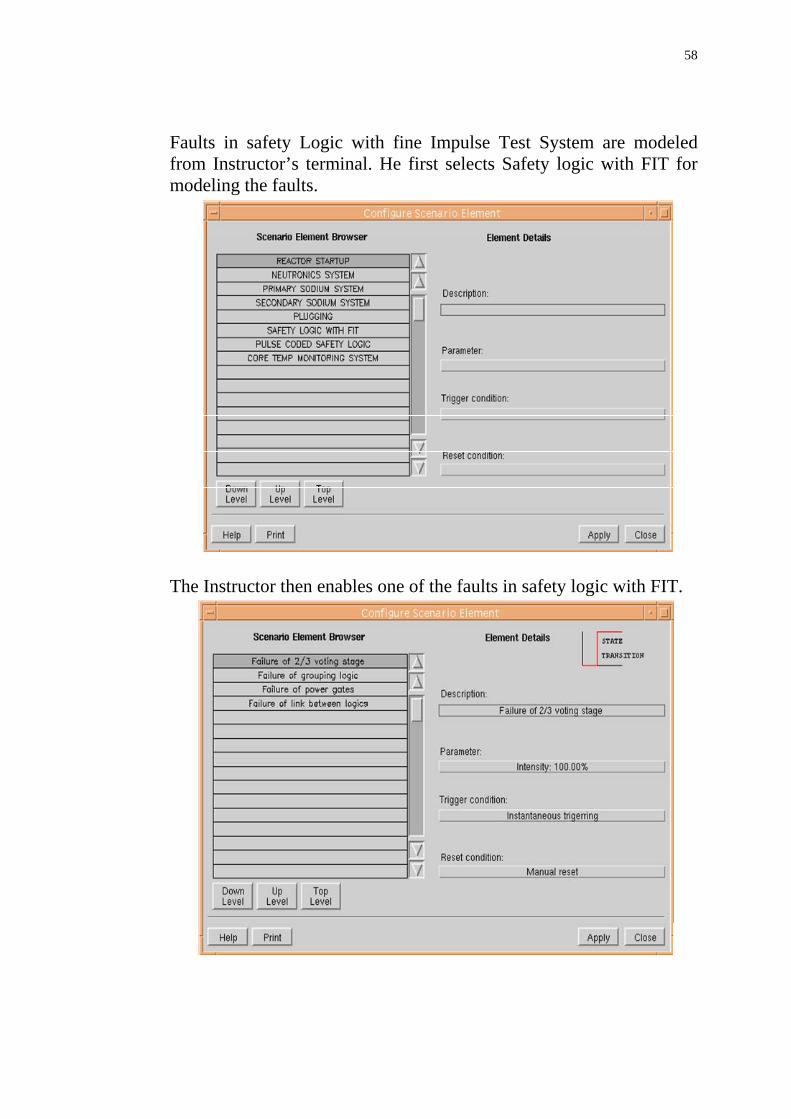
58
Faults in safety Logic with fine Impulse Test System are modeled from Instructor’s terminal. He first selects Safety logic with FIT for modeling the faults.
The Instructor then enables one of the faults in safety logic with FIT.

59
The faults are modeled and unsafe fault alarm is energized in the control panel and corresponding messages are displayed in the terminal.
Operator thus introduces one by one all the faults in the safety
Logic with FIT and provides comprehensive training to the operator.
4.3 FAULTS IN PULSE CODED SAFETY LOGIC SYSTEM (PCSL) 4.3.1 DESIGN OF PULSE CODED SAFETY LOGIC SYSTEM
As diverse safety logic system, inherently fail safe pulse coded
safety logic system was developed for Prototype Fast Breeder Reactor.
As long as process parameter is within the trip limit, pulses will be
propagating in the system, thus energizing the electromagnetic coil,
which in turn, holds the neutron absorbing control rods. If process
parameter in any two channels cross the trip limit (AB or BC or CA or
ABC), then the propagation of pulses will be stopped. This in turn
will deenergize the electromagnetic coil, thus dropping the neutron
absorbing control rods into the reactor. The rate of chain reaction will

60
be slowed and reactor will be shut down. The schematic of pulse
coded safety logic is shown below:
CC BB
RESET
SET
A B C
PULSEGEN.
GUARD LINELOGIC
GUARD LINELOGIC
2/3 LOGIC 2/3 LOGIC
ANNUNCIATOR ANNUNCIATOR
DRIVEREM
COIL
CH-A CH-A
PLANT PARAMETER – 1 PLANT PARAMETER - N
FIGURE 4.2 ARCHITECTURE OF PULSE CODED SAFETY LOGIC SYSTEM
For each parameter, two out of three voting logic and guard line logic
are provided. If corresponding process parameter is within safety
limits, then code will pass through the two out of three voting logic.
This in turn will enable the guard line logic to allow both set and reset
pulses to next stage. If process parameter crosses the trip limit, then
the guard line logic will block the propagation of both set and reset
pulse. This in turn will de-energize the electromagnetic clutch, thus
tripping the reactor. 4.3.2 MODELING OF PULSE CODED SAFETY LOGIC
The following faults are introduced in the Instructor's desk and effect
will be displayed in the control room through alarm and display
terminals.
Code generation A, B, C
Guard line logic
Output driver transistor (safe & unsafe)

61
Instructor introduces the faults of Pulse Coded Safety Logic from his
terminal. Necessary modeling is carried out and fault messages are
displayed. Reactor is also tripped as shown below.

62
CHAPTER 5
MISBEHAVIOR OF IMPORTANT ELEMENTS IN CONSOLE PANEL
The power of the reactor is controlled manually by withdrawing the
control rods from the reactor. This is carried out by the operator by
pressing the 'raise' push button. The control rod is raised at a steady
speed of 2mm/sec.The position is calculated and displayed in the
console panel as shown below:
The reactivity added with respect to the position is available as
calibration data. This data is generated by a procedure called “Control
Rod Calibration”. For making the reactor critical, first the Diverse
Safety Rods will be withdrawn one by one. When all the Diverse
Safety rods are withdrawn, the Control and Safety Rods will be
withdrawn one by one. When all the Control and safety Rods reach
about 50% of the their allowed travel, reactor will attain criticality.

63
If the net reactivity (shutdown margin - reactivity added due to
withdrawal of control rod) is less than 90 pcm, calculation neutronic
flux is carried out using the following procedure:
0.38.
102.
193.
309.
580.
805.867.
897.
0.57.
152.
287.
459.
656.
860.
1192.
1285.1329.
443.
706.
1047.
0
20
40
60
80
100
120
140
0 10 20 30 40 50 60 70 80 90 100
rod position, mm
cumulative worth
pcm
Outer Inner CSR,
Full power;1250 MW+84CSR(all the 9) 492 mm
Critical; zero 09th CSR 550 mm insertion 37.16 cps-3438th CSR 550 mm insertion 17.41 cps-7337th CSR 550 mm insertion 9.73 -13126th CSR 550 mm insertion 7.50 -17015th CSR 550 mm insertion 6.10 -20914th CSR 550 mm insertion 4.78 -26703rd CSR 550 mm insertion 4.17 -30602nd CSR 550 mm insertion 3.70 -34491st CSR 550 mm insertion 3.18 -40293rd DSR up 2.64 -53482nd DSR up 2.12 -66771st DSR up 1.59 -8006All CSR/DSR down
Reactor Reactivity pcm)CSR/DSR position
FIGURE 5.1 CSR/DSR CUMULATIVE WORTH VS POSITION
TABLE 5.1 TOTAL REACTIVITY VALUES AND REACTOR STATES FOR DIFFERENT CSR/DSR POSITIONS
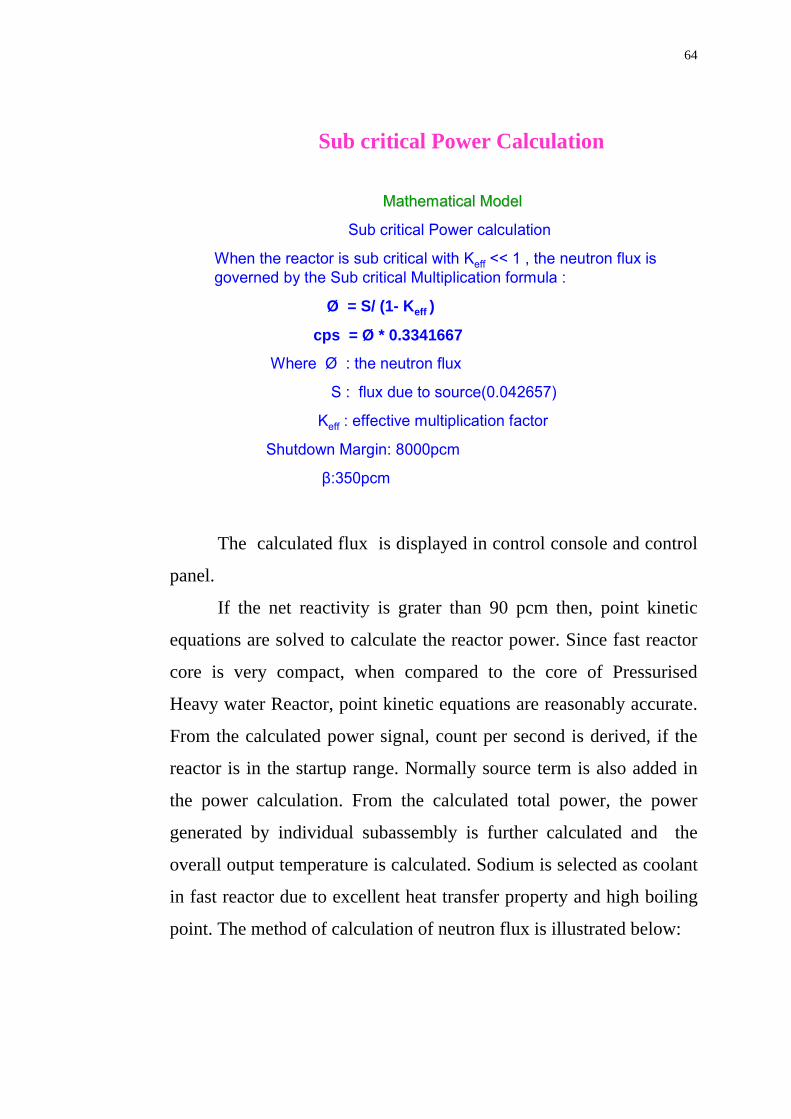
64
Mathematical ModelMathematical Model
Sub critical Power calculation
When the reactor is sub critical with Keff << 1 , the neutron flux is governed by the Sub critical Multiplication formula :
Ø = S/ (1- Keff )
cps = Ø * 0.3341667
Where Ø : the neutron flux
S : flux due to source(0.042657)
Keff : effective multiplication factor
Shutdown Margin: 8000pcm
β:350pcm
Sub critical Power Calculation
The calculated flux is displayed in control console and control
panel.
If the net reactivity is grater than 90 pcm then, point kinetic
equations are solved to calculate the reactor power. Since fast reactor
core is very compact, when compared to the core of Pressurised
Heavy water Reactor, point kinetic equations are reasonably accurate.
From the calculated power signal, count per second is derived, if the
reactor is in the startup range. Normally source term is also added in
the power calculation. From the calculated total power, the power
generated by individual subassembly is further calculated and the
overall output temperature is calculated. Sodium is selected as coolant
in fast reactor due to excellent heat transfer property and high boiling
point. The method of calculation of neutron flux is illustrated below:
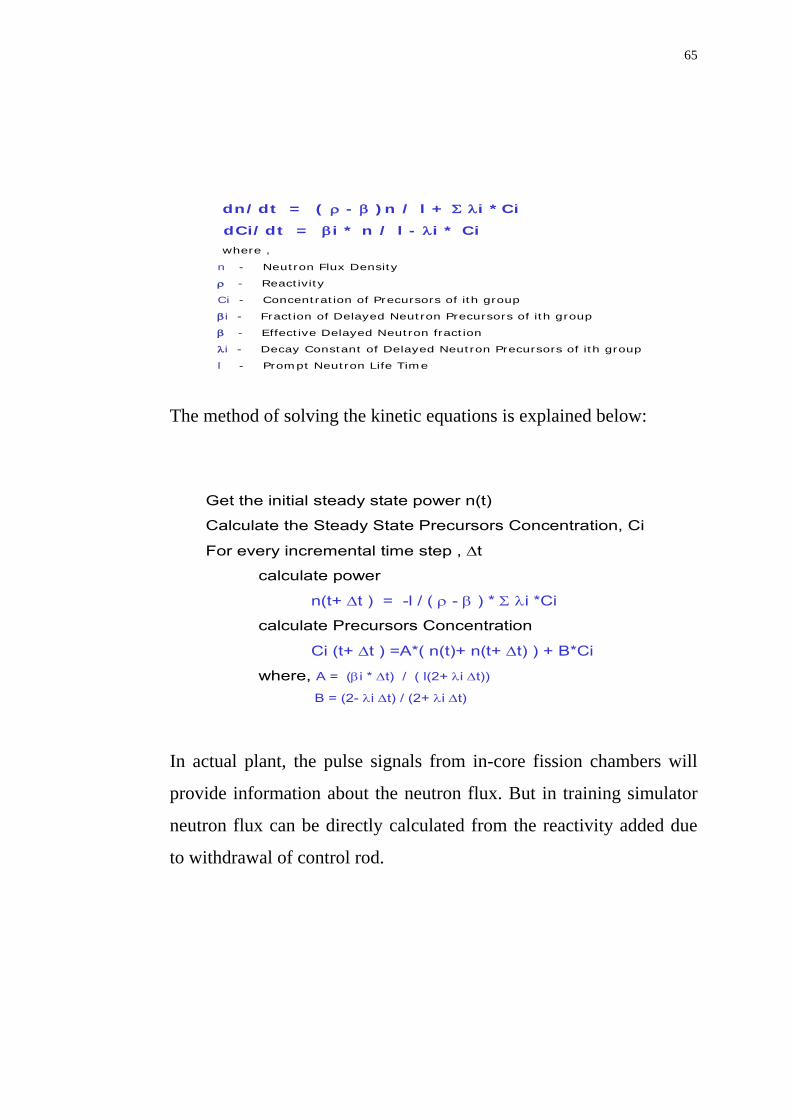
65
dn/dt = ( ρ - β )n / l + Σ λi *Ci
dCi/dt = βi * n / l - λi * Ci
where ,
n - Neutron Flux Density
ρ - Reactivity
Ci - Concentration of Precursors of ith group
βi - Fraction of Delayed Neutron Precursors of ith group
β - Effective Delayed Neutron fraction
λi - Decay Constant of Delayed Neutron Precursors of ith group
l - Prompt Neutron Life Time
The method of solving the kinetic equations is explained below:
Get the initial steady state power n(t)
Calculate the Steady State Precursors Concentration, Ci
For every incremental time step , Δt
calculate power
n(t+ Δt ) = -l / ( ρ - β ) * Σ λi *Ci
calculate Precursors Concentration
Ci (t+ Δt ) =A*( n(t)+ n(t+ Δt) ) + B*Ci
where, A = (βi * Δt) / ( l(2+ λi Δt))
B = (2- λi Δt) / (2+ λi Δt)
In actual plant, the pulse signals from in-core fission chambers will
provide information about the neutron flux. But in training simulator
neutron flux can be directly calculated from the reactivity added due
to withdrawal of control rod.

66
Fast Breeder Reactor has negative temperature and power coefficient
of reactivity as shown below:
In Fast Breeder Reactor when ever temperature rises, reactivity comes
down. Similarly whenever power rises also, reactivity comes down.
Hence net reactivity now is calculated taking into account the
temperature and power raise as shown in Fig: 5.2.
The rate of raise of neutronic flux is reflected as reactor period. The
neutronic flux increases exponentially. The time taken for the flux to
increase e times is called reactor period. If the period is less than 10
seconds, safety instrumentation will order reactor trip.
If the reactor power is less than 800 KW, startup channels are active.
The pulse signals from in-core fission chambers will be processed by
conventional analog instrumentation system. As the control rod is
continuously withdrawn, the neutron flux will increase exponentially.
The reactor will be tripped from Tn period from start up channels as
shown below:
Reactor
Temperature Coefficients
Powerρρ
ρ
ρ
f
=
ρe
ρe + ρf
FIGURE 5.2 FEED BACK DUE TO TEMPERATURE COEFFICIENT

67
Typical print out is given below;
Tue Oct 28 13:58:12 IST 2008 Short Period (tow n) channel B 19.817352 Tue Oct 28 14:00:50 IST 2008 Short Period (tow n) channel A 19.684681 Tue Oct 28 14:00:53 IST 2008 Short Period (tow n) channel C 19.676371
If the reactor power is grater than 800KW but less than 62.5 MW,
then Campbell channels are active. Here the fluctuation in the signals
from in-core fission chambers will be analysed. As neutron flux
increases, the pulses will merge with each other and fluctuation in the
signal will increase. The square of standard deviation is the pointer to
the reactor power. In actual plant, as control rod is withdrawn
continuously, rate of raise of power will be used to calculate the
reactor period. But in training simulator, neutron flux will be
calculated by solving point kinetic equation and power signal will be
derived. Reactor will be tripped from period signal from Campbell
channels as shown below:
Tue Oct 28 13:30:39 IST 2008 Short Period (tow p) channel B 19.776554 Tue Oct 28 13:31:15 IST 2008 Short Period (tow p) channel A 19.365410 Tue Oct 28 13:31:23 IST 2008 Short Period (tow p) channel C 19.515614

68
If the reactor power is grater than 62.5 Mw, then power channels are
active. Ex-core fission chamber signals are processed. From the rate of
raise of the signal, reactivity will be calculated and compared against
alarm and scram threshold. In this case, reactor will be tripped from
`reactivity high` signal as shown below:
Tue Oct 28 13:11:45 IST 2008 High Positive Reactivity channel A 5.295407 Threshold >5pcm Tue Oct 28 13:11:45 IST 2008 High Positive Reactivity channel B 5.030636 Threshold >5pcm Tue Oct 28 13:11:45 IST 2008 High Positive Reactivity channel C 5.560177 Threshold >5pcm Tue Oct 28 13:12:54 IST 2008

69
Corresponding messages are displayed in the control panels.
The power will be compared against the trip limit. If power crosses
trip limit, the safety logic will trip the reactor, thus bringing down all
the neutron absorbing rods within the reactor core. The reactivity will
also be compared against the trip limit. Reactor will be shut down on
excessive positive reactivity added due to withdrawal of control rod.
The operator will be trained with the help of display messages
and audible alarms in the control panels.

70
CHAPTER 6
SAFETY RELATED EMBEDDED SYSTEMS
6.1 DESIGN OF SAFETY RELATED EMBEDDED SYSTEM
Physically and functionally distributed embedded systems are used
for supervising and controlling PFBR. The scanned data and messages
created are transmitted to control room through dual optical fibre cables.
The information is received by intelligent display terminals and displayed
to operator. Embedded systems are also used for safety critical
supervision such as reactor core monitoring against flow blockage,
undesirable power excursion, clad hot spot etc. If process parameters
exceed the limits, then embedded systems will generate necessary trip
signals for safety logic systems. Typical configuration of embedded
system, developed in-house, is shown below in Figure 6.1
42
1
1
42
CPU, ROM,&
ECC Memory
AnalogInput ( 6)
DigitalOutput
DigitalInput
To Plant
Databaseserver
Alarm
ReactorStatus
AnalogInput(1)
CommunicationController
VME
SYSTEM
BUS
FAULT TOLERANT DC POWER SUPPLY
Alarm
SURROPSUFRFHRSD
SOLC
Watchdog output as
voltage free contact
DigitalOutput
OR ORINGLOGIC
LOR
LOR
OR
SCRAM
SCRAMSPCS & PDSR
operationalSG safe configuration
status
ORINGLOGIC
DigitalOutput
BUS A
BUS B UPSSUPPLY(230V)
+5V +12V -12V
42
1
1
42
CPU, ROM,&
ECC Memory
AnalogInput ( 6)
DigitalOutput
DigitalInput
To Plant
Databaseserver
Alarm
ReactorStatus
AnalogInput(1)
CommunicationController
VME
SYSTEM
BUS
FAULT TOLERANT DC POWER SUPPLY
Alarm
SURROPSUFRFHRSD
SOLC
Watchdog output as
voltage free contact
DigitalOutput
OR ORINGLOGIC
LOR
LOR
OR
SCRAM
SCRAMSPCS & PDSR
operationalSG safe configuration
status
ORINGLOGIC
DigitalOutput
BUS A
BUS B UPSSUPPLY(230V)
+5V +12V -12V
FIGURE 6.1 ARCHITECTURE OF SAFETY CRITICAL EMBEDDED SYSTEM

71
6.2 CHOICE OF BACK PLANE OR BUS
Back plane or bus is a set of communication system through which CPU
dialogues with memory and Input/output systems. Normally CPU is
made of standard Intel microprocessors (8085, 8086) or Motorola micro
processors (68000, 68020), or Intel micro controllers (8051, 80251) or
Motorola micro controllers (683XX). The software is normally stored in
Read only memory (ROM). Necessary dynamic data is stored Random
Access Read/Write Memory (RAM). Microprocessor reads one by one
the instruction from ROM and executes them. In this process, the
necessary data is stored in RAM. The calculated results are written back
in RAM. For reading the instruction or data from memory, first CPU
will put the required address information in the address bus. The
required service, namely, read command is also put in the command
lines. CPU also puts Master Sync signal in the bus in the case of
asynchronous bus. Memory Unit will put the addressed data in the data
lines. In the case of Asynchronous bus, memory unit will also put “Ack”
signal. On receiving “Ack” signal, CPU will read the data from the data
lines. The cycle is completed.
In the case of write cycle, CPU will put the required address in the
address lines. Data to be written is put in the data lines. CPU then
asserts MSYN signal. Memory will take the data from the data lines and
write it in the required location. Memory Unit will assert slave sync

72
signal. CPU will drop MSYN signal, thus completing the bus cycle.
Similar Read/Write operation takes place between CPU and Input/Output
system. Motorola microprocessors use asynchronous bus. For Intel
microprocessors, synchronous bus is used. Here read or write cycle is
completed within the specified clock cycles. For safety application,
asynchronous bus is recommended. 6.3 DESIGN OF CPU BOARD
Normally CPU board consists of the following:
• Microprocessor or micro controller
• ROM & RAM
• Interconnection bus between CPU and memory
• Bus interface logic
• Watch dog timer
• Clock circuit
Typical block diagram of 68020 based CPU card is given below:

73
FIGURE 6.2 VME BUS BASED CPU CARD RAM memory is prone to failure. It is necessary to detect single bit
memory failure and correct the same. At the same time two bit memory
failure shall be detected and CPU shall be informed through interrupt.
Standard Error detection and correction (EDAC) chip is available in the
market. This is integrated in the CPU card. Watchdog timer shall be
refreshed periodically by the software. Otherwise it will be decremented
by clock. When watchdog timer reaches “zero” then, on-board mounted
relay can be made to de-energise. The change of state of relay contact
can be used to take necessary remedial action. Normally whenever
double bit memory error occurs or if slave-ack is not received in the back
plane (bus) or if the microprocessor hangs, then the watchdog will time-
out.

74
6.4 DESIGN OF ANALOG INPUT CARD
Signals from process sensors like thermocouple, RTD, flow meter,
pressure transducer, level sensor, etc. are first signal conditioned
(amplified, isolated and filtered) and then received by Analog Input Card.
If the process sensor is located at a long distance, then current signal (4-
20 mA) is used. Current signal is less sensitive to
electrostatic/electromagnetic noises. It is always preferable to use
isolation amplifier between the process sensors and Analog to Digital
Converter. This will eliminate circulating ground loop currents.
Analog input card consists of Multiplexer, Analog to Digital
converter, on-board memory and control logic. The block diagram of
typical analog input card is given below:

75
CPU initiates the scanning by issuing the necessary command to
the sequencer. The address input to input multiplexer is incremented in
steps by the sequencer. The multiplexed input signal is analog to digital
converted and stored on the on-board memory. Normally a 12 bit or 16
bit, successive approximation type Analog to Digital Converter (ADC) is
used. In situations where 50HZ pick up from nearby power lines is
dominant, integrating type ADCs may be used for reducing the effects of
this noise. Each Analog input card is provided with on-board calibration
sources, which are in turn, connected to the input multiplexer.
Diagnostic software will analyze the signal level from the calibration
source. This will enable to detect drift in amplifier or error in ADC.
Normally scanning rate shall be greater than double the frequency of the
process signals. To minimize the effect of noise, each sample will be
compared with previous sample. If the difference is greater than the
LOGIC SEQUENCER
(FPGA)
Instrumentation Amplifier
ADC +/ - 10 V
SOC
EOC
Dual Ported SRAM
VME BUS P1
VME Interface Logic
LPF
16:1 Multiplexer (Single ended)
4: 1 Multiplexer(Differential Mode)
Ch 1A
Ch 16A Ch 1B Ch 16B
Ch 48B
FIGURE 6.3 BLOCK DIAGRAM OF ANALOG INPUT CARD

76
allowed limit, then the present sample is discarded. Similarly, to
overcome fluctuating noise, average of ten or fifteen samples is used
instead of the sample itself.
6.5 DESIGN OF DIGITAL INPUT CARD
Digital signals from the process plant are received either as
electrical signal (OV or (5V/12V/24V/32V/48V) or as voltage free relay
contact.
To eliminate the ground loop problem, opto coupler is used for every
digital input signal. CPU periodically reads the status of the digital inputs
and analyses them. Some opto-couplers may fail in conducting or non-
conducting state. State-of-the art digital input cards are provided with
force ‘O’ and force ‘1’ option. This is periodically carried out by on-line
Signal Conditioner Debounce
Logic
Force 0&
Force 1Logic
REGISTERS
Interrupt Logic
V M E B U S I N T E R F A C E
V M E B U S P1
Field Inputs
Debounce Clock
EPLD
P2
FIGURE 6.4 BLOCK DIAGRAM OF DIGITAL INPUT CARD

77
diagnostics to detect the failed opto-coupler. Each digital input card
houses 8 or 16 or 32 or 48 input channels.
6.6 DESIGN OF ANALOG & DIGITAL OUTPUT CARDS
Decision taken by the embedded system is communicated to the plant
equipment through digital output card and Analog output card.
Digital signals are communicated to the plant as voltage free relay
contact or as open collector transistor output.
In the state-of-the art digital output card, there is provision to read
back the status of the output relay. Each relay is provided with two
contacts. One contact is wired to the plant white the other contact is read
back by the CPU. Each digital output card will house 8 or 16 or 32
output channels. The status of each digital output is available through
LED lamp. For safety application; the card is designed such that software
periodically loads the output value in the on-board latch. If
Relays & Status LEDs Output
EnableLogic
Relay Contact Read Back
LATCH
Watch dogTimer, WD
count
V M E B U S I N T E R F A C E
V M E B U S
Field out puts
Time outCLK fail
P2
FIGURE 6.5 BLOCK DIAGRAM OF RELAY OUTPUT CARD

78
microprocessor hangs or software enters endless loop due to memory
fault, then on-board watch dog timer will time out. This in turn will reset
the on-board latch. The digital outputs from latch are wired such that
process safe state is ensured when latch is reset by watchdog timer.
Block diagram of Analog output card is given below.
Analog output signal is available as 4 to 20 mA or as 0 to 5 or 10 V.
For transmitting analog signal over long distance, current mode is
selected. In analog output card, 12 bit DAC is normally used to convert
digital signal to analog signal. Normally each analog output card will
house four analog output channels. If the microprocessor hangs, there is
provision to hold on to the recently sent analog output value, such that
CONTROLLER
DACs
MUX
AMPLIFIER
ADC
VME
BU
S
ISOLATION
& V/I
ISOLATION
Read back
OUTPUT CONNECTOR
FIGURE 6.6 BLOCK DIAGRAM OF ANALOG OUTPUT CARD
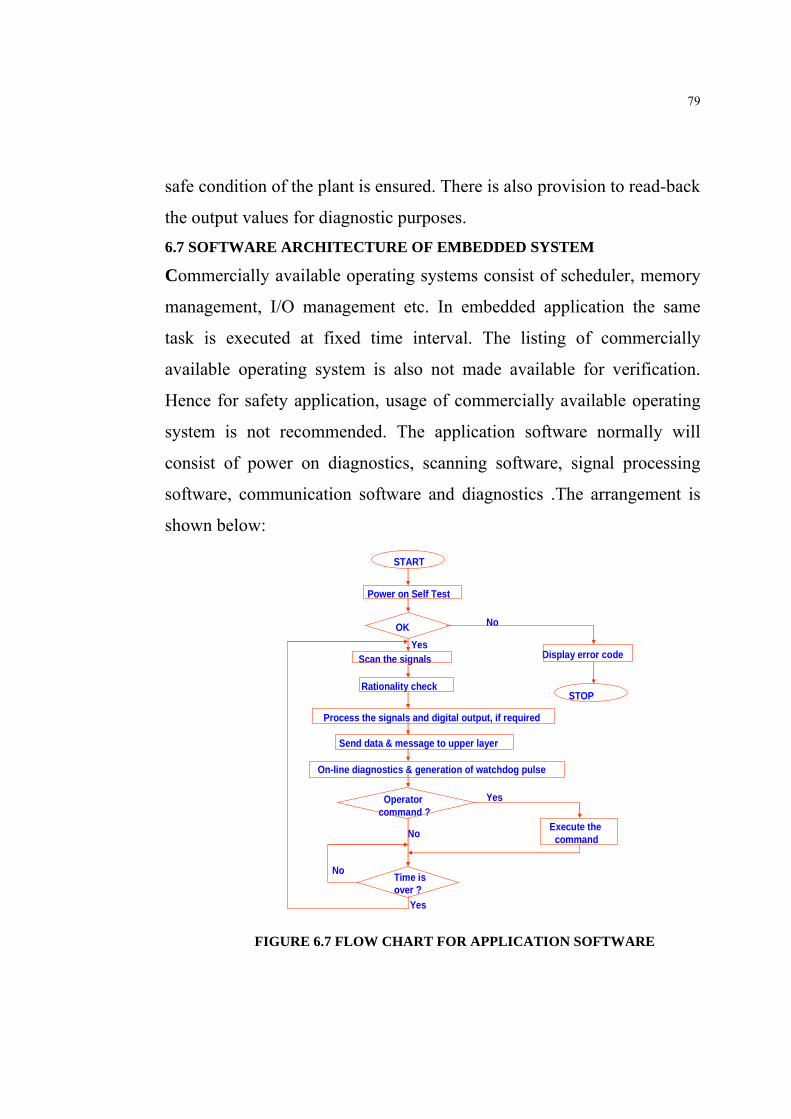
79
safe condition of the plant is ensured. There is also provision to read-back
the output values for diagnostic purposes.
6.7 SOFTWARE ARCHITECTURE OF EMBEDDED SYSTEM
Commercially available operating systems consist of scheduler, memory
management, I/O management etc. In embedded application the same
task is executed at fixed time interval. The listing of commercially
available operating system is also not made available for verification.
Hence for safety application, usage of commercially available operating
system is not recommended. The application software normally will
consist of power on diagnostics, scanning software, signal processing
software, communication software and diagnostics .The arrangement is
shown below:
START
Power on Self Test
OK
Scan the signals
Rationality check
Process the signals and digital output, if required
Send data & message to upper layer
Display error code
STOP
On-line diagnostics & generation of watchdog pulse
Operatorcommand ?
Time is over ?
Execute the command
No
Yes
Yes
No
No
Yes
FIGURE 6.7 FLOW CHART FOR APPLICATION SOFTWARE

80
On powering the system, power-on reset is generated. This in turn gives
control to power-on-self test. During this phase, all parts of hardware will
be checked. If any error is detected then corresponding error code is
displayed and system stops. Otherwise control is given to the scanning
software. During rationality check, the process values will be compared
with absolute low and high of process conditions. If process signal value
is not within the specified validation limits, the sample is rejected. To
minimize the 50HZ noise, average value of the scanned process samples
is taken for further processing. After carrying out the required processing,
necessary analog/digital outputs are delivered to the plant. The
information about the value of the process signal and generated messages
are transmitted to upper layer for display to plant operator. On-line
diagnostics periodically checks all parts of the hardware. If any error is
detected, corresponding error code is displayed in the front panel and
system stops. The value of analog or digital output is forced to fail-safe
state with respect to the process plant. Provision is also made in the
software such that plant operator will be able to edit software threshold
through Dump terminal. After the specified time interval, control is given
back to scanning software once again.

81
6.8 PROCESS MODELS
6.8.1 WATERFALL MODEL
The waterfall model is a sequential software development model (a
process for the creation of software) in which development is seen as
flowing steadily downwards (like a waterfall) through the phases of
requirements analysis, design, implementation, testing (validation),
integration, and maintenance.
Waterfall model is used in the development of embedded system for
safety application, where requirement is well understood. Relevant IEEE
standards are to be followed at every life cycle stage of development of
embedded system as shown below:

82
Quality Assurance (Q.A.): QA process at every life cycle involves
checking the conformance of the product to specified standards.
Verification: Verification involves checking the conformance of product
at every life cycle stage to requirement specification.
System Requirements Specification (IEEE 1233Std.)
System Architectural Design
System Integrated
Test Document (IEEE Std. 829)
Hardware Requirements Specification
Hardware Design & Development
Testing
Software Requirement Specifications (IEEE Std. 830)
Software Design & Development
Software Implementation
Module level Testing
VERIFICATION
VERIFICATION
VERIFICATIONQA VERIFICATION QA
Hardware
VERIFICATIONQA
VERIFICATIONQA
VERIFICATION QA
VERIFICATION QA
VERIFICATION
System
System in Operation
Validation
FIGURE 6.8 SOFTWARE LIFE CYCLE

83
Validation: Validation involves checking the final system for compliance
to requirement specification of the end-user. There is need to carryout
independent verification and validation at every life cycle stage of
development of embedded system. FORMAL method is also
recommended in modeling the requirement specification of embedded
system. Either Z or B language is used in modeling the specification. It is
very important to acquire necessary domain knowledge of the process for
finalising the requirement specification. Any error in the requirement will
sail through the final stage and it will be very costly to rectify the error.
Asynchronous VME bus was chosen to get confirmation for each
bus transaction. Memory with single bit error correction and double bit
error detection feature is used. In every analog input board, calibration
sources are available to detect the drift in amplifier, faults in ADC etc.
Optocoupler is used to isolate the field ground from computer ground in
digital input card. To detect failure of optocouplers, on-line features for
forcing logical zero and logical one are provided. In digital output card,
read back facility is provided to monitor the health of output channels.
Each digital output card is provided with watchdog feature such that if
CPU fails to refresh the output, watchdog will time out, thus forcing the
digital outputs to “SAFE” state for the nuclear reactor. If any fault is
detected, watch dog will time out and error messages will be transmitted
to the control room. Due to safety reasons, commercial operating system
is not used. Simple monitor software is developed in-house.
All the application software is developed in “C” language,
honoring MISRA-C guidelines.

84
6.9 SAFETY ANALYSIS OF EMBEDDED SYSTEMS For safety application safety analysis need to be carried out at every
development life cycle stage of embedded system as shown below:
6.9.1 SAFETY ANALYSIS OF SYSTEM ARCHITECTURAL DESIGN
System architectural design shall be analysed in detail to establish
that all system level safety requirements are carried into the system
design and allocated to software or hardware or a combination of them.
The system level hazards shall be traced through the system architecture
to show that hazardous states cannot occur. The design shall be shown to
Safety Analysis of System Architectural Design
Safety analysis of Software Requirements specification
Safety Analysis of Software Design and Implementation
Safety Analysis of Hardware Requirements Specification
Safety Analysis of Hardware Design and Implementation
Safety Testing
Safety Audit Report
FIGURE 6.9 LIFE CYCLE FOR SAFETY ANALYSIS

85
be fail-safe taking into account the various failure modes of hardware and
software.
6.9.2 SAFETY ANALYSIS OF SOFTWARE REQUIREMENTS SPECIFICATION
Analysis of software requirements specification shall be carried out
to establish that it incorporates all system level safety requirements
allocated to software and they are clearly described, and are testable.
These should include the on-line (in service) safety test requirements,
mandated by the technical specifications of the plant and to be
implemented in software.
6.9.3 SAFETY ANALYSIS OF HARDWARE REQUIREMENTS SPECIFICATION
Analysis of hardware requirements specification shall be carried
out to establish that it incorporates all system level safety requirements
allocated to hardware and they are clearly described, and are testable.
These should include the on-line (in service) safety test requirements,
mandated by the technical specifications of the plant and to be
implemented in hardware.
6.9.4 SAFETY ANALYSIS OF SOFTWARE DESIGN AND IMPLEMENTATION
Software design and implementation shall be analysed in detail to
establish that software design and implementation incorporates all safety
requirements given in Software Requirements Specifications. Analysis
should establish that software satisfies all safety requirements, does not
cause any unsafe action under any operating condition and allows on-line
tests to be carried out without compromising the performance of safety
functions. The design of the software shall be shown to handle hardware

86
failures gracefully without causing unsafe conditions in the plant.
Catastrophic failure of the software (i.e. when it is not able to perform the
intended function) should be shown to lead to fail safe outputs from the
Computer-based System (i.e. safe conditions in the plant).
6.9.5 SAFETY ANALYSIS OF HARDWARE DESIGN
Hardware design shall be analysed in detail to establish that
hardware incorporates all safety requirements given in Hardware
Requirements Specifications. Analysis should establish that hardware
satisfies all safety requirements, does not cause any unsafe action under
any operating condition and allows on-line tests to be carried out without
compromising the performance of safety functions. Failure of the
hardware should be shown to lead to fail safe outputs from the Computer-
based System (i.e. safe conditions in the plant). 6.9. 6 SAFETY TESTING
The system shall be subjected to tests that will confirm its overall
safe behavior. This is the final demonstration safety. The testing shall be
done to check that
1. All safety requirements are correctly implemented
2. System behavior is failsafe.
3. All on-line tests can be conducted without compromising the
performance of safety functions.
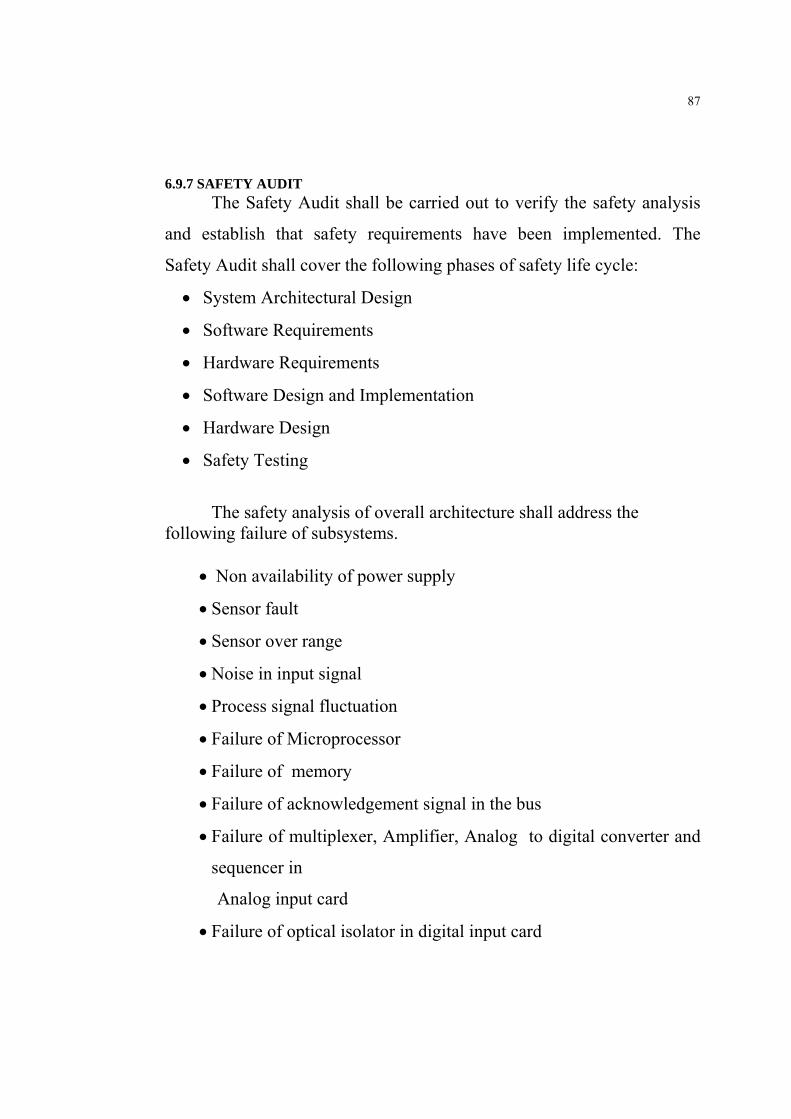
87
6.9.7 SAFETY AUDIT The Safety Audit shall be carried out to verify the safety analysis
and establish that safety requirements have been implemented. The
Safety Audit shall cover the following phases of safety life cycle:
• System Architectural Design
• Software Requirements
• Hardware Requirements
• Software Design and Implementation
• Hardware Design
• Safety Testing
The safety analysis of overall architecture shall address the following failure of subsystems.
• Non availability of power supply
• Sensor fault
• Sensor over range
• Noise in input signal
• Process signal fluctuation
• Failure of Microprocessor
• Failure of memory
• Failure of acknowledgement signal in the bus
• Failure of multiplexer, Amplifier, Analog to digital converter and
sequencer in
Analog input card
• Failure of optical isolator in digital input card

88
• Failure of latch and relay in digital output card
• Endless loop in application software
• Irrational data entry for changing software threshold
• Failure of data server and message sensor and graphic user
terminals
A general fault tree shall be constructed. The design shall ensure that
any postulated fault will result in ordering digital output, which in turn
ensures safe state of the nuclear reactor.
6.10 RELIABILITY ANALYSIS OF EMBEDDED SYSTEM
Faults in embedded systems can be classified as safe fault and
unsafe fault. If the fault results in ordering analog or digital outputs for
placing the process in safe state, then the fault is classified as safe faults.
The failure of power supply of the embedded system is example of safe
fault. On the other hand, if there is demand for shut down of the plant,
and if shut down order is not delivered, then the fault is defined as unsafe
fault. Again the unsafe fault is further classified as on-line detectable
unsafe faults and on-line undetectable unsafe faults. In embedded system,
on-line diagnostics will detect unsafe fault such as drift in signal
amplifier, ADC fault, memory fault, failure of opto coupler in digital
input/output cards, failure of ACK signal etc.
If any fault is detected, on-line diagnostics will not refresh watch dog
timer. This will result in time out of watch dog timer thus resulting
delivery of shutdown order to the process. There are still unsafe faults
which can not be detected such as failure in watch dog circuit, welding of

89
relay contacts in digital output card etc. The safe fault or failure rate is
represented as λs. The failure rate of unsafe faults which can be detected
by on-line diagnostics is represented as λu1. The failure rate of unsafe
faults which can not be detected by on-line diagnostics is represented as
λu2.
6.10.1 SAFE FAILURES & UNSAFE FAILURES
The total failure rate in the system can be divided into Safe and unsafe
(dangerous) failures.
Generally embedded systems used in process applications will follow one of the configurations discussed below.
(i) 1/2 CONFIGURATION: In this model two identical systems are operational as shown below. Overall Unsafe failure rate = λu2 * λu2 Overall Safe failure rate = λs + λs + λu1 + λu1
FIGURE 6.10 1/2VOTING LOGIC Thus 1/2 configuration ensures safety but causes high spurious trips.
Sensor + Signal conditioning
Processing circuit
Processing circuit
1/2 Voting Logic

90
(ii) 2/2 CONFIGURATION: In 2/2 model, two identified systems will be processing the input signals
but outputs will be routed through 2/2 logic as shown below.
Overall Unsafe failure rate = λu2 + λu2 = 2λu2
Overall Safe failure rate = (λs + λu1)* (λs + λu1) = ( λs + λu1)2
In this configuration safe failure rate is satisfactory but unsafe failure rate may not be acceptable.
FIGURE 6.11 2/2VOTING LOGIC
(iii) HOT STANDBY LOGIC: In fault tolerant model, two identical systems are operational. One
will be acting as main system while the other will be acting as hot
standby. If main system fails, automatic switchover will take place to
connect active standby system. The architecture is shown below.
Sensor + Signal
conditioning
Processing circuit
Processing circuit
2/2 Voting Logic

91
FIGURE 6.12 HOT STANDBY LOGIC
Unsafe failure rate (assuming Reliability of switch over logic is unity) =
λu2 Overall Safe failure rate assuming that Reliability of switch over logic is
unity = (λs + λu1)2
Disadvantage of this configuration is that unsafe faults which are not
detected by online diagnostics will not cause switch over. Switch over
logic system and ORing logic may fail in unsafe mode thus affecting the
safety of the Process Plant.
(iv) 2/3 CONFIGURATION:
In this model, three identical signal-processing systems are used as
shown below. Trip outputs are routed through 2/3 voting logic.
Overall Unsafe failure rate = 3λu22
Overall Safe failure rate = 3 (λs + λu1)2
Sensor + Signal conditioning
Processing circuit
ORing Logic
Processing circuit
SOLC

92
This model balances between safety and availability with minimum cost.
Normally 2/3 architecture is used for safety critical instrumentation
system as shown below.
FIGURE 6.13 2/3 VOTING LOGIC If the same hardware and application software in used in fault tolerant
architecture, common mode problems can not be avoided. To avoid
common mode problem, hardware and software systems shall be
developed by three diverse teams. However, maintenance of diverse
systems is not easy during operation and maintenance phase. It is not possible to have actual embedded systems as part of Training
Simulator. The supervisory functions of each of eighty embedded
systems are simulated. Each embedded system is provided with a tag
name. Training Supervisor will introduce faults in any one of the
embedded systems such as CPU card errors (memory error, bus error,
floating point processor error, hang-up of micro processor), Analog input
Sensor + Signal conditioning
Processing circuit
Processing circuit
2/3 Voting Logic Processing
circuit

93
card errors(ADC fault, Amplifier drift, Multiplexer fault), Digital input
card errors(Opto coupler fault), Digital output card errors(latch fault,
relay fault) through supervisor terminal. Corresponding error messages
will be generated and status display will also be updated as shown in fig-
12.The color of faulty embedded system will change from green to red in
display unit.
Overall Status of Embedded SystemsRCB SGB-1 SGB-2 CB FBCTM - 1
CTM - 2
CTM - 3
PCSL- 1
SLFIT- 1
SSSB- 1
SSSB - 2
SSTM - 1
SSTM- 2
SUR- 1
SUR- 2
SUF - 1
SUF - 2
DISC-1
DISC-2
SGDHR - 1
SGDHR - 2
SGTLD - 1
AGS - 2
SGDHR - 3
SGDHR - 4
SGTLD - 2
AGS - 2
RCB - Reactor containment Building
SGB - Steam Generator Building
CB - Control Building
FB - Fuel Building
CTM - Core Temperature Monitoring System
PCSL - Interface to Pulse Coded Safety Logic
SLFIT - Interface to Safety Logic with Fine Impulse Test
SGDHR - Steam Generator Decay Heat Removal system
SGTLD - Steam Generator Tube Leak Detection System
AGS - alarm Generation system
SUR - Startup of Reactor conditions checking System
SUF - Startup of Fuel Handling conditions checking System
DISC - Discordance Supervision System
SSSB - Spent Sub-assembly Storage Bay
SSTM - Spent Sub-Assembly Transfer Machine
Instructor can select any of the 80 embedded systems and introduce faults
(CPU card fault, Analog Input card fault, Digital input card fault, Digital
output card fault, Analog output card fault), Corresponding error
messages are displayed. The status of the corresponding embedded
system will be red in colour.
The digital outputs from the corresponding embedded system will reach
fail safe state. Typical snapshots from Instructor panel are given below.

94
The triplicated embedded system of Core Temperature Monitoring
System is taken as case study. Initially healthy conditions of Safety
Critical embedded systems are displayed as shown below.
Instructor Selects Core Temperature Monitoring (CTM)
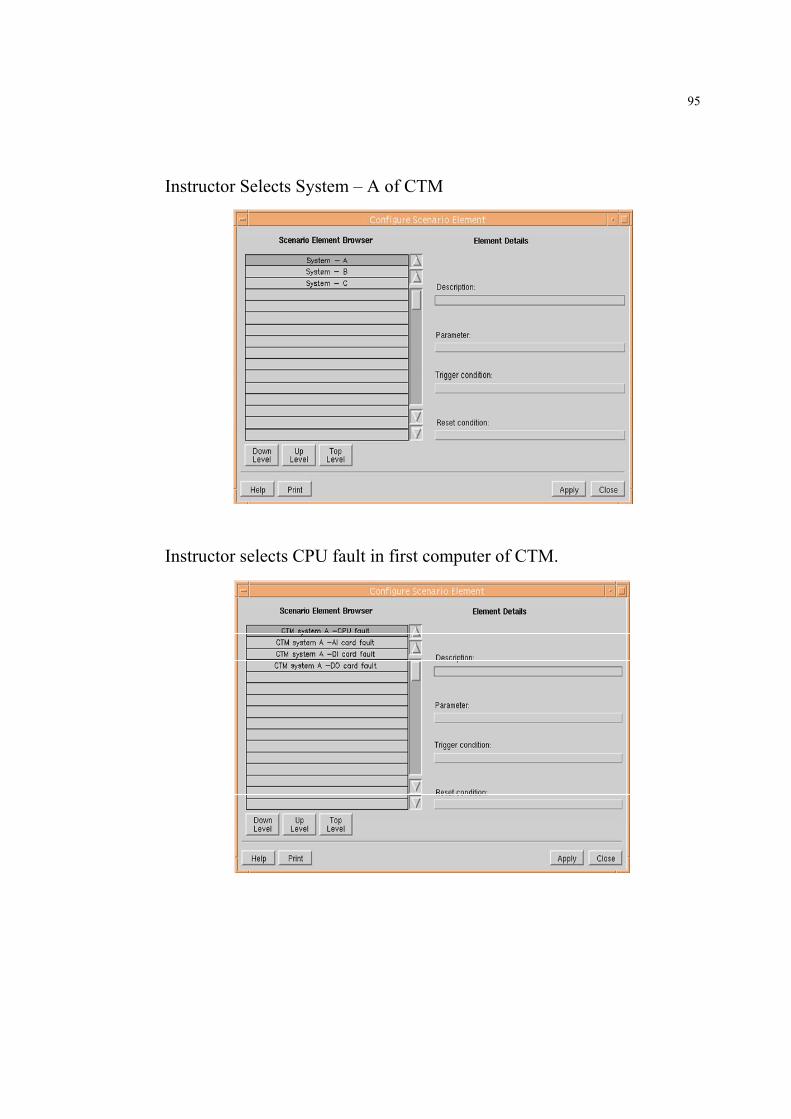
95
Instructor Selects System – A of CTM
Instructor selects CPU fault in first computer of CTM.

96
CTM System – A, CPU Fault is enabled
Typical Printout is shown below

96
CHAPTER 7 MODELING OF START-UP CONDITIONS FOR THE
REACTOR
7.1 INTRODUCTION At any given time reactor will be in anyone of the following
five states namely Reactor in Operation state (ROP), Reactor in
shutdown state (RSD), Reactor in Fuel handling state (RFH), Reactor
Startup (RSU) and Fuel handling startup (FSU). Reactor moves to
operation state from shutdown state through reactor startup state.
Likewise Reactor moves from shutdown state to fuel handling state
through fuel handling startup state. RSD, RFH, ROP are stable states
of the reactor. RSU, FSU are transient states of the reactor.
FIGURE 7.1 STATES OF REACTOR
In order to have safe and smooth transition from reactor in
shutdown state (RSD) to reactor in operation state (ROP) several
global conditions are required to be fulfilled. Reactor startup logic
RSU FSU
ROP RFH
RSD

97
checks these conditions and gives authorization to start the reactor
when all the conditions are fulfilled.
Startup logic block checks all the conditions and generates
authorization outputs to start the reactor when all the conditions are
fulfilled. Simulator block is used to simulate various plant system’s
conditions as well as malfunctions. Output/display block provides
indications/displays about various conditions, authorization / No
authorization, etc. Context diagram of Reactor startup system is
shown below.

98
FIGURE 7.2 CONTEXT DIAGRAM FOR REACTOR STARTUP LOGIC
CSRDM control logic
Display station
Simulator for various plant systems
DSRDM control logic
Digital Output
Digital Output
Window Alarms
Reactor Startup Logic
Soft inputs
Inhibition key switches
Digital Inputs
Digital Outputs
Soft Outputs
Administrative key switches
Digital Inputs

99
Reactor startup logic (RSUL) checks plant system conditions,
inhibition inputs and administrative key inputs, does the processing
and generates authorization outputs to control logics of CSRDM &
DSRDM in order to raise Control & Safety Rods and Diverse Safety
Rods. Each of the RSU conditions can be inhibited by inhibition
switches. When a condition is inhibited then that condition is treated
as satisfied. Simulator is used to provide plant systems conditions to
reactor startup logic.
7.2 REACTOR STARTUP LOGIC (RSUL) BLOCK
• This block checks the conditions which are required for
startup of Reactor.
• In addition to the conditions listed, this block scans the
administratively controlled key operated switches. One switch
is for ‘RSU authorization’ and another one is for ‘RSU
inhibition authorization’. When all the conditions are satisfied
then the operator, operates the ‘RSU authorization’ switch.
RSUL generates the authorization outputs to control logic of
CSRDM & DSRDM only when the ‘RSU authorization’
switch input is high.
• If any one or more conditions are required to be inhibited then
the ‘RSU inhibition authorization’ switch will be operated and
then the actual inhibition switches will be operated. RSUL
reads the status of ‘RSU inhibition authorization’. If this input
is high then RSUL reads the actual inhibition inputs.

100
• Each of the input conditions can be inhibited by the inhibition
switches which are provided in CR. If the input condition is
inhibited then that condition is treated as satisfied.
• RSUL checks each of the conditions listed in section 2.2.1 &
corresponding inhibition inputs and it generates four potential
free contact outputs as authorization outputs for reactor
startup, when all the conditions are satisfied/inhibited. These
potential free contact outputs are connected to control logic of
CSRDM & DSRDM.
• When all the conditions are satisfied then the same is
displayed through a hardwired lamp indication on CR control
panel. This system generates a potential free contact output for
the hardwired indication.
• When anyone or more conditions are inhibited the same is
displayed through a hardwired lamp indication on CR control
panel and the same is annunciated through window alarm.
This system generates two separate potential free contact
outputs for the hardwired indication & alarm annunciation.
• When the reactor startup authorization is given, the same is
displayed through a hardwired lamp indication on CR control
panel. This system generates a potential free contact output for
this purpose.
• When anyone or more conditions are not satisfied the same is
annunciated through window alarm. This system generates a
potential free contact output for the alarm annunciation.

101
7.3 INPUT CONDITIONS
Reactor startup logic checks the following conditions and gives
authorization to raise the CSRs & DSRs when these conditions are
fulfilled.
Condition 1: CSRDM & DSRDM in poised state
The global condition for CSRDM is considered as fulfilled when
the following sub conditions are satisfied.
• All the electromagnets are at bottom position with force limiter
micro switches actuated
• All grippers open on head of CSRs
• All electromagnets are energized
• 415V UPS power supply for CSRDM motors available
• All lifting plates at bottom position
These sub-conditions are checked by the control logic of CSRDM
and give a potential free contact input to reactor startup logic. There
are 3 control logics to control 9 CSRs. Each control logic gives one
potential free contact.
The global condition for DSRDM is considered as fulfilled when
the following sub-conditions are satisfied.
• All the electromagnets are at bottom position with torque limit
switch actuated
• All electromagnets are energized
• All support rods are in unlocked condition
• 415V UPS power supply for DSRDM motors available
These sub-conditions are checked by the control logic of DSRDM
and give a potential free contact input to reactor startup logic.

102
Condition 2: Primary sodium level, temperature and flow normal
This global condition is considered as fulfilled when the following
sub conditions are satisfied. RSUL receives this information from
process computer of DDCS.
• Hot pool sodium level in main vessel is at appropriate level
• Temperature at the suction of the two primary sodium pumps is
more than 473K
• Primary sodium flow rate measured at each of the two primary
sodium pump outlet sensed by eddy current flow meter is more
than 20% of nominal flow (i.e. 3.636 tones/sec)
• Both primary pumps are on their main motor
• Power supply to pony motors available
Condition 3: Primary sodium plugging temperature at correct
level
Plugging temperature of working plugging indicator shall be less
than 393 K. RSUL receive this input from process computer of DDCS.
Condition 4: Primary argon cover gas system in poised condition
This global condition is considered as fulfilled when the following
sub conditions are satisfied.
• Primary argon cover gas system pressure is maintained within
the range of 111±1 kPa
• Nitrogen impurity level in cover gas measured by Gas
Chromatograph is less than 2000 vpm
• Valves in argon circuit in either open / close position as
required for normal operation

103
These conditions are checked by the primary argon cover gas
system and it gives the status input to process computer of DDCS.
RSUL receive this status input from process computer
Condition 5: Primary Argon cover gas purity monitoring system
in service
Nitrogen & Methane impurity in primary argon cover gas is
measured by chromatograph. Nitrogen impurity level shall be less than
2000 vpm & Methane impurity level shall be less than 10 vpm. The
operator has to check these impurity levels and authorization shall be
given through key operated switch when these impurity levels are
within the specified value.
Condition 6: Temperature of primary argon hot line is normal
Temperature of all hot argon lines shall be more than 423 K. This
is checked by the primary argon cover gas system and it gives the
status input to process computer of DDCS. RSUL receive this status
input from process computer.
Condition 7: All four SGDHR circuits in poised state
This global condition is considered as fulfilled when the following
sub conditions are satisfied.
• Sodium flow rate is ≥ 6 kg/sec per loop
• No sodium leak in SGDHR loop
• Both inlet air dampers and both outlet air dampers are kept in
crack open condition

104
• A minimum desired level of sodium in the SGDHR expansion
tank ensures that there is no sodium leak in SGDHR circuit and
this condition is monitored by low level discontinuous level
probe
• Sodium temperature at the outlet of AHX is more than 433 K
• SGDHR sodium plugging temperature is less than 393 K
• Expansion tank & storage tank argon pressure normal
• Sodium level in storage tank below threshold
• Class I 220V DC power supply to electrically operated dampers
healthy
• Pneumatic air supply to Pneumatic dampers healthy
Each SGDHR system checks these sub conditions and gives a
status input to process computer of DDCS. RSUL receive these status
inputs from process computer.
Condition 8: Secondary sodium flow & temperature normal
• Flow of sodium in each loop shall be more than 20% of nominal
flow (584kg/sec)
• Temperature of sodium at the inlet of secondary pumps shall be
more than 468 K
• Pneumatically operated dump valves are selected in CR mode
RSUL receives these inputs from process computer of DDCS and it
has to check each of the above mentioned condition.
Condition 9: Secondary sodium system in poised condition
Poised state of secondary sodium system is ensured by open / close
status of the required manually operated valves (valve list will be
provided later). Operator has to check valve status and if the condition

105
is satisfied then, he has to turn on the key operated switch for
administrative control.
Condition 10: Temperature of all secondary sodium dump and
drain lines sufficient
This global condition is considered as satisfied when the following
sub conditions are satisfied.
• Temperature of dump lines is more than 448 K (175°C)
• Temperature of drain lines is more than 473 K (200°C)
• Pneumatically operated dump valves are selected in CR mode
• Manual valves in the dump and drain lines are in locked open
condition
RSUL receives these inputs from process computer of DDCS and it
has to check each of the above mentioned condition.
Condition 11: Secondary cover gas system in poised state
Secondary argon pressure shall be equal to 400 ± 5kPa. RSUL
receives this information from process computer of DDCS and it has
to check the condition.
Condition 12: Safety logic in service
This condition is treated as fulfilled when the following sub
conditions are satisfied.
• SCRAM logic healthy
• Fine impulse test healthy
• PCSL healthy
RSUL receive these inputs from process computer of DDCS.

106
Condition 13: Neutronic channels in good condition
This condition is treated as fulfilled when the following sub
conditions are satisfied.
• 3 pulse channels are in good operation
• 3 Campbell / DC channels are in good operation
• 3 P/Q channels are in good operation
• 3 reactivity safety channels are in good operation
• 2 control channels are in good operation
• 2 reactivity control channels are in good operation
• Reactivity and vernier channels are in good operation
RSUL receives these inputs from process computer of DDCS and it
has to check each of the above mentioned condition.
Condition 14: Core Temperature Monitoring system in service
This condition is treated as fulfilled when the following sub
conditions are satisfied.
• All the 3 RTC based systems are healthy
• All the 3 hardwired systems for central subassembly
temperature monitoring in good operation
• All the 3 hardwired systems for core inlet temperature
monitoring in good operation
RSUL receives these inputs from process computer of DDCS and it
has to check each of the above mentioned condition.
Condition 15: Fission Gas detection circuit in service
This condition is treated as fulfilled when the following sub
conditions are satisfied.
• Valve on the argon sampling line from reactor vessel is open

107
• Instrument channels are in good condition
• Compressor is in operation and argon flow rate is more than 12
lpm
Fission gas detection system checks these sub conditions and gives
a status input to process computer of DDCS. RSUL receive this status
input from process computer.
Condition 16: Bulk DND system in service
This condition is treated as fulfilled when the 24 number of bulk
DND channels are in good operation. RSUL receive these inputs from
process computer.
Condition 17: FFLM system in poised condition
This condition is treated as fulfilled when the following sub
conditions are satisfied.
• Counting channels are healthy
• Power supply system for DC conduction pump and flow meter
channel is healthy
• Positional drive system is healthy
Operator has to check these sub condition and when the conditions
are satisfied then, he has to turn on the key operated switch for
administrative control.
Condition 18: Hydrogen detection system in sodium & cover gas
in secondary sodium system is available
This condition is treated as fulfilled when the following sub
conditions are satisfied.
• Hydrogen in argon detection system in good operation
• Hydrogen in sodium detection system in good operation

108
RSUL receive these inputs from process computer
Condition 19: Top shield argon system pressure normal
• Top shield argon pressure shall be 300 ± 15 kPa
• Top shield argon flow shall be 200 lph
RSUL receive these inputs from process computer
Condition 20: Inflatable seals normal
This condition is treated as fulfilled when the following sub
conditions are satisfied
• The backup seal is lowered into position as sensed by the limit
switch
• Upper inflatable seals are in deflated condition
• Lower inflatable seals are inflated to a pressure of 70 ± 2 kPa
(g)
RSUL receive these inputs from process computer.
Condition 21: Top shield cooling circuit in service
This condition is treated as fulfilled when the following sub
conditions are satisfied.
• Temperature of all the 28 number of selected thermocouples
located at bottom plate of top shield is between 383 K and
398 K
• Airflow rate at the inlet header measured is within the desired
range
• Top shield cooling circuit air pressure with respect to RCB
atmosphere is maintained higher between 1 to 2 kPa
• Open and closed status of required valves in the circuit

109
Top shield cooling system checks these sub conditions and gives a
status input to process computer of DDCS. RSUL receive this status
input from process computer.
Condition 22: Main vessel leak detection system in operation
This condition is treated as fulfilled when the following sub
conditions are satisfied.
• SPLD channels are in good operation
• MILD channels are in good operation
• EELD channels are in good operation
RSUL receive these inputs from process computer
Condition 23: Safety vessel nitrogen system in service
Safety vessel nitrogen pressure shall be maintained at 104 ± 0.5
kPa (abs). RSUL receive this input from process computer.
Condition 24: Reactor vault nitrogen system in service
Reactor vessel nitrogen pressure shall be maintained between
101.25 kPa to 101.5 kPa (abs). RSUL receive this input from process
computer.
Condition 25: Biological shield concrete temperature below limit
Biological shield concrete temperature shall be less than 333 K.
RSUL receive this input from process computer.
Condition 26: Under Sodium Ultrasonic Scanner (USUS) shield
plug in position
The observation canal shield plug shall be in position. Magnetic
reed switch is provided to check the position of shield plug. When the
110
shield plug is present then the switch gets closed which is connected
as the input to digital input card of the RSUL system.
Condition 27: Rotatable plugs normal
This condition is treated as fulfilled when the following sub
conditions are satisfied.
• LRP and SRP is brought to position corresponding to normal
operation of the reactor
• LRP and SRP are locked in 0° position
• The temporary cooling circuit for LRP and SRP cooling is
removed and the plug pipes of top shield cooling system are
reconnected
• All disconnect able connectors are reconnected
Control logic of rotatable plugs checks these sub conditions and
give a status input to process computer of DDCS. RSUL receive this
status input from process computer.
Condition 28: Transfer Arm in parking position
This condition is treated as fulfilled when the following sub
conditions are satisfied.
• Guide tube at reactor operation position (hardwired dual input
to RSUL)
• Gripper hoist locked at reactor operation position
• Top structure at 0° position
• Gripper fingers closed
RSUL receive these inputs from process computer

111
Condition 29: Inclined Fuel Transfer Machine (IFTM) normal
This condition is treated as fulfilled when the following sub
conditions are satisfied.
• The transfer pot with dummy subassembly is raised to topmost
position in rotatable shield plug
• The rotatable shield leg is locked at parking position
• Inflatable seal pressure is maintained at 45kPa
• Hot argon flushing is switched off
• The shield plug, the primary gate valve and the secondary gate
valve are in closed condition (hardwired inputs to RSUL)
RSUL receive these inputs from process computer.
Condition 30: Steam water system available
Steam water system shall be available before reactor startup. RSUL
receive the availability of this system from process computer.
Condition 31: Feed water chemistry acceptable
This condition is treated as fulfilled when the following sub
conditions are satisfied.
• Package boiler is operating
• Both condenser cooling water pumps are available
• Condensate polishing unit available
• Required feed water quality is reached
• All boiler feed pumps are available
• Deaerator water temperature is more than 423 K
• Moisture separator tank in the main steam system available
• Turbine bypass systems available
RSUL receive these inputs from process computer.
112
Condition 32: Batteries of Pony motors of primary sodium pumps
in poised state
Both the battery banks for the pony motors of primary sodium
pumps shall be in fully charged condition. RSUL receive these inputs
from process computer.
Condition 33: All the four emergency diesel generators are
available
All the four emergency diesel generators shall be in poised state.
RSUL receive these inputs from process computer.
Condition 34: RCB Air conditioning & Ventilation (AC & V)
system in service
This condition is treated as fulfilled when the following sub
conditions are satisfied.
• All 12 numbers of isolation dampers fully open
• Any two out of the three recirculation AHU blowers are
running, associated dampers are open and chilled water valves
are fully open
• One of the two exhaust blowers of the fresh air and exhaust air
system is running and associated damper is fully open
RCB AC & V system checks these sub conditions and gives a
status input to process computer of DDCS. RSUL receive this status
input from process computer.

113
Condition 35: Emergency bypass exhaust air system of RCB is in
poised state
The blowers BLRrb80-003A / BLRrb80-003B and associated
dampers DMPrb80-007, DMPrb80-008, DMPrb80-009 shall be in
poised state. Operator has to check these conditions and when the
conditions are satisfied then, he has to turn on the key operated switch
for administrative control.
Condition 36: Radiation Monitoring System (RMS) of RCB
isolation logic in service
All the RCB isolation system radiation monitors shall be in good
operation. RSUL receive these inputs from process computer.
Condition 37: Distributed Digital Control System (DDCS) in
healthy state
This condition is treated as fulfilled when the following sub
conditions are satisfied.
• All the three redundant data highways in good operation
• All the DDCS RTCs in good operation
• All the display stations in good operation
• Plant computers in good operation
Process computer of DDCS checks these sub conditions and it
gives a status input to RSUL.
Condition 38: Post Accident Monitoring (PAM) system in service

114
PAM system shall be in good operation before reactor startup.
PAM provides its healthiness to process computer. RSUL receive the
healthiness of PAM from process computer.
Condition 39: SSSB cooling and purification system in poised
state
SSSB system shall be in poised state before reactor startup. SSSB
provides its healthiness to process computer. RSUL receive the
healthiness of SSSB from process computer.
NOTE: Status input from process computer is ‘1’ when the condition
is satisfied and ‘0’ when the condition is not satisfied.
The conditions are simulated from the Instructor’s desk as shown
below.
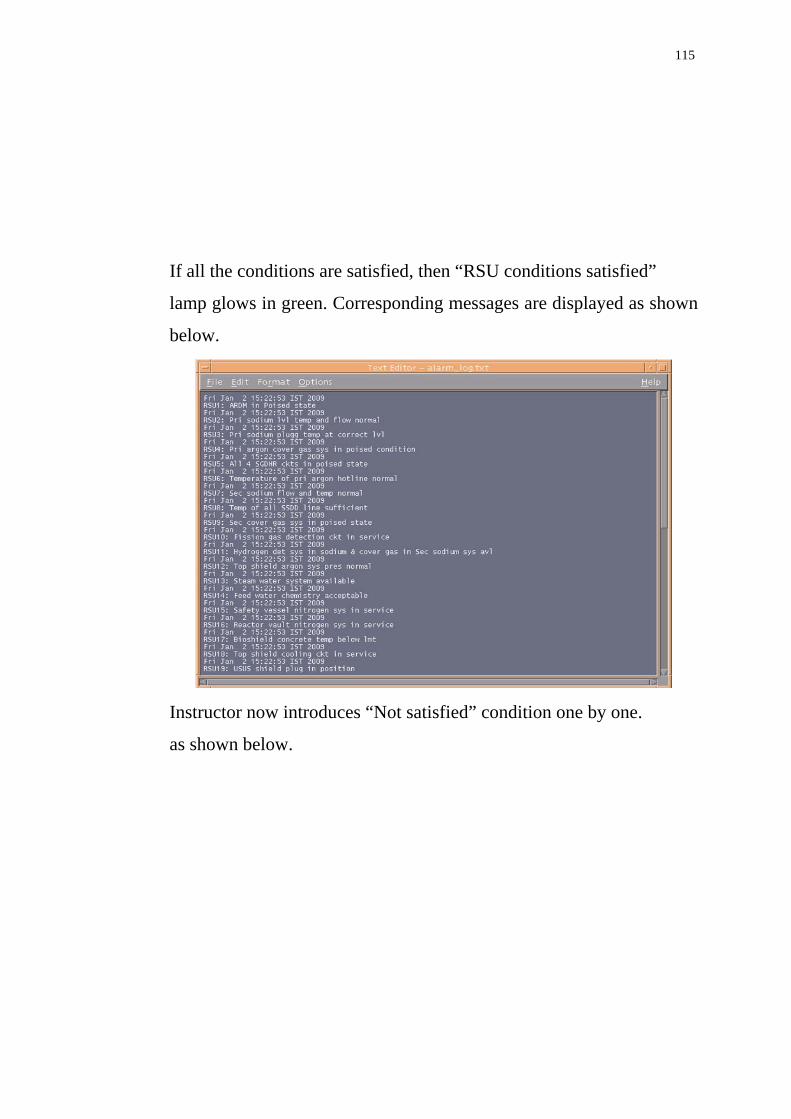
115
If all the conditions are satisfied, then “RSU conditions satisfied”
lamp glows in green. Corresponding messages are displayed as shown
below.
Instructor now introduces “Not satisfied” condition one by one.
as shown below.

116
Corresponding error message is displayed and RSU
Satisfied lamp glows red.
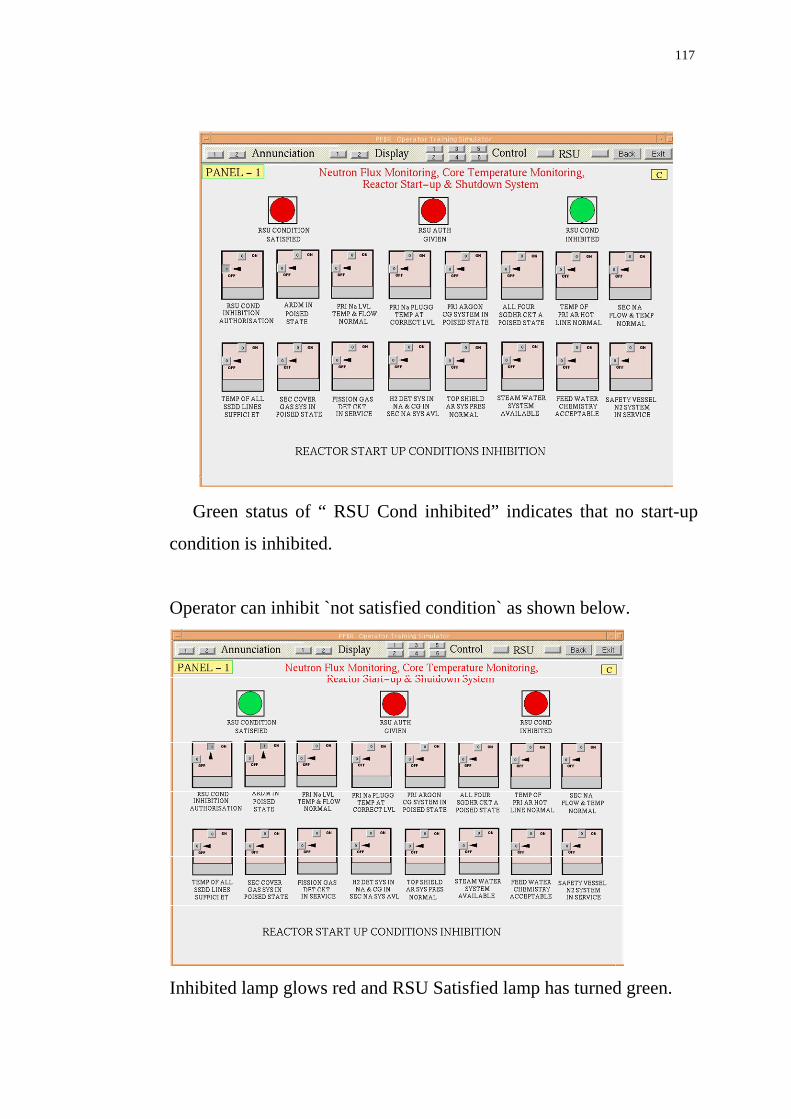
117
Green status of “ RSU Cond inhibited” indicates that no start-up
condition is inhibited.
Operator can inhibit `not satisfied condition` as shown below.
Inhibited lamp glows red and RSU Satisfied lamp has turned green.

118
Corresponding message is also displayed.
After satisfying all the conditions, startup authorisation is now given.

119
Now Startup authorisation lamp turns green and now operator can
raise control rod for starting the reactor. This process is repeated for
all the 39 conditions in order to provide comprehensive training to the
operator. Final condition is shown below.

120
7.3 FLOW CHART FOR MODELING RSU LOGIC.
Scan the inhibition inputs, simulator inputs, administrative key inputs
Is condition 1 inhibited
Is condition 1 satisfied
Start
Authorization flag = 1
Display Condition 1 inhibited
Authorization flag = 0; Display Condition 1 not satisfied
Is condition 39 inhibited
Is condition 39 satisfied
Display Condition 39 inhibited
Authorization flag = 0; Display Condition 39 not satisfied
Is authorization flag = 1
Authorization to start the reactor
No Authorization
No
Yes
No
Yes
No No
Yes
Yes No
Yes
Scan the SUR /ROP switch input
If input =1
yes
No
Yes

121
CHAPTER 8 MODELING OF FLOW BLOCKAGE IN FUEL SUB-
ASSEMBLIES
8.1 INTRODUCTION
The detection of integrity of the subassembly plays a major role in
500 MWe Prototype Fast Breeder Reactor (PFBR), because of high
power density. Core Temperature Monitoring (CTM) is provided for
detection of core anomalies such as plugging of fuel sub-assemblies
and error in core loading. Hence, continuous monitoring of the core
cooling and initiation of safety actions in case of any abnormal
temperature rise of the core are essential. These safety actions prevent
the clad hot spot and fuel temperature from reaching the design limits.
This system is also a diverse system for protecting the reactor against
transient over power and transient under cooling events. It also
facilitates design validations of reactor physics, thermal hydraulics
and burn-up management.
The basic function of the CTM system is to find the coolant
temperature change and initiate safety actions for the following
conditions.
1. Partial plugging in fuel subassemblies
2. Error in core loading
3. Orifice error and error in fuel enrichment
4. Uncontrolled withdrawal of control rods and safety rods
5. Primary pipe rupture
This system is also facilitates the design validations of the reactor
physics, thermal hydraulics and burn up management. Thermocouple

122
provided at the central subassembly is used to detect the pipe rupture
connected to grid plate.
To monitor against the above conditions, following parameters shall
be monitored.
i. Core inlet temperature (θRI)
ii. Central subassembly outlet temperature (θCSA)
iii. Subassembly outlet temperature (θi)
8.2 CORE INLET TEMPERATURE (ΘRI) MONITORING SYSTEM
The Reactor Inlet temperature (θRI) monitoring system is
provided to protect the reactor against the events such as
consequences of one boiler feed pump trip, one secondary sodium
pump trip etc. Hence, a Reactor Inlet Temperature Monitoring (RITM)
system is provided. It shall be a diversified, independent, hardwired
system, compared to the computer based Core Temperature
Monitoring (CTM) system. Reactor inlet temperatures (θRI) are
measured at the suctions of the two primary pumps. Four numbers of
K-type thermocouples are provided for each pump. Out of these, three
are used for continuous monitoring and the fourth one as a hot stand
by. These four thermocouples are mounted in thermo-wells. Their
response time is 6±2 s.

123
The proposed design scheme is shown below.
FIGURE 8.1 BLOCK DIAGRAM OF ΘRI MONITORING SYSTEM In the above design scheme, the temperature values of K-type
thermocople for corresponding millivolt signals (digitized) are stored
in an Erasable Programmable Read Only Memory (EPROM). The
thermocouple is connected to a high resolution Analog to Digital
Converter (ADC) through a signal conditioner. ADC output is used as
address for the EPROM to get the measured temperature. EPROM
output is converted to analog signal by a Digital to Analog Converter
(DAC). This analog voltage is compared with the analog set values for
alarm and trip. The digital counter is provided with buttons to enter the
set value. Similar arrangement is provided for monitoring the outlet
temperature of central subassembly.
8.3 SUBASSEMBLY OUTLET TEMPERATURE (ΘI) MONITORING SYSTEM
Subassembly outlet temperature monitoring system is provided
for detection of core anomalies such as plugging of fuel sub-
TRIP
ALARM ADC EPROM
TRIP COMPARATOR
DAC
ALARM COMPARATOR
TRIP SETPOINT SIGNAL
CONDITIONER
ALARM SETPOINT DDCS DDCS
DDCS

124
assemblies and error in core loading. Hence, continuous monitoring of
the core cooling and initiation of safety actions in case of any
abnormal temperature rise of the core are essential. These safety
actions prevent the clad hot spot and fuel temperature from reaching
the design limits. This system is also a diverse system for protecting
the reactor against transient over power and transient under cooling
events.
For subassembly outlet temperature measurement, two
thermocouples, each are provided in thermo well for 210 subassembly
outlet temperature measurement. These thermocouples shall be
processed by Real Time Computers (RTC).
Real time computer (RTC) based signal processing system with
triple modular redundancy (TMR) shall be employed to measure the
sub-assembly outlet temperatures and reactor core inlet temperature
signals. Each RTC of the CTM system shall independently scan 211
fuel sub-assembly outlet temperature signals and reactor core inlet
temperature signals each second and shall calculate mean core outlet
temperature, mean core temperature gradient, perform plugging
detection and generate necessary indications, Alarm and SCRAM
outputs. It has to calculate Mean core outlet temperature (θM), Mean
temperature rise across the core (ΔθM), temperature rise across central
subassembly (ΔθCSA) and plugging detection (check for deviation in
individual sub-assembly outlet temperature against the expected value
(δθI)). It checks against the Alarm thresholds of θM, ΔθM, ΔθCSA & δθI
and SCRAM thresholds of ΔθM, ΔθCSA & δθI to generate Alarm &
SCRAM signals respectively when the computed values crosses the
thresholds. The architecture of the system is shown below.

125
FIGURE 8.2 ARCHITECTURE OF RTC BASED CTM SYSTEM
The major function of the CTM system is to detect the plugging of
fuel sub-assemblies, so that the clad hot-spot temperature is not
attained, thus preventing clad rupture. The scan cycle for the system,
i.e., the interval between consecutive scans of the input signals shall
be 1 second.
Thus in order to ensure safe operation of the reactor, in every scan
cycle, the fuel subassembly outlet and reactor inlet temperatures shall
be scanned by each of the RTC and Alarm & SCRAM outputs shall be
generated by performing the calculations described in the following
sections
TC : Thermo couple SCM : Signal Conditioner Module PCSL : Pulse Coded Safety Logic CSRDM : Control & Safety Rod Drive
Mechanism

126
REACTOR CORE INLET TEMPERATURE (ΘRI)
Reactor core inlet temperatures are measured at the suction side of two
primary pumps. Each RTC system is provided with a thermocouple
signal from each pump. The following conditions shall be checked.
• θRI1 > 371K (where θRI1 is the Reactor Core inlet Temperature of
pump-1 and 371K is the melting point of sodium), and the sensor not
open.
• θRI2 > 371K (where θRI2 is the Reactor Core inlet Temperature of
pump-2 and 371K is the melting point of sodium), and the sensor not
open.
The reactor core inlet temperature shall be derived as follows for
further processing
θRI = minimum (θRI1, θRI2) if both the signals satisfy above condition
θRI = valid (θRI1, θRI2) if only one of the signals satisfy above condition
ALARMS AND SCRAMS
• If |θRI1 - θRI2| > 5K, group alarm shall be generated in CR.
• If both the signals (θRI1 and θRI2) do not satisfy condition (1), ΔθM
SCRAM alarm & ΔθCSA SCRAM alarm shall be generated and ΔθM
SCRAM & ΔθCSA SCRAM shall also be generated.
FUEL SUB-ASSEMBLY OUTLET TEMPERATURE (θi)
For fuel subassembly outlet temperature (including central sub-
assembly) measurement, two independent K-type thermocouples (A &
B) are provided and these signals shall be processed by the three RTC
systems.
Since each subassembly outlet temperature (θI) is measured by two
thermocouples (A & B), the following conditions shall be checked.
127
• θIA > (θRI + 5K) where I ranges from 0 to 210 and sensor not open
• θIB > (θRI + 5K) where I ranges from 0 to 210 and sensor not open
If above condition is satisfied, the temperature reading is
considered as valid. If any sub-assembly outlet temperature (either θIA
or θIB) does not satisfy above condition, it shall be treated as faulty
and shall not be used for mean core outlet temperature calculation.
Further for plugging detection calculation, this faulty thermocouple
shall be treated as if it has crossed the SCRAM threshold. If the
difference between the two temperature readings of the same sub-
assembly is greater than 5K, the lower temperature reading shall be
treated as if it has crossed SCRAM threshold for plugging detection
calculation. Also, the lower temperature reading shall be declared
invalid and shall not be included in the mean core outlet temperature
(θM) calculation. ALARMS AND SCRAMS
• Group alarm shall be generated in CR for the following conditions:
Any temperature reading θIA or θIB is invalid for any I
|θIA - θIB| > 5K for any I
• If both the temperature readings of the same subassembly (θIA and
θIB) do not satisfy condition (3), δθI SCRAM alarm shall be generated
and δθI SCRAM shall be ordered.
TEMPERATURE DIFFERENCE ACROSS CENTRAL SUBASSEMBLY (ΔθCSA)
The temperature at the central subassembly outlet, θCSA, shall be first
calculated as follows.
• If |θ0A – θ0B| < 5K, then θCSA = average (θ0A,θ0B)
• If |θ0A – θ0B| > 5K, then θCSA = greater (θ0A, θ0B)

128
• If one of θ0A and θ0B is invalid, then θCSA = valid (θ0A, θ0B)
Then the temperature difference across central subassembly (ΔθCSA)
shall be calculated as:
• ΔθCSA = θCSA – θRI
Where θRI = Reactor inlet temperature ALARMS AND SCRAMS
• ΔθCSA alarm shall be generated when the ΔθCSA value crosses the
alarm threshold.
• ΔθCSA SCRAM alarm shall be generated and ΔθCSA SCRAM shall
also be generated when the ΔθCSA crosses the SCRAM threshold.
• If both θ0A and θ0B are invalid, ΔθCSA SCRAM alarm shall be
generated and ΔθCSA SCRAM shall also be generated.
8.4.2 Mean Core Outlet Temperature (θM)
Mean core outlet temperature (θM) shall be calculated as follows:
θM = ((θ0A+ θ1A+…+θ(NA -1)) + (θ0B+ θ1B+…+θ(NB -1))) / (NA +NB)
Where NA, NB are the number of valid fuel subassembly outlet
temperature readings of A & B group thermocouples respectively.
The value of θM shall be displayed on an indicator in CR and shall also
be recorded by a recorder. ALARMS AND SCRAMS
• θM Alarm shall be generated in CR when the value of θM exceeds the
respective alarm threshold.
8.4.3 Mean Temperature Rise across the Core (ΔθM)
Mean temperature rise across the core shall be calculated as follows:
• ΔθM = θM - θRI
where θM = Mean core outlet temperature and θRI = Reactor inlet
temperature calculated .

129
ALARMS AND SCRAMS
• Alarm shall be generated in Control Room when the value of ΔθM
exceeds the respective alarm threshold.
• ΔθM SCRAM Alarm shall be generated and ΔθM SCRAM shall also
be generated when the value of ΔθM exceeds the respective SCRAM
threshold. PLUGGING DETECTION (DEVIATION IN INDIVIDUAL SODIUM OUTLET
TEMPERATURE OVER EXPECTED VALUE (δθI))
Plugging detection shall be carried out only when “Power > 5%” input
is active If plugging detection is ON, the output contact “Plugging
Detection ON” shall be made active. This contact shall be inactive if
plugging detection is not being carried out.
The deviation in individual sub assembly sodium outlet temperature
over expected value
(Plugging detection) shall be calculated using below equation .
• δθIA = θIA – ((ai * ΔθM) + θRI)
• δθIB = θIB – ((ai * ΔθM)+ θRI)
where θIA is the temperature reading of ith sub assembly monitored by
A group thermocouple, θIB is the temperature reading of Ith sub
assembly monitored by B group thermocouple, and aI is the ratio of
temperature rise of an individual subassembly to mean temperature
rise across the core. The value of aI is unique for each sub assembly.
Initially for the fresh core, the values supplied by the O&M personnel
shall be used. aI values can be calculated and modified.

130
ALARMS AND SCRAMS
• If δθIA or δθIB of the same sub assembly exceed the respective alarm
threshold, δθI Alarm shall be generated in CR.
• If δθIA and δθIB of the same sub assembly exceed the respective
SCRAM threshold, δθI SCRAM alarm and δθI SCRAM shall be
generated.
For δθI signal, the Alarm threshold is |5| K, and the SCRAM threshold
is +10 K. But provision for threshold modification shall be provided
under administrative control. GROUP ALARMS FOR OTHER CONDITIONS
• Group alarm shall be generated in CR if there is any fault detected in
any of the cards in the system
8.4.5 Calculation and Modification of ai values
Each RTC shall provide facility to calculate ai values on demand by
operator. aI values shall be calculated as per below equation .
• ai = (θI - θRI) / ΔθM
These values shall be checked following each fuel handling campaign
and before reactor startup. θI used in the equation is calculated as
below.
• If the difference between θIA and θIB is less than 5K, then θI =
average (θIA, θIB)
• If the difference between θIA and θIB is greater than 5K, then θI =
greater (θIA, θIB)
• If one of θIA and θIB is invalid, then θI = valid (θIA, θIB)

131
If both θIA and θIB are invalid for any subassembly, aI need not be
calculated for that subassembly, and suitable message shall be
displayed to operator.
There shall be provision to update aI values for any sub assembly or
group of sub assemblies under administrative control with the system
in configuration mode and with password authentication. The
changing of aI values shall be inhibited when the difference between
the central sub assembly temperature and reactor core inlet
temperature values exceed a particular value, which shall be
configurable.
The power density of Fast Breeder Reactor is very high
(500KW/l), which is ten times more than Pressurized Heavy Water
Reactor. Hence for effective heat removal, liquid sodium is used as
coolant. The temperature at the outlet of fuel subassembly is
monitored by triplicated embedded systems. To have uniform
temperature distribution at the outlet of fuel sub-assemblies, flow
zoning is deployed. Flow through the central sub-assemblies is higher
than outer subassemblies. From point kinetic neutronic calculation,
overall power of the reactor is calculated. Temperature distribution is
calculated by flow and power fraction in each subassembly as per the
following table.

132
TABLE 8.1 SA WISE FLOW & POWER FACTIONS
Sl.No Ring No. SA No.
Flow - kg/s FF
Power -MW PF Ai
1 0,0 36.00 0.0067 7.76 0.0071 1.06282 1 1,1 36.00 0.0067 7.61 0.007 1.04223 1 1,2 36.00 0.0067 7.94 0.0073 1.08744 1 1,3 36.00 0.0067 7.37 0.0068 1.00935 1 1,4 36.00 0.0067 7.64 0.007 1.04636 1 1,5 36.00 0.0067 7.94 0.0073 1.08747 1 1,6 36.00 0.0067 7.40 0.0068 1.01358 2 2,1 36.00 0.0067 6.94 0.0064 0.95059 2 2,2 36.00 0.0067 7.14 0.0066 0.977810 2 2,3 36.00 0.0067 7.10 0.0065 0.972411 2 2,4 36.00 0.0067 7.15 0.0066 0.979212 2 2,5 36.00 0.0067 7.20 0.0066 0.986113 2 2,6 36.00 0.0067 7.70 0.0071 1.054514 2 2,7 36.00 0.0067 7.12 0.0065 0.975115 2 2,8 36.00 0.0067 7.16 0.0066 0.980616 2 2,9 36.00 0.0067 6.96 0.0064 0.953217 2 2,10 36.00 0.0067 7.41 0.0068 1.014818 2 2,11 36.00 0.0067 7.14 0.0066 0.977819 2 2,12 36.00 0.0067 7.69 0.0071 1.053220 3 3,2 36.00 0.0067 7.23 0.0066 0.990221 3 3,3 36.00 0.0067 7.11 0.0065 0.973722 3 3,5 36.00 0.0067 7.12 0.0065 0.975123 3 3,6 36.00 0.0067 7.26 0.0067 0.994324 3 3,8 36.00 0.0067 6.73 0.0062 0.921725 3 3,9 36.00 0.0067 7.12 0.0065 0.975126 3 3,11 36.00 0.0067 7.41 0.0068 1.014827 3 3,12 36.00 0.0067 7.24 0.0066 0.991528 3 3,14 36.00 0.0067 6.96 0.0064 0.953229 3 3,15 36.00 0.0067 7.44 0.0068 1.018930 3 3,17 36.00 0.0067 7.13 0.0065 0.976531 3 3,18 36.00 0.0067 6.72 0.0062 0.920332 4 4,1 31.40 0.0058 6.61 0.0061 1.037933 4 4,2 31.40 0.0058 6.54 0.006 1.026934 4 4,3 31.40 0.0058 6.96 0.0064 1.092835 4 4,4 31.40 0.0058 6.76 0.0062 1.061436 4 4,5 31.40 0.0058 6.42 0.0059 1.00837 4 4,6 31.40 0.0058 6.55 0.006 1.028538 4 4,7 31.40 0.0058 6.99 0.0064 1.097539 4 4,8 31.40 0.0058 6.59 0.006 1.0347

133
40 4 4,9 31.40 0.0058 6.62 0.0061 1.039541 4 4,10 31.40 0.0058 6.53 0.006 1.025342 4 4,11 31.40 0.0058 6.94 0.0064 1.089743 4 4,12 31.40 0.0058 6.54 0.006 1.026944 4 4,13 31.40 0.0058 6.88 0.0063 1.080345 4 4,14 31.40 0.0058 6.76 0.0062 1.061446 4 4,15 31.40 0.0058 6.47 0.0059 1.015947 4 4,16 31.40 0.0058 6.76 0.0062 1.061448 4 4,17 31.40 0.0058 6.31 0.0058 0.990849 4 4,18 31.40 0.0058 6.31 0.0058 0.990850 4 4,19 31.40 0.0058 6.97 0.0064 1.094451 4 4,20 31.40 0.0058 6.59 0.006 1.034752 4 4,21 31.40 0.0058 6.93 0.0064 1.088153 4 4,22 31.40 0.0058 7.06 0.0065 1.108554 4 4,23 31.40 0.0058 6.49 0.006 1.01955 4 4,24 31.40 0.0058 6.54 0.006 1.026956 5 5,1 28.80 0.0054 5.84 0.0054 0.999857 5 5,2 28.80 0.0054 5.88 0.0054 1.006658 5 5,3 28.80 0.0054 6.11 0.0056 1.04659 5 5,4 28.80 0.0054 6.00 0.0055 1.027260 5 5,5 28.80 0.0054 6.48 0.0059 1.109361 5 5,6 28.80 0.0054 6.00 0.0055 1.027262 5 5,7 28.80 0.0054 6.45 0.0059 1.104263 5 5,8 28.80 0.0054 6.21 0.0057 1.063164 5 5,9 28.80 0.0054 6.41 0.0059 1.097365 5 5,10 28.80 0.0054 5.95 0.0055 1.018666 5 5,11 28.80 0.0054 5.84 0.0054 0.999867 5 5,12 28.80 0.0054 5.88 0.0054 1.006668 5 5,13 28.80 0.0054 5.92 0.0054 1.013569 5 5,14 28.80 0.0054 6.40 0.0059 1.095670 5 5,15 28.80 0.0054 6.21 0.0057 1.063171 5 5,16 28.80 0.0054 5.93 0.0054 1.015272 5 5,17 28.80 0.0054 6.18 0.0057 1.05873 5 5,18 28.80 0.0054 6.37 0.0058 1.090574 5 5,19 28.80 0.0054 6.09 0.0056 1.042675 5 5,20 28.80 0.0054 5.85 0.0054 1.001576 5 5,21 28.80 0.0054 5.74 0.0053 0.982677 5 5,22 28.80 0.0054 6.23 0.0057 1.066578 5 5,23 28.80 0.0054 6.10 0.0056 1.044379 5 5,24 28.80 0.0054 6.43 0.0059 1.100880 5 5,25 28.80 0.0054 6.26 0.0057 1.071781 5 5,26 28.80 0.0054 5.99 0.0055 1.0254
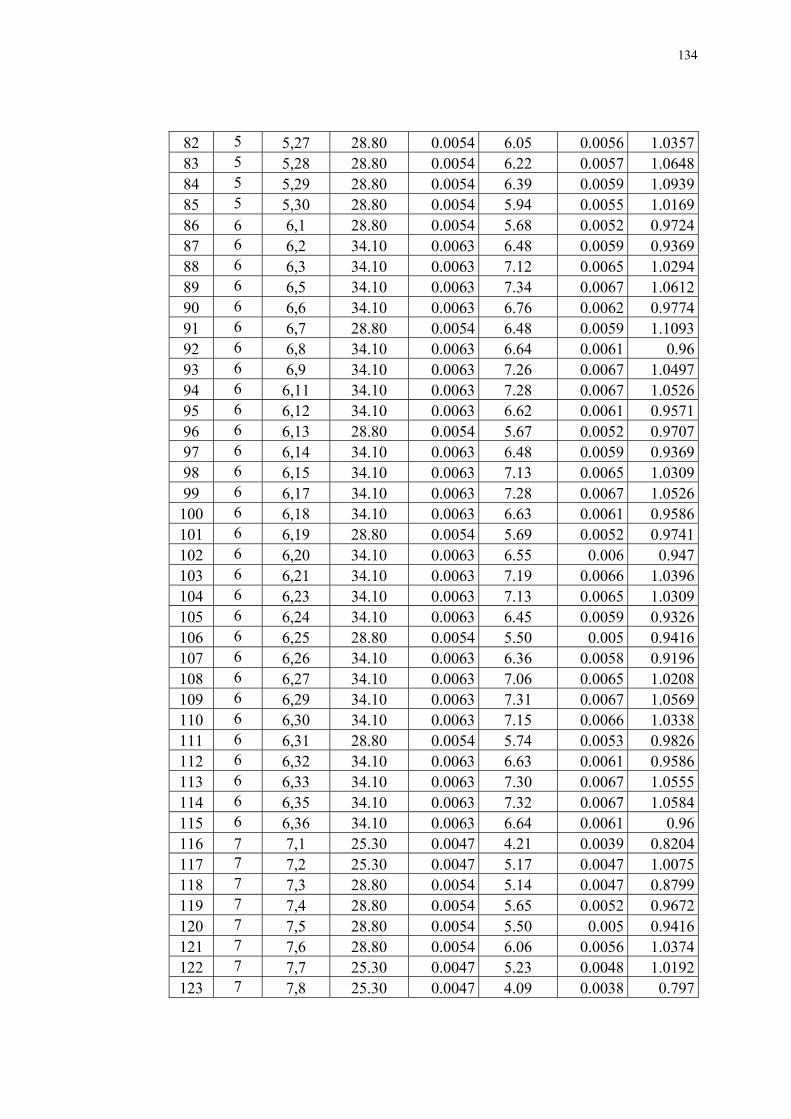
134
82 5 5,27 28.80 0.0054 6.05 0.0056 1.035783 5 5,28 28.80 0.0054 6.22 0.0057 1.064884 5 5,29 28.80 0.0054 6.39 0.0059 1.093985 5 5,30 28.80 0.0054 5.94 0.0055 1.016986 6 6,1 28.80 0.0054 5.68 0.0052 0.972487 6 6,2 34.10 0.0063 6.48 0.0059 0.936988 6 6,3 34.10 0.0063 7.12 0.0065 1.029489 6 6,5 34.10 0.0063 7.34 0.0067 1.061290 6 6,6 34.10 0.0063 6.76 0.0062 0.977491 6 6,7 28.80 0.0054 6.48 0.0059 1.109392 6 6,8 34.10 0.0063 6.64 0.0061 0.9693 6 6,9 34.10 0.0063 7.26 0.0067 1.049794 6 6,11 34.10 0.0063 7.28 0.0067 1.052695 6 6,12 34.10 0.0063 6.62 0.0061 0.957196 6 6,13 28.80 0.0054 5.67 0.0052 0.970797 6 6,14 34.10 0.0063 6.48 0.0059 0.936998 6 6,15 34.10 0.0063 7.13 0.0065 1.030999 6 6,17 34.10 0.0063 7.28 0.0067 1.0526100 6 6,18 34.10 0.0063 6.63 0.0061 0.9586101 6 6,19 28.80 0.0054 5.69 0.0052 0.9741102 6 6,20 34.10 0.0063 6.55 0.006 0.947103 6 6,21 34.10 0.0063 7.19 0.0066 1.0396104 6 6,23 34.10 0.0063 7.13 0.0065 1.0309105 6 6,24 34.10 0.0063 6.45 0.0059 0.9326106 6 6,25 28.80 0.0054 5.50 0.005 0.9416107 6 6,26 34.10 0.0063 6.36 0.0058 0.9196108 6 6,27 34.10 0.0063 7.06 0.0065 1.0208109 6 6,29 34.10 0.0063 7.31 0.0067 1.0569110 6 6,30 34.10 0.0063 7.15 0.0066 1.0338111 6 6,31 28.80 0.0054 5.74 0.0053 0.9826112 6 6,32 34.10 0.0063 6.63 0.0061 0.9586113 6 6,33 34.10 0.0063 7.30 0.0067 1.0555114 6 6,35 34.10 0.0063 7.32 0.0067 1.0584115 6 6,36 34.10 0.0063 6.64 0.0061 0.96116 7 7,1 25.30 0.0047 4.21 0.0039 0.8204117 7 7,2 25.30 0.0047 5.17 0.0047 1.0075118 7 7,3 28.80 0.0054 5.14 0.0047 0.8799119 7 7,4 28.80 0.0054 5.65 0.0052 0.9672120 7 7,5 28.80 0.0054 5.50 0.005 0.9416121 7 7,6 28.80 0.0054 6.06 0.0056 1.0374122 7 7,7 25.30 0.0047 5.23 0.0048 1.0192123 7 7,8 25.30 0.0047 4.09 0.0038 0.797

135
124 7 7,9 25.30 0.0047 4.78 0.0044 0.9315125 7 7,10 28.80 0.0054 5.49 0.005 0.9398126 7 7,11 28.80 0.0054 5.43 0.005 0.9296127 7 7,12 28.80 0.0054 5.81 0.0053 0.9946128 7 7,13 28.80 0.0054 5.41 0.005 0.9261129 7 7,14 25.30 0.0047 5.40 0.005 1.0523130 7 7,15 25.30 0.0047 4.03 0.0037 0.7853131 7 7,16 25.30 0.0047 5.17 0.0047 1.0075132 7 7,17 28.80 0.0054 5.16 0.0047 0.8833133 7 7,18 28.80 0.0054 6.00 0.0055 1.0272134 7 7,19 28.80 0.0054 5.76 0.0053 0.9861135 7 7,20 28.80 0.0054 5.36 0.0049 0.9176136 7 7,21 25.30 0.0047 4.88 0.0045 0.951137 7 7,22 25.30 0.0047 4.37 0.004 0.8516138 7 7,23 25.30 0.0047 5.20 0.0048 1.0133139 7 7,24 28.80 0.0054 5.18 0.0048 0.8868140 7 7,25 28.80 0.0054 5.97 0.0055 1.022141 7 7,26 28.80 0.0054 5.40 0.005 0.9244142 7 7,27 28.80 0.0054 5.52 0.0051 0.945143 7 7,28 25.30 0.0047 4.75 0.0044 0.9257144 7 7,29 25.30 0.0047 4.03 0.0037 0.7853145 7 7,30 25.30 0.0047 4.55 0.0042 0.8867146 7 7,31 28.80 0.0054 5.04 0.0046 0.8628147 7 7,32 28.80 0.0054 5.59 0.0051 0.957148 7 7,33 28.80 0.0054 5.44 0.005 0.9313149 7 7,34 28.80 0.0054 5.66 0.0052 0.9689150 7 7,35 25.30 0.0047 4.92 0.0045 0.9588151 7 7,36 25.30 0.0047 4.19 0.0038 0.8165152 7 7,37 25.30 0.0047 4.77 0.0044 0.9296153 7 7,38 28.80 0.0054 5.86 0.0054 1.0032154 7 7,39 28.80 0.0054 5.82 0.0053 0.9963155 7 7,40 28.80 0.0054 6.21 0.0057 1.0631156 7 7,41 28.80 0.0054 5.45 0.005 0.933157 7 7,42 25.30 0.0047 5.43 0.005 1.0582158 8 8,4 20.80 0.0039 4.04 0.0037 0.9576159 8 8,5 20.80 0.0039 4.14 0.0038 0.9813160 8 8,6 20.80 0.0039 4.52 0.0041 1.0714161 8 8,7 20.80 0.0039 3.86 0.0035 0.915162 8 8,12 20.80 0.0039 3.94 0.0036 0.9339163 8 8,13 20.80 0.0039 4.55 0.0042 1.0785164 8 8,14 20.80 0.0039 4.54 0.0042 1.0761165 8 8,15 20.80 0.0039 4.14 0.0038 0.9813

136
166 8 8,20 20.80 0.0039 4.07 0.0037 0.9647167 8 8,21 20.80 0.0039 4.31 0.004 1.0216168 8 8,22 20.80 0.0039 4.11 0.0038 0.9742169 8 8,23 20.80 0.0039 4.07 0.0037 0.9647170 8 8,28 20.80 0.0039 4.05 0.0037 0.96171 8 8,29 20.80 0.0039 4.09 0.0038 0.9695172 8 8,30 20.80 0.0039 4.21 0.0039 0.9979173 8 8,31 20.80 0.0039 3.98 0.0037 0.9434174 8 8,36 20.80 0.0039 3.82 0.0035 0.9055175 8 8,37 20.80 0.0039 4.42 0.0041 1.0477176 8 8,38 20.80 0.0039 4.10 0.0038 0.9718177 8 8,39 20.80 0.0039 3.92 0.0036 0.9292178 8 8,44 20.80 0.0039 4.17 0.0038 0.9884179 8 8,45 20.80 0.0039 4.63 0.0043 1.0975180 8 8,46 20.80 0.0039 4.21 0.0039 0.9979181 8 8,47 20.80 0.0039 4.15 0.0038 0.9837
5370.60 1 1089.30 1 180.66 FF- flow fraction = Fi/ ∑ (Fi) for i = 1 to 181
PF – Power fraction = Pi / ∑ (Pi) for i = 1 to 181
Ai = PF/FF
Typical temperature distribution is modeled and shown below.

137

138
8.3 FLOW CHART FOR MODELING OF CORE TEMPERATURE SUPERVISION
Read the position of control rod from the console, flow of sodium in the reactor (F) &
Reactor Inlet temp Tinlet
Calculate the reactivity added
Solve point kinetic equation and calculate reactor Power (P)
Calculate temperature rise in each fuel sub-assembly
ΔTi = ((Power fraction) * P) / ((Flow fraction) * F)
Calculate individual outlet temp Toi
Toi = ΔTi + Tinlet
Calculate average outlet temperature
ToA = ΣToi / N Where N = Number of Thermocouples
Calculate average temperature rise
ΔTA = ToA - Tinlet
START

139
Yes
Calculate expected temperature rise in each sub-assembly
ΔTEi = ΔTA - Ai constant
Calculate error behavior expected temperature rise and actual temperature for
each sub-assembly ΔTAi = ΔToi - Tinlet
Calculate error (e) behavior expected temperature rise and actual temperature rise
Error > 5
energies alarm in control
room
Error > 10
energies Trip order to plant
Yes
No
No
Go Back to START

140
The instructor will introduce the flow reduction in selected
subassemblies. The temperature at the outlet of affected subassembly
will be calculated from the modified flow through the subassembly.
The actual temperature raise will exceed the normally expected
temperature raise in the affected subassembly. The reactor will be
tripped by core temperature monitoring system. If any two of the
triplicated embedded systems also becomes faulty, reactor will be
tripped. Relevant alarms are energized and messages are displayed for
training the operator. Typical instructor panel for introducing fault in
core temperature distribution is shown below.

141
Next Instructor selects the desired ring as his menu:
Next Instructor selects the desired subassembly for introducing fault:

142
Next the Instructor introduces the fault (flow reduction).
Next Instructor enables the fault.

143
Now at the selected subassembly, even for 10% flow blockage, the
temperature raised beyond both alarm and scram limit. The following
messages are displayed.
Thus various degrees of flow reduction are modeled at each and every
subassembly and operator is provided with comprehensive training.

141
CHAPTER 9
CONCLUSION AND DIRECTIONS
The reactors in the world are protected by automatic shutdown
systems which become effective upon irregularities in plant operating
conditions. In addition to the provision of fully automated protection,
it is considered necessary to train operators to recognise potential plant
problems. This is because 70 percent of nuclear incidents till date
have resulted from human error. It is thus essential and imperative that
operators' training is the key to the success of reliable and safe
operation of a nuclear power plant. This can best be achieved through
detailed training to operators using Full Scope Training Simulators.
All major faults such as tripping of coolant pumps, off site power
failure, station blackout etc are modelled in the computer and also
provisions are made for logging the response of operator for appraisal.
India has embarked on a three stage nuclear power program.
Pressurized Heavy Water Reactors form the first stage which is mature
and self reliant. The second stage of the nuclear program consists of
the fast breeder reactors. The successful operation of the Fast Breeder
Test Reactor for the last 23 years has paved the way for construction
of a 500 MWe Prototype Fast Breeder reactor (PFBR) at Kalpakkam.
The success of FBTR can be attributed to the robust design and
manufacturing practices, excellence in quality and overall, efficient
personnel qualification through systematic training and reliable
predictive condition management practices. Great emphasis has been
placed on operator training and licensing of plant operators. This
successful training has been possible because of the availability of full

142
scope training simulator. This thesis dwells on the experiences and
knowledge gained in the operation of the Fast Breeder Test Reactor
and how this has been fruitfully integrated in the development of such
a simulator for PFBR. It should be highlighted here that while the
training simulators used by the Nuclear Power Corporation Ltd
primarily simulate the failure of mechanical and electrical equipments,
the full scope simulator of PFBR incorporates detailed modeling of
instrumentation and control also. This thesis is an encapsulated
knowledge bank of the design and developmental aspects that have
been undertaken in the integration of such a simulator and this has
been outlined in 7 chapters.
As mentioned earlier, a unique feature of this simulator is the
incorporation of instrumentation and control system. Normal as well
as abnormal behaviour of entire Instrumentation and Control system
has been modelled.
An additional and innovative feature in this simulator is the
addition of knowledge management capsule. Minor and major
incidences that have occurred in the 23 year operation of the fast
breeder test reactor have been added with a detailed cause analysis.
An example of this is the incidence of inadvertent withdrawal of
control rod that had taken place in Fast Breeder Test Reactor. This
incident has been modelled in detail at all the power ranges of the
reactor. The output from pulse channels, Campbell channels and ex-
core pulse channels are also modelled and the safety actions and
warning messages are explained in detail.

143
While 80 distributed embedded systems will supervise and control
the Nuclear reactor, information overloading needs to be avoided. This
thesis also provides a clear methodology for displaying the
information to the plant operator in an unambiguous manner.
Thus overall, a comprehensive and complete training can be
provided to plant operator by this full scope simulator, thereby making
it possible to avoid/mimimise human errors while operating the
Nuclear Reactor.
It should be highlighted here that at present only American
National standard (ANSI/ANS-3.5-1998) is available as guideline for
designing Full scope Training simulator. This is specific to the United
States and takes into account largely the BWR and PWR cultures.
Each country thus needs a simulator generic to its nuclear program.
This thesis would be forming the basis of the Indian National
Standard for Design of Full Scope Training Simulator for Nuclear
Power Plant.
DIRECTIONS
With nuclear energy becoming an inevitable option for the energy
security of the world, the use of full scope simulators in the training of
operators has become an essential element to reduce operator error.
The value of the training received and its effectiveness critically
dependent on the ability of the simulator to closely represent the actual
conditions and environment that would be experienced in a real
accident. Thus simulators need to be upgraded periodically based on

144
the feedback and experiences and also developments in the field of
electronics, instrumentation and automation. Some of the possible
areas of future research thus include
Training Simulator can be used to develop optimum
information management system in the control room. The
information overloading can be taken as research problem. The
messages can be segregated system wise and also within each
system priority wise. While messages need to be displayed as
per the time of generation, the weightage to be given for
importance of message (priority) need to be researched.
Different schemes need to be developed and optimum scheme
need to be developed in consultation with control room
operator.
With the advancement of Information Technology, 3-D
animated graphic user interface system can be introduced for
providing clarity of information. Alarm messages can be
strengthened with multimedia `help` feature.
Modeling tools for Instrumentation and Control system need to
be developed in open hardware platform.
Net Outcome of Research By detailed modeling the Instrumentation and Control system, the
plant operator will be provided comprehensive training in
Simulator. This will increase the confidence level of the operator,
thus enhancing the safety of Prototype Fast Breeder Reactor.

145
REFERENCES
1) Dr Baldev Raj, Reactor Physics and safety aspects of Fast
Neutron Reactors with Associated closed Fuel Cycle (www.igcar.gov.in)
2) R. Webster, Free-convection cooling of blocked fuel
subassemblies In pool-type metal fast reactor, Nucl.Energy, (Vol.20, No. 6, pp 481-493)
3) Proceedings of IAEA Technical meeting on “Lessons Learned from Operational Experience with Fast reactor Equipments and Systems” held at Russia (24-28,Jan2005). 4) S.C.Chetal,P.Chellapandi and Baldev Raj,`Lessons learned from sodium cooled fast reactor operation and their ramifications for
future reactors with respect to enhanced safety and reliability` Nuclear Technology, (volume 164,November 2) 5) International Atomic Energy Agency technical document-995
on Selection, Specification, Design and use of Various Nuclear Power Plant training simulators` issued on (Jan, 1998).
6) P. Swaminathan and P. Srinivasan, `Computer Based Core
Monitoring System` OECD Specialists` Meeting on In-core Instrumentation and reactor Core Assessment, Japan (Oct, 14-17,1996)
7) K. Vinolia, P. Swaminathan, `Simulation and modeling of Core
temperature Distribution of FBTR during LOR ,`Proceedings of National Symposium on Advances in Computer Applications and Instrumentation` held at IGCAR (Jan 4-6, 1995)
8) P. Swaminathan, `Design of Full Scope Replica Type training
Simulator for PFBR` Invited talk. Proceedings of National Symposium on Advances in Control & Instrumentation held at BARC (Feb 21-23, 2005)
9) Uma Seshadri, P. Swaminathan….`Instrumentation for
Supervision of Core cooling in FBTR and PFBR` Proceedings of

146
IAEA Specialists` Meeting on Instrumentation for FBR` held at IGCAR (Dec 12-15, 1989)
10) P. Swaminathan `Role of Embedded Systems in Nuclear
Reactor`Key note address in Seminar on embedded systems held at Chennai (July21,2001), Instrument Society of India.
13) P. Swaminathan ,` Computer based on-line monitoring system
for Fast Breeder Test Reactor, India`, IAEA Technical meeting in `Increasing Instrument calibration through on-line monitoring Technologies` (Sep 27-29, 2004) at Halden, Norway. 14) IEC 880, 1986,` Software for computers in the safety Systems of
Nuclear Power Stations`. 15) Atomic Energy Regulatory Board Safety Guide on Safety critical systems (AERB/SG/D-10) 16) `Hardware for computers in the safety systems of Nuclear and
Radiation facilities`, (IS 15399:2003) 17) `Software for computers in the safety systems of Nuclear and
Radiation facilities`, (IS 15398:2003) 18) `Application of computers to Nuclear Reactor Instrumentation
and Control`, (IS 12772:2003) 19) ANSI/ANS-3.5-1996 American National Standard for Nuclear Power Plant Simulators for use in Operator training and
Examination issued by American Nuclear Society.

147
LIST OF PUBLICATIONS 1. P.Swaminathan,”Design aspects of safety critical
instrumentation of Nuclear installations’, International journal of Nuclear energy Science and Technology (Vol.1,nos.2/3, pp254-263)
2. T.Sridevi, P.Swaminathan, `Static analyzer for computer based
safety systems`, Journal of the Instrument Society of India` (37(1) pp40-48)
3. R Anusooya, P.Swaminathan, `Information Security Auditing`,
Journal of Computer Society of India (August 2007 pp29-33) 4. P.Swaminathan, `Modeling the Instrumentation and control
systems of Fast Breeder Nuclear Reactor`, International journal on Intelligent Electronic Systems (November 2007, vol.1, pp 1-9)
5. D.Thirugnanamurthy, P.Swaminathan, `Verification and Validation
for safety Critical Real Time Computers`, International Journal on Intelligent Instrumentation (November 2007,Volume 1,pp 15-22)
6. M.K.Patankar, P.Swaminathan, `Intelligent Control System for
Plugging Indicator`, International Journal on Intelligent Instrumentation (November 2007, Volume 1, pp79-85)
7. T.Jayanthi, P.Swaminathan, `Process Simulation of Nuclear
Power Plant Using Latest Techniques`, International Journal on Intelligent Instrumentation (November 2007, Volume 1, pp85-90)
8. N.Satheesh, P.Swaminathan, `Diagnostic Logic for Pulse Coded
safety Logic System`, Proceedings of international Conference on trends in Intelligent Systems, Sathyabama University (November 2007, pp359-362)
9. R.Behera, P.Swaminathan, `Role of Switch Over Logic System
in Fault Tolerant Real –Time System Architecture`, Proceedings of international Conference on trends in Intelligent Systems, Sathyabama University (November 2007, pp388-391)
10. S.Rajeswari, P.Swaminathan, `Simulation of decay heat removal
systems In a Nuclear power plant`, Proceedings of international

148
Conference on trends in Intelligent Systems, Sathyabama University (November 2007, pp357-571)
11. K.K.Kuriakose, P.Swaminathan, `Modeling and Simulation of
Electrical Systems of Nuclear power Plant Training simulator`, Proceedings of international Conference on trends in Intelligent Systems, Sathyabama University (November 2007, pp578-585)
12. M.Manimaran, P.Swaminathan, `Impact of software development
Process on Software quality of Safety Systems`, Proceedings of international Conference on trends in Intelligent Systems, Sathyabama University (November 2007, pp586-591)
13. P. Swaminathan, Invited talk on “Development of Sensor network in Prototype Fast Breeder Reactor” at International conference at Melbourne University on “Broad band Communication and Information technology” during 10-13 July 2006, Organised by ATSE & INAE.
14. Bindu Shankar, P.Swaminathan, `Formal representation of
Knowledge using Z in Fast Breeder Test Reactor`, International journal on Nuclear Knowledge Management. (paper accepted)

149
CURRICULAM VITAE
Shri P.Swaminathan received Honours degree in Electronics
and Communication Engineering in 1971 from Regional Engineering
College, Trichirapalli. He is gold medalist of Madras University. Shri
Swaminathan underwent one year intensive course in Nuclear Science
and Engineering from Baba Atomic Research Center, Mumbai. He
also underwent one year training course in mainframe computer
system from International Honeywell-Bull Training Institute, Paris.
Shri Swaminathan holds Master’s degree in Management science and
is a Fellow of Institution of Engineers.
As outstanding Scientist and Director of Electronics and
Instrumentation group at Indira Gandhi Center for Atomic Research,
Shri Swaminathan developed fault tolerant safety critical real time
computer systems, diverse safety logic systems and Distributed Digital
Control System for supervising and controlling Prototype Fast Breeder
Reactor (PFBR). A full scope Training Simulator is also developed for
imparting comprehensive training to the operators of PFBR.
As Chairman of Sectional Committee, Bureau of Indian
standards, Shri Swaminathan has released Indian Standards for
usage of computers in nuclear facilities. He has over fifty publications
in international journals and conferences. Shri Swaminathan enjoys
interacting with students and is also functioning as Distinguished
Visiting Professor of Indian National Academy of Engineering. Shri
Swaminathan recently received distinguished alumni award for
Excellence in Research from Regional engineering college (NITT),
Trichirapalli.